Gender in niGeria report 2012 - Economic Commission for Africa
Gender in niGeria report 2012 - Economic Commission for Africa
Gender in niGeria report 2012 - Economic Commission for Africa

Create successful ePaper yourself
Turn your PDF publications into a flip-book with our unique Google optimized e-Paper software.
12 <strong>Gender</strong> <strong>in</strong> Nigeria Report <strong>2012</strong>: Improv<strong>in</strong>g the Lives of Girls and Women <strong>in</strong> Nigeria<br />
Table 3. Nigeria Human Development summary, 2008.<br />
Zones<br />
Human<br />
Development<br />
Index Value<br />
Human<br />
Poverty<br />
Index<br />
<strong>Gender</strong><br />
Development<br />
Measure<br />
<strong>Gender</strong><br />
Empowerment<br />
Measure<br />
North-Central 0.490 34.65 0.478 0.244<br />
North-West 0.420 44.15 0.376 0.117<br />
North-East 0.332 48.90 0.250 0.118<br />
South-West 0.523 21.50 0.507 0.285<br />
South-East 0.471 26.07 0.455 0.315<br />
South-South 0.573 26.61 0.575 0.251<br />
Source: UNDP (2011: 5).<br />
3.6 North-South divide <strong>in</strong> life<br />
chances<br />
Table 3 shows that outcomes <strong>in</strong> Southern States compare favourably with<br />
those <strong>in</strong> Northern States, with respect to well-be<strong>in</strong>g and life chances. With elevated<br />
levels of poverty, the North also lags <strong>in</strong> both gender development and empowerment.<br />
These established regional <strong>in</strong>equalities raise questions about the susta<strong>in</strong>ability of an<br />
economic growth model that ma<strong>in</strong>ta<strong>in</strong>s high levels of <strong>in</strong>equality (Araar and Taiwo, 2006).<br />
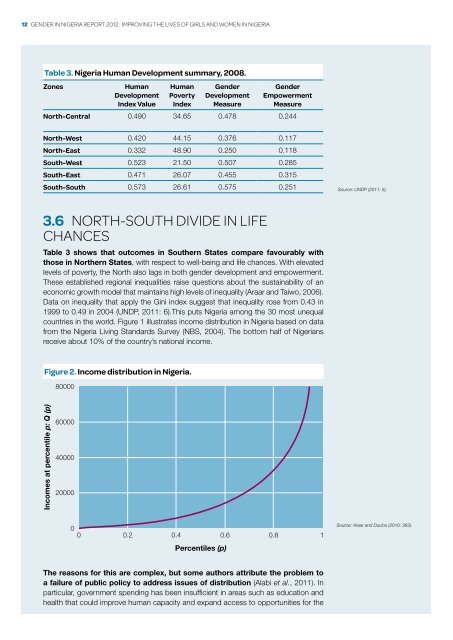
Data on <strong>in</strong>equality that apply the G<strong>in</strong>i <strong>in</strong>dex suggest that <strong>in</strong>equality rose from 0.43 <strong>in</strong><br />
1999 to 0.49 <strong>in</strong> 2004 (UNDP, 2011: 6).This puts Nigeria among the 30 most unequal<br />
countries <strong>in</strong> the world. Figure 1 illustrates <strong>in</strong>come distribution <strong>in</strong> Nigeria based on data<br />
from the Nigeria Liv<strong>in</strong>g Standards Survey (NBS, 2004). The bottom half of Nigerians<br />
receive about 10% of the country’s national <strong>in</strong>come.<br />
Figure 2. Income distribution <strong>in</strong> Nigeria.<br />
80000<br />
Incomes at percentile p: Q (p)<br />
60000<br />
40000<br />
20000<br />
0<br />
0 0.2 0.4 0.6 0.8 1<br />
Source: Araar and Duclos (2010: 363).<br />
Percentiles (p)<br />
The reasons <strong>for</strong> this are complex, but some authors attribute the problem to<br />
a failure of public policy to address issues of distribution (Alabi et al., 2011). In<br />
particular, government spend<strong>in</strong>g has been <strong>in</strong>sufficient <strong>in</strong> areas such as education and<br />
health that could improve human capacity and expand access to opportunities <strong>for</strong> the