Comparative day/night metatranscriptomic analysis of microbial ...
Comparative day/night metatranscriptomic analysis of microbial ...
Comparative day/night metatranscriptomic analysis of microbial ...

Create successful ePaper yourself
Turn your PDF publications into a flip-book with our unique Google optimized e-Paper software.
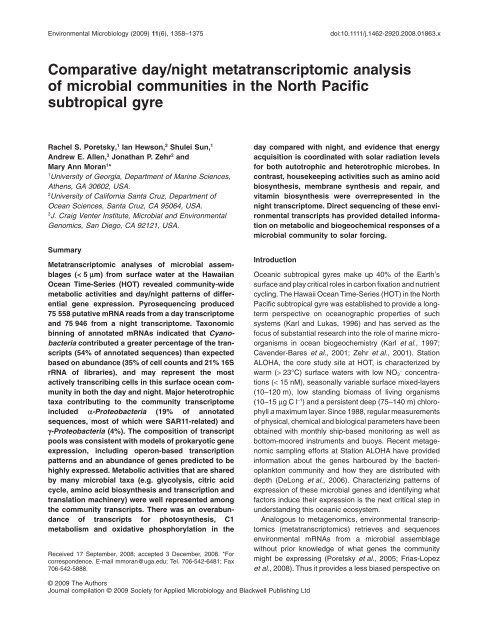
Environmental Microbiology (2009) 11(6), 1358–1375 doi:10.1111/j.1462-2920.2008.01863.x<br />
<strong>Comparative</strong> <strong>day</strong>/<strong>night</strong> <strong>metatranscriptomic</strong> <strong>analysis</strong><br />
<strong>of</strong> <strong>microbial</strong> communities in the North Pacific<br />
subtropical gyreemi_1863 1358..1375<br />
Rachel S. Poretsky, 1 Ian Hewson, 2 Shulei Sun, 1<br />
Andrew E. Allen, 3 Jonathan P. Zehr2 and<br />
Mary Ann Moran1 *<br />
1University <strong>of</strong> Georgia, Department <strong>of</strong> Marine Sciences,<br />
Athens, GA 30602, USA.<br />
2University <strong>of</strong> California Santa Cruz, Department <strong>of</strong><br />
Ocean Sciences, Santa Cruz, CA 95064, USA.<br />
3J. Craig Venter Institute, Microbial and Environmental<br />
Genomics, San Diego, CA 92121, USA.<br />
Summary<br />
Metatranscriptomic analyses <strong>of</strong> <strong>microbial</strong> assemblages<br />
(< 5 mm) from surface water at the Hawaiian<br />
Ocean Time-Series (HOT) revealed community-wide<br />
metabolic activities and <strong>day</strong>/<strong>night</strong> patterns <strong>of</strong> differential<br />
gene expression. Pyrosequencing produced<br />
75 558 putative mRNA reads from a <strong>day</strong> transcriptome<br />
and 75 946 from a <strong>night</strong> transcriptome. Taxonomic<br />
binning <strong>of</strong> annotated mRNAs indicated that Cyanobacteria<br />
contributed a greater percentage <strong>of</strong> the transcripts<br />
(54% <strong>of</strong> annotated sequences) than expected<br />
based on abundance (35% <strong>of</strong> cell counts and 21% 16S<br />
rRNA <strong>of</strong> libraries), and may represent the most<br />
actively transcribing cells in this surface ocean community<br />
in both the <strong>day</strong> and <strong>night</strong>. Major heterotrophic<br />
taxa contributing to the community transcriptome<br />
included a-Proteobacteria (19% <strong>of</strong> annotated<br />
sequences, most <strong>of</strong> which were SAR11-related) and<br />
g-Proteobacteria (4%). The composition <strong>of</strong> transcript<br />
pools was consistent with models <strong>of</strong> prokaryotic gene<br />
expression, including operon-based transcription<br />
patterns and an abundance <strong>of</strong> genes predicted to be<br />
highly expressed. Metabolic activities that are shared<br />
by many <strong>microbial</strong> taxa (e.g. glycolysis, citric acid<br />
cycle, amino acid biosynthesis and transcription and<br />
translation machinery) were well represented among<br />
the community transcripts. There was an overabundance<br />
<strong>of</strong> transcripts for photosynthesis, C1<br />
metabolism and oxidative phosphorylation in the<br />
Received 17 September, 2008; accepted 3 December, 2008. *For<br />
correspondence. E-mail mmoran@uga.edu; Tel. 706-542-6481; Fax<br />
706-542-5888.<br />
<strong>day</strong> compared with <strong>night</strong>, and evidence that energy<br />
acquisition is coordinated with solar radiation levels<br />
for both autotrophic and heterotrophic microbes. In<br />
contrast, housekeeping activities such as amino acid<br />
biosynthesis, membrane synthesis and repair, and<br />
vitamin biosynthesis were overrepresented in the<br />
<strong>night</strong> transcriptome. Direct sequencing <strong>of</strong> these environmental<br />
transcripts has provided detailed information<br />
on metabolic and biogeochemical responses <strong>of</strong> a<br />
<strong>microbial</strong> community to solar forcing.<br />
Introduction<br />
© 2009 The Authors<br />
Journal compilation © 2009 Society for Applied Microbiology and Blackwell Publishing Ltd<br />
Oceanic subtropical gyres make up 40% <strong>of</strong> the Earth’s<br />
surface and play critical roles in carbon fixation and nutrient<br />
cycling. The Hawaii Ocean Time-Series (HOT) in the North<br />
Pacific subtropical gyre was established to provide a longterm<br />
perspective on oceanographic properties <strong>of</strong> such<br />
systems (Karl and Lukas, 1996) and has served as the<br />
focus <strong>of</strong> substantial research into the role <strong>of</strong> marine microorganisms<br />
in ocean biogeochemistry (Karl et al., 1997;<br />
Cavender-Bares et al., 2001; Zehr et al., 2001). Station<br />
ALOHA, the core study site at HOT, is characterized by<br />
warm (> 23°C) surface waters with low NO3 - concentrations<br />
(< 15 nM), seasonally variable surface mixed-layers<br />
(10–120 m), low standing biomass <strong>of</strong> living organisms<br />
(10–15 mgCl -1 ) and a persistent deep (75–140 m) chlorophyll<br />
a maximum layer. Since 1988, regular measurements<br />
<strong>of</strong> physical, chemical and biological parameters have been<br />
obtained with monthly ship-based monitoring as well as<br />
bottom-moored instruments and buoys. Recent metagenomic<br />
sampling efforts at Station ALOHA have provided<br />
information about the genes harboured by the bacterioplankton<br />
community and how they are distributed with<br />
depth (DeLong et al., 2006). Characterizing patterns <strong>of</strong><br />
expression <strong>of</strong> these <strong>microbial</strong> genes and identifying what<br />
factors induce their expression is the next critical step in<br />
understanding this oceanic ecosystem.<br />
Analogous to metagenomics, environmental transcriptomics<br />
(<strong>metatranscriptomic</strong>s) retrieves and sequences<br />
environmental mRNAs from a <strong>microbial</strong> assemblage<br />
without prior knowledge <strong>of</strong> what genes the community<br />
might be expressing (Poretsky et al., 2005; Frias-Lopez<br />
et al., 2008). Thus it provides a less biased perspective on
<strong>microbial</strong> gene expression in situ compared with other<br />
approaches (Wawrik et al., 2002; Bürgmann et al., 2003;<br />
Zhou, 2003). Environmental transcriptomics protocols are<br />
technically difficult, however, as prokaryotic mRNAs generally<br />
lack the poly(A) tails that make isolation <strong>of</strong> eukaryotic<br />
messages relatively straightforward (Liang and<br />
Pardee, 1992) and because <strong>of</strong> the relatively short halflives<br />
<strong>of</strong> mRNAs (Belasco, 1993). In addition, mRNAs are<br />
much less abundant than rRNAs in total RNA extracts,<br />
thus an rRNA background <strong>of</strong>ten overwhelms mRNA<br />
signals.<br />
A first <strong>analysis</strong> <strong>of</strong> environmental transcriptomes by creating<br />
clone libraries using random primers to reversetranscribe<br />
and amplify environmental mRNAs was<br />
successful in two different natural environments<br />
(Poretsky et al., 2005), but results were biased by selection<br />
<strong>of</strong> the random primers used to initiate cDNA synthesis.<br />
Techniques to linearly amplify mRNA obviate the<br />
need for random primers in the amplification step and<br />
make it possible to use less starting material (Gelder<br />
et al., 1990), while recently developed pyrosequencing<br />
technologies allow direct sequencing (without cloning)<br />
(Margulies et al., 2005). Initial application <strong>of</strong> this<br />
approach at Station ALOHA (Frias-Lopez et al., 2008)<br />
and in coastal water mesocosms (Gilbert et al., 2008)<br />
demonstrated its utility for characterizing <strong>microbial</strong> community<br />
gene expression.<br />
Here we use environmental transcriptomics to elucidate<br />
<strong>day</strong>/<strong>night</strong> differences in gene expression in surface<br />
waters <strong>of</strong> the North Pacific subtropical gyre (Karl and<br />
Lukas, 1996). This <strong>analysis</strong> provides information on the<br />
dominant metabolic processes within the bacterioplankton<br />
assemblages and reveals changes in expression patterns<br />
<strong>of</strong> biogeochemically relevant processes.<br />
Results<br />
cDNA sequence annotation<br />
The cDNAs prepared from amplified RNA (collected from<br />
the 0.2–5 mm size fraction) ranged in size from 100 bp to<br />
1 kb, with the majority between 200 and 500 bp. The<br />
average picoliter reactor pyrosequencing read length<br />
was 99 bp, typical for the GS 20 sequencing platform.<br />
Predicted rRNA sequences were removed based on<br />
sequence similarity to the nt database using BLASTN.<br />
While more laborious than our initial approach that used<br />
sequence similarity to the RDP II database supplemented<br />
with a 18S, 23S and 28S rRNA database from genome<br />
sequences, it identified nearly all <strong>of</strong> the rRNA sequences<br />
in our libraries. Accurate identification <strong>of</strong> rRNAs is crucial<br />
because <strong>of</strong> numerous misidentified sequences in the<br />
RefSeq protein database (i.e. rRNA sequences that are<br />
incorrectly annotated as putative proteins). Relatively low<br />
rRNA sequence contamination (37%) compared with the<br />
<strong>Comparative</strong> Metatranscriptomic Analysis 1359<br />
rRNA content <strong>of</strong> prokaryotic cells (> 80%; Ingraham et al.,<br />
1983) indicated that the steps for excluding rRNAs<br />
through selective degradation and subtractive hybridization<br />
were largely successful.<br />
Sequences remaining after deletion <strong>of</strong> rRNA<br />
sequences (75 558 from the <strong>day</strong> and 75 946 from the<br />
<strong>night</strong>) were categorized as possible protein encoding<br />
sequences and BLASTX-queried against the NCBI<br />
curated, non-redundant reference sequence database<br />
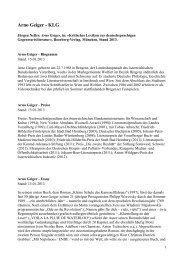
(RefSeq) to determine putative functions (Fig. 1). About<br />
one-third <strong>of</strong> HOT pyrosequences in each library met the<br />
criteria for gene predictions determined empirically by in<br />
silico <strong>analysis</strong> <strong>of</strong> known functional gene sequences fragmented<br />
into 100 bp pieces (see Experimental procedures<br />
for more details). This is nearly twice the fraction <strong>of</strong> reads<br />
identified in metagenomic efforts with similar pyrosequencing<br />
read lengths (Frias-Lopez et al., 2008; Mou<br />
et al., 2008), as might be expected for sequences biased<br />
towards coding regions <strong>of</strong> genomes. These sequences<br />
were subsequently assigned to the function <strong>of</strong> their best<br />
hit in RefSeq. Transcript abundance was analysed as<br />
relative abundance within the collective community transcriptome<br />
rather than per-gene expression levels (see<br />
Frias-Lopez et al., 2008). Empirically derived criteria were<br />
established in separate in silico analyses for the Clusters<br />
<strong>of</strong> Orthologous Groups (COG) and Kyoto Encyclopedia <strong>of</strong><br />
Genes and Genomes (KEGG) databases, which contain<br />
fewer sequences than RefSeq (Fig. 1). Some <strong>of</strong> the<br />
sequences without hits in RefSeq were similar to proteins<br />
in the Global Ocean Sampling database, indicating that<br />
similar sequences have been found in marine bacterioplankton<br />
communities, but functional annotation is not<br />
currently possible.<br />
At the end <strong>of</strong> the annotation pipeline, half <strong>of</strong> the possible<br />
protein-encoding sequences in each library had no<br />
significant hits to previously sequenced genes. To<br />
examine how sequences from uncultured marine bacterial<br />
taxa might decrease annotation success or skew<br />
taxonomic assignments, we randomly selected 100 bp<br />
sequences from the coding regions <strong>of</strong> genome fragments<br />
from SAR86 and SAR116 cells captured in environmental<br />
BAC libraries (SAR86 BAC, AF279106; SAR86 BAC,<br />
AY552545; SAR116 BAC, AY744399). Excluding selfhits,<br />
approximately 60% <strong>of</strong> the sequences from the BACs<br />
had no hits in RefSeq (Table S1). In a similar <strong>analysis</strong> <strong>of</strong><br />
coding sequences from cultured taxa with genome<br />
sequences available (Pelagibacter ubique HTCC1062<br />
and Prochlorococcus marinus MIT9312), only ~20% <strong>of</strong><br />
the sequences had no hits in RefSeq. Many unannotated<br />
sequences in the HOT libraries are therefore likely to be<br />
transcripts from poorly known taxa, but also include<br />
some transcripts from well-known taxa with poor identity<br />
to sequence databases for that particular 100 bp fragment.<br />
In support <strong>of</strong> the latter, a preliminary <strong>analysis</strong> <strong>of</strong> a<br />
© 2009 The Authors<br />
Journal compilation © 2009 Society for Applied Microbiology and Blackwell Publishing Ltd, Environmental Microbiology, 11, 1358–1375
1360 R. S. Poretsky et al.<br />
37%<br />
88,916<br />
rRNA sequences<br />
BLASTX against<br />
COG<br />
240,422 Total 454<br />
Sequences<br />
63%<br />
48,648 Identified sequences<br />
10%<br />
BLASTN against nt<br />
21%<br />
151,504 Possible proteinencoding<br />
sequences<br />
BLASTX against RefSeq<br />
BLASTX against<br />
KEGG<br />
15%<br />
24,474 35,927<br />
sequences sequences<br />
marine environmental transcriptome consisting <strong>of</strong> longer<br />
reads (~200 bp; 454 GS FLX sequencing platform; R.S.<br />
Poretsky and M.A. Moran, unpublished; and Table S1)<br />
resulted in twice the frequency <strong>of</strong> annotated sequences<br />
as the HOT metatranscriptome. For the 100 bp genome<br />
fragments from uncultured taxa that had significant hits<br />
in RefSeq, they were almost always to a gene from an<br />
organism in the same phylum (90%) or subphylum<br />
(70%), and thus did not significantly skew the taxonomic<br />
assignments (Table S1). SAR86, SAR116 and other currently<br />
recognized uncultured groups made up ~4% <strong>of</strong> the<br />
16S rRNA amplicons from these samples (see below).<br />
Finally, to examine the possibility that the unidentified<br />
sequences were from non-protein-coding regions, these<br />
sequences were BLAST-queried to tRNA genes, 5S rRNA<br />
genes and intergenic region sequences from three<br />
P. marinus genomes (MIT9301, MIT9312 and AS601)<br />
and two P. ubique genomes (HTCC1002 and<br />
HTCC1062). Based on this <strong>analysis</strong>, ~4% <strong>of</strong> the 76 327<br />
unidentified sequences were from non-protein-coding<br />
regions <strong>of</strong> these genomes, and these primarily hit intergenic<br />
regions.<br />
BLASTX<br />
against nr<br />
0.07%<br />
42%<br />
163 sequences<br />
102,856 Unidentified<br />
32%<br />
76,327<br />
unidentified<br />
sequences<br />
BLASTX against<br />
GOS<br />
11%<br />
26,366 GOS sequences<br />
Fig. 1. The mRNA annotation pipeline developed for 454 transcript reads showing combined counts for the <strong>day</strong> and <strong>night</strong> transcriptomes. All<br />
percentages are relative to the total number <strong>of</strong> sequences entering the pipeline.<br />
Community composition and taxonomic origin<br />
<strong>of</strong> transcripts<br />
Prochlorococcus are the most abundant Cyanobacteria at<br />
Station ALOHA (> 95% <strong>of</strong> photosynthetic picoplankton<br />
cells; Campbell and Vaulot, 1993) and in this study<br />
accounted for approximately 2 ¥ 10 5 cell ml -1 (based on<br />
flow cytometric counting; http://hahana.soest.hawaii.edu/<br />
hot/hot-dogs/), or ~30% <strong>of</strong> the total <strong>microbial</strong> community<br />
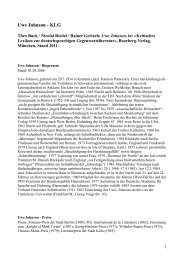
(Fig. 2). Heterotrophic bacteria (including phototrophs)<br />
were numerically dominant with ~5 ¥ 10 5 cell ml -1 ,<br />
accounting for ~65% <strong>of</strong> the <strong>microbial</strong> community present<br />
at the time <strong>of</strong> sampling. Direct counts also indicated the<br />
presence <strong>of</strong> ~800 cell ml -1 <strong>of</strong> pigmented nanoeukaryotes<br />
(0.2%; Fig. 2).<br />
Companion PCR-based 16S rRNA clone libraries were<br />
generated from DNA collected in tandem with the RNA<br />
samples and demonstrated close agreement with the flow<br />
cytometric data in terms <strong>of</strong> taxonomic composition at<br />
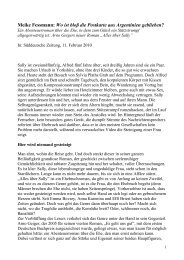
Station ALOHA. Cyanobacteria accounted for ~20% <strong>of</strong> the<br />
16S rRNA sequences, and heterotrophic bacterial groups<br />
were ~80% (Fig. 3). Among the heterotrophic 16S rRNA<br />
© 2009 The Authors<br />
Journal compilation © 2009 Society for Applied Microbiology and Blackwell Publishing Ltd, Environmental Microbiology, 11, 1358–1375
Depth (m)<br />
0<br />
50<br />
100<br />
150<br />
200<br />
sequences, Proteobacteria were most abundant (41%;<br />
Fig. 3) and were dominated by a-Proteobacteria (22%),<br />
b-Proteobacteria (8%) and g-Proteobacteria (8%).<br />
Bacteroidetes (8%) and Firmicutes (12%, biased towards<br />
the <strong>day</strong> sample) were also well represented.<br />
Taxonomically binned mRNA sequences were compared<br />
with community composition data to ask whether<br />
taxa contributed to the HOT community mRNA in proportion<br />
to their representation in the <strong>microbial</strong> assemblage<br />
(i.e. whether taxa are equally transcriptionally active on a<br />
per-cell basis). Cyanobacteria dominated the transcript<br />
libraries (55% <strong>of</strong> sequences) with about tw<strong>of</strong>old higher<br />
representation than in the 16S rRNA amplicons or the cell<br />
count data (Fig. 3), indicating that there is more gene<br />
expression in these autotrophic bacterioplankton than in<br />
co-occurring heterotrophs (or possibly that their transcripts<br />
are longer-lived). When relative 16S rRNA abundance<br />
was calculated among just the heterotrophic<br />
groups (i.e. with cyanobacterial sequences removed),<br />
many taxa had similar contributions to the transcript pool<br />
and amplicon pool, suggesting comparable levels <strong>of</strong><br />
transcriptional activity on a per-gene basis within the limits<br />
<strong>of</strong> recognized biases <strong>of</strong> PCR amplification (Fig. 3).<br />
0 200 400 600<br />
chla (10 -3 μg l -1 )<br />
Prochlorococcus x 10 3 cells ml -1<br />
Synechococcus x 10 2 cells ml -1<br />
Nanoeukaryotes x 10 2 cells ml -1<br />
Heterotrophic bateria x 10 3 cells ml -1<br />
<strong>Comparative</strong> Metatranscriptomic Analysis 1361<br />
Fig. 2. Depth pr<strong>of</strong>iles <strong>of</strong> Prochlorococcus-like, Synechococcus-like, heterotrophic bacteria and pigmented nanoeukaryotes during the HOT-175<br />
cruise, as determined by flow cytometry. The horizontal line indicates the mixed layer depth. The depth pr<strong>of</strong>ile for chlorophyll a is also<br />
indicated. Data were collected through the HOT project and downloaded from the HOT Data Organization and Graphical System<br />
(http://hahana.soest.hawaii.edu/hot/hot-dogs/).<br />
Proteobacteria contributed the second largest number <strong>of</strong><br />
transcript sequences (28%), most <strong>of</strong> which were attributed<br />
to a-Proteobacteria (19%) and g-Proteobacteria<br />
(4%). Approximately 2% <strong>of</strong> the total transcripts were <strong>of</strong><br />
eukaryotic origin. Comparing putative taxonomic assignments<br />
<strong>of</strong> transcripts between <strong>day</strong> and <strong>night</strong>, Cyanobacteria<br />
contributed equally to the <strong>day</strong> and <strong>night</strong> transcriptome<br />
(55% versus 56%) as did a-Proteobacteria (40% versus<br />
45% <strong>of</strong> heterotrophic transcripts) and g-Proteobacteria<br />
(11% versus 8% <strong>of</strong> heterotrophic transcripts) (Fig. 3).<br />
More detailed taxonomic assignment <strong>of</strong> transcripts was<br />
carried out for the best represented clades. The Cyanobacteria<br />
transcripts were dominated by Prochlorococcuslike<br />
sequences most similar to P. marinus AS9601,<br />
P. marinus MIT 9301 and P. marinus MIT 9312 (Table 1).<br />
The a-Proteobacteria, the most transcriptionally active<br />
among the heterotrophic groups, mostly contained<br />
sequences with similarity to the SAR11 group members<br />
P. ubique HTCC1002 and P. ubique HTCC1062 (~10% <strong>of</strong><br />
prokaryotic transcripts). Roseobacter-like sequences<br />
were also represented and were primarily assigned to<br />
Dinoroseobacter shibae DFL 12, Jannaschia sp. CCS1,<br />
Silicibacter pomeroyi DSS-3, Roseobacter denitrificans<br />
© 2009 The Authors<br />
Journal compilation © 2009 Society for Applied Microbiology and Blackwell Publishing Ltd, Environmental Microbiology, 11, 1358–1375
1362 R. S. Poretsky et al.<br />
A<br />
16S rRNA<br />
genes<br />
mRNA<br />
B<br />
16S rRNA<br />
genes<br />
mRNA<br />
Och 114 and Silicibacter sp. TM1040 (Table 1 and Fig. 4).<br />
These assignments do not imply that these actual species<br />
were present at the time <strong>of</strong> sample collection, but rather<br />
they represent the best current sequence matches for<br />
some <strong>of</strong> the more abundant environmental transcripts.<br />
Transcriptome coverage<br />
Cyanobacteria<br />
18 %<br />
Cyanobacteria<br />
55 %<br />
Cyanobacteria<br />
21 %<br />
Cyanobacteria<br />
56 %<br />
Other<br />
82%<br />
Other<br />
45%<br />
Other<br />
79%<br />
Other<br />
44%<br />
To estimate transcriptome coverage, 16S rRNA clone<br />
library data were used to establish a taxon-abundance<br />
model for the HOT community at an identity level <strong>of</strong> 99%.<br />
Assuming that each taxon expresses 1000 different<br />
genes at any given time (based on the Escherichia coli<br />
model; Ingraham et al., 1983) and that genome coverage<br />
Cyanobacteria<br />
Alphaproteobacteria<br />
Gammaproteobacteria<br />
Betaproteobacteria<br />
Deltaproteobacteria<br />
Epsilonproteobacteria<br />
Other Proteobacteria<br />
Actinobacteria<br />
Bacteroidetes<br />
Chlamydiae<br />
Chlorobi<br />
Chlor<strong>of</strong>lexi<br />
Chrysiogenetes<br />
Acidobacteria<br />
Firmicutes<br />
Lentispaerae<br />
Planctomycetes<br />
Spirochaetes<br />
Thermotogae<br />
Verrucomicrobia<br />
Fig. 3. Contribution <strong>of</strong> taxa to the 16S rRNA amplicon pool and transcript pool for the <strong>day</strong> (A) and <strong>night</strong> (B) samples. Taxonomy is presented<br />
to the phylum level (based on NCBI taxonomy) except for Proteobacteria, which is at the subphylum level. The dashed red lines indicate<br />
cyanobacterial abundance in the <strong>night</strong> sample as determined by flow cytometric counting.<br />
follows a Lander–Waterman model (Lander and Waterman,<br />
1988), we estimate that the most abundant taxon in<br />
the <strong>day</strong> or <strong>night</strong> sample had over 90% transcriptome<br />
coverage (i.e. 90% <strong>of</strong> the expressed genes were<br />
sequenced at least once), while the 15 most abundant<br />
taxa had more than half <strong>of</strong> their transcriptome represented<br />
(Table S2). Alternately, we determined the singletons<br />
and doubletons among the COG categories (i.e. the<br />
number <strong>of</strong> COGs containing only one or two sequences)<br />
and applied the Chao1 index <strong>of</strong> diversity to determine the<br />
theoretical abundance <strong>of</strong> COGs in the <strong>day</strong> and <strong>night</strong>. The<br />
sequencing effort captured about 80% <strong>of</strong> the COGs predicted<br />
to be present in the <strong>night</strong> transcriptome and 70% <strong>of</strong><br />
the COGs predicted for the <strong>day</strong> transcriptome (Table S2).<br />
© 2009 The Authors<br />
Journal compilation © 2009 Society for Applied Microbiology and Blackwell Publishing Ltd, Environmental Microbiology, 11, 1358–1375
% PHX Genes Frequency<br />
Frequency<br />
Based on these coverage estimates, increased<br />
sequencing depth would have been required to fully<br />
capture some specialized processes carried out by rarer<br />
members <strong>of</strong> the HOT community, but frequently transcribed<br />
genes from abundant taxa were well represented.<br />
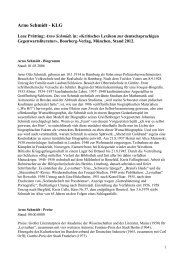
In support <strong>of</strong> this, transcript mapping to the three P. mari-<br />
Number <strong>of</strong> Adjacent Genes<br />
Fig. 4. Evidence for prokaryotic gene expression patterns in the community transcriptome based on P. marinus, P. ubique and Roseobacter<br />
genome bins.<br />
A. Operon-based expression was evaluated by comparing the number <strong>of</strong> adjacent transcripts (closed circles) to the number <strong>of</strong> adjacent genes<br />
found in 1000 random samples <strong>of</strong> the same size from the reference genome (black lines).<br />
B. Preferential representation <strong>of</strong> transcripts from genes predicted to be highly expressed was evaluated by comparing the per cent <strong>of</strong> PHX<br />
genes in the reference genome (grey bar) to the per cent in the transcript pool (black bar). Differences between transcript pools and reference<br />
genomes were significant for both operon and PHX analyses (Wilcoxon signed-rank test; P < 0.05).<br />
Table 1. Number <strong>of</strong> sequences from the community transcriptome<br />
with highest homology to the listed reference genomes, as determined<br />
by top BLASTX hit to RefSeq.<br />
Night Day<br />
Prochlorococcus marinus str. MIT 9301 6309 6292<br />
Prochlorococcus marinus str. AS9601 3214 2849<br />
Pelagibacter ubique HTCC1002 2541 1851<br />
Prochlorococcus marinus str. MIT 9312 1430 1264<br />
Pelagibacter ubique HTCC1062 1308 944<br />
Dinoroseobacter shibae DFL 12 48 34<br />
Jannaschia sp. CCS1 41 27<br />
Silicibacter pomeroyi DSS-3 39 30<br />
Roseobacter denitrificans Och 114 30 28<br />
Silicibacter sp. TM1040 19 26<br />
<strong>Comparative</strong> Metatranscriptomic Analysis 1363<br />
nus and two P. ubique reference genomes showed<br />
sequences with homology to approximately half the<br />
genes, at coverage depths ranging from 1 to nearly 500<br />
hits per gene (Fig. 5). Moreover, many <strong>of</strong> the reference<br />
genes with the greatest coverage are those mediating<br />
metabolic processes expected to be dominant in the HOT<br />
bacterioplankton community (e.g. the photosynthesis<br />
genes psaA and psaB, the light-harvesting complex and<br />
RuBisCo, ammonium transporters and transcriptionrelated<br />
genes; Fig. 5). Other genes on the reference<br />
genomes for which there is similarly deep transcript coverage<br />
(e.g. proteorhodopsin, Na+/solute symporters,<br />
colicin V production and several hypothetical proteins)<br />
can be hypothesized to also represent dominant metabolic<br />
activities (Fig. 5).<br />
Operon signature in environmental transcript pools<br />
Genes that encode steps in the same metabolic pathway<br />
are frequently clustered into operons in prokaryotic<br />
© 2009 The Authors<br />
Journal compilation © 2009 Society for Applied Microbiology and Blackwell Publishing Ltd, Environmental Microbiology, 11, 1358–1375
1364 R. S. Poretsky et al.<br />
Occurences<br />
30<br />
25<br />
20<br />
15<br />
10<br />
5<br />
0<br />
0 100 200 300 400 500 600 700 800 900 1000 1100 1200 1300 1400 1500 1600 1700 1800 1900 2000<br />
500<br />
450<br />
400<br />
150<br />
100<br />
50<br />
425<br />
400<br />
75<br />
50<br />
25<br />
80<br />
60<br />
40<br />
20<br />
Hypothetical protein<br />
Photosytem II PsbJ protein<br />
Ammonium transporter family<br />
Photosystem II PsbB (CP47)<br />
Ribulose bisphosphate carboxylase<br />
MIT9312<br />
Photosystem II D2<br />
Cytochrome b559, beta subunit<br />
MIT9301<br />
Protoporphyrin IX magnesium chelatase,<br />
subunit chlH<br />
0<br />
0 100 200 300 400 500 600 700 800 900 1000 1100 1200 1300 1400 1500 1600 1700 1800 1900 2000<br />
AS9601<br />
0<br />
0 100 200 300 400 500 600 700 800 900 1000 1100 1200 1300 1400 1500 1600 1700 1800 1900 2000<br />
HTCC 1002<br />
0<br />
0 100 200 300 400 500 600 700 800 900 1000 1100 1200 1300 1400<br />
35<br />
30<br />
25<br />
20<br />
15<br />
10<br />
5<br />
A<br />
E<br />
B<br />
D<br />
C<br />
Photosystem II PsbA (D1)<br />
lipoprotein<br />
precursor<br />
Bacteriorhodopsin<br />
light-harvesting complex protein<br />
Na+/solute symporter<br />
AcrB/AcrD/AcrF family protein<br />
(Acriflavin resistance)<br />
Chromosome segregation<br />
SMC family protein<br />
30S ribosomal protein S1<br />
excinuclease<br />
ABC subunit C<br />
heat shock protein a<br />
HTCC 1062<br />
Integral membrane protein,<br />
interacts with FtsH<br />
Ribosomal protein L14<br />
Ribosomal protein L20<br />
Photosystem I PsaA<br />
Hypothetical protein<br />
Elongation factor Tu<br />
Photosystem I PsaB<br />
30S ribosomal protein S3 Photosystem II<br />
reaction center Z<br />
DNA-directed RNA polymerase<br />
beta prime chain<br />
octaprenyl-diphosphate synthase<br />
translation elongation factor EF-G<br />
adenylylsulfate reductase<br />
0<br />
0 100 200 300 400 500 600 700 800 900 1000 1100 1200 1300 1400<br />
Fig. 5. Mapping <strong>of</strong> transcripts to five reference genomes. A–C are P. marinus strains; D–E are P. ubique strains. The x-axis shows gene<br />
number in the reference genome. Shaded areas represent possible hypervariable regions with few mapped transcripts.<br />
© 2009 The Authors<br />
Journal compilation © 2009 Society for Applied Microbiology and Blackwell Publishing Ltd, Environmental Microbiology, 11, 1358–1375
genomes (Overbeek et al., 1999) to facilitate coordinated<br />
transcription. Thus a cell’s transcript pool is anticipated to<br />
include more mRNAs from adjacent genes than what is<br />
expected from a random sampling <strong>of</strong> the genome. We<br />
tested this using the transcripts assigned to taxonomic<br />
bins for P. marinus, P. ubique and Roseobacter by counting<br />
the frequency with which transcripts from two adjacent<br />
genes on the reference strain genome (defined as � 1<br />
gene intervening) were both present in the bin, recognizing<br />
that the wild and reference organisms will not be fully<br />
syntenic. In all cases, the transcript bins had significantly<br />
more adjacent genes than a null distribution generated<br />
from the reference genomes (Fig. 4A), suggesting that<br />
random transcript sequencing captures operon-based<br />
expression patterns in natural marine bacterioplankton<br />
communities.<br />
Predicted highly expressed genes in environmental<br />
transcript pools<br />
Genes that are frequently transcribed by a cell can be<br />
identified based on patterns in codon usage (Karlin and<br />
Mrázek, 2000). We identified predicted highly expressed<br />
(PHX) genes for the reference genomes, and then<br />
assigned PHX status to the transcripts with best hits to<br />
that reference genome based on homology. For all taxa,<br />
and in accordance with biological expectations, the environmental<br />
transcript bins had a significantly higher percentage<br />
<strong>of</strong> PHX genes than the reference genomes<br />
(Fig. 4B). This pattern was particularly evident for the<br />
Roseobacters (9% <strong>of</strong> the genes in the reference genomes<br />
are PHX versus 30% <strong>of</strong> the transcripts; 3.1-fold enrichment)<br />
and for P. marinus MIT9301 (4.6% versus 12.9%;<br />
2.8-fold enrichment). A larger proportion <strong>of</strong> PHX transcripts<br />
were found in the <strong>day</strong> for all P. marinus bins and<br />
the Roseobacter bin (although not for P. ubique), suggesting<br />
that highly expressed genes more frequently mediate<br />
<strong>day</strong>time-biased processes (data not shown).<br />
Metatranscriptomic comparison <strong>of</strong> <strong>day</strong> and <strong>night</strong><br />
samples<br />
The majority <strong>of</strong> annotated transcripts (~80%) were<br />
assigned to genes related to metabolism, and in particular<br />
to three KEGG categories: amino acid transport and<br />
metabolism, energy production and conversion (particularly<br />
oxidative phosphorylation, carbon fixation and nitrogen<br />
metabolism), and carbohydrate transport (Fig. 6).<br />
Membrane transport and signal transduction pathways<br />
were also common in the community transcriptome,<br />
specifically for ABC transporters <strong>of</strong> amino acids, glycine<br />
betaine/L-proline, polyamines (spermidine and<br />
putrescine), iron and nutrients in the form <strong>of</strong> nitrate, phosphate<br />
and phosphonate.<br />
<strong>Comparative</strong> Metatranscriptomic Analysis 1365<br />
The <strong>day</strong>/<strong>night</strong> samples allowed comparison <strong>of</strong> dominant<br />
expression patterns in the presence and absence <strong>of</strong> solar<br />
radiation in the bacterioplankton community. Among the<br />
167 KEGG metabolic pathways represented in the annotated<br />
sequences, four pathways were better represented<br />
at <strong>night</strong> (including those for glycospingolipid biosynthesis<br />
and nucleotide sugars metabolism) and six were better<br />
represented in the <strong>day</strong> (including photosynthesis and oxidative<br />
phosphorylation) (95% confidence level; Table 2).<br />
Some KEGG pathways had significant diel differences in<br />
frequency for individual taxonomic bins. These include:<br />
histidine biosynthesis, with evidence for expression <strong>of</strong> all<br />
or nearly all genes in the pathway (both P. ubique and<br />
P. marinus at <strong>night</strong>; Fig. 7A and Fig. S1A); metabolism <strong>of</strong><br />
glutathione, a reductant with multiple detoxifying and cytoprotective<br />
capabilities (P. marinus at <strong>night</strong>); the photosynthesis<br />
pathway (phycobilisome, photosystem I and II,<br />
cytochromes, ATP synthase) and nearly all genes<br />
involved in biosynthesis <strong>of</strong> phytoene, and subsequent<br />
conversion into carotenoids (P. marinus in the <strong>day</strong>;<br />
Fig. 7B); nucleotide sugars metabolism, glycosphingolipid<br />
biosynthesis, carotenoid biosynthesis and vitamin B6<br />
metabolism (P. ubique in the <strong>night</strong>; Fig. S1B); and transfer<br />
<strong>of</strong> methyl groups for C1 metabolism (P. ubique and<br />
Roseobacter in the <strong>day</strong>) (Table S3).<br />
Transcript annotation based on the COG database was<br />
comparable. Among the 1577 COGs represented, statistical<br />
comparisons identified 12 that were better represented<br />
at <strong>night</strong> and 13 that were better represented in the<br />
<strong>day</strong> (Table S4). These included amino acid and nucleotide<br />
metabolism, membrane biosynthesis and polyamine<br />
dehydrogenation at <strong>night</strong>, and light-mediated energy production,<br />
protein turnover, catalase synthesis and inorganic<br />
ion transport and metabolism in the <strong>day</strong>.<br />
Statistically significant differences in the distribution <strong>of</strong><br />
transcripts between the <strong>day</strong> and <strong>night</strong> samples were also<br />
assessed independently <strong>of</strong> KEGG and COG assignments<br />
in order to capture signals from genes not currently classified<br />
by these annotation systems. Among the additional<br />
significant functions overrepresented in the <strong>night</strong> transcriptome<br />
were those for ABC-type spermidine/putrescine<br />
transport system permeases, RNA methyltransferases<br />
and signal transduction histidine kinases. For the <strong>day</strong><br />
transcriptome, genes encoding proteorhodopsin and an<br />
aromatic-ring hydroxylase were significantly overrepresented<br />
(Table S5).<br />
Eukaryotic sequences<br />
The majority <strong>of</strong> eukaryotic transcripts were most closely<br />
affiliated with sequences from green-lineage organisms<br />
(Viridiplantae), such as the picoeukaryotic prasinophytes<br />
Ostreococcus spp. (Derelle et al., 2006) and Micromonas<br />
spp. A large number <strong>of</strong> transcripts also appeared to be<br />
© 2009 The Authors<br />
Journal compilation © 2009 Society for Applied Microbiology and Blackwell Publishing Ltd, Environmental Microbiology, 11, 1358–1375
1366 R. S. Poretsky et al.<br />
Fig. 6. The 50 most abundant KEGG pathways in the <strong>night</strong> (black) and <strong>day</strong> (gray) transcriptomes. The pathways marked with stars were<br />
significantly overexpressed in one <strong>of</strong> the pools as determined by comparisons with P < 0.05 (Rodriguez-Brito et al., 2006).<br />
most closely related to genes in Chromalveoltae<br />
(Stramenopile or Alevolate) genomes. These groups are<br />
major components <strong>of</strong> the picoeukaryotic phytoplankton<br />
(McDonald et al., 2007) and are small enough to pass the<br />
5 mm prefilter used in this study. Gene transcripts that<br />
most closely matched reference genomes <strong>of</strong> photosynthetic<br />
eukaryotes were more abundant in the <strong>day</strong> compared<br />
with <strong>night</strong> sample. Among the most highly<br />
© 2009 The Authors<br />
Journal compilation © 2009 Society for Applied Microbiology and Blackwell Publishing Ltd, Environmental Microbiology, 11, 1358–1375
Table 2. KEGG pathways significantly overrepresented in the <strong>night</strong> (grey shading) and <strong>day</strong> (no shading) transcriptomes (P < 0.05).<br />
Pathway ID Pathway Category<br />
expressed genes detected from eukaryotic organisms<br />
were those encoding chlorophyll binding proteins, light<br />
harvesting reactions and photosynthetic machinery<br />
(Fig. 8). These included a photosystem II D1 reactioncentre<br />
protein related to that from the diatom Thalassiosira<br />
psuedonana, as well as the plastid-encoded<br />
photosystem I subunit protein similar to psaB from the<br />
diatom Odontella sinensis. Evidence for stramenopile<br />
nitrogen metabolism via urea cycle activity was also<br />
detected based on several transcripts that most closely<br />
matched stramenopile carbamoyl phosphate synthetase<br />
III, indicating that the unique diatom urea cycle (Armbrust<br />
et al., 2004; Allen et al., 2006) is likely active in natural<br />
populations <strong>of</strong> stramenopile picophytoplankton.<br />
qPCR quality control<br />
The half-life <strong>of</strong> <strong>microbial</strong> transcripts can be as short as<br />
30 s based on studies <strong>of</strong> mRNAs <strong>of</strong> cultured bacteria<br />
(Belasco, 1993), while processing times for environmental<br />
nucleic acid samples can take hours (Fuhrman et al.,<br />
1988). Linear amplification <strong>of</strong> RNA greatly reduces the<br />
time between initiation <strong>of</strong> sampling and capture <strong>of</strong> transcripts<br />
because sample volumes can be reduced, but it<br />
has potential to introduce bias into the sequenced mRNA<br />
pool. A previous test with mRNA from the cultured marine<br />
bacterium S. pomeroyi DSS-3 demonstrated minor bias<br />
and good repeatability during linear amplification (Bürgmann<br />
et al., 2007). Here, we assessed the full environmental<br />
transcriptomic sequencing protocol by comparing<br />
qPCR-based ratios <strong>of</strong> selected genes in <strong>day</strong> versus <strong>night</strong><br />
total RNA fractions to the pyrosequencing-based ratio <strong>of</strong><br />
these same genes in the sequenced transcript pools. Five<br />
genes common in the transcriptome (P. marinus-like recA<br />
and psaA, P. ubique-like proteorhodopsin and Na+/solute<br />
symporter, and P. torquis-like membrane proteinase)<br />
showed a strong positive correlation between <strong>night</strong> and<br />
<strong>day</strong> ratios in the original RNA pool and the pyrosequence<br />
data sets (r = 0.94, Fig. S2), indicating that the sequenced<br />
metatranscriptome was representative <strong>of</strong> the unamplified<br />
mRNA pool.<br />
Discussion<br />
<strong>Comparative</strong> Metatranscriptomic Analysis 1367<br />
path00520 Nucleotide sugars metabolism Carbohydrate Metabolism<br />
path00521 Streptomycin biosynthesis Biosynthesis <strong>of</strong> Secondary Metabolites<br />
path00602 Glycosphingolipid biosynthesis – neo-lactoseries Glycan Biosynthesis and Metabolism<br />
path00603 Glycosphingolipid biosynthesis – globoseries Glycan Biosynthesis and Metabolism<br />
path00190 Oxidative phosphorylation Energy Metabolism<br />
path00195 Photosynthesis Energy Metabolism<br />
path03010 Ribosome Translation<br />
path03020 RNA polymerase Transcription<br />
path04940 Chaperonin N/A<br />
path05060 Chaperonin N/A<br />
The HOT program provides comprehensive, long-term<br />
oceanographic information for the oligotrophic North<br />
Pacific Ocean (Karl and Lukas, 1996). In situ dissolved<br />
organic constituents at 25 m depth at Station ALOHA are<br />
typically 70–110 mM for carbon, 5–6 mM for nitrogen and<br />
0.2–0.3 mM for phosphorus; ammonium concentrations in<br />
these waters (~50 nM) are below the detection limit <strong>of</strong><br />
standard nutrient <strong>analysis</strong> (http://hahana.soest.hawaii.<br />
edu/hot/hot-dogs/). Surface water nutrient data over the<br />
past several decades for the month <strong>of</strong> November, the<br />
month in which the community transcriptomes in this<br />
study were obtained, and taken during various times <strong>of</strong><br />
<strong>day</strong> show no discernable differences in organic and inorganic<br />
carbon, nitrogen, and/or phosphorus concentrations<br />
at Station ALOHA on a diel basis.<br />
Building on previous metagenomic and transcriptomic<br />
analyses <strong>of</strong> this system (DeLong et al., 2006; Frias-Lopez<br />
et al., 2008), this <strong>day</strong>/<strong>night</strong> environmental transcriptomics<br />
effort provides insight into the temporal patterns <strong>of</strong> bacterioplankton<br />
metabolic processes and ecological activities<br />
(Table 3). Three important caveats <strong>of</strong> the <strong>analysis</strong> are<br />
that: (i) the composition <strong>of</strong> the environmental transcriptomes<br />
may be inadvertently shaped by collection and<br />
filtration manipulations, (ii) mRNAs with intrinsically<br />
shorter half-lives are less likely to be stabilized and<br />
sequenced and (iii) only 32% <strong>of</strong> the 151 000 possible<br />
transcript sequences could be confidently assigned to a<br />
known function (Fig. 1). Despite these concerns, the community<br />
transcriptomes provided reasonable coverage <strong>of</strong><br />
mRNAs from the dominant organisms, and the relative<br />
representation <strong>of</strong> transcripts was corroborated by RT<br />
qPCR-based expression analyses (Fig. S2).<br />
The community transcriptomes had properties consistent<br />
with expected attributes <strong>of</strong> the HOT ecosystem,<br />
including the apparent taxonomic affiliations <strong>of</strong> transcripts.<br />
Closely related P. marinus reference strains that<br />
are members <strong>of</strong> high light clade eMIT9312 comprised the<br />
most populated transcript bin. This clade has been shown<br />
to dominate in the upper euphotic zone (< 50 m) at low<br />
© 2009 The Authors<br />
Journal compilation © 2009 Society for Applied Microbiology and Blackwell Publishing Ltd, Environmental Microbiology, 11, 1358–1375
1368 R. S. Poretsky et al.<br />
© 2009 The Authors<br />
Journal compilation © 2009 Society for Applied Microbiology and Blackwell Publishing Ltd, Environmental Microbiology, 11, 1358–1375
Fig. 7. Transcript mapping to the KEGG histidine metabolism pathway for P. ubique, overrepresented at <strong>night</strong> (A) and the biosynthesis <strong>of</strong><br />
steroids and carotenoids pathway for P. marinus, overrepresented in the <strong>day</strong> (B). Colour (blue for <strong>night</strong>, yellow for <strong>day</strong>) indicates that<br />
transcripts were found; grey indicates that genes were present in the reference genome but no transcripts were found; white indicates that<br />
genes were not present in the reference genomes.<br />
and mid latitudes (below 30°) (Johnson et al., 2006),<br />
much like the HOT stations from which our samples were<br />
collected. SAR11-like sequences comprised the second<br />
largest taxonomic bin. This taxon is the most numerous<br />
heterotrophic marine bacterioplankton group, particularly<br />
in oligotrophic oceans where it makes up 30–40% <strong>of</strong> cells<br />
in the euphotic zone (Morris et al., 2002).<br />
Studies <strong>of</strong> taxonomic composition <strong>of</strong> ocean assemblages<br />
consistently show the numerical importance <strong>of</strong> aand<br />
g-Proteobacteria, Cyanobacteria, and Bacteriodetes<br />
(Morris et al., 2002; DeLong et al., 2006; Rusch<br />
et al., 2007), but little is known about how abundance<br />
specifically relates to activity levels. Based on comparisons<br />
<strong>of</strong> the relative abundance <strong>of</strong> taxa (flow cytometry<br />
counts and 16S rRNA amplicons) to their representation<br />
in the community transcriptome, by far the highest per-cell<br />
transcriptional activity level in the HOT ecosystem was<br />
seen for the Cyanobacteria. Assuming similar mRNA half-<br />
electron transport<br />
photosynthesis, light reaction<br />
phosphorus metabolic process<br />
oxidative phosphorylation<br />
ion transmembrane transporter activity<br />
energy derivation by oxidation <strong>of</strong> organic compounds<br />
heme binding<br />
cellular biosynthetic process<br />
protein metabolic process<br />
cellular macromolecule metabolic process<br />
organelle organization and biogenesis<br />
DNA metabolism<br />
organic acid metabolic process<br />
carbon utilization by fixation <strong>of</strong> carbon dioxide<br />
aldehyde metabolic process<br />
macromolecular complex assembly<br />
cellular component assembly<br />
ribonucleoprotein complex biogenesis and assembly<br />
macromolecule biosynthetic process<br />
intracellular transport<br />
aromatic compound metabolic process<br />
biopolymer metabolic process<br />
amino acid and derivative metabolic process<br />
<strong>Comparative</strong> Metatranscriptomic Analysis 1369<br />
lives across the prokaryotic taxa, dominant autotrophs<br />
produced more transcripts per gene than any<br />
co-occurring heterotrophic group not only in the <strong>day</strong>, but<br />
also at <strong>night</strong> (Fig. 3). This may reflect an advantage <strong>of</strong><br />
autotrophy over heterotrophy for maintaining cellular<br />
activity levels given the low concentration and refractory<br />
nature <strong>of</strong> organic carbon fuelling heterotrophic activity in<br />
the oligotrophic ocean (Bauer et al., 1992).<br />
As expected, many transcripts involved in lightmediated<br />
processes, such as photosynthesis and proteorhodopsin<br />
activity, were among those overrepresented in<br />
the community transcriptome in the <strong>day</strong>. Transcripts<br />
involved in protection or repair <strong>of</strong> light-induced DNA and<br />
protein damage (e.g. catalase, chaperones, photolyases,<br />
superoxide dismutase and various DNA repair proteins)<br />
were also common in the <strong>day</strong> sample. Evidence<br />
<strong>of</strong> <strong>day</strong>time C1 utilization by some heterotrophs suggests<br />
a source <strong>of</strong> C1 compounds or methyl groups in this<br />
0 20 40 60 80 100 120 140 160 180<br />
Fig. 8. Number <strong>of</strong> eukaryotic transcripts in <strong>day</strong> (top bars) compared with <strong>night</strong> (bottom bars) samples. The relative contribution <strong>of</strong><br />
Viridiplanteae (green), photosynthetic Chromist algae (yellow), and other Chromist (red) transcripts to each Gene Ontology (GO) annotation<br />
category are depicted.<br />
© 2009 The Authors<br />
Journal compilation © 2009 Society for Applied Microbiology and Blackwell Publishing Ltd, Environmental Microbiology, 11, 1358–1375
1370 R. S. Poretsky et al.<br />
Table 3. Selected biogeochemically relevant genes in the HOT metatranscriptome.<br />
ecosystem. Compounds such as methanol and formaldehyde<br />
(Heikes et al., 2002; Carpenter et al., 2004; Giovannoni<br />
et al., 2008), methane (Ward et al., 1987), and<br />
methylhalides (Woodall et al., 2001; Schaefer et al., 2002)<br />
may be available to heterotrophic bacterioplankton in<br />
surface sea water. Dimethylsulphoniopropionate, an<br />
organic sulphur compound produced in abundance by<br />
marine phytoplankton (Kiene et al., 2000), is a rich source<br />
<strong>of</strong> methyl groups for surface ocean bacterioplankton, and<br />
tetrahydr<strong>of</strong>olate-mediated C1 transfer (i.e. transcripts<br />
mapping to the C1 pool by folate and methane metabolism<br />
KEGG pathway; Table S5) has been shown to play a role<br />
in its metabolism (Howard et al., 2006). Recovery <strong>of</strong> nearly<br />
Night Day<br />
Nitrogen Nitrogenase (N fixation) nifH, nifU, nifS, nifB + +<br />
Ammonium transport amt + +*<br />
Ammonia monooxygenase amoA<br />
Assimilatory nitrate reductase narB +<br />
Hydroxylamine oxidoreductase hao<br />
Nitrate permease napA +<br />
Nitrite reductase nirA +<br />
Dissimilatory nitrite reductase nirK, nirS<br />
Nitric oxide reductase norQ +<br />
Nitrate transporter narK +<br />
Urease ureC, ureE, ureF + +<br />
Methylotrophy Serine-glyoxylate aminotransferase + +<br />
Formate dehydrogenase fdh, fdsD + +<br />
Methylene tetrahydr<strong>of</strong>olate reductase metF + +<br />
Methane monooxygenase mmo<br />
Methanol dehydrogenase mxa +<br />
Methenyltetrahydromethanopterin cyclohydrolase mch + +<br />
Crotonyl-CoA reductase + +<br />
Formaldehyde-activating enzyme fae +<br />
Polyamine degradation Deoxyhypusine synthase dys2 +* +<br />
Spermidine/putrescine transport system permease potC +* +<br />
Acetylpolyamine aminohydrolase aphA<br />
Sulphur cycle Sulphur oxidation soxB, soxC, soxA, soxZ, soxF + +<br />
Dimethylsulphoniopropionate demethylase dmdA<br />
Glycine betaine Dimethylglycine dehydrogenase dmgdh + +<br />
Glycine cleavage system (amnomethyltransferase) gcvT +* +<br />
Aromatic compounds Aromatic ring hydroxylase chlP + +*<br />
protocatechuate 3,4-dioxygenase pcaH<br />
Benzoyl-CoA oxygenase boxA +<br />
Carbon monoxide Carbon monoxide dehydrogenase cosS, coxM, coxL + +<br />
Phototrophy and C fixation Photosystem I multiple + +*<br />
Photosystem II multiple + +*<br />
Rubisco rbcL, rbcS + +*<br />
Photosynthetic reaction centre, M subunit pufM +<br />
Proteorhodopsin + +*<br />
Phosphate assimilation Phosphonate uptake phnD, phnC + +<br />
Alkaline phosphatase phoA + +<br />
Phosphate uptake pstA, pstS + +<br />
Amino acid metabolism Glutamate synthase gltB + +<br />
Glutathione reductase gor +* +<br />
Histidine kinase baeS +* +<br />
Threonine synthase thrC +* +<br />
Trace metal uptake Selenium +* +<br />
Iron tonB + +<br />
Arsenite +<br />
Arsenate reductase arsC + +<br />
A‘+’ indicates occurrence in the <strong>night</strong> or <strong>day</strong> sample. An asterisk indicates significantly higher transcript frequency in one.<br />
four times as much mRNA per volume <strong>of</strong> sea water in the<br />
<strong>day</strong> (~30 ng l -1 ) compared with <strong>night</strong> (~8 ngl -1 ) is consistent<br />
with high relative abundance <strong>of</strong> RNA polymerase<br />
transcripts in the <strong>day</strong> (Table 2) and likely reflects increased<br />
gene expression when solar radiation is available.<br />
Night-biased synthesis <strong>of</strong> vitamin B6, essential for a<br />
variety <strong>of</strong> amino acid conversions including transaminations,<br />
decarboxylations and dehydrations, in conjunction<br />
with evidence for other <strong>night</strong>-time activities such as the<br />
g-glutamyl pathway for amino acid uptake, the overrepresentation<br />
<strong>of</strong> amino acid transport and metabolism genes,<br />
and the histidine synthesis pathway (Table 3 and<br />
Tables S4–S6), indicate that amino acid acquisition in<br />
© 2009 The Authors<br />
Journal compilation © 2009 Society for Applied Microbiology and Blackwell Publishing Ltd, Environmental Microbiology, 11, 1358–1375
general may be a relatively more important metabolic<br />
activity in the <strong>night</strong>. Prochlorococcus marinus has recently<br />
been shown to exhibit diel patterns <strong>of</strong> amino acid uptake,<br />
with acquisition occurring predominantly at dusk (Mary<br />
et al., 2008). Our data agree with this and further suggest<br />
that heterotrophic taxa also devote a greater percentage<br />
<strong>of</strong> their transcriptome to transporting and synthesizing<br />
amino acids at <strong>night</strong>. Night-time accumulation <strong>of</strong> amino<br />
acids might be a mechanism for nitrogen storage by many<br />
organisms, particularly for P. marinus, which undergoes<br />
cell division at <strong>night</strong>. Histidine, the amino acid with the<br />
most consistent signal for synthesis at <strong>night</strong> by both<br />
autotrophs and heterotrophs (Fig. 7A and Fig. S1), is one<br />
<strong>of</strong> the most nitrogen-rich amino acids (only arginine has<br />
more amino groups).<br />
Overall, bacterial community investment in this oligotrophic<br />
ocean system was skewed towards energy<br />
acquisition and metabolism during the <strong>day</strong>, while biosynthesis<br />
(specifically <strong>of</strong> membranes, amino acids and vitamins)<br />
received relatively greater investments at <strong>night</strong>.<br />
Many <strong>microbial</strong> processes expected to be differentially<br />
expressed over a <strong>day</strong>/<strong>night</strong> cycle, such as photosynthesis,<br />
oxidative phosphorylation and proteorhodopsin activity,<br />
were indeed captured in the sequence data. Less<br />
anticipated processes that emerged included the utilization<br />
<strong>of</strong> C1 compounds, the uptake <strong>of</strong> polyamines and the<br />
degradation <strong>of</strong> aromatic compounds (Table 3). Other<br />
metabolic processes ongoing in this <strong>microbial</strong> community,<br />
although without statistical evidence for <strong>day</strong>/<strong>night</strong> patterns,<br />
included: use <strong>of</strong> nitrate and urea as nitrogen<br />
sources; use <strong>of</strong> phosphate, phosphonate and carbonoxygen-phosphorus<br />
(C-O-P) compounds as phosphorus<br />
sources; oxidation <strong>of</strong> reduced sulphur compounds; oxidation<br />
<strong>of</strong> carbon monoxide; and uptake <strong>of</strong> multiple trace<br />
metals (Table 3). This comparative <strong>analysis</strong> <strong>of</strong> <strong>microbial</strong><br />
community transcripts has provided an inventory <strong>of</strong><br />
ongoing metabolic processes, <strong>of</strong>fered insights into their<br />
temporal patterns and supplied a new type <strong>of</strong> data for<br />
predictive modelling <strong>of</strong> environmental controls on ecosystem<br />
properties.<br />
Experimental procedures<br />
Sample collection<br />
Samples were collected at the Hawaiian Ocean Time-series<br />
(HOT) Station ALOHA, defined by the 6-nautical-mile radius<br />
circle centred at 22°45′N, 158°W in November, 2005 (HOT-<br />
175). For RNA extraction, sea water was collected from a<br />
depth <strong>of</strong> 25 m using Niskin bottles on a conductivitytemperature-depth<br />
rosette sampler. A <strong>night</strong> sample was collected<br />
at 03:00 on 11 November 2005, and a <strong>day</strong>time<br />
sample was collected at 13:00 on 13 November 2005.<br />
During HOT-175, the peak PAR level was at 12:00, with<br />
sunrise occurring around 07:00 and sunset just before<br />
18:00. Sea water (80 l for the <strong>night</strong> sample and 40 l for the<br />
<strong>Comparative</strong> Metatranscriptomic Analysis 1371<br />
<strong>day</strong> sample) was prefiltered through a 5 mm, 142 mm polycarbonate<br />
filter (GE Osmonics, Minnetonka, MN) followed<br />
by a 0.2 mm, 142 mm Durapore (Millipore) filter using<br />
positive air pressure. The 0.2 mm filters were placed in a<br />
15 ml tube containing 2 ml Buffer RLT (containing<br />
b-mercaptoethanol) from the RNeasy kit (Qiagen, Valencia,<br />
CA) and flash-frozen in liquid nitrogen for RNA extraction.<br />
For DNA extraction, an additional 20 l <strong>of</strong> sea water were<br />
simultaneously filtered using the protocol outlined above at<br />
both time points. The 0.2 mm filters were placed in Whirlpack<br />
bags and flash-frozen. The total sampling time from initiation<br />
<strong>of</strong> collection until freezing in liquid nitrogen was approximately<br />
1.5 h. We obtained ~1 mg <strong>of</strong> total RNA from 40 to 80 l<br />
<strong>of</strong> sea water. Following mRNA enrichment and amplification,<br />
30–100 mg <strong>of</strong> mRNA was available for conversion to cDNA<br />
for sequencing. Typically, only 3–5 mg <strong>of</strong> DNA was required<br />
for pyrosequencing.<br />
RNA and DNA preparation<br />
DNA was extracted using a phenol : chlor<strong>of</strong>orm-based protocol<br />
(Fuhrman et al., 1988). Briefly, frozen filters inside Whirlpak<br />
bags were transferred to 50 ml Falcon centrifuge tubes.<br />
Ten millilitre extraction buffer [SDS (10% Sodium Doecyl<br />
Sulphate) : STE (100 mM NaCl, 10 mM Tris, 1 mM EDTA),<br />
9:1] was added to the tubes and boiled in a water bath for<br />
5 min. The extraction buffer was then removed from the<br />
tubes, placed into Oak Ridge round-bottom centrifuge tubes,<br />
to which 3 ml NaOAc and 28 ml 100% EtOH were added.<br />
Organic macromolecules were precipitated over<strong>night</strong> at<br />
-20°C, before the tubes were centrifuged for 1 h at 15 000 g.<br />
The supernatant was decanted, and pellets dried for 30 min<br />
in the air. The pellets were resuspended in 600 ml deionized<br />
water, and sequentially extracted with 500 ml phenol, 500 ml<br />
phenol : chlor<strong>of</strong>orm : isoamyl alcohol (24:1:0.1), and 500 ml<br />
chlor<strong>of</strong>orm:isoamyl alcohol (9:1); after each extraction the<br />
organic phase was removed and discarded. The supernatant<br />
was removed into a fresh tube at the end <strong>of</strong> last extraction,<br />
amended with 150 ml NaOAc and 1.2 ml 100% EtOH, and<br />
precipitated over<strong>night</strong>. The tube contents were then centrifuged<br />
at 15 000 g for 1 h, the supernatant decanted, and<br />
pellets dried in a speed vacuum dryer for 10 min. The DNA<br />
pellets were resuspended in 100 ml DNAse and RNAse-free<br />
deionized water (Ambion).<br />
RNA was extracted using a modified version <strong>of</strong> the RNeasy<br />
kit (Qiagen) that results in high RNA yields from material on<br />
polycarbonate filters (Poretsky et al., 2008). Frozen samples<br />
were first thawed slightly for 2 min in a 40–50°C water bath<br />
and then vortexed for 10 min with RNase-free beads from the<br />
Mo-Bio RNA PowerSoil kit (Carlsbad, CA). Following centrifugation<br />
for 5 min at 3000–5000 g, the supernatant was transferred<br />
to a new tube. Beginning with the RNeasy Midi kit,<br />
1 vol. <strong>of</strong> 70% ethanol was added to the lysate and, in order to<br />
shear large-molecular-weight nucleic acids, the lysate was<br />
drawn through a 22-gauge needle several (~5) times. RNA<br />
extraction then continued with the RNeasy Mini kit according<br />
to the manufacturer’s instructions.<br />
Following extraction, RNA was treated with DNase using<br />
the TURBO DNA-free kit (Ambion, Austin, TX). Two methods<br />
were employed to rid the RNA samples <strong>of</strong> rRNA. The RNA<br />
was first treated enzymatically with the mRNA-ONLY<br />
© 2009 The Authors<br />
Journal compilation © 2009 Society for Applied Microbiology and Blackwell Publishing Ltd, Environmental Microbiology, 11, 1358–1375
1372 R. S. Poretsky et al.<br />
Prokaryotic mRNA Isolation Kit (Epicentre Biotechnologies,<br />
Madison, WI) that uses a 5′-phosphate-dependent exonuclease<br />
to degrade rRNAs. The MICROBExpress kit (Ambion)<br />
subtractive hybridization with capture oligonucleotides<br />
hybridized to magnetic beads was subsequently used as an<br />
additional mRNA enrichment step.<br />
In order to obtain mg quantities <strong>of</strong> mRNA, approximately<br />
500 ng <strong>of</strong> RNA was linearly amplified using the MessageAmp<br />
II-Bacteria Kit (Ambion) according to the manufacturer’s<br />
instructions. Finally, the amplified, antisense RNA (aRNA)<br />
was converted to double-stranded cDNA with random hexamers<br />
using the Universal RiboClone cDNA Synthesis<br />
System (Promega, Madison, WI). The cDNA was purified with<br />
the Wizard DNA Clean-up System (Promega). The quality<br />
and quantity <strong>of</strong> the total RNA, mRNA, aRNA and cDNA were<br />
assessed by measurement on the NanoDrop-1000 Spectrophotometer<br />
(NanoDrop Technologies, Wilmington, DE) and<br />
the Experion Automated Electrophoresis System (Bio-Rad,<br />
Hercules, CA).<br />
cDNA sequencing and quality control<br />
cDNAs from each sample (<strong>night</strong> and <strong>day</strong>) were sequenced<br />
using the GS 20 sequencing system by 454 Life Sciences<br />
(Branford, CT) (Margulies et al., 2005), resulting in<br />
10 682 120 bp from 106 907 reads for the <strong>night</strong> sample and<br />
13 255 704 bp from 133 515 reads for the <strong>day</strong> sample. The<br />
average sequence length was 99 bp. The sequences have<br />
been deposited in the NCBI Short Read Archive with the<br />
Genome Project ID #33463.<br />
rRNA identification and removal<br />
For rRNA sequence identification, the sequences were clustered<br />
at an identity threshold <strong>of</strong> 98% based on a local alignment<br />
(number <strong>of</strong> identical residues divided by length <strong>of</strong><br />
alignment) using the program Cd-hit (Li and Godzik, 2006).<br />
Ribosomal RNA sequences were identified by BLASTN queries<br />
<strong>of</strong> the reference sequence <strong>of</strong> each cluster against the noncurated,<br />
GenBank nucleotide database (nt) (Benson et al.,<br />
2007) using cut-<strong>of</strong>f criteria <strong>of</strong> E-value � 10 -3 , nucleic acid<br />
length � 69 and per cent identity � 40% previously established<br />
with in silico tests for rRNA sequence predictions <strong>of</strong><br />
short pyrosequences (Frias-Lopez et al., 2008; Mou et al.,<br />
2008). We conservatively identified a sequence as rRNAderived<br />
and removed it from the <strong>analysis</strong> pipeline if any <strong>of</strong> the<br />
top three BLASTN hits were to an rRNA gene.<br />
cDNA sequence annotation<br />
The criteria for protein predictions generated using BLASTX<br />
against the NCBI curated, non-redundant reference<br />
sequence database (RefSeq) (Pruitt et al., 2005) were established<br />
with in silico tests to determine suitable cut-<strong>of</strong>f limits for<br />
reliable functional prediction. For these tests, 100 arbitrarily<br />
selected, known functional gene sequences were fragmented<br />
into 20–500 bp fragments and analysed using BLASTX<br />
against RefSeq to determine if the best BLAST hit was to the<br />
correct gene function, excluding self-hits. Based on these<br />
analyses, the cut-<strong>of</strong>f criteria for protein prediction were<br />
set as E-value < 0.01, identity > 40% and overlapping<br />
length > 23 aa to the corresponding best hit.<br />
Sequences with hits to RefSeq were assigned functional<br />
protein or pathway predictions based on the COG database<br />
(Tatusov et al., 2000) or KEGG database (Kanehisa and<br />
Goto, 2000). The cut-<strong>of</strong>f criteria for functional protein prediction<br />
based on orthologous groups using BLASTX <strong>analysis</strong><br />
against the COG database were established using the same<br />
in silico approach with 100 bp fragments <strong>of</strong> known functional<br />
genes as E-value < 0.1, identity > 40% and overlapping<br />
length > 23 aa to the corresponding best hit. The COG cut-<strong>of</strong>f<br />
criteria were also applied to the KEGG database for pathway<br />
prediction because <strong>of</strong> the similarity in database size. Taxonomic<br />
binning <strong>of</strong> the sequences was carried out using MEGAN<br />
with the default settings for all parameters (Huson et al.,<br />
2007); this program assigns likely taxonomic origin to<br />
sequences based on the NCBI taxonomy <strong>of</strong> closest BLAST<br />
hits. The taxonomic affiliations <strong>of</strong> the putative mRNA<br />
sequences were predicted using MEGAN to the family level,<br />
and the top BLAST hit for any higher-resolution taxonomic<br />
assignments. All non-rRNA sequences that had no RefSeq<br />
hits were BLASTX-queried against the nr database as well as<br />
against CAMERA un-assembled ORFs predicted from the<br />
Global Ocean Survey reads (http://camera.calit2.net/<br />
index.php) (Seshadri et al., 2007).<br />
Eukaryotic sequence annotation<br />
Eukaryotic transcripts were binned by MEGAN. Sequences<br />
were queried (BLASTX) against a curated database <strong>of</strong> protein<br />
sequences derived from all available complete eukaryotic<br />
organelle and nuclear genomes (currently, 46 eukaryotic<br />
genomes). Transcripts that matched a reference protein<br />
sequence with > 60% identity and an E-value < e -10 were<br />
retained and the reference protein for the cluster was used for<br />
functional annotation. Functional annotation was performed<br />
using Java-based Blast2go (Conesa et al., 2005) that annotates<br />
genes based on similarity searches with statistical<br />
<strong>analysis</strong> and highlighted visualization on directed acyclic<br />
graphs.<br />
16S rRNA gene libraries<br />
PCR amplification <strong>of</strong> ribosomal DNA was carried out using<br />
primers 27F and 1522R (Johnson, 1994). The PCR conditions<br />
were as follows: 3 min at 96°C, followed by 30 cycles <strong>of</strong><br />
denaturation at 95°C for 50 s, annealing at 58°C for 50 s,<br />
primer extension at 72°C for 1 min and a final extension at<br />
72°C for 10 min. PCR products were cleaned using the<br />
QIAquick PCR Purification Kit (Qiagen) and multiple PCR<br />
reactions were pooled and cloned into pCR2.1 vector using<br />
the TOPO TA cloning kit (Invitrogen, Carlsbad, CA). PCR<br />
amplifications included standard no-template controls.<br />
Clones from each sample (192) were sequenced at the University<br />
<strong>of</strong> Georgia Sequencing Facility on an ABI 3100<br />
(Applied Biosystems, Foster City, CA).<br />
Predicted highly expressed genes<br />
The PHX genes were determined for cultured representatives<br />
<strong>of</strong> three prokaryotic taxa that were well represented in the<br />
transcript libraries (Prochlorococcus, Roseobacter and<br />
© 2009 The Authors<br />
Journal compilation © 2009 Society for Applied Microbiology and Blackwell Publishing Ltd, Environmental Microbiology, 11, 1358–1375
SAR11) using an algorithm developed by Karlin and Mrázek<br />
(2000). The algorithm is based on comparisons with codon<br />
usage patterns in genes expected to be frequently transcribed<br />
in a prokaryotic genome (ribosomal proteins, chaperone<br />
proteins, etc.). Environmental transcript sequences<br />
that had best BLAST hits to one <strong>of</strong> the PHX genes were<br />
similarly designated as PHX.<br />
Statistical <strong>analysis</strong><br />
A statistical program designed for comparing gene frequency<br />
in metagenomic data sets (Rodriguez-Brito et al., 2006) was<br />
used to compare the <strong>night</strong> and <strong>day</strong> mRNA sequences categorized<br />
based on COGs, KEGGs and proteins. The program<br />
was run with 20 000 repeated samplings with a sample size<br />
<strong>of</strong> 10 000 for COGs, 9000 for KEGGs and 25 000 for proteins.<br />
The significance level (P) was set at < 0.05.<br />
qPCR verifications<br />
To confirm that the composition <strong>of</strong> the pyrosequence library<br />
was representative <strong>of</strong> the initial mRNAs, transcripts <strong>of</strong> five<br />
genes that were top hits to multiple sequences in both transcript<br />
pools were quantified in the total RNA pool. The qPCR<br />
primer sets were designed for the P. marinus str. AS9601<br />
recA and psaA, a proteorhodopsin gene and a Na+/solute<br />
symporter (Ssf family) gene from P. ubique HTCC1062, and a<br />
probable integral membrane proteinase attributed to Psychr<strong>of</strong>lexus<br />
torquis ATCC 700755 (sequences and annealing<br />
temps in Table S6). Reverse transcription reactions were<br />
carried out on 200 ng <strong>of</strong> RNA using the Omniscript RT kit<br />
(Qiagen) in 20 ml volumes containing 1¥ RT buffer, 0.3 mg ml -1<br />
<strong>of</strong> random hexamers (Invitrogen), 1 ml <strong>of</strong> 5 mM dNTPs, 2 U <strong>of</strong><br />
reverse transcriptase and 20 U <strong>of</strong> RNase inhibitor (Promega)<br />
at 37°C for 1 h, followed by inactivation <strong>of</strong> the reverse transcriptase<br />
at 95°C for 2 min. The <strong>day</strong> : <strong>night</strong> ratio <strong>of</strong> each gene<br />
transcript in the RNA pools was determined by qPCR amplification<br />
<strong>of</strong> a serial dilution <strong>of</strong> cDNAs in triplicate, and calculation<br />
<strong>of</strong> the difference in cycle threshold values (DCT)<br />
between the two samples. Quantitative amplification was<br />
done using the iCycler iQ RT PCR detection system (Bio-<br />
Rad) in a 20 ml reaction volume containing 10 ml <strong>of</strong> iQ SYBR<br />
Green Supermix (Bio-Rad), 0.4 ml each <strong>of</strong> 10 mM <strong>of</strong> the<br />
forward and reverse primers and 1 ml <strong>of</strong> the cDNA template.<br />
PCR conditions included a preliminary denaturation at 95°C<br />
for 3 min followed by 45 cycles <strong>of</strong> 95°C for 15 s, annealing for<br />
1.5 s, 95°C for 1 min and 55°C for 1 min. A melt curve was<br />
generated following the PCR, beginning with 55°C and<br />
increasing 0.4°C every 10 s until 95°C. A PCR control without<br />
an initial RT step was included with every set <strong>of</strong> reactions.<br />
Acknowledgements<br />
We thank the Captain and crew <strong>of</strong> the R/V Kilo Moana and Dr<br />
David Karl. Jennifer Oliver assisted with sample processing.<br />
Jonathan Badger assisted with data processing. Funding was<br />
provided by The Gordon and Betty Moore Foundation,<br />
National Science Foundation grants MCB-0702125 (M.A.M.),<br />
EF-0722374 (A.E.A) and OCE-0425363 (J.P.Z.), and the NSF<br />
C-MORE Center for Microbial Oceanography.<br />
References<br />
<strong>Comparative</strong> Metatranscriptomic Analysis 1373<br />
Allen, A.E., Vardi, A., and Bowler, C. (2006) An ecological<br />
and evolutionary context for integrated nitrogen metabolism<br />
and related signaling pathways in marine diatoms.<br />
Curr Opin Plant Biol 9: 264–273.<br />
Armbrust, E.V., Berges, J.A., Bowler, C., Green, B.R., Martinez,<br />
D., Putnam, N.H., et al. (2004) The genome <strong>of</strong> the<br />
diatom Thalassiosira pseudonana: ecology, evolution, and<br />
metabolism. Science 306: 79–86.<br />
Bauer, J.E., Williams, P.M., and Druffel, E.R.M. (1992) 14C<br />
activity <strong>of</strong> dissolved organic carbon fractions in the northcentral<br />
Pacific and Sargasso Sea. Nature 357: 667–670.<br />
Belasco, J.G. (1993) mRNA degradation in prokaryotic cells:<br />
an overview. In Control <strong>of</strong> Messenger RNA Stability.<br />
Belasco, J.G., Brawerman, G. (eds). San Diego, CA, USA:<br />
Academic Press, pp. 3–11.<br />
Benson, D.A., Karsch-Mizrachi, I., Lipman, D.J., Ostell, J.,<br />
and Wheeler, D.L. (2007) GenBank. Nucleic Acids Res 35:<br />
D21–D25.<br />
Bürgmann, H., Widmer, F., Sigler, W.V., and Zeyer, J. (2003)<br />
mRNA extraction and reverse transcription-PCR protocol<br />
for detection <strong>of</strong> nifH gene expression by Azotobacter vinelandii<br />
in soil. Appl Environ Microbiol 69: 1928–1935.<br />
Bürgmann, H., Howard, E.C., Ye, W., Sun, F., Sun, S., Napierala,<br />
S., and Moran, M.A. (2007) Transcriptional response<br />
<strong>of</strong> Silicibacter pomeroyi DSS-3 to dimethylsulfoniopropionate<br />
(DMSP). Environ Microbiol 9: 2742–2755.<br />
Campbell, L., and Vaulot, D. (1993) Photosynthetic picoplankton<br />
community structure in the subtropical North<br />
Pacific Ocean near Hawaii (Station ALOHA). Deep Sea<br />
Res. Part I Oceanogr Res Pap 40: 2043–2060.<br />
Carpenter, L.J., Lewis, A.C., Hopkins, J.R., Read, K.A.,<br />
Longley, I.D., and Gallagher, M.W. (2004) Uptake <strong>of</strong><br />
methanol to the North Atlantic Ocean surface. Global Biogeochem<br />
Cycles 18: GB4027.<br />
Cavender-Bares, K.K., Karl, D.M., and Chisholm, S.W.<br />
(2001) Nutrient gradients in the western North Atlantic<br />
Ocean: relationship to <strong>microbial</strong> community structure and<br />
comparison to patterns in the Pacific Ocean. Deep Sea<br />
Res. Part I Oceanogr Res Pap 48: 2373–2395.<br />
Conesa, A., Gotz, S., Garcia-Gomez, J.M., Terol, J., Talon,<br />
M., and Robles, M. (2005) Blast2GO: a universal tool for<br />
annotation, visualization and <strong>analysis</strong> in functional genomics<br />
research. Bioinformatics 21: 3674–3676.<br />
DeLong, E.F., Preston, C.M., Mincer, T., Rich, V., Hallam,<br />
S.J., Frigaard, N.-U., et al. (2006) Community genomics<br />
among stratified <strong>microbial</strong> assemblages in the ocean’s<br />
interior. Science 311: 496–503.<br />
Derelle, E., Ferraz, C., Rombauts, S., Rouze, P., Worden,<br />
A.Z., Robbens, S., et al. (2006) Genome <strong>analysis</strong> <strong>of</strong> the<br />
smallest free-living eukaryote Ostreococcus tauri unveils<br />
many unique features. Proc Natl Acad Sci USA 103:<br />
11647–11652.<br />
Frias-Lopez, J., Shi, Y., Tyson, G.W., Coleman, M.L.,<br />
Schuster, S.C., Chisholm, S.W., and DeLong, E.F. (2008)<br />
Microbial community gene expression in ocean surface<br />
waters. Proc Natl Acad Sci USA 105: 3805–3810.<br />
Fuhrman, J.A., Comeau, D.E., Hagstrom, A., and Chan, A.M.<br />
(1988) Extraction from natural planktonic microorganisms<br />
<strong>of</strong> DNA suitable for molecular biological studies. Appl<br />
Environ Microbiol 54: 1426–1429.<br />
© 2009 The Authors<br />
Journal compilation © 2009 Society for Applied Microbiology and Blackwell Publishing Ltd, Environmental Microbiology, 11, 1358–1375
1374 R. S. Poretsky et al.<br />
Gelder, R.N.V., von Zastrow, M.E., Yool, A., Dement, W.C.,<br />
Barchas, J.D., and Eberwine, J.H. (1990) Amplified RNA<br />
synthesized from limited quantities <strong>of</strong> heterogeneous<br />
cDNA. Proc Natl Acad Sci USA 87: 1663–1667.<br />
Gilbert, J.A., Field, D., Huang, Y., Edwards, R., Li, W., Gilna,<br />
P., and Joint, I. (2008) Detection <strong>of</strong> large numbers <strong>of</strong> novel<br />
sequences in the metatranscriptomes <strong>of</strong> complex marine<br />
<strong>microbial</strong> communities. PLoS ONE 3: e3042.<br />
Giovannoni, S.J., Hayakawa, D.H., Tripp, H.J., Stingl, U.,<br />
Givan, S.A., Cho, J.-C., et al. (2008) The small genome <strong>of</strong><br />
an abundant coastal ocean methylotroph. Environ Microbiol<br />
10: 1771–1782.<br />
Heikes, B.G., Chang, W.N., Pilson, M.E.Q., Swift, E., Singh,<br />
H.B., Guenther, A., et al. (2002) Atmospheric methanol<br />
budget and ocean implication. Global Biogeochem Cycles<br />
16: 80.81–80.80.13.<br />
Howard, E.C., Henriksen, J.R., Buchan, A., Reisch, C.R.,<br />
Burgmann, H., Welsh, R., et al. (2006) Bacterial taxa that<br />
limit sulfur flux from the ocean. Science 314: 649–652.<br />
Huson, D.H., Auch, A.F., Qi, J., and Schuster, S.C. (2007)<br />
MEGAN <strong>analysis</strong> <strong>of</strong> metagenomic data. Genome Res 17:<br />
377–386.<br />
Ingraham, J.L., Maaløe, O., and Neidhardt, F.C. (1983)<br />
Growth <strong>of</strong> the Bacterial Cell. Sunderland, MA, USA:<br />
Sinauer Associates.<br />
Johnson, J.L. (1994) Similarity <strong>analysis</strong> <strong>of</strong> rRNAs. In Methods<br />
for General and Molecular Bacteriology. Gerhardt, P.,<br />
Murray, R.G.E., Wood, W.A., and Krieg, N.R. (eds). Washington,<br />
DC: American Society for Microbiology, pp. 683–<br />
700.<br />
Johnson, Z.I., Zinser, E.R., Coe, A., McNulty, N.P., Woodward,<br />
E.M.S., and Chisholm, S.W. (2006) Niche partitioning<br />
among Prochlorococcus ecotypes along ocean-scale<br />
environmental gradients. Science 311: 1737–1740.<br />
Kanehisa, M., and Goto, S. (2000) KEGG: Kyoto encyclopedia<br />
<strong>of</strong> genes and genomes. Nucleic Acids Res 28: 27–30.<br />
Karl, D., Letelier, R., Tupas, L., Dore, J., Christian, J., and<br />
Hebel, D. (1997) The role <strong>of</strong> nitrogen fixation in biogeochemical<br />
cycling in the subtropical North Pacific<br />
Ocean. Nature 388: 533–538.<br />
Karl, D.M., and Lukas, R. (1996) The Hawaii Ocean Timeseries<br />
(HOT) program: background, rationale and field<br />
implementation. Deep Sea Res. Part II Top Stud Oceanogr<br />
43: 129–156.<br />
Karlin, S., and Mrázek, J. (2000) Predicted highly expressed<br />
genes <strong>of</strong> diverse prokaryotic genomes. J Bacteriol 182:<br />
5238–5250.<br />
Kiene, R.P., Linn, L.J., and Bruton, J.A. (2000) New and<br />
important roles for DMSP in marine <strong>microbial</strong> communities.<br />
J Sea Res 43: 209–224.<br />
Lander, E.S., and Waterman, M.S. (1988) Genomic mapping<br />
by fingerprinting random clones: a mathematical <strong>analysis</strong>.<br />
Genomics 2: 231–239.<br />
Li, W., and Godzik, A. (2006) Cd-hit: a fast program for<br />
clustering and comparing large sets <strong>of</strong> protein or nucleotide<br />
sequences. Bioinformatics 22: 1658–1659.<br />
Liang, P., and Pardee, A.B. (1992) Differential display <strong>of</strong><br />
eukaryotic messenger RNA by means <strong>of</strong> the polymerase<br />
chain reaction. Science 257: 967–971.<br />
McDonald, S.M., Sarno, D., Scanlan, D.J., and Zingone, A.<br />
(2007) Genetic diversity <strong>of</strong> eukaryotic ultraphytoplankton in<br />
the Gulf <strong>of</strong> Naples during an annual cycle. Aquat Microb<br />
Ecol 50: 75–89.<br />
Margulies, M., Egholm, M., Altman, W.E., Attiya, S., Bader,<br />
J.S., Bemben, L.A., et al. (2005) Genome sequencing in<br />
micr<strong>of</strong>abricated high-density picolitre reactors. Nature 437:<br />
376–380.<br />
Mary, I., Garczarek, L., Tarran, G.A., Kolowrat, C., Terry,<br />
M.J., Scanlan, D.J., et al. (2008) Diel rhythmicity in amino<br />
acid uptake by Prochlorococcus. Environ Microbiol 10:<br />
2124–2131.<br />
Morris, R.M., Rappe, M.S., Connon, S.A., Vergin, K.L.,<br />
Siebold, W.A., Carlson, C.A., and Giovannoni, S.J. (2002)<br />
SAR11 clade dominates ocean surface bacterioplankton<br />
communities. Nature 420: 806–810.<br />
Mou, X., Sun, S., Edwards, R.A., Hodson, R.E., and Moran,<br />
M.A. (2008) Bacterial carbon processing by generalist<br />
species in the coastal ocean. Nature 451: 708–711.<br />
Overbeek, R., Fonstein, M., D’Souza, M., Pusch, G.D., and<br />
Maltsev, N. (1999) The use <strong>of</strong> gene clusters to infer functional<br />
coupling. Proc Natl Acad Sci USA 96: 2896–2901.<br />
Poretsky, R.S., Bano, N., Buchan, A., LeCleir, G.,<br />
Kleikemper, J., Pickering, M., et al. (2005) Analysis <strong>of</strong><br />
<strong>microbial</strong> gene transcripts in environmental samples. Appl<br />
Environ Microbiol 71: 4121–4126.<br />
Poretsky, R.S., Bano, N., Buchan, A., Moran M.A., and<br />
Hollibaugh, J.T. (2008) Environmental transcriptomics: a<br />
method to access expressed genes in complex <strong>microbial</strong><br />
communities. In Molecular Microbial Ecology Manual.<br />
Kowalchuk, G.A., de Bruijn, F.J., Head, I.M., Akkermans,<br />
A.D.L., and van Elsas, J.D. (eds). Dordrecht, Netherlands:<br />
Springer, pp. 1892–1904.<br />
Pruitt, K.D., Tatusova, T., and Maglott, D.R. (2005) NCBI<br />
Reference Sequence (RefSeq): a curated non-redundant<br />
sequence database <strong>of</strong> genomes, transcripts and proteins.<br />
Nucleic Acids Res 33: D501–D504.<br />
Rodriguez-Brito, B., Rohwer, F., and Edwards, R. (2006) An<br />
application <strong>of</strong> statistics to comparative metagenomics.<br />
BMC Bioinformatics 7: 162.<br />
Rusch, D.B., Halpern, A.L., Sutton, G., Heidelberg, K.B.,<br />
Williamson, S., Yooseph, S., et al. (2007) The Sorcerer II<br />
Global Ocean Sampling Expedition: Northwest Atlantic<br />
through Eastern Tropical Pacific. PLoS Biol 5: e77.<br />
Schaefer, J.K., Goodwin, K.D., McDonald, I.R., Murrell, J.C.,<br />
and Oremland, R.S. (2002) Leisingera methylohatidivorans<br />
gen. nov., sp nov., a marine methylotroph that grows on<br />
methyl bromide. Int J Syst Evol Microbiol 52: 851–859.<br />
Seshadri, R., Kravitz, S.A., Smarr, L., Gilna, P., and Frazier,<br />
M. (2007) CAMERA: a community resource for metagenomics.<br />
PLoS Biol 5: 394–397.<br />
Tatusov, R.L., Galperin, M.Y., Natale, D.A., and Koonin, E.V.<br />
(2000) The COG database: a tool for genome-scale <strong>analysis</strong><br />
<strong>of</strong> protein functions and evolution. Nucleic Acids Res<br />
28: 33–36.<br />
Ward, B.B., Kilpatrick, K.A., Novelli, P.C., and Scranton, M.I.<br />
(1987) Methane oxidation and methane fluxes in the ocean<br />
surface-layer and deep anoxic waters. Nature 327: 226–<br />
229.<br />
Wawrik, B., Paul, J.H., and Tabita, F.R. (2002) Real-time<br />
PCR quantification <strong>of</strong> rbcL (ribulose-1,5-bisphosphate<br />
carboxylase/oxygenase) mRNA in diatoms and pelagophytes.<br />
Appl Environ Microbiol 68: 3771–3779.<br />
© 2009 The Authors<br />
Journal compilation © 2009 Society for Applied Microbiology and Blackwell Publishing Ltd, Environmental Microbiology, 11, 1358–1375
Woodall, C.A., Warner, K.L., Oremland, R.S., Murrell, J.C.,<br />
and McDonald, I.R. (2001) Identification <strong>of</strong> methyl halideutilizing<br />
genes in the methyl bromide-utilizing bacterial<br />
strain IMB-1 suggests a high degree <strong>of</strong> conservation <strong>of</strong><br />
methyl halide-specific genes in gram-negative bacteria.<br />
Appl Environ Microbiol 67: 1959–1963.<br />
Zehr, J.P., Waterbury, J.B., Turner, P.J., Montoya, J.P.,<br />
Omoregie, E., Steward, G.F., et al. (2001) Unicellular<br />
cyanobacteria fix N 2 in the subtropical North Pacific Ocean.<br />
Nature 412: 635–638.<br />
Zhou, J.H. (2003) Microarrays for bacterial detection and<br />
<strong>microbial</strong> community <strong>analysis</strong>. Curr Opin Microbiol 6: 288–<br />
294.<br />
Supporting information<br />
Additional Supporting Information may be found in the online<br />
version <strong>of</strong> this article:<br />
Fig. S1. Transcript mapping to the KEGG histidine metabolism<br />
pathway for P. marinus (A) and the vitamin B6 metabolism<br />
pathway for P. ubique (B) at <strong>night</strong>. Blue shading indicates<br />
that transcripts were found; grey indicates genes that are<br />
present in the genome, but no transcripts were found; white<br />
indicates genes that are not present in the reference<br />
genomes.<br />
Fig. S2. Quality control <strong>of</strong> the pyrosequences using qPCR<br />
verifications <strong>of</strong> transcript ratios for five genes: recA and psaA<br />
from P. marinus str. AS9601, a bacteriorhodopsin and a<br />
Na+/solute symporter (Ssf family) gene from P. ubique<br />
HTCC1062, and a probable integral membrane proteinase<br />
attributed to P. torquis ATCC 700755. The <strong>night</strong> : <strong>day</strong> ratio <strong>of</strong><br />
transcripts in the pyrosequence libraries is plotted against the<br />
same ratio in the original total RNA fraction.<br />
<strong>Comparative</strong> Metatranscriptomic Analysis 1375<br />
Table S1. Results <strong>of</strong> bioinformatic pipeline for 100 and<br />
200 bp fragments from groups for which there are no genome<br />
sequences currently available. BACs from uncultured marine<br />
taxa (two from SAR86 and one from SAR116) were fragmented<br />
into random 100 bp pieces, using just the coding<br />
regions. Fragments were blasted against RefSeq, not allowing<br />
a self-hit. As controls, we did the same for P. ubique<br />
HTCC1062 and P. marinus MIT9312.<br />
Table S2. Estimates <strong>of</strong> coverage using two different models.<br />
The Lander–Waterman model uses the 16S rRNA clone<br />
library data to establish a taxon-abundance model for the<br />
system at a similarity level <strong>of</strong> 99%, and is based on the<br />
assumptions that each taxon produces 1000 transcripts at<br />
any given time and all expressed genes are expressed<br />
equally. The Chao1 richness estimators for COGs are computed<br />
using EstimateS (version 8.0, R. K. Colwell, http://<br />
purl.oclc.org/estimates).<br />
Table S3. KEGG pathways for three taxonomic bins<br />
(P. marinus, P. ubique and Roseobacters) significantly overrepresented<br />
in the <strong>night</strong> (grey shading) and <strong>day</strong> (no shading)<br />
transcriptomes (P < 0.10).<br />
Table S4. COGs significantly overrepresented in the <strong>night</strong><br />
(grey shading) and <strong>day</strong> (no shading) transcriptomes<br />
(P < 0.05).<br />
Table S5. Genes significantly overrepresented in the <strong>night</strong><br />
(grey shading) and <strong>day</strong> (no shading) transcriptomes<br />
(P < 0.05).<br />
Table S6. Primer sets used in qPCR.<br />
Please note: Wiley-Blackwell are not responsible for the<br />
content or functionality <strong>of</strong> any supporting materials supplied<br />
by the authors. Any queries (other than missing material)<br />
should be directed to the corresponding author for the<br />
article.<br />
© 2009 The Authors<br />
Journal compilation © 2009 Society for Applied Microbiology and Blackwell Publishing Ltd, Environmental Microbiology, 11, 1358–1375