Lab 2: Investigating Projectile Motion
Lab 2: Investigating Projectile Motion
Lab 2: Investigating Projectile Motion

You also want an ePaper? Increase the reach of your titles
YUMPU automatically turns print PDFs into web optimized ePapers that Google loves.
<strong>Lab</strong> 2. <strong>Investigating</strong> <strong>Projectile</strong> <strong>Motion</strong> Physics 152<br />
Prof: Professor van der Veen<br />
<strong>Lab</strong> Instructors: Ms. Walker, Mr. Stankovich<br />
<strong>Lab</strong> 2: <strong>Investigating</strong> <strong>Projectile</strong> <strong>Motion</strong><br />
In this lab, you will do the first part (graphing with Excel) with one partner. For the<br />
shooting activity, due to lack of space as well as lack of equipment, you will work in a<br />
group of 4 people with your entire lab table row (two groups of 2 people/group).<br />
However, you must each turn in your own paper, albeit with the same data.<br />
Equipment: Make sure you have the following equipment in working order :<br />
1. Laptop computer<br />
2. Shooter, ball, and plunger: ALWAYS USE THE "SHORT" SETTING FOR<br />
SHOOTING IN THIS LAB!<br />
3. Meter stick<br />
4. Plain white paper, carbon paper, and masking tape<br />
Please do not write directly on this set of instructions, but write your<br />
answers on your own paper. Please RETURN this set of instructions to<br />
your instructor before you leave. Please DO NOT walk out the door with<br />
this paper in your hand, but leave it for the next section.<br />
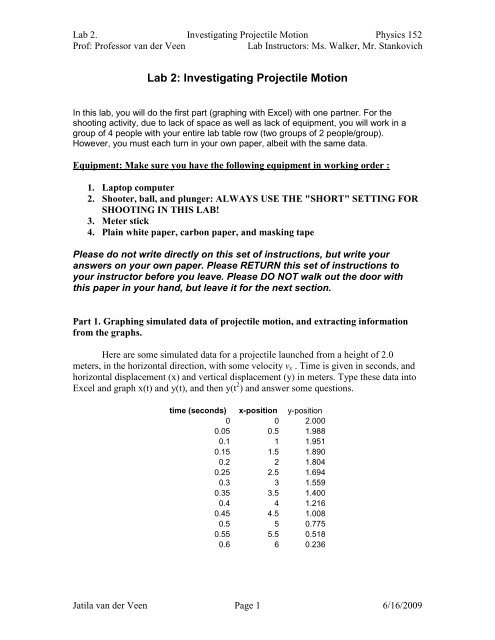
Part 1. Graphing simulated data of projectile motion, and extracting information<br />
from the graphs.<br />
Here are some simulated data for a projectile launched from a height of 2.0<br />
meters, in the horizontal direction, with some velocity v x . Time is given in seconds, and<br />
horizontal displacement (x) and vertical displacement (y) in meters. Type these data into<br />
Excel and graph x(t) and y(t), and then y(t 2 ) and answer some questions.<br />
time (seconds) x-position y-position<br />
0 0 2.000<br />
0.05 0.5 1.988<br />
0.1 1 1.951<br />
0.15 1.5 1.890<br />
0.2 2 1.804<br />
0.25 2.5 1.694<br />
0.3 3 1.559<br />
0.35 3.5 1.400<br />
0.4 4 1.216<br />
0.45 4.5 1.008<br />
0.5 5 0.775<br />
0.55 5.5 0.518<br />
0.6 6 0.236<br />
Jatila van der Veen Page 1 6/16/2009
<strong>Lab</strong> 2. <strong>Investigating</strong> <strong>Projectile</strong> <strong>Motion</strong> Physics 152<br />
Prof: Professor van der Veen<br />
<strong>Lab</strong> Instructors: Ms. Walker, Mr. Stankovich<br />
a) Graph time on the horizontal axis, and graph both x and y as series 1 and series 2. Use<br />
the scatter plot option.<br />
b) Describe each graph (straight line, parabola, or what…).<br />
c) For the graph of x-position, use the Trend Line option. Turn on the feature to display<br />
the equation. Use the linear function to graph this function and find the slope of the line.<br />
i. What is the equation that describes this line? (Excel will use "x" but you use<br />
"t" for time.)<br />
ii. What is the slope of this line?<br />
iii. What does this slope represent?<br />
See simulated data. Vx = 10m/sec = slope of x-motion. Slope represents horizontal<br />
velocity.<br />
d) Now copy all the times into another column, say column E, from E2 to E15. In the<br />
column next to this new column, calculate the squared times in the F column from F2<br />
through F15. <strong>Lab</strong>el this column "t-squared."<br />
Make a separate graph of the y-values as function of the new variable t 2 . Again,<br />
use the scatter plot option, and then add a trend line, and turn on the option to print the<br />
equation on the graph. Use the linear option.<br />
i. What is the equation of this line of y(t 2 )? Vy = -4.9t 2<br />
ii. What is the slope of this line, and what does it represent? Slope is ½ the<br />
acceleration.<br />
Print out all the graphs on one paper and staple it to your paper of answers.<br />
Part 2. Shooting, measuring, and predicting<br />
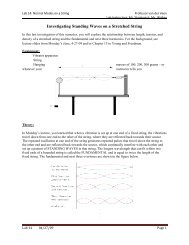
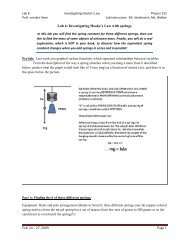
1. Set the shooter in the horizontal position. Use the attached protractor to be sure that it<br />
is level. Push the ball into the shooter in the SHORTEST range position (first notch).<br />
(See Figure 1.)<br />
Measure the height of the center of mass of the ball in this position to the ground<br />
and write it down in your lab notebook.<br />
y total =<br />
Jatila van der Veen Page 2 6/16/2009
<strong>Lab</strong> 2. <strong>Investigating</strong> <strong>Projectile</strong> <strong>Motion</strong> Physics 152<br />
Prof: Professor van der Veen<br />
<strong>Lab</strong> Instructors: Ms. Walker, Mr. Stankovich<br />
Figure 1. Horizontal shooting arrangement.<br />
This is the total height through which the ball drops. Last week you timed a ball falling in<br />
free fall from a height of 2 meters. Use this new height to predict the time it will take<br />
this ball to fall hit the ground from this height. Write your calculations and answer<br />
in your lab notebook.<br />
1 y = gt<br />
2<br />
2<br />
t =<br />
Put a piece of masking tape on the floor directly beneath the initial position of the ball in<br />
the shooter, and mark this as x 0 – the initial x position of the ball.<br />
2. Set up to measure the range: Shoot the ball once or twice and estimate where it lands<br />
on the ground. Tape some paper to the floor covering this spot, and over the paper, tape a<br />
piece of carbon paper, face down, so that when the ball hits the carbon paper it will make<br />
marks on the paper.<br />
3. Now shoot the ball 20 times (at least). Be sure to<br />
use the SHORTEST range position of the shooter<br />
each time. Carefully remove the carbon paper, and<br />
you should see a nice cluster of dots on the paper.<br />
With the paper still taped to the floor:<br />
i. Find the center of the cluster – presumably, this<br />
will be the darkest spot!<br />
Figure 2. Circle of dots.<br />
Jatila van der Veen Page 3 6/16/2009
<strong>Lab</strong> 2. <strong>Investigating</strong> <strong>Projectile</strong> <strong>Motion</strong> Physics 152<br />
Prof: Professor van der Veen<br />
<strong>Lab</strong> Instructors: Ms. Walker, Mr. Stankovich<br />
ii. Draw a circle around the center, encompassing the majority of the dots, and a second<br />
circle, concentric to the first, encompassing what looks like 95% of the dots, as<br />
approximated in Figure 2.<br />
iii. Measure x f as shown on the diagram, from the tape which you placed on the floor<br />
DIRECTLY beneath the initial position of the ball, to the center of the cluster of dots.<br />
Write this down in your lab notebook as x final .<br />
4. Now remove the paper from the floor. Measure the radius of each circle. The radius of<br />
the inner circle let's say is our "eyeball σ" and the outer radius we'll say is your 95%<br />
confidence limit. Report your x final as a distance in meters, +/- one "eyeball σ" in cm<br />
in your lab notebook.<br />
5. Now, because the time to hit the floor in freefall is the same as the time to travel this<br />
distance x f you can use your calculated time to fall through y total and your measured x final<br />
to calculate the initial velocity of the ball after it leaves the launcher.<br />
⎡ 2y<br />
⎤<br />
x = vxt<br />
= vx<br />
⎢ ⎥<br />
⎣ g ⎦<br />
x x<br />
vx<br />
= =<br />
t 2y<br />
g<br />
= Show your calculations and<br />
answer in your lab notebook.<br />
This is the total initial velocity, v 0 that we will use in the next section, when we shoot<br />
at an angle.<br />
6. Errors: You have found the approximate error in x as +/- "eyeball σ." Now estimate the<br />
error in your vertical measurement (is it +/- 1 mm = .01 cm? Or what?) which gives you<br />
your approximate error in t…and estimate your total error in v x . What other<br />
approximation have we made?<br />
7. Finally, write all your calculations in a data table, showing measurements and<br />
calculations: Measurements: y, x final Calculations: t, v x<br />
I'm looking for them to write out all the calculations, and put the results in a data table.<br />
Jatila van der Veen Page 4 6/16/2009
<strong>Lab</strong> 2. <strong>Investigating</strong> <strong>Projectile</strong> <strong>Motion</strong> Physics 152<br />
Prof: Professor van der Veen<br />
<strong>Lab</strong> Instructors: Ms. Walker, Mr. Stankovich<br />
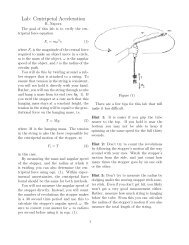
Part 3. Shooting at an angle and predicting the range.<br />
Figure 3. Shooting at an angle above horizontal.<br />
1. Tilt your shooter at 30 0 . Use the attached protractor to measure this angle. Push the<br />
ball into the barrel at the SHORTEST position, and measure the new y position. (It<br />
should be somewhat higher than before.) Again, put a piece of masking tape on the floor<br />
directly beneath this new initial position, to mark the initial x-position. Record these<br />
measurements in your lab notebook.<br />
2. Calculate the horizontal and vertical components of the initial velocity, v x and v y,0:<br />
v<br />
v<br />
x<br />
y,0<br />
= v<br />
0<br />
= v<br />
cosθ<br />
0<br />
sinθ<br />
and record these in your lab notebook<br />
3. Calculations and predictions:<br />
a. Now the ball will have a parabolic path. We know that the horizontal velocity will be<br />
constant across the entire path, until the ball collides with the floor. The vertical velocity<br />
will slow to zero for an instant at the top of the arc, and then increase in the<br />
DOWNWARD direction, until it reaches a maximum downward speed the instant before<br />
it collides with the floor. For the purpose of the following calculations, let's call the<br />
initial y position y 0 = 0, the top of the trajectory y top and the floor –y f .<br />
Jatila van der Veen Page 5 6/16/2009
<strong>Lab</strong> 2. <strong>Investigating</strong> <strong>Projectile</strong> <strong>Motion</strong> Physics 152<br />
Prof: Professor van der Veen<br />
<strong>Lab</strong> Instructors: Ms. Walker, Mr. Stankovich<br />
For the vertical direction: v 0,y = v 0 sin θ and at the top of the trajectory, v top,y = 0.<br />
Using the equations of motion to solve for the distance the ball travels from the<br />
initial y position to the top of the trajectory:<br />
v<br />
v<br />
2<br />
f<br />
f<br />
= v<br />
= 0<br />
2<br />
0<br />
− 2gy<br />
Calculate y, the distance from the initial launch position to the top<br />
of the trajectory, and write all your calculations in your lab<br />
notebook.<br />
b. This total height is the height from which the ball actually falls from rest. Add the<br />
height you calculated in part a to the initial height you measured for the ball in the<br />
launcher, tilted at an angle θ = 30 0 to get the total height.<br />
y total = y initial + y top =<br />
and write this in your notebook.<br />
Now calculate the time to fall this total height:<br />
And write it in your notebook.<br />
t =<br />
2y<br />
total<br />
g<br />
c. Now for the prediction: Using the total time you calculated for this predicted trajectory,<br />
and the horizontal component of the velocity that you calculated #2 above, calculate the<br />
total horizontal distance that this ball *should* travel. Show all your calculations!<br />
x f<br />
=<br />
v<br />
0<br />
cosθt<br />
And put in the expression for time above, to get a prediction.<br />
d. Now for the verification: Measure the distance x f that you calculated from the piece of<br />
tape on the floor. Make a small target with circles of 1σ, 2σ, 3σ radii, where σ is the<br />
distance in cm that you calculated earlier, and tape this to the floor, so that the center of<br />
the target is at your calculated x f . Tape a piece of carbon paper face down on top of your<br />
target, and SHOOT!<br />
e. Shoot 5 times, and then lift up the carbon paper. Did the ball hit the floor within 1σ of<br />
your prediction? 2σ? 3σ? Way out of the ball park? How far off your prediction did it<br />
hit? Put the carbon down again and, keeping everything the same, shoot 5 or 10 more<br />
times, and lift up the carbon. Did you come closer now?<br />
f. Discuss sources of errors. Would you say that the errors were systematic or random? If<br />
systematic, what could you do to minimize them? If random, how could you reduce the<br />
errors?<br />
4. Summary and Conclusions: Now, suppose you are called upon to present this lab<br />
to high school students. Write a summary of this exercise so that a high school kid<br />
could understand the components of projectile motion. Assume that these kids are<br />
sophisticated enough to know trig (sines and cosines). Suggestion: Discuss this with<br />
your lab partner(s). Here they should write a summary, in instruction form, of what they<br />
Jatila van der Veen Page 6 6/16/2009
<strong>Lab</strong> 2. <strong>Investigating</strong> <strong>Projectile</strong> <strong>Motion</strong> Physics 152<br />
Prof: Professor van der Veen<br />
<strong>Lab</strong> Instructors: Ms. Walker, Mr. Stankovich<br />
did, explaining how to find the initial velocity; when you tilt the shooter, you get x and y<br />
components of the initial velocity, how the ball has momentarily zero vertical velocity at<br />
the top, though the x-velocity continues; how the total time to fall is found from the very<br />
top of the trajectory; and how we're neglecting air resistance which, for this little plastic<br />
ball, may be more significant than for the rubber balls we used last time.<br />
Give +2 points for each answer; give +5 points for each graph and +5 for their<br />
measurements of the carbon dots and 1σ, and 95% confidence circle; give 5 points for<br />
each discussion of sources of errors; give +10 points for a good summary which includes<br />
all the points above, and is clearly written…as this tells us if they really understood what<br />
they were doing. Of course, these are the maximum – you can give less if the answers<br />
are insufficient. There is nothing really wrong…the answers will vary, and since I've<br />
written out most of the equations, they can't really get a wrong equation. But – they<br />
should write the equations in their lab notebooks, SOLVE ALL THE ALGEBRA FIRST,<br />
and then write their calculation or prediction.<br />
I did not count everything…please count the total points for all the answers, and give me<br />
a raw score out of the total. I'll turn it into a percentage. Please always give me raw<br />
scores, NOT percentages. Thanks. <br />
It might seem like spoon feeding…but there are a lot of beginners in this class (as<br />
evidenced by the number of people who came to me on Friday wanting help) and I'm a<br />
very classical type of teacher – practice makes perfect, especially for beginners. The<br />
more they practice in the presence of "experts" (you and me) the quicker they'll be able to<br />
do all this on their own.<br />
Try to get them to finish it all in lab, but if they really and truly need to finish at home,<br />
they can write the summary at home and bring it to class the next day (for Tuesday's lab)<br />
or put it in your box the following day. Writing this summary will (or, theoretically<br />
SHOULD) help them understand the principles of this chapter.<br />
Thanks! <br />
Jatila van der Veen Page 7 6/16/2009