Total Safety Management Taylor Woodrow - Constructing Excellence
Total Safety Management Taylor Woodrow - Constructing Excellence
Total Safety Management Taylor Woodrow - Constructing Excellence

You also want an ePaper? Increase the reach of your titles
YUMPU automatically turns print PDFs into web optimized ePapers that Google loves.
Why change - the imperative for improving health and safety<br />
Apart from the obvious, that no employer wants to injure or kill<br />
people, there are sound business reasons for addressing the health<br />
and safety performance of the house building and construction<br />
industry. They are:<br />
■ 1. Poor safety performance is expensive<br />
■ 2. Poor safety performance is an indication of poor management<br />
■ 3. Poor safety performance restricts growth<br />
Three reasons to improve safety performance<br />
Reason 1: Poor safety performance is expensive<br />
Poor safety costs employers through increased claims and<br />
increased insurance premiums. Increasingly both employees and the<br />
public are more likely to turn to litigation as a response to an accident or<br />
injury. Bad employers will find themselves paying directly for uninsurable<br />
losses and indirectly through higher insurance premiums.<br />
The UK government estimates that work-based accidents cost<br />
between 2.1 and 2.6% of GDP each year. This means that by<br />
addressing health and safety the average company could grow<br />
by 2.6%. Given that construction has a higher accident rate than<br />
many other industries this figure will be higher for building firms.<br />
An OFT investigation into the provision of employers’ insurance reported<br />
that in 2002 average premiums for employers’ liability insurance rose by<br />
50 per cent, public and product liability by 30 to 40 per cent and professional<br />
indemnity by 30 to 60 per cent” 1 . There is evidence in the trade press of<br />
individual construction companies facing year-on-year rises of 400% and<br />
above. 2 The DTI, through its ‘Construction Insurance Czar’, Paul Hayward,<br />
has been investigating methods of bringing together insurers and the<br />
industry by understanding construction risks and encouraging insurers to<br />
offer improved terms to employers who take safety seriously. 3<br />
Incidents and accidents interrupt the flow of work and are a cause<br />
of absences. The house building and construction industry experienced<br />
8.7 lost days per employee in 2000 through poor health, thus underperforming<br />
manufacturing (6.9) and retailing (5.8). 4 On average 17 days are<br />
lost for each workplace injury. Minimising accidents in the workplace and<br />
improving occupational health increases the effectiveness of the workforce,<br />
while keeping key workers on site.<br />
The Health and <strong>Safety</strong> Executive has and is calling on powers to<br />
fine construction companies. The penalties open to the HSE for bad<br />
safety performance are significant and, if prosecuted, could put many<br />
medium sized firms out of business and threaten the shareholder value<br />
of larger firms.<br />
Reason 2: Poor safety performance is an indicator of poor management<br />
Good management requires the controlled use of labour to deliver a task.<br />
If the supply of labour is unreliable because workers are being injured then<br />
the work cannot be properly managed. If a manager cannot plan effectively<br />
for safe working then it is unlikely that the same manager can plan effectively<br />
to deliver each programme.<br />
Many of the risks on a construction site can be affected by site management<br />
and have a direct impact on the productivity of the site.<br />
Risk<br />
Fall from height<br />
Trips & slips<br />
Material falling<br />
on workers<br />
Impact with<br />
machinery<br />
Potential<br />
causes<br />
Poor scaffolding.<br />
Unrestrained<br />
exposure to<br />
heights.<br />
Unsupported<br />
ladders.<br />
Untidy sites.<br />
Inappropriate<br />
location of<br />
materials.<br />
Poorly defined<br />
walkways.<br />
Poor stacking<br />
Materials in the<br />
wrong place.<br />
Poor traffic<br />
management.<br />
Potential impact<br />
on productivity<br />
Generally poor or dangerous<br />
access will reduce the flow of<br />
materials to the area of work.<br />
Not defining areas for tools and<br />
materials and safe walkways<br />
hinders the movement of people<br />
and materials around the site.<br />
Poor use of storage results in<br />
damage, inventory losses and<br />
wasted time locating materials.<br />
Plant is obstructed and material<br />
access restricted. People take<br />
longer to move around site as<br />
they are continually avoiding<br />
machinery.<br />
The most productive working environments are often factories where the<br />
uninterrupted flow of work, people and materials is a significant factor. By<br />
cluttering up the construction site and ignoring the flow of work the site is<br />
both more dangerous and less productive.<br />
Reason 3: Poor safety performance restricts growth<br />
Restrictions on labour<br />
The skills shortages in the house building and construction industry mean that<br />
increasingly, skilled people will have the capacity to be more discriminating<br />
about the sites on which they work, and they may well choose not to work<br />
on sites or with employers with a bad health and safety record. If a company<br />
has poor credentials it is likely to face difficulty attracting the most skilled<br />
people, with an impact on the quality and speed of work.<br />
Restrictions on investment<br />
For large companies, Corporate Social Responsibility is becoming high on the<br />
agenda of institutional investors. For smaller companies banks and finance<br />
houses are likely to look at the safety record as one of the criteria for lending,<br />
particularly when this record threatens profit of either the company or the job.<br />
Restrictions on risk<br />
The nature of work available to companies with a poor safety record will<br />
reduce. Companies with a poor safety record are unlikely to be able to<br />
secure insurance for high risk work. Given that falls from height are<br />
deemed as high risk and that much domestic refurbishment involves working<br />
above 2m then this trend could impact on the smallest construction firms.<br />
How significant is this problem<br />
The house building and construction industry has a worse record<br />
than many other industries in health and safety which is costing<br />
large amounts of money and is not covered by insurance.<br />
The figures on the house building and construction industry’s health and<br />
safety record are well publicised and the lowlights are listed below.<br />
■ There were 79 house building and construction industry fatalities in<br />
2001/2 and 2,580 reportable injuries. 5<br />
■ The fatality rate was 6.0 deaths per 100,000 employees, in 2001. This<br />
compared favourably to agriculture in that year (8.0), but unfavourably<br />
to extraction/utilities (4.7), manufacturing (1.2), and services (0.4). 6<br />
■ The rate of fatal and major injuries stood at 383 per 100,000 in 2001.<br />
This is worse than agriculture (239.3), manufacturing (195.0),<br />
extractive/utilities (248.5) and services (75.0)<br />
■ The rate of “over three day” injuries was 841 per 100,000 employees<br />
in 2001, this is considerably worse than agriculture (621.9) and services<br />
(422.3) but better than manufacturing (1003.4) and extractive/utilities<br />
(1,281.3). It may also be understated as the industry is one of the<br />
worst for reporting.<br />
■ Fatalities are more likely for older workers and fall from height is the<br />
commonest reason for fatal and major injuries. Steel erectors, crane<br />
drivers and cladders are most likely to be fatally injured in their work,<br />
proportionate to their number. But site workers and general craftsmen<br />
have the most fatalities in absolute terms.<br />
The economic costs of injury to the industry<br />
The HSE calculates the direct economic cost of poor safety at £82 million<br />
per year; this excludes insurance premiums.<br />
Type of incident Average Cost Number occurring <strong>Total</strong> Cost<br />
Serious or Major<br />
£18,531<br />
4000 £74,124,000<br />
Over 3 Day<br />
£562<br />
9000 £5,058,000<br />
HSE Convictions<br />
£7,594<br />
431 £3,273,014<br />
<strong>Total</strong><br />
£82,455,014<br />
The impact of insurance<br />
Insurance does not mitigate the cost of injury and accident.<br />
Many employers believe that most incident costs are covered by insurance.<br />
The reality is usually the opposite as insurance policies don’t cover everything.<br />
They may only pay for serious injuries or damage, or the policy<br />
excess may be greater than the individual amounts concerned. The most<br />
obvious cost is from a person taking time away from work. But there are<br />
other costs too. Often these are not readily apparent from the balance<br />
sheet. Costs typically not covered by insurance are:<br />
■ Lost time ■ Production delays ■ Loss of contracts<br />
■ Investigation time ■ Sick pay ■ Fines ■ Legal costs<br />
■ Repairs to plant and equipment ■ Loss of business reputation<br />
■ Damage or loss of product and raw materials<br />
■ Extra wages, overtime working and temporary labour<br />
HSE estimates that the ratio of insured to uninsured losses ranges between<br />
1:8 and 1:36 i.e. for every £1 covered by insurance the company may<br />
have lost as much as £36 in uninsured costs and other losses.<br />
The business rationale for the programme within <strong>Taylor</strong> <strong>Woodrow</strong><br />
The case for health and safety is, for <strong>Taylor</strong> <strong>Woodrow</strong>, simple: they want<br />
their sites to be a place where people can work and near to which the<br />
public can live without risk of injury or death. Achieving this ensures that:<br />
■ 1. They can operate without fear of prosecution or work being stopped<br />
unnecessarily by failures in safety.<br />
■ 2. Claims, delays and injury relating to safety and health do not add<br />
costs and delay programmes.<br />
■ 3. TW sites gain the reputation amongst employees and subcontractors<br />
as a safe and productive place to work.<br />
Together this ensures the reputation of the company on which its position<br />
in the market place depends.<br />
<strong>Taylor</strong> <strong>Woodrow</strong> has however gone further and quantified the business<br />
rationale. It measures the adherence to safety standards of each development<br />
and tracks this against the commercial performance of the job.<br />
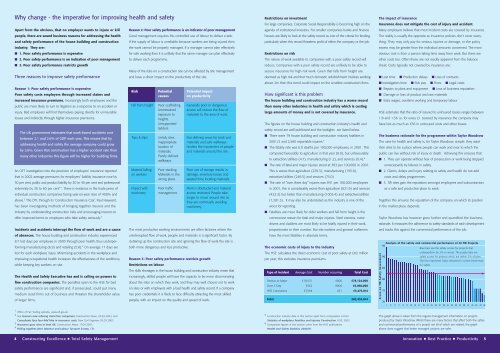
Analysis of the safety and commercial performance of 49 TW Projects<br />
95<br />
Blue bars are the safety scores for projects that<br />
Score on TW <strong>Safety</strong> Assessment<br />
90<br />
85<br />
80<br />
75<br />
70<br />
underperform by 2% or worse. The purple bars are<br />
safety scores for projects which are within 2% of plan.<br />
The line represents <strong>Taylor</strong> <strong>Woodrow</strong>’s current benchmark<br />
for safety.<br />
1 3 5 7 9 11 13 15 17 19 21 23 25 27 29 31 33 35 37 39 41 43 45 47 49<br />
1 Office of Fair Trading website, www.oft.gov.uk<br />
2 See Insurers now refusing claim-free companies Construction News, 20.02.2003, and<br />
5 Construction industry data in this section apart from comparators is from<br />
Consultants face four-fold hike in insurance costs, New Civil Engineer 20.03.2003.<br />
Statistics of workplace fatalities and injuries Construction, HSE, 2003.<br />
3 Insurance guru aims to heal rift, Construction News, 17.04.2003.<br />
6 Comparator figures in this section come from the HSE publications<br />
4 Pulling together:2001 Absence and Labour Turnover Survey, CBI. Health and <strong>Safety</strong> Statistics 2000/01.<br />
The graph above is taken from the regular management information on projects<br />
produced by <strong>Taylor</strong> <strong>Woodrow</strong>. Whilst there are many factors that affect both the safety<br />
and commercial performance of a project not all of which are related, the graph<br />
above does suggest that better managed projects are safer.<br />
4 <strong>Constructing</strong> <strong>Excellence</strong> ■ <strong>Total</strong> <strong>Safety</strong> <strong>Management</strong><br />
Innovation ■ Best Practice ■ Productivity 5