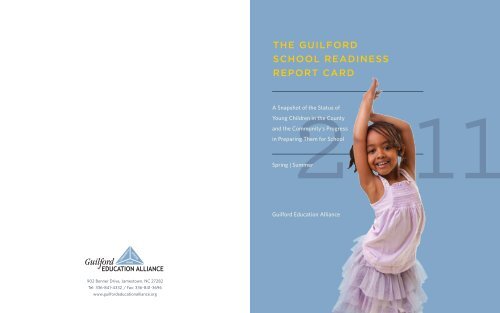
the guilford school readiness report card - Guilford Education Alliance
the guilford school readiness report card - Guilford Education Alliance
the guilford school readiness report card - Guilford Education Alliance

You also want an ePaper? Increase the reach of your titles
YUMPU automatically turns print PDFs into web optimized ePapers that Google loves.
THE GUILFORD<br />
SCHOOL READINESS<br />
REPORT CARD<br />
A Snapshot of <strong>the</strong> Status of<br />
Young Children in <strong>the</strong> County<br />
and <strong>the</strong> Community’s Progress<br />
in Preparing Them for School<br />
Spring | Summer<br />
<strong>Guilford</strong> <strong>Education</strong> <strong>Alliance</strong><br />
902 Bonner Drive, Jamestown, NC 27282<br />
Tel: 336-841-4332 / Fax: 336-841-3696<br />
www.<strong>guilford</strong>educationalliance.org
THE GUILFORD<br />
SCHOOL READINESS<br />
REPORT CARD<br />
A Snapshot of <strong>the</strong> Status of Young Children in <strong>the</strong> County and<br />
<strong>the</strong> Community’s Progress in Preparing Them for School<br />
Spring | Summer<br />
<strong>Guilford</strong> <strong>Education</strong> <strong>Alliance</strong>
PURPOSE<br />
CONTEXT OF THE REPORT<br />
THE GUILFORD SCHOOL READINESS REPORT CARD<br />
4<br />
201 1<br />
The purpose of <strong>the</strong> School Readiness Report Card is<br />
to provide data on <strong>the</strong> health and well being of young<br />
children in <strong>Guilford</strong> County, and to assess <strong>the</strong><br />
community’s strengths and challenges in preparing<br />
our children for <strong>school</strong>. The intent of <strong>the</strong> Report Card<br />
is to help policy makers, community leaders, service<br />
providers, and concerned citizens identify areas in<br />
need of intervention, develop or improve prevention<br />
programs and services, reduce barriers in access to<br />
needed services, and monitor progress and trends<br />
over time. The indicators used in <strong>the</strong> Report Cards<br />
draw primarily on administrative data routinely<br />
collected by <strong>the</strong> service community on system<br />
performance (e.g. number of children receiving<br />
specific services), and individual-level information on<br />
child development. The <strong>report</strong> also draws on findings<br />
from regional and national surveys that collect<br />
information on <strong>the</strong> attitudes, characteristics or<br />
behaviors of a sample to make conclusions about<br />
a larger group of people. The content of <strong>the</strong> <strong>report</strong><br />
focuses on <strong>Guilford</strong> County although state indicators<br />
are presented for comparison.<br />
The 2011 Report Card builds on <strong>the</strong> first <strong>report</strong><br />
published in 2007, but focuses on data for <strong>the</strong><br />
2009/2010 <strong>school</strong> year and places additional<br />
emphasis on early literacy as a foundation for later<br />
<strong>school</strong> success. Copies of <strong>the</strong> 2007 Report Card are<br />
available at: http://www.<strong>guilford</strong>educationalliance.<br />
org/resources/documents/2007/2007-School-<br />
Readiness-Report-Card.pdf.<br />
The Report Card is being written at a time of social<br />
and policy change that is creating both challenges and<br />
opportunities for those focused on providing <strong>school</strong><br />
<strong>readiness</strong> support to young children and <strong>the</strong>ir families<br />
in our county. How <strong>the</strong> community responds to <strong>the</strong>se<br />
changes has important implications for families with<br />
young children, <strong>the</strong> transition to <strong>school</strong>, academic<br />
achievement, and later success. These changes are<br />
outlined below.<br />
1. FAMILY POVERTY. In 2009 <strong>Guilford</strong> County<br />
was home to close to 114,000 children aged 17 years<br />
and under, about one-third of whom were under 6<br />
years old. As in o<strong>the</strong>r parts of <strong>the</strong> state, <strong>Guilford</strong><br />
County has been affected by <strong>the</strong> recession and<br />
many families have experienced drops in income<br />
and financial instability. For example, in 2009 <strong>the</strong><br />
proportion of children in poverty was 22.1% (up from<br />
20.5% in 2007). A new trend is an increase in <strong>the</strong><br />
proportion of grandparents with primary care-giving<br />
responsibility for <strong>the</strong>ir grandchildren i . According<br />
to <strong>the</strong> Census, 56.6% of grandparents in <strong>Guilford</strong><br />
County had varying levels of responsibility for <strong>the</strong>ir<br />
grandchildren, and 6.8% lived with a grandchild ii .<br />
The costs associated with caring for grandchildren<br />
(and sometimes adult children) can place a burden<br />
on grandparents on a fixed income and with few<br />
prospects of re-entering <strong>the</strong> workforce. As in o<strong>the</strong>r<br />
parts of <strong>the</strong> country, rates of poverty were highest<br />
for female householder families (21%), families<br />
with children under 18 years old (21%), and racial<br />
and ethnic minorities (Native American at 46.6%,<br />
Hispanics at 27.3%, African American at 25.1%) iii iv .<br />
2. FAMILY AND CHILD DIVERSITY.<br />
<strong>Guilford</strong> County has a racially and ethnically diverse<br />
population, and children in <strong>Guilford</strong> County Schools<br />
(K-12) represent 142 ethnic and cultural backgrounds<br />
and speak 150 dialects or languages v . Much of<br />
<strong>the</strong> change in <strong>the</strong> racial and ethnic diversity of our<br />
<strong>school</strong>s has occurred in <strong>the</strong> last decade and is due to<br />
an increase in <strong>the</strong> number of children of immigrant<br />
newcomers. Unlike o<strong>the</strong>r regions of <strong>the</strong> country,<br />
sou<strong>the</strong>rn states do not have a history of immigration<br />
and are challenged in responding to this new reality.<br />
Although immigrants have diverse backgrounds and<br />
trajectories (e.g. educational attainment, country of<br />
origin, reasons for coming, languages spoken, and<br />
pre-immigration experience), children in immigrant<br />
families are more likely to experience poverty<br />
than <strong>the</strong>ir native-born and non-minority peers.<br />
Fur<strong>the</strong>rmore, immigrants and <strong>the</strong>ir children face <strong>the</strong><br />
additional challenge of learning a new language and<br />
culture, and adapting to new norms about adult-child<br />
vi vii<br />
and family <strong>school</strong> (or institutional) interactions.<br />
TABLE 1: CHILD AND ADULT DEMOGRAPHICS<br />
Effective <strong>school</strong> <strong>readiness</strong> efforts must be responsive<br />
to <strong>the</strong> social, cultural, and linguistic backgrounds of<br />
families and children.<br />
3. BUDGET SHORTFALLS. State policymakers<br />
play an important role in allocating funding for <strong>school</strong><br />
<strong>readiness</strong> efforts. More at Four and Smart Start are<br />
two State funded early care and education programs<br />
that provide quality services to children and have<br />
been shown to improve test scores and reduce <strong>the</strong><br />
achievement gap between low-and middle-income<br />
children. viii However, budget cuts introduced in <strong>the</strong><br />
last three years are challenging <strong>the</strong> system. In 2009-<br />
2010 <strong>the</strong> North Carolina Public School biennial budget<br />
was cut by 12.6% and in 2010/2011 it was cut by an<br />
additional 2.73%. ix In June 2011 <strong>the</strong> North Carolina<br />
General Assembly approved a budget that cut funding<br />
for <strong>the</strong> More at Four and Smart Start programs by 20%.<br />
Domain Indicators <strong>Guilford</strong> County North Carolina<br />
Demographics<br />
Race and Ethnicity:<br />
Total Child Population<br />
Total population a 480,362 9,380,884<br />
Children aged 0-17 in households (i.e. total child population) a 113,938 2,268,183<br />
Children aged 0-2 years as a proportion of <strong>the</strong> total child population a 17.80% 17.20%<br />
Children aged 3-4 years as a proportion of <strong>the</strong> total child population a 10.70% 11.60%<br />
Children aged 5 years as a proportion of <strong>the</strong> total child population a 5.00% 5.50%<br />
Children aged 0-5 in households a 38,185 777,897<br />
White a* 51.50% 63.80%<br />
Black a* 35.80% 23.10%<br />
THE GUILFORD SCHOOL READINESS REPORT CARD<br />
5<br />
201 1<br />
O<strong>the</strong>r racial minority, including bi- or multi-racial a* 12.70% 13.10%<br />
Hispanic or Latino (any race) a 9.50% 12.80%<br />
a denotes data for 2009; * May include respondents who also identified as Hispanic
SCHOOL READINESS EQUATION<br />
READY FAMILIES<br />
THE GUILFORD SCHOOL READINESS REPORT CARD<br />
6<br />
201 1<br />
School entry is a major transition for children aged<br />
4- to 5-years old, and to be successful, children<br />
must be equipped to deal with <strong>the</strong> demands of <strong>the</strong><br />
<strong>school</strong> environment. Children’s ability to meet <strong>the</strong>se<br />
demands and succeed in <strong>school</strong> depends to some<br />
extent on <strong>the</strong>ir own characteristics and abilities,<br />
but also depends on <strong>the</strong>ir preparation at home,<br />
<strong>the</strong>ir child-care experiences, and <strong>the</strong>ir exposure to<br />
broader opportunities that encourage exploration<br />
and learning. x In o<strong>the</strong>r words, preparation for <strong>school</strong><br />
begins at birth, and research shows that investments<br />
in children during <strong>the</strong> early years have long-term<br />
effects on child health, social and<br />
emotional development, and <strong>school</strong><br />
success. xi However not all children<br />
start <strong>school</strong> ready to succeed.<br />
Children from low-income families<br />
are more likely than <strong>the</strong>ir middleincome<br />
peers to start <strong>school</strong><br />
with lower language proficiency<br />
and lags in social-emotional<br />
development (e.g. lowered<br />
capacity to control behavior)<br />
that interfere with learning.<br />
Achievement gaps that<br />
become apparent in<br />
kindergarten tend to<br />
Research<br />
xii xiii<br />
widen over time.<br />
shows that efforts to improve <strong>school</strong><br />
<strong>readiness</strong> should focus both on children and <strong>the</strong>ir<br />
environments of life (namely, families, communities,<br />
and <strong>school</strong>s). Consistent with this view, <strong>the</strong> Report<br />
Card uses an equation developed by <strong>the</strong> School<br />
Readiness Indicators Initiative and a set of variables<br />
identified by a committee of early childhood<br />
professionals led by <strong>the</strong> North Carolina Division<br />
of Public Health and <strong>the</strong> North Carolina Pediatrics<br />
Society. <strong>Guilford</strong> <strong>Education</strong> <strong>Alliance</strong> used <strong>the</strong>se<br />
indicators as <strong>the</strong> basis for <strong>the</strong> first School Readiness<br />
Report Card in 2007:<br />
READY FAMILIES: ability of families to<br />
provide developmental opportunities for<br />
children.<br />
+<br />
READY COMMUNITIES: range and<br />
quality of resources and supports available to<br />
families with young children.<br />
+<br />
READY SCHOOLS: critical<br />
elements of <strong>school</strong>s that influence<br />
child development and <strong>school</strong><br />
success.<br />
=<br />
READY CHILDREN:<br />
acquisition of basic skills<br />
and characteristics that<br />
influence <strong>school</strong> success.<br />
TABLE 2: READY FAMILIES INDICATORS<br />
Domain Indicators <strong>Guilford</strong> County North Carolina<br />
Parenting<br />
The well being of young children is largely determined<br />
by <strong>the</strong>ir family, however not all parents and caregivers<br />
have <strong>the</strong> resources to provide optimal developmental<br />
opportunities for <strong>the</strong>ir children. Research shows that it<br />
is not <strong>the</strong> presence of a single risk factor, but exposure<br />
to multiple and complex risk factors over time<br />
that increases <strong>the</strong> likelihood of poor outcomes for<br />
children. xiv Vulnerable families benefit from supports<br />
such as learning opportunities for young children,<br />
social support for parents, and basic services. In <strong>the</strong><br />
words of one parent:<br />
Adults functioning at below basic literacy levels<br />
(or functioning at basic literacy levels) b 11-19% (25%) 14-22% (32%)<br />
Children 0-5 who are read to every day e n/a 54.6<br />
# Homeless children aged 3-5 b 53 in pre-K<br />
and 156 in K<br />
227 in pre-K<br />
and 991 in K<br />
# Homeless students (all grade levels) a 2,330 21,300<br />
Food insecurity rate (total population) b 19.20% 18.20%<br />
# Children aged 0-4 years in food insecure households a 5,926 246,877<br />
Language diversity a 11.20% 10%<br />
Linguistic isolation (among those who speak a language<br />
o<strong>the</strong>r than English) a 29.20% 25.70%<br />
Maternal Risk Factors Births to mo<strong>the</strong>rs with less than 12 years of education d 1,286 (20.9%) 26,980 (21.3%)<br />
Teen (15-17) pregnancy rates (per 1,000) g 31 33.6<br />
Low birth weight (i.e. less than 5 lbs 8 oz.) a 9.60% 9.10%<br />
Mo<strong>the</strong>rs who used alcohol before, during, and after pregnancy d 4.10% 6.90%<br />
Mo<strong>the</strong>rs who experienced abuse around pregnancy 4.20% 4.90%<br />
Mo<strong>the</strong>rs who smoked before, during, and after pregnancy 8.10% 12.30%<br />
Mo<strong>the</strong>rs who do not have someone to talk to about problems d 14.60% 14.10%<br />
Mo<strong>the</strong>rs <strong>report</strong>ing depression after delivery d 123 (12.1%) 475 (10.9%)<br />
Child Maltreatment Children (all ages) with finding in need of services a 7.80% 8.80%<br />
Children aged 0-5 with substantiated abuse/neglect <strong>report</strong>s a n/a 11,665 (47.6%)<br />
“ ”<br />
I want <strong>the</strong> best for my children,<br />
a denotes data for 2009 or 2009/2010; b data for 2011 or 2010/2011; c data for 2008 or 2008/2009; d data for 2006-2008; e data for 2007; f data for 2007-2009; g 2005-2009<br />
but on this journey we need teachers<br />
and parents working toge<strong>the</strong>r. I don’t<br />
really understand what is involved<br />
or how we can cross borders.<br />
• PARENTING. Research shows that parents<br />
experiencing financial strain and associated<br />
outcomes (such as homelessness) have access<br />
to fewer resources, limited discretionary time to<br />
structure and participate in activities and intervene<br />
THE GUILFORD SCHOOL READINESS REPORT CARD<br />
7<br />
201 1
READY COMMUNITIES<br />
on behalf of <strong>the</strong>ir children, and are less able to provide<br />
long-term planning, stability, and permanency for<br />
It is difficult to chart <strong>the</strong> progress of families since<br />
2007 both because <strong>the</strong> current Report Card uses<br />
TABLE 3: INDICATORS OF READY COMMUNITIES<br />
THE GUILFORD SCHOOL READINESS REPORT CARD<br />
8<br />
201 1<br />
<strong>the</strong>ir children. Similarly, studies show that children<br />
in low-income families and families with low levels<br />
of literacy are spoken to and read to less frequently<br />
than <strong>the</strong>ir middle class peers and <strong>the</strong>refore start<br />
<strong>school</strong> with a disadvantage. xv Finally, studies show<br />
that children of foreign-born parents who speak a<br />
language o<strong>the</strong>r than English at home are less likely to<br />
be enrolled in pre<strong>school</strong> and <strong>the</strong>refore less proficient<br />
in English when <strong>the</strong>y start <strong>school</strong> compared to <strong>the</strong>ir<br />
native born-counterparts. xvi<br />
• MATERNAL RISK FACTORS. The health and<br />
circumstances of mo<strong>the</strong>rs influence child health and<br />
development. Compared to <strong>the</strong>ir older counterparts,<br />
teen mo<strong>the</strong>rs tend to have fewer financial and<br />
social resources, and parenting skills to ensure <strong>the</strong><br />
healthy development of <strong>the</strong>ir children. Children of<br />
teen mo<strong>the</strong>rs are more likely to be born with low<br />
birth weight, have poor health, experience behavior<br />
problems, and have limited language and literacy<br />
skills. Additionally, mo<strong>the</strong>rs who are socially isolated,<br />
depressed, or who continuously use alcohol or<br />
tobacco are less able to provide healthy, supportive,<br />
and stable home and learning environments and <strong>the</strong>ir<br />
children are more likely to develop social-emotional<br />
problems and problems at <strong>school</strong>. xvii<br />
• CHILD MALTREATMENT. Children who are<br />
abused or neglected are more likely to have social,<br />
emotional, and cognitive problems, poor outcomes in<br />
<strong>school</strong> and have higher levels of antisocial behavior<br />
(e.g. delinquency) than <strong>the</strong>ir peers who do not<br />
several new indicators and because (o<strong>the</strong>r than <strong>the</strong><br />
census) <strong>the</strong>re are few comprehensive and ongoing<br />
sources of data on families in our community.<br />
Regardless, examination of <strong>the</strong> ready family indicators<br />
suggests less than a 1% change since 2007 in health<br />
outcomes (live births, children entering kindergarten<br />
with up-to-date immunizations), maternal risk factors<br />
(teen pregnancy, and births to mo<strong>the</strong>rs with fewer<br />
than 12 years education). In contrast, results of <strong>the</strong><br />
Pregnancy Risk Assessment Monitoring System<br />
(PRAMS) survey suggest a possible increase between<br />
2002/2004 and 2006/2008 in continuous alcohol<br />
use by pregnant women (+1.0%) and mo<strong>the</strong>rs with<br />
no-one to talk to about <strong>the</strong>ir problems (+4.1%); and a<br />
decrease in <strong>the</strong> proportion of mo<strong>the</strong>rs who experience<br />
abuse (-2.2%).<br />
More importantly, <strong>the</strong> indicators point to a relatively<br />
small number of children and families with multiple<br />
and complex needs associated with poverty such<br />
as homelessness and food insecurity. In fact recent<br />
Census <strong>report</strong>s point to an increasing number of<br />
families (in contrast to single persons) experiencing<br />
homelessness. Homeless children have much higher<br />
rates of learning disabilities and emotional problems<br />
than non-homeless children, and are more likely to<br />
experience family separation. xviii In addition, hungry<br />
children have higher rates of illness and growth<br />
impairment that affects <strong>the</strong>ir physical, intellectual,<br />
academic, and emotional development. xix<br />
Domain Indicators <strong>Guilford</strong> County North Carolina<br />
Poverty<br />
Children enrolled in pre<strong>school</strong> living in households below<br />
<strong>the</strong> poverty levela<br />
Children enrolled in kindergarten living in households below<br />
<strong>the</strong> poverty levela<br />
17.40% 18.30%<br />
29.40% 23.60%<br />
Elementary <strong>school</strong> children applying for free or reduced lunch a 63.00% 59.80%<br />
Children (K-12) enrolled in free or reduced lunch a 55.00% 53.70%<br />
Neighborhoods Neighborhood crime index (per 100,000 people) a 2,096 4,178<br />
Health<br />
Early Care and <strong>Education</strong><br />
Opportunities<br />
Neighborhood amenities e n/a 60.20%<br />
Neighborhood safety e n/a 89.90%<br />
Neighborhood support e n/a 82.60%<br />
Live births where mo<strong>the</strong>r received adequate or more than<br />
adequate prenatal care c 87.70% 78.80%<br />
Children who received immunizations by age 2 a 50% 78.30%<br />
Children entering kindergarten with up-to-date immunizations a 96.40% 96.50%<br />
Percent children born at a healthy birth weight<br />
(i.e. 2501 to 8165 grams) a 90.40% 90.90%<br />
Children 0-5 with a regular source of primary care e n/a 69.00%<br />
Children 0-5 without health insurance f n/a 4.30%<br />
Children under 19 without health insurance e 11.10% 12.30%<br />
Use of primary care by children aged 0-5 a 78% 76%<br />
Children 0-5 with elevated blood lead levels a 0.40% 0.40%<br />
Children 0-2 in early intervention for developmental delay a 4.80% 4.80%<br />
Children 3-5 in early intervention for developmental delay a 5.00% 5.00%<br />
# Children 3 and 4-years being served with an IEP a 619 12,363<br />
# Pre<strong>school</strong> regulated care centers a 305 4,983<br />
Percent pre-<strong>school</strong> regulated child care centers with<br />
4 or 5 stars a 46.60% 52.30%<br />
Percent children aged 0-5 in care who attend 4 to 5<br />
star centers a 61% 63%<br />
# Pre<strong>school</strong> children aged 0-5 in 4 to 5 star centers a 8,412 141,326<br />
# Children 0-5 receiving child care subsidies a 4,769 87,695<br />
THE GUILFORD SCHOOL READINESS REPORT CARD<br />
9<br />
201 1<br />
experience maltreatment.<br />
Percent children 0-5 receiving child care subsidies who<br />
are in 4-5 star programs a 78% 74%<br />
Children eligible for child care subsidy but on a waiting list<br />
(yearly range) a 2,413-1,429 41,424-35,726<br />
TABLE CONTINUED ON PAGE 10…
…TABLE CONTINUED FROM PAGE 9.<br />
Domain Indicators <strong>Guilford</strong> County North Carolina<br />
results show improvements in <strong>the</strong> quality of early care<br />
Smart Start, provides comprehensive early care and<br />
THE GUILFORD SCHOOL READINESS REPORT CARD<br />
10<br />
201 1<br />
Early Care<br />
and <strong>Education</strong><br />
Opportunties<br />
Aspects of community that support parents and are<br />
important to early childhood development and <strong>school</strong><br />
<strong>readiness</strong> include poverty levels, supports for families<br />
and young children (including health care services),<br />
and early care and educational opportunities.<br />
• POVERTY. As mentioned earlier, <strong>the</strong>re is a link<br />
between economic disadvantage and children’s<br />
developmental and educational outcomes. xx Children<br />
who start <strong>school</strong> with a disadvantage have fewer<br />
chances of catching up with <strong>the</strong>ir peers.<br />
# Children enrolled in pre-<strong>school</strong> (public and private) a 10,572 185,230<br />
# Children enrolled in kindergarten, 2-month <strong>report</strong> (public) a 4,984 108,526<br />
Percent low-income children enrolled in subsidized early care and<br />
education programs a 63% 55%<br />
Percent children 0-5 in 1-5 star programs with at least 5 lead<br />
teacher education points a 46% 59%<br />
Percent children 0-5 in 1-5 star programs with at least 5<br />
administrator education points a 62% 69%<br />
a denotes data for 2009 or 2009/2010; b data for 2011 or 2010/2011; c data for 2008 or 2008/2009; d data for 2006-2008; e data for 2007; f data for 2007-2009<br />
• NEIGHBORHOODS. Living in a safe, resourcerich,<br />
supportive neighborhood and a clean, nonhazardous<br />
environment can contribute to <strong>the</strong><br />
successful development of children. Parents who<br />
feel safe are more likely to interact with members<br />
of <strong>the</strong> community and explore <strong>the</strong>ir environments.<br />
In addition, neighborhoods offer varying levels of<br />
amenities (such as parks, sidewalks, libraries) that<br />
influence how parents structure <strong>the</strong> lives of <strong>the</strong>ir<br />
children. Parents in neighborhoods with high levels<br />
of social support are more likely to be involved in<br />
community and after-<strong>school</strong> activities than parents<br />
in neighborhoods with low levels of support. xxi<br />
Finally, children in communities with older or<br />
dilapidated buildings and who are exposed to lead<br />
paint, or contaminated air or water are more likely<br />
to have elevated blood lead levels and asthma that can<br />
cause behavioral, developmental, and health problems<br />
that interfere with learning.<br />
• HEALTH. Ready communities provide accessible<br />
and comprehensive health care services for children<br />
and families (such as health insurance, prenatal care,<br />
preventative health services, early screening for illness<br />
and developmental delay) to ensure that children enter<br />
<strong>school</strong> healthy and ready to learn.<br />
• EARLY CARE AND EDUCATION<br />
OPPORTUNITIES. Ready communities provide<br />
a network of early care and education opportunities.<br />
The quality of care and <strong>the</strong> relationships between<br />
caregivers/educators and children influence how<br />
children develop socially and emotionally, and acquire<br />
early literacy and language skills.<br />
Examination of <strong>the</strong> indicators suggests a decrease in<br />
<strong>the</strong> number of uninsured children in <strong>the</strong> state but no<br />
or little (i.e. less than 1%) change in o<strong>the</strong>r <strong>Guilford</strong><br />
County health indicators since 2007. Although ready<br />
community indicators are not always available or<br />
comparable (i.e. from different sources, and using<br />
different measurement and <strong>report</strong>ing criteria) <strong>the</strong><br />
and education services, and <strong>the</strong>ir use by vulnerable<br />
children. Specifically, <strong>the</strong>re has a been steady increase<br />
in <strong>the</strong> proportion of quality (i.e. 4- and 5-star rating)<br />
child-care centers and <strong>the</strong> qualifications of lead<br />
teachers. There has also been an increase both in<br />
<strong>the</strong> number of children receiving child-care subsidies<br />
and <strong>the</strong> number of children on <strong>the</strong> waiting list for<br />
subsidy support. In spite of <strong>the</strong>se trends, and based<br />
on <strong>the</strong> Performance Based Incentive System standards<br />
(PBIS) managed by <strong>the</strong> North Carolina Partnership<br />
for Children, Inc., in 2009/2010 <strong>Guilford</strong> County<br />
was above minimum—but below high performing—<br />
standards in <strong>the</strong> number of children in low-income<br />
families in subsidized care, and in <strong>the</strong> provision of<br />
early intervention services for children aged 0-5<br />
years with developmental delays. The county<br />
exceeded high performing standards in <strong>the</strong> proportion<br />
of child placements (both <strong>the</strong> general population<br />
and children receiving subsidized care) attending<br />
quality programs, and <strong>the</strong> qualifications of child-care<br />
center directors. The county scored below minimum<br />
standards in lead teacher education points.<br />
North Carolina has pioneered initiatives that seek to<br />
improve <strong>the</strong> quality, accessibility, and affordability<br />
of early care and education for all children including<br />
those who are vulnerable because of low income,<br />
social or linguistic isolation, and /or developmental<br />
challenges. Programs for vulnerable children include,<br />
but are not limited to, federally funded Head Start and<br />
Title I pre-K programs, and state-funded More at Four<br />
and Smart Start. In 2009/2010 More at Four served<br />
2,501 children in <strong>Guilford</strong> County and 34,511 children<br />
statewide, 51% of <strong>the</strong> More at Four children were<br />
served in public <strong>school</strong> settings, 28% in Head Start<br />
settings, and <strong>the</strong> remaining 21% in private centers. xxii<br />
education, health care, and family support services<br />
for all children from birth to age 5.<br />
Studies and community assessments conducted<br />
in <strong>the</strong> past 5 years point to a wealth of parenting<br />
and early intervention and education programs in<br />
<strong>Guilford</strong> County, and a wide range of services offered<br />
to vulnerable populations. However, some of <strong>the</strong><br />
challenges identified by <strong>the</strong>se studies include, but<br />
are not limited to: (a) lack of formalized coordination<br />
among programs; (b) lack of visibility and limited<br />
access to programs for <strong>the</strong> most vulnerable families<br />
(i.e. information and transportation) (c) need for<br />
programs that streng<strong>the</strong>n <strong>the</strong> ability of parents to<br />
intervene and advocate on behalf of <strong>the</strong>ir families<br />
and children; (d) need for systems of care that take<br />
into account <strong>the</strong> comprehensive needs of families<br />
ra<strong>the</strong>r than systems that respond to single and<br />
isolated needs. Studies fur<strong>the</strong>r point to <strong>the</strong> need for<br />
greater accessibility to mental health assessment and<br />
interventions for parents and children, and increased<br />
cultural competency in service provision to diverse<br />
xxiii xxiv<br />
families and children.<br />
READY SCHOOLS<br />
Ready <strong>school</strong>s work with families, services, and childcare<br />
programs to ensure a successful transition, and<br />
provide safe, structured, culturally and linguistically<br />
sensitive, and developmentally appropriate<br />
opportunities for learning. xxv Ready <strong>school</strong>s target all<br />
children but also provide quality services for children<br />
who are most at-risk due to low-income, social or<br />
linguistic isolation, and/or developmental challenges.<br />
In addition, ready <strong>school</strong>s draw on evidencebased<br />
practice and document <strong>the</strong>ir ability to meet<br />
THE GUILFORD SCHOOL READINESS REPORT CARD<br />
11<br />
201 1
TABLE 4: INDICATORS OF READY SCHOOLS<br />
READY CHILDREN<br />
Domain Indicators <strong>Guilford</strong> County North Carolina<br />
TABLE 5: INDICATORS OF READY CHILDREN<br />
THE GUILFORD SCHOOL READINESS REPORT CARD<br />
Early Language<br />
and Literacy<br />
Care and <strong>Education</strong><br />
Opportunities<br />
Kindergartners at or above literacy benchmarks using DIBELS<br />
beginning of <strong>school</strong> year (and end of <strong>school</strong> year) scores b 65% (87%) n/a<br />
First graders at or above literacy benchmarks using DIBELS<br />
beginning of <strong>school</strong> year (and end of <strong>school</strong> year) scores b 83% (73%) n/a<br />
Second graders at or above literacy benchmarks using DIBELS<br />
beginning of <strong>school</strong> year (and end of <strong>school</strong> year) scores b 65% (65%) n/a<br />
Students at or above level on End of Grade (EOG) 3<br />
reading achievement a 63.60% 66.40%<br />
Kindergartners in early intervention for developmental delay a/b n/a 11,363<br />
a denotes data for 2009 or 2009/2010; b data for 2011 or 2010/2011; c data for 2008 or 2008/2009; d data for 2006-2008; e data for 2007; f data for 2007-2009.<br />
established and measureable performance standards.<br />
• EARLY LANGUAGE AND LITERACY.<br />
<strong>Education</strong>al institutions are paying increased<br />
attention to reading, reading education, and early<br />
literacy as contributors to <strong>school</strong> achievement.<br />
Research shows that a child’s ability to decode words<br />
and use language is related to later achievement<br />
in reading, writing, and spelling. Children who are<br />
not proficient in reading by 3rd grade are more<br />
likely to have difficulty learning, be truant, have<br />
emotional and behavior problems, and have lower<br />
average in fall and winter of 2010/2011. Similarly <strong>the</strong><br />
District <strong>report</strong>s gains in EOG results, and has an EOG<br />
achievement target of 81% by June 2012. xxvii<br />
There are differences in EOG student performance<br />
by socio-economic status, racial/ethnic background,<br />
gender, first language spoken, and ability. Specifically,<br />
in 2009/2010, economically advantaged students<br />
were twice as likely to score at or above 3rd grade<br />
EOG reading achievement benchmarks than <strong>the</strong>ir<br />
economically disadvantaged peers (83.2% compared<br />
to 42.4% respectively). White students were more<br />
Domain Indicators <strong>Guilford</strong> County North Carolina<br />
Health and Physical<br />
Well-Being<br />
Body mass index (children who are overweight) a 14.60% 15.40%<br />
Adequate or corrected vision a 94% n/a<br />
Adequate or corrected hearing a 95.40% n/a<br />
% Kindergarten children with untreated tooth decay c 14% in<br />
2008/2009<br />
Child Development Developmentally appropriate gross motor skills a 99.10% n/a<br />
Developmentally appropriate fine motor skills a 96.60% n/a<br />
Developmentally appropriate socio-emotional skillsa 98.40% n/a<br />
Developmentally appropriate problem-solving skills a 97.60% n/a<br />
Developmentally appropriate language development<br />
96.40% n/a<br />
and communication skills a<br />
a denotes data for 2009 or 2009/2010; b data for 2011 or 2010/2011; c data for 2008 or 2008/2009; d data for 2006-2008; e data for 2007; f data for 2007-2009<br />
Research shows that <strong>school</strong> <strong>readiness</strong> is best measured<br />
along two broad domains that are central to child<br />
development: (1) health and physical well being,<br />
and (2) developmental status (fine and gross motor<br />
development, social and emotional development,<br />
communication and language development, cognition<br />
and general knowledge, and approaches to learning).<br />
17% in<br />
2008/2009<br />
Results from <strong>the</strong> 2007 KHA were not <strong>report</strong>ed because<br />
of a low rate of participation during <strong>the</strong> pilot stage.<br />
However, participation and completion rates have<br />
increased since <strong>the</strong>n. During 2009/2010 4,615 KHAs<br />
were collected. Of this total 75 were excluded from<br />
<strong>the</strong> analysis because <strong>the</strong>y were duplicates, and an<br />
additional 46 forms were excluded because <strong>the</strong>y lacked<br />
THE GUILFORD SCHOOL READINESS REPORT CARD<br />
12<br />
201 1<br />
academic outcomes than <strong>the</strong>ir higher literacy peers in<br />
subsequent grades. xxvi<br />
<strong>Guilford</strong> County Schools uses two measures of early<br />
than one and a half times more likely to score at or<br />
above reading achievement benchmarks than <strong>the</strong>ir<br />
Hispanic or Black peers (82.5%, 48.9%, 50.2%,<br />
respectively). Among ethnic and racial minority<br />
Children who perform poorly in <strong>the</strong> early years are less<br />
likely to succeed in later grades.<br />
Since 2006/2007 North Carolina State Law (NC<br />
a health assessment. There was wide variation in <strong>the</strong><br />
rate of completion of <strong>the</strong> remaining 4,494 forms. The<br />
demographic section had <strong>the</strong> lowest rate of completion<br />
(55.6%), while <strong>the</strong> physical examination section<br />
13<br />
201 1<br />
language and literacy: <strong>the</strong> Dynamic Indicators of Basic<br />
groups, Hispanic and Black female students were<br />
GS 130A-440) requires that all children entering<br />
had <strong>the</strong> highest rate of completion (97.4%). The two<br />
Early Literacy Skills (DIBELS) for K-2; and <strong>the</strong> End of<br />
more likely to score at or above achievement<br />
kindergarten submit a fully completed Kindergarten<br />
most common reasons for non-completion of <strong>the</strong><br />
Grade (EOG) reading test for 3rd graders. DIBELS was<br />
benchmarks than <strong>the</strong>ir male counterparts (66.3% and<br />
Health Assessment (KHA) as part of <strong>the</strong>ir application.<br />
developmental health, vision, and hearing sections were<br />
introduced in <strong>the</strong> fall of 2008 and is currently used<br />
61.0% respectively). Finally, English-language learners<br />
The purpose of <strong>the</strong> KHA is to identify health and<br />
<strong>the</strong> parent or physician skipped <strong>the</strong> question without<br />
in all county <strong>school</strong>s to monitor student progress and<br />
and students with disabilities had <strong>the</strong> lowest rates<br />
developmental concerns that could interfere with a child’s<br />
explaining why, or <strong>the</strong> physician was unable to complete<br />
identify students who are at-risk of reading failure and<br />
of achievement of EOG reading benchmarks (42.4%<br />
performance in <strong>school</strong>. Medical professionals complete<br />
<strong>the</strong> screen ei<strong>the</strong>r because <strong>the</strong> child was uncooperative<br />
need additional instructional support. The District<br />
and 39.7% respectively). xxviii In o<strong>the</strong>r words, <strong>the</strong>re<br />
<strong>the</strong> form with input from a caregiver up to 12 months<br />
or crying, or because <strong>the</strong> caregiver did not provide <strong>the</strong><br />
<strong>report</strong>s gains in DIBELS results since <strong>the</strong> test was<br />
are gaps in achievement particularly for socially and<br />
before and/or 30 days after <strong>school</strong> entry. The KHA was<br />
information required. In a small number of cases (26) <strong>the</strong><br />
introduced, and scored above <strong>the</strong> national and peer<br />
economically disadvantaged groups of children.<br />
piloted in <strong>Guilford</strong> County in 2006/2007 and is now<br />
developmental screen, which requires parent input, was<br />
(i.e. districts in <strong>the</strong> U.S. with similiar demographics)<br />
implemented throughout <strong>the</strong> state of North Carolina.<br />
not completed because of language barriers.
THE GUILFORD SCHOOL READINESS REPORT CARD<br />
14<br />
201 1<br />
ADDITIONAL RESULTS FROM THE KHA’S<br />
• HEALTH INSURANCE. The majority of children<br />
had private insurance (49.6%), Medicaid (45%), or<br />
some o<strong>the</strong>r coverage (1.5%). The remaining 3.9% of<br />
children had no health insurance, which is slightly<br />
below <strong>the</strong> state average <strong>report</strong>ed for children aged<br />
0-5 in Table 3.<br />
• PERTINENT (OR CHRONIC) ILLNESS.<br />
The most commonly <strong>report</strong>ed conditions were<br />
allergies, asthma, speech and language issues, and<br />
problems with attention or learning (8.5%, 8.1%,<br />
4.0%, and 1.6% respectively).<br />
• DEVELOPMENTAL SCREEN. The Ages<br />
and Stages Questionnaire (ASQ) and <strong>the</strong> Parents’<br />
Evaluation of Developmental Status (PEDS) were <strong>the</strong><br />
most commonly used developmental screening tools<br />
(60% and 38.2%, respectively). In less than 3% of<br />
forms <strong>the</strong> physician did not identify <strong>the</strong> tool used,<br />
sometimes indicating it was an informal assessment.<br />
The most commonly identified concerns were fine<br />
motor skills (2.7%), language or communication<br />
(2.5%), problem solving (1.8%), socio-emotional<br />
development (1.0%), and gross motor skills (0.6%).<br />
One hundred and ninety-six children (or 4.4%) had a<br />
concern identified through <strong>the</strong> KHA. An additional 56<br />
(or 1.2%) of children were referred to a specialist.<br />
• VISION AND HEARING SCREEN.<br />
The audiometry was <strong>the</strong> most common hearing screen<br />
used (88.8%) and although <strong>the</strong> majority of children<br />
passed, 2.4% needed to be screened again and 2.0%<br />
were referred to an audiologist. In <strong>the</strong> case of vision,<br />
4.7% of children were referred to an eye doctor and<br />
1.2% had an already diagnosed vision condition.<br />
• PHYSICAL HEALTH. About 83% of children had<br />
a body mass index within <strong>the</strong> normal range, whereas<br />
8.4% were overweight (lower than <strong>the</strong> PBIS <strong>report</strong>),<br />
7.1% were at-risk for being overweight, and 1.4% of<br />
children were underweight. The most common physical<br />
health concerns were skin (2.8%), dental (2.0%), head,<br />
ears, nose and throat (1.7%), and <strong>card</strong>iac (0.8%).<br />
RECOMMENDATIONS/<br />
OPPORTUNITIES FOR SYSTEM<br />
CHANGE<br />
READY FAMILIES<br />
• Development of additional supports for families<br />
with young children in <strong>the</strong>ir communities of life<br />
(e.g. babysitting or respite care, out-of-home<br />
opportunities for parents to interact both with <strong>the</strong>ir<br />
children and o<strong>the</strong>r parents, and opportunities for<br />
parents to improve <strong>the</strong>ir literacy skills).<br />
• Ongoing education opportunities for parents with<br />
young children.<br />
• Continued expansion of universal newborn nurse<br />
visitation program to include mo<strong>the</strong>rs with children<br />
who are at early risk of developmental delay.<br />
• Developmental and health assessments and services<br />
for children and families that help parents support<br />
<strong>the</strong>ir children’s social and emotional development.<br />
READY COMMUNITIES<br />
• Creation of a county-wide commitment from nonprofits,<br />
faith communities, early care and education<br />
programs, and businesses to ensure that all children<br />
read at grade level by grade three as measured on<br />
end-of-grade assessment.<br />
• Increased collaboration among birth to 3, pre-K,<br />
and K-3 programs to create a continuum of support<br />
and share responsibility for language and literacy<br />
development (<strong>school</strong> <strong>readiness</strong>).<br />
• Continued collaboration among early care and<br />
education programs such as Head Start, Smart<br />
Start, and NC Pre-K in order to serve more children<br />
with needs and share resources among families and<br />
professional staff.<br />
• Development of a child/parent early care<br />
and education kindergarten Grade 3<br />
continuum, so that children and<br />
families continue to be supported<br />
after entry into <strong>school</strong>.<br />
• Increased support to families with<br />
young children so that parents<br />
can obtain living wage jobs and<br />
benefits to care for <strong>the</strong>ir children.<br />
Examples include: employerbased<br />
high quality early<br />
care and education sites;<br />
additional child care subsidy<br />
resources for high quality<br />
early care and education<br />
placements; increased<br />
opportunities within<br />
communities for<br />
parents to complete <strong>the</strong>ir high <strong>school</strong> education<br />
(e.g. obtain a GED) and increase <strong>the</strong>ir marketability.<br />
• Reduction in barriers in access to services including,<br />
but not limited to, transportation and greater<br />
opportunities for families to have knowledge about<br />
available programs and resources that can support<br />
<strong>the</strong>ir becoming effective parents and <strong>the</strong>ir children<br />
being ready for <strong>school</strong>.<br />
• Additional services for children with disabilities and<br />
children with multiple and complex needs that if<br />
addressed early in <strong>the</strong> child’s life will not escalate<br />
into more serious concerns.<br />
• Additional services for children with needs that<br />
can be addressed early to prevent more serious<br />
concerns in early grades of <strong>school</strong> specifically<br />
early language assessments and intervention to<br />
prevent later reading problems.<br />
READY SCHOOLS<br />
• Research that examines <strong>the</strong><br />
process of first and secondlanguage<br />
development/acquisition<br />
and instructional strategies that<br />
build on <strong>the</strong> language strengths<br />
of young English-language<br />
learners.<br />
• Training for early childhood<br />
staff so that <strong>the</strong>y are crossculturally<br />
competent and<br />
able to build meaningful<br />
relationships with families<br />
of diverse linguistic and<br />
cultural backgrounds.<br />
THE GUILFORD SCHOOL READINESS REPORT CARD<br />
15<br />
201 1
DATA SOURCES<br />
• Beyond <strong>the</strong> PBIS (Performance Based Information<br />
TABLE 1: CHILD AND ADULT DEMOGRAPHICS<br />
• Children aged 0-4 years in food insecure households. State<br />
• Mo<strong>the</strong>rs who experienced abuse around pregnancy. NC Center<br />
THE GUILFORD SCHOOL READINESS REPORT CARD<br />
16<br />
201 1<br />
System used by Smart Start/Partnership for Children)<br />
and <strong>school</strong> system data management and tracking<br />
systems, development of early literacy benchmarks<br />
against which to assess and measure <strong>the</strong> community’s<br />
progress towards <strong>school</strong> <strong>readiness</strong>.<br />
• Ensure that Kindergarten Health Assessment (KHA)<br />
forms are fully completed by medical providers/<br />
parents and that <strong>school</strong>s do not accept incomplete<br />
forms. Full utilization of information <strong>report</strong>ed on<br />
<strong>the</strong> KHA so that appropriate referrals/follow-up are<br />
made for each child entering kindergarten. Utilize <strong>the</strong><br />
KHA as a communication tool among <strong>the</strong> physician,<br />
<strong>the</strong> parent(s) and <strong>the</strong> <strong>school</strong> to enable appropriate<br />
interventions to meet <strong>the</strong> identified concerns about<br />
<strong>the</strong> child.<br />
READY CHILDREN<br />
• Ensure that every young child living in <strong>Guilford</strong><br />
County has <strong>the</strong> opportunity to attend a high quality<br />
early care and education child development program<br />
for at least one year prior to entry into kindergarten.<br />
• Ensure that every child living in <strong>Guilford</strong> County<br />
has a medical home providing consistent and<br />
appropriate medical screening and intervention<br />
services with particular focus on social/emotional<br />
development and language acquisition.<br />
• Total population. US Census Bureau. Quick facts. http://quickfacts.<br />
census.gov/qfd/states/37/37081.html<br />
• All child population indicators: US Census Bureau. American<br />
Community Survey. B09001 population under 18 by age. 2009,<br />
1-year estimates.<br />
Race and Ethnicity<br />
• Total child population, race and ethnicity. US Census Bureau.<br />
American Community Survey. S0901 Child characteristics—2009<br />
projections for state-level data. Total child population. S0901 2005-<br />
2009 data set for county-level data. Children under 18 by age.<br />
TABLE 2: READY FAMILIES PARENTING<br />
• Adults functioning at below basic literacy levels (and functioning<br />
at basic literacy levels). Special information request from Reading<br />
Connections. The numbers <strong>report</strong>ed are estimates from <strong>the</strong><br />
National Assessment of Adult Literacy (NAAL). Adults with<br />
below basic literacy skills cannot read or write in English, and<br />
cannot perform basic math operations. Adults with basic literacy<br />
levels function at a 5th to 8th grade level, can perform daily<br />
literacy activities, but do not have <strong>the</strong> skills to perform more<br />
complex, abstract, or analytic activities by <strong>the</strong>mselves.<br />
• Children 0-5 who are read to every day. 2007 National Survey of<br />
Children’s Health http://www.nschdata.org<br />
• Homeless children aged 3-5. County data from <strong>Guilford</strong> County<br />
Schools, Homeless and Transitional Service. Count of prekindergartners<br />
identified between through May of <strong>the</strong> 2010/2011<br />
academic year. Count of kindergartners identified through<br />
January of <strong>the</strong> 2010/2011 academic year. State data from <strong>the</strong><br />
SERVE Center at UNCG, NC Homeless <strong>Education</strong> Program. State<br />
and County data are not necessarily comparable.<br />
• Homeless students (all grade levels). Special data request from<br />
<strong>the</strong> SERVE Center at UNCG, NC Homeless <strong>Education</strong> Program.<br />
• Food insecurity rate (total population). Feeding America. Map<br />
<strong>the</strong> Meal Gap. http://feedingamerica.org/hunger-in-america/<br />
hunger-studies/map-<strong>the</strong>-meal-gap.aspx<br />
level information on low-income children in federally funded<br />
maternal and child health programs including WIC, Food<br />
Stamps, and TANF. http://www.nutritionnc.com/pdfPregPed/<br />
PedNSS/2009/StateTableInfantsandChildrenUnder5Years.<br />
pdf. County level information: http://www.<br />
nutritionnc.com/pdfPregPed/PedNSS/2009/<br />
CountyTableInfantsandChildrenUnder5YearsofAge.pdf<br />
• Language diversity. US Census Bureau. American community<br />
survey. B16002 Household language by linguistic isolation<br />
(2009). The percent families who speak a language o<strong>the</strong>r than<br />
English at home.<br />
• Linguistic isolation. US Census Bureau. American community<br />
survey. B16002 Household language by linguistic isolation<br />
(2009). The percent families who speak a language o<strong>the</strong>r than<br />
English at home and have difficulty communicating in English.<br />
Maternal Risk Factors<br />
• Births to mo<strong>the</strong>rs with less than 12 years of education. NC Center<br />
for Health Statistics. PRAMS survey. http://www.schs.state.<br />
nc.us/SCHS/data/births/getbirthdata.cfm<br />
• Teen (15-17) pregnancy rates. NC Center for Health Statistics.<br />
Pregnancy rates for 2005-2009. http://www.schs.state.nc.us/<br />
SCHS/data/databook/CD9A%20preg%20rates%20by%20race.<br />
html<br />
• Low birth weight. NC State Center for Health Statistics. 2009<br />
Live birth data. http://www.schs.state.nc.us/SCHS/data/births/<br />
bd.cfm<br />
• Mo<strong>the</strong>rs who used alcohol before, during, and after pregnancy.<br />
NC Center for Health Statistics. PRAMS survey. http:www.schs.<br />
state.nc.us/SCHS/data/preconception/prams/2006to2008/<br />
State/drk531_a.html for <strong>the</strong> state and http:www.schs.state.nc.us/<br />
SCHS/data/preconception/prams/2006to2008/Northwest/<br />
drk531_a.html for <strong>the</strong> northwest region. Counties in <strong>the</strong> region<br />
include: Avery, Burke, Caldwell, Watauga, Ashe, Alleghany,<br />
Wilkes, Alexander, Catawba, Iredell, Surry, Yadkin, Davie, Rowan,<br />
Davidson, Forsyth, Stokes, Rockingham, <strong>Guilford</strong>, and Randolph.<br />
for Health Statistics. PRAMS survey. http:www.schs.state.nc.us/<br />
SCHS/data/preconception/prams/2006to2008/State/PAPG.<br />
html for <strong>the</strong> state and preconception/prams/2006to2008/<br />
Northwest/PAPG.html for <strong>the</strong> northwest region. Counties in <strong>the</strong><br />
region include: Avery, Burke, Caldwell, Watauga, Ashe, Alleghany,<br />
Wilkes, Alexander, Catawba, Iredell, Surry, Yadkin, Davie, Rowan,<br />
Davidson, Forsyth, Stokes, Rockingham, <strong>Guilford</strong>, and Randolph.<br />
• Mo<strong>the</strong>rs who smoked before, during, and after pregnancy. NC<br />
Center for Health Statistics. PRAMS survey. http:www.schs.state.<br />
nc.us/SCHS/data/preconception/prams/2006to2008/State/<br />
HPPP_TLK.html for <strong>the</strong> state and http:www.schs.state.nc.us/<br />
SCHS/data/preconception/prams/2006to2008/Northwest/<br />
HPPP_TLK.html for <strong>the</strong> northwest region. Counties in <strong>the</strong> region<br />
include: Avery, Burke, Caldwell, Watauga, Ashe, Alleghany,<br />
Wilkes, Alexander, Catawba, Iredell, Surry, Yadkin, Davie, Rowan,<br />
Davidson, Forsyth, Stokes, Rockingham, <strong>Guilford</strong>, and Randolph.<br />
• Mo<strong>the</strong>rs who do not have someone to talk to about problems. NC<br />
Center for Health Statistics. PRAMS survey. http:www.schs.state.<br />
nc.us/SCHS/data/preconception/prams/2006to2008/State/<br />
HPPP_TLK.html for <strong>the</strong> state and http:www.schs.state.nc.us/<br />
SCHS/data/preconception/prams/2006to2008/Northwest/<br />
HPPP_TLK.html for <strong>the</strong> northwest region. Counties in <strong>the</strong> region<br />
include: Avery, Burke, Caldwell, Watauga, Ashe, Alleghany,<br />
Wilkes, Alexander, Catawba, Iredell, Surry, Yadkin, Davie, Rowan,<br />
Davidson, Forsyth, Stokes, Rockingham, <strong>Guilford</strong>, and Randolph.<br />
• Mo<strong>the</strong>rs <strong>report</strong>ing depression after delivery. NC Center for<br />
Health Statistics. PRAMS survey. http:www.schs.state.nc.us/<br />
SCHS/data/preconception/prams/2006to2008/State/<br />
WH_PPDPR.html for <strong>the</strong> state and http:www.schs.state.nc.us/<br />
SCHS/data/preconception/prams/2006to2008/Northwest/<br />
WH_PPDPR.html for <strong>the</strong> northwest region. Counties in <strong>the</strong> region<br />
include: Avery, Burke, Caldwell, Watauga, Ashe, Alleghany,<br />
Wilkes, Alexander, Catawba, Iredell, Surry, Yadkin, Davie, Rowan,<br />
Davidson, Forsyth, Stokes, Rockingham, <strong>Guilford</strong>, and Randolph.<br />
THE GUILFORD SCHOOL READINESS REPORT CARD<br />
17<br />
201 1
THE GUILFORD SCHOOL READINESS REPORT CARD<br />
18<br />
201 1<br />
Child Maltreatment<br />
• Children (all ages) with finding in need of services. Duncan, D.<br />
F., Kum, H. C., Flair, K. A., Stewart, C. J. and Huang, S. P. (2009)<br />
Management Assistance for Child Welfare, Work First, and<br />
Food and Nutrition Services. http://www.ssw.unc.edu/ma/ FY<br />
2009//2010<br />
• Children aged 0-5 with substantiated abuse/neglect <strong>report</strong>s.<br />
National Child Abuse and Neglect Experiences Data System<br />
(NCANDS). Note that <strong>report</strong>ing method has changed since<br />
2007 SRRC.<br />
TABLE 3: READY COMMUNITIES POVERTY<br />
• Children enrolled in pre<strong>school</strong> living in households below<br />
<strong>the</strong> poverty level. US Census Bureau. American Community<br />
Survey. B14006 Poverty Status in <strong>the</strong> past 12 months by <strong>school</strong><br />
enrollment by level of <strong>school</strong>. 2009, 1-year estimates. The 2009<br />
poverty level for a 2-parent household with two children was<br />
$21,756.<br />
• Children enrolled in kindergarten living in households below<br />
<strong>the</strong> poverty level. US Census Bureau. American Community<br />
Survey. B14006 Poverty Status in <strong>the</strong> past 12 months by <strong>school</strong><br />
enrollment by level of <strong>school</strong>. 2009, 1-year estimates. The 2009<br />
poverty level for a 2-parent household with two children was<br />
$21,756.<br />
• Elementary <strong>school</strong> children applying for free or reduced lunch.<br />
NC Department of Public Instruction. Child Nutrition Services.<br />
Free and Reduced Application data by site. All year to date data:<br />
2009-2010. http://www.ncpublic<strong>school</strong>s.org/fbs/resources/<br />
data/ Children in families with incomes below 185% of <strong>the</strong><br />
poverty level (approximately $40,250 for a family of four) were<br />
eligible for free or reduced lunch in 2009/2010.<br />
• Children (K-12) enrolled in free or reduced lunch. Kids Count.<br />
Http://datacenter.kidscount.org/data/bystate/stateprofile<br />
Neighborhoods<br />
• Neighborhood crime index. North Carolina Department of Justice<br />
(2009). Crime in NC. 2009 Annual summary <strong>report</strong> of uniform<br />
crime. Note that index is a composite measure of seven offenses:<br />
murder, rape, robbery, aggravated assault, burglary, larceny, and<br />
motor vehicle <strong>the</strong>ft.<br />
• Neighborhood amenities. 2007 National Survey of Children’s<br />
Health http://www.nschdata.org. Percent children aged 0 -5<br />
who live in neighborhoods which have 3 or 4 of <strong>the</strong> following<br />
amenities: sidewalks, parks, recreation centers, and/or libraries.<br />
• Neighborhood safety. 2007 National Survey of Children’s<br />
Health http://www.nschdata.org. Percent children aged 0 - 5<br />
whose parents feel <strong>the</strong>y are usually safe in <strong>the</strong>ir communities or<br />
neighborhoods.<br />
• Neighborhood support. 2007 National Survey of Children’s<br />
Health http://www.nschdata.org. Percent children aged 0 - 5 who<br />
live in neighborhoods in which people help each o<strong>the</strong>r, look out<br />
for each o<strong>the</strong>r’s children, and can count on <strong>the</strong>ir neighbors.<br />
Health<br />
• Live births where mo<strong>the</strong>r received adequate or more than<br />
adequate prenatal care. 2008 March of Dimes http://www.<br />
marchofdimes.com/peristats<br />
• Children who received immunizations by age 2. NC Immunization<br />
Branch, special data request. Note that state and county data<br />
are not directly comparable because county data are from <strong>the</strong> NC<br />
Immunization Branch and state data are from <strong>the</strong> 2009 National<br />
Immunization Survey.<br />
• Children entering kindergarten with up-to-date immunizations.<br />
NC Immunizations Branch, special data request.<br />
• Percent children born at a healthy birth weight. NC State Center<br />
for Health Statistics. Birth data. http://www.schs.state.nc.us/<br />
SCHS/data/births/getbirthdata.cfm<br />
• Children 0-5 with a regular source of primary care. 2007 National<br />
Survey of Children’s Health http://www.childhealthdata.org<br />
• Children 0 -5 without health insurance. 2007-2009 CHAMP<br />
<strong>report</strong>, Table 14: Type of Health Coverage by Child’s Age. Note<br />
that county-level information is not <strong>report</strong>ed because of small<br />
sample.<br />
• Children under 19 without health insurance. US Census Bureau.<br />
2007 Health Insurance Coverage Status (Uninsured Only) in<br />
North Carolina for Age (Under 19 years), Income (All income<br />
levels) and Sex (both Sexes).<br />
• Use of primary care by children aged 0-5. <strong>Guilford</strong> County<br />
Partnership for Children. Performance Based Incentive System<br />
(PBIS) variable H20 <strong>report</strong>ed by <strong>the</strong> NC Partnership for Children,<br />
Inc. Report on Medicaid enrolled children who have participated<br />
in Health Check.<br />
• Children 0-5 with elevated blood lead levels. <strong>Guilford</strong> County<br />
Partnership for Children. PBIS H70. Elevated blood lead levels.<br />
Early Care and <strong>Education</strong> Opportunities<br />
• Children 0-2 and children 3-5 in early intervention for<br />
developmental delay. <strong>Guilford</strong> County Partnership for Children.<br />
PBIS variable H10 Early intervention for children who are at risk<br />
for special needs.<br />
• Children 3 and 4-years being served with an IEP. <strong>Guilford</strong> County<br />
Schools, Exceptional Children Services special data request for<br />
both county and state data. December 01, 2010 count. Note that<br />
state count includes 5 year olds in Pre-K.<br />
• Pre<strong>school</strong> regulated child care centers. NC DHHS, Division<br />
of Child Development. Child Care Analysis Detail. http://<br />
ncchildcare.dhhs.state.nc.us/pdf_forms/statistical_detail_<strong>report</strong>_<br />
december__2009.pdf for county data. NC DHHS, Division of<br />
Child Development. http://ncchildcare.dhhs.state.nc.us/general/<br />
child_care_statistical_<strong>report</strong>.asp. December 2009 for state data.<br />
• Percent pre-<strong>school</strong> regulated child care centers with 4 or 5<br />
stars. NC DHHS, Division of Child Development. Child Care<br />
Analysis Detail. http://ncchildcare.dhhs.state.nc.us/pdf_forms/<br />
statistical_detail_<strong>report</strong>_december__2009.pdf for county data.<br />
NC DHHS, Division of Child Development. NC DHHS, Division of<br />
Child Development. http://ncchildcare.dhhs.state.nc.us/general/<br />
child_care_statistical_<strong>report</strong>.asp. December 2009 for state data.<br />
• Percent children aged 0-5 in care who attend 4 to 5 star centers.<br />
<strong>Guilford</strong> County Partnership for Children. PBIS variable PLA40.<br />
Child Placements.<br />
• Pre<strong>school</strong> children aged 0-5 in 4 to 5 star centers. NC DHHS,<br />
Division of Child Development. Child Care Analysis Detail. http://<br />
ncchildcare.dhhs.state.nc.us/pdf_forms/statistical_detail_<strong>report</strong>_<br />
december__2009.pdf for county data. NC DHHS, Division of<br />
Child Development. NC DHHS, Division of Child Development.<br />
http://ncchildcare.dhhs.state.nc.us/general/child_care_<br />
statistical_<strong>report</strong>.asp. December 2009 for state data.<br />
• Children 0-5 receiving child care subsidies. NC Division of Child<br />
Development. County and State subsidy fact sheets. http://<br />
ncchildcare.dhhs.state.nc.us/pdf_forms/subsidy_county_fact_<br />
sheets_09_10.pdf for <strong>the</strong> county and http://ncchildcare.dhhs.<br />
state.nc.us/pdf_forms/subsidy_statewide_facts_sheet_09_10.pdf<br />
for <strong>the</strong> state.<br />
• Percent children 0-5 receiving child care subsidies who are in 4-5<br />
star programs. <strong>Guilford</strong> County Partnerships for Children. PBIS<br />
variable PLA50<br />
• Children eligible for child care subsidy but on a waiting list.<br />
Special data request to NC Division of Social Services, <strong>Guilford</strong><br />
County Child Day Care Program for county data. NC Division of<br />
Child Development. ncchildcare.dhhs.state.nc.us/pdf_forms/<br />
may_2010_statistical_<strong>report</strong>.pdf for state data.<br />
• Children aged 0-5 enrolled in pre<strong>school</strong>. NC DHHS, Division<br />
of Child Development. Child Care Analysis Detail. http://<br />
ncchildcare.dhhs.state.nc.us/pdf_forms/statistical_detail_<strong>report</strong>_<br />
december__2009.pdf for county data. NC DHHS, Division of<br />
Child Development NC DHHS, Division of Child Development.<br />
http://ncchildcare.dhhs.state.nc.us/general/child_care_<br />
statistical_<strong>report</strong>.asp (December 2009) for state data.<br />
• Children enrolled in kindergarten, 2-month <strong>report</strong>. State Board of<br />
<strong>Education</strong>. Department of Public Instruction. Student Accounting.<br />
Principal’s Monthly Report (PMR). http://www.ncpublic<strong>school</strong>s.<br />
org/fbs/accounting/data/<br />
• Percent low-income children enrolled in subsidized early care and<br />
education programs. <strong>Guilford</strong> County Partnership for Children.<br />
PBIS Variable PLA30<br />
• Percent children 0-5 in 1-5 star programs with at least 5 lead<br />
teacher education points. PBIS variable EDU10.<br />
• Percent children 0-5 in 1-5 star programs with at least 5<br />
administrator education points. PBIS variable EDU20.<br />
THE GUILFORD SCHOOL READINESS REPORT CARD<br />
19<br />
201 1
ENDNOTES<br />
TABLE 4: READY SCHOOLS<br />
i Johnson, J. H., & Kasarda, J. D. (2011). Six disruptive demographic<br />
ethnic gaps in <strong>school</strong> <strong>readiness</strong>. In R. C. Pianta, M. J. Cox, K. L. Snow<br />
xxiii Payne, C., & Rollins, A. (2009). Ready Toge<strong>the</strong>r. Center for<br />
Early Language and Literacy<br />
trends: What census 2010 will reveal. Chapel Hill, Frank Hawkins<br />
Kenan Institute of Private Enterprise. Retrieved March 1, 2011, from<br />
(Eds.), School <strong>readiness</strong> and <strong>the</strong> transition to kindergarten in <strong>the</strong><br />
era of accountability (pp. 283-306). Baltimore: Paul H. Brooks.<br />
Youth, Family and Community Partnerships. Available at http://<br />
www.uncg.edu/csr/pdfs/RT_executive_summary.pdf<br />
• Kindergartners at or above literacy benchmarks. Special data<br />
http://www.kenan-flagler.unc.edu/ki/<strong>report</strong>s/Census2010Trends/<br />
xiii Duncan, G., & Brooks-Gunn, J. (1997). Consequences of growing<br />
xxiv Buford, A. & Payne, C., (2010). NC Launch Environmental Scan.<br />
request, <strong>Guilford</strong> County Schools. 2010/2011 Dynamic Indicators<br />
ii U.S. Census (2009). American Community Survey 2009, 1-year<br />
up poor. New York: Russell Sage.<br />
Center for Youth, Family, and Community Partnerships. Working<br />
of Basic Early Literacy Skills (DIBELS) data that measures five<br />
estimates: Children characteristics.<br />
xiv Sameroff, A. J., Seifer, R., Baldwin, A. & Baldwin, C. (1993).<br />
document.<br />
domains of early literacy: phonemic awareness, alphabet prin-<br />
iii U.S. Census (2009). American Community Survey 2005-2009,<br />
Stability of intelligence from pre<strong>school</strong> to adolescence: The<br />
xxv Pianta, R. C. (2007). Early education in transition. In R. C. Pianta,<br />
THE GUILFORD SCHOOL READINESS REPORT CARD<br />
20<br />
201 1<br />
ciple, accuracy and fluency, vocabulary, and comprehension.<br />
• First graders at or above literacy benchmarks. Special data<br />
request, <strong>Guilford</strong> County Schools. 2010/2011 Dynamic Indicators<br />
of Basic Early Literacy Skills (DIBELS) data that measures<br />
five domains of early literacy: phonemic awareness, alphabet<br />
principle, accuracy and fluency, vocabulary, and comprehension.<br />
• Students at or above level on End of Grade (EOG) 3 reading<br />
achievement. State Board of <strong>Education</strong>. Department of<br />
Public Instruction. 2009-2010 academic year. http://accrpt.<br />
ncpublic<strong>school</strong>s.org/app/2010/disag/<br />
• Kindergartners in early intervention for developmental delay.<br />
NC Department of Public Instruction, NC 619 Exceptional<br />
Children Pre<strong>school</strong> Program special data request.<br />
TABLE 5: READY CHILDREN<br />
Health and Physical Well-Being<br />
• Body mass index. <strong>Guilford</strong> County Partnership for Children. PBIS<br />
variable H60.<br />
• Adequate or corrected vision and adequate or corrected hearing.<br />
<strong>Guilford</strong> County Kindergarten Health Assessment. 2009/2010<br />
5-year estimates. Poverty status in <strong>the</strong> last 12 months of related<br />
children under 18 years by family type by age of related children.<br />
iv U.S. Census (2009). American Community Survey 2005-2009,<br />
5-year estimates. Selected characteristics of people at specified<br />
levels of poverty in <strong>the</strong> past 12 months.<br />
v <strong>Guilford</strong> County Schools (2011). Diversity. Retrieved May 2, 2011<br />
from http://<strong>school</strong>center.gcsnc.com/education/<strong>school</strong>/<strong>school</strong>.<br />
php?sectionid=36182&<br />
vi Pianta, R. C. (2010). Going to <strong>school</strong> in <strong>the</strong> United States: The<br />
shifting ecology of transition. In S. L. Kagan & R. Tarrant (Eds.),<br />
Transitions for young children (pp. 33-44). Baltimore: Paul H.<br />
Brooks.<br />
vii Ma<strong>the</strong>r, M. (2009). Reports on America: Children in immigrant<br />
families chart new path. Washington, DC: Population Reference<br />
Bureau.<br />
viii New Study Highlights Benefits of Early Childhood Programs.<br />
Public School Forum of N.C. Vol 13, Issue 35. March 25, 2011.<br />
ix Breaking an improving system (2011). North Carolina State<br />
Board of <strong>Education</strong>. Retrieved June 11, 2011 from http://www.<br />
ncpublic<strong>school</strong>s.org/stateboard/<br />
x Blair, C., Knipe, H. Cummings, E., Baker, D. P., Gamson, D., Eslinger,<br />
influence of social and family risk factors. Child Development, 64,<br />
80-97.<br />
xv Kupcha-Szrom, J. (2011). A window to <strong>the</strong> world: Early language<br />
and literacy development. Washington, DC: Zero to Three.<br />
Retrieved March 28. 2011 from http://main.zerotothree.org/site/<br />
Search?query=a+window+to+<strong>the</strong>+world&inc=10<br />
xvi Magnuson, K., Lahaie, C., & Waldfogel, J. (2006) Pre<strong>school</strong><br />
and School Readiness of Children of Immigrants. Social Science<br />
Quarterly, 87, 1241–62.<br />
xvii Cummings, M. & Davies, P. (1994). Maternal depression and<br />
child development. Journal of Child Psychology and Psychiatry, 35,<br />
73-112.<br />
xviii Voices. Choices. Greensboro’s Human Services Study (2010).<br />
Retrieved February 22, 2011 from http://www.unitedwaygso.org/<br />
volunteer/documents/VCFULLFINALReport.pdf<br />
xix The almanac of hunger and poverty in America: Feeding<br />
America’s comprehensive guide to national and state facts on<br />
hunger and poverty (2010). Feeding America. Retrieved May 19,<br />
2011 from http://hungeralmanac.issuelab.org/research/listing/<br />
almanac_of_hunger_and_poverty_in_america_2010_about_<br />
feeding_america<br />
M. J. Cox, K. L. Snow (Eds), School <strong>readiness</strong> and <strong>the</strong> transition to<br />
kindergarten in <strong>the</strong> era of accountability (pp. 3-10). Baltimore:<br />
Paul H. Brooks.<br />
xxvi Discussion guide: Ensuring success for young<br />
children: Early childhood literacy (2008). Association of<br />
Small Foundations. Retrieved April 6, 2011 from http://<br />
www.aecf.org/media/Pubs/Topics/<strong>Education</strong>/O<strong>the</strong>r/<br />
EnsuringSuccessforYoungChildrenLiteracy/Ensuring_Success_<br />
Early_Literacy.pdf<br />
xxvii <strong>Guilford</strong> County Schools (2011). <strong>Guilford</strong> County Schools<br />
strategic plan 2012. Retrieved April 4, 2011 from http://www1.<br />
gcsnc.com/superintendent/plan/sp.htm<br />
xxviii Department of Public Instruction (2011). Reports of<br />
disaggregated state, <strong>school</strong> system (LEA) and <strong>school</strong> performance<br />
data for 2008-2010. Retrieved June 9, 2011 from http://accrpt.<br />
ncpublic<strong>school</strong>s.org/app/2010/disag/<br />
THE GUILFORD SCHOOL READINESS REPORT CARD<br />
21<br />
201 1<br />
academic year.<br />
P., & Thorne, S. L. (2007). A developmental neuroscience approach<br />
xx Brooks-Gunn, J., Klebanov, P. K., & Duncan, G.J. (1996). Ethnic<br />
• Kindergarten children with untreated tooth decay. NC Dept of<br />
to <strong>the</strong> study of <strong>school</strong> <strong>readiness</strong>. In R. C. Pianta, M. J. Cox, K. L.<br />
differences in children’s intelligence test scores: Role of economic<br />
Health and Human Services, Division of Public Health. 2008-<br />
Snow (Eds.), School <strong>readiness</strong> and <strong>the</strong> transition to kindergarten in<br />
deprivation, home environment, and maternal characteristics. Child<br />
2009 <strong>report</strong>. http://www.ncdhhs.gov/dph/oralhealth/library/<br />
<strong>the</strong> era of accountability (pp. 149-174). Baltimore: Paul H. Brooks.<br />
Development, 67, 396-408.<br />
includes/AssessmentData/County-State%20Assessment%20<br />
xi Getting ready: Findings from <strong>the</strong> National School Readiness<br />
xxi Wilkenfeld, B., Moore, K. A,, Lippman, L. (2008). Neighborhood<br />
Comparison%2008-09.pdf<br />
Indicators Initiative, a 17 state partnership. Providence, RI: Rhode<br />
support and children’s connectedness. Washington, DC: Child<br />
Child Development<br />
Island KIDS COUNT. Retrieved February 17, 2011 from http://www.<br />
rikidscount.org<br />
Trends. Retrieved May 16, 2011 from http://www.childtrends.org/<br />
Files/Child_Trends-2008_02_05_ConnectednessFS.pdf<br />
• All child development indicators. <strong>Guilford</strong> County Kindergarten<br />
Health Assessment. 2009/2010 academic year.<br />
xii Brooks-Gunn, J., Rouse, C. E., McLanahan, S. (2007). Racial and<br />
xxii NC Department of Public Instruction (2011). Office of Early<br />
Learning, special data request.
THE GUILFORD EDUCATION ALLIANCE<br />
The <strong>Guilford</strong> School Readiness Report Card (Report Card) is an initiative of <strong>the</strong> <strong>Guilford</strong> <strong>Education</strong> <strong>Alliance</strong> (GEA).<br />
<strong>Guilford</strong> <strong>Education</strong> <strong>Alliance</strong> works to make support of quality public education <strong>the</strong> TOP priority of <strong>the</strong> larger<br />
community. Founded in 2004 by <strong>the</strong> Community Foundation of Greater Greensboro, <strong>the</strong> High Point Community<br />
Foundation, and <strong>the</strong> Cemala Foundation, <strong>Guilford</strong> <strong>Education</strong> <strong>Alliance</strong>’s scope of work includes early childhood<br />
through high <strong>school</strong> career / college graduation. For more information on GEA go to:<br />
http://www.<strong>guilford</strong>educationalliance.org/<br />
THE GUILFORD SCHOOL READINESS REPORT CARD<br />
22<br />
201 1<br />
CONTACT INFORMATION:<br />
902 Bonner Drive, Jamestown, NC 27282<br />
Tel: 336-841-4332<br />
Fax: 336-841-3696<br />
Email: gea@<strong>guilford</strong>educationalliance.org<br />
ACKNOWLEDGEMENTS:<br />
Financial support for <strong>the</strong> Report Card is from <strong>the</strong> Lincoln Financial<br />
Foundation, and <strong>the</strong> <strong>report</strong> was prepared by <strong>the</strong> Center for Youth, Family, and<br />
Community Partnerships at <strong>the</strong> University of North Carolina at Greensboro.<br />
During <strong>the</strong> spring of 2011 GEA reconvened <strong>the</strong> School Readiness Report Card<br />
Ad Hoc Committee first to revise indicators and identify additional data sources for <strong>the</strong> <strong>report</strong>, and <strong>the</strong>n to review<br />
findings and make recommendations. GEA thanks <strong>the</strong> organizations listed below, in alphabetical order, for <strong>the</strong>ir<br />
invaluable contribution to <strong>the</strong> development of <strong>the</strong> <strong>report</strong>:<br />
Center for Youth, Family, and Community Partnerships at UNCG<br />
<strong>Guilford</strong> Child Development<br />
<strong>Guilford</strong> Child Health<br />
<strong>Guilford</strong> County Partnership for Children<br />
<strong>Guilford</strong> County Schools<br />
North Carolina A&T State University<br />
United Way of Greater Greensboro<br />
United Way of Greater High Point<br />
Finally we thank <strong>the</strong> many people who pointed us to resources, provided data and information,<br />
and talked to us about <strong>the</strong>ir work preparing young children for <strong>school</strong>.