The FAO-ESCAP pilot project on national water visions. From vision ...
The FAO-ESCAP pilot project on national water visions. From vision ...
The FAO-ESCAP pilot project on national water visions. From vision ...
You also want an ePaper? Increase the reach of your titles
YUMPU automatically turns print PDFs into web optimized ePapers that Google loves.
<str<strong>on</strong>g>The</str<strong>on</strong>g> maximum and minimum mean air temperatures are 33.4°C and 22.8°C respectively. <str<strong>on</strong>g>The</str<strong>on</strong>g> highest<br />
and lowest recorded annual rainfall are 5 130 mm (Sarawak, 1994) and 1 350 mm (Perlis, 1992)<br />
respectively. As for the number of rainfall days, the maximum recorded is 260 (Sarawak, 1995). <str<strong>on</strong>g>The</str<strong>on</strong>g><br />
mean annual relative air humidity varies between 78 and 87 percent; this high humidity is due to the<br />
high temperature and high rate of evaporati<strong>on</strong>. All parts of the country receive an average of 1 764 to<br />
2 664 bright sunshine hours a year. <str<strong>on</strong>g>The</str<strong>on</strong>g>se data are based <strong>on</strong> the last ten-year records (1989-1999).<br />
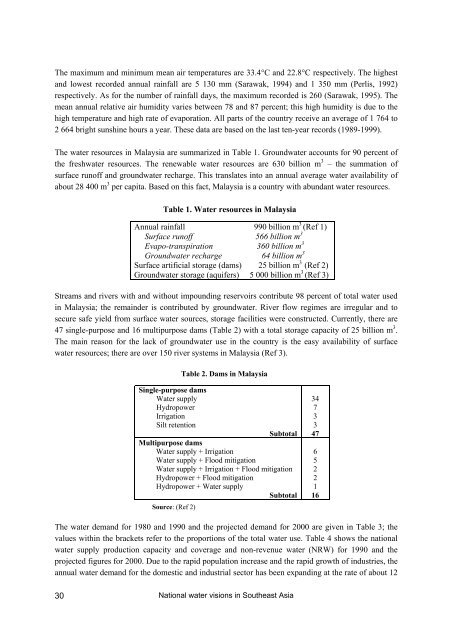
<str<strong>on</strong>g>The</str<strong>on</strong>g> <strong>water</strong> resources in Malaysia are summarized in Table 1. Ground<strong>water</strong> accounts for 90 percent of<br />
the fresh<strong>water</strong> resources. <str<strong>on</strong>g>The</str<strong>on</strong>g> renewable <strong>water</strong> resources are 630 billi<strong>on</strong> m 3 – the summati<strong>on</strong> of<br />
surface runoff and ground<strong>water</strong> recharge. This translates into an annual average <strong>water</strong> availability of<br />
about 28 400 m 3 per capita. Based <strong>on</strong> this fact, Malaysia is a country with abundant <strong>water</strong> resources.<br />
Table 1. Water resources in Malaysia<br />
Annual rainfall 990 billi<strong>on</strong> m 3 (Ref 1)<br />
Surface runoff 566 billi<strong>on</strong> m 3<br />
Evapo-transpirati<strong>on</strong> 360 billi<strong>on</strong> m 3<br />
Ground<strong>water</strong> recharge 64 billi<strong>on</strong> m 3<br />
Surface artificial storage (dams) 25 billi<strong>on</strong> m 3 (Ref 2)<br />
Ground<strong>water</strong> storage (aquifers) 5 000 billi<strong>on</strong> m 3 (Ref 3)<br />
Streams and rivers with and without impounding reservoirs c<strong>on</strong>tribute 98 percent of total <strong>water</strong> used<br />
in Malaysia; the remainder is c<strong>on</strong>tributed by ground<strong>water</strong>. River flow regimes are irregular and to<br />
secure safe yield from surface <strong>water</strong> sources, storage facilities were c<strong>on</strong>structed. Currently, there are<br />
47 single-purpose and 16 multipurpose dams (Table 2) with a total storage capacity of 25 billi<strong>on</strong> m 3 .<br />
<str<strong>on</strong>g>The</str<strong>on</strong>g> main reas<strong>on</strong> for the lack of ground<strong>water</strong> use in the country is the easy availability of surface<br />
<strong>water</strong> resources; there are over 150 river systems in Malaysia (Ref 3).<br />
Table 2. Dams in Malaysia<br />
Single-purpose dams<br />
Water supply<br />
Hydropower<br />
Irrigati<strong>on</strong><br />
Silt retenti<strong>on</strong><br />
Subtotal<br />
Multipurpose dams<br />
Water supply + Irrigati<strong>on</strong><br />
Water supply + Flood mitigati<strong>on</strong><br />
Water supply + Irrigati<strong>on</strong> + Flood mitigati<strong>on</strong><br />
Hydropower + Flood mitigati<strong>on</strong><br />
Hydropower + Water supply<br />
Subtotal<br />
Source: (Ref 2)<br />
34<br />
7<br />
3<br />
3<br />
47<br />
6<br />
5<br />
2<br />
2<br />
1<br />
16<br />
<str<strong>on</strong>g>The</str<strong>on</strong>g> <strong>water</strong> demand for 1980 and 1990 and the <str<strong>on</strong>g>project</str<strong>on</strong>g>ed demand for 2000 are given in Table 3; the<br />
values within the brackets refer to the proporti<strong>on</strong>s of the total <strong>water</strong> use. Table 4 shows the nati<strong>on</strong>al<br />
<strong>water</strong> supply producti<strong>on</strong> capacity and coverage and n<strong>on</strong>-revenue <strong>water</strong> (NRW) for 1990 and the<br />
<str<strong>on</strong>g>project</str<strong>on</strong>g>ed figures for 2000. Due to the rapid populati<strong>on</strong> increase and the rapid growth of industries, the<br />
annual <strong>water</strong> demand for the domestic and industrial sector has been expanding at the rate of about 12<br />
30<br />
Nati<strong>on</strong>al <strong>water</strong> visi<strong>on</strong>s in Southeast Asia


