Annual Report 1999 - Kemira
Annual Report 1999 - Kemira
Annual Report 1999 - Kemira

Create successful ePaper yourself
Turn your PDF publications into a flip-book with our unique Google optimized e-Paper software.
<strong>Annual</strong> <strong>Report</strong><br />
<strong>1999</strong>
ANNUAL GENERAL MEETING<br />
The <strong>Annual</strong> General Meeting of <strong>Kemira</strong> Oyj will be<br />
held on Tuesday, 11 April 2000 at 4.00 p.m. in the<br />
<strong>Kemira</strong> House, Porkkalankatu 3, 00180 Helsinki.<br />
Attendance is open to shareholders who by 6 April<br />
2000 have been entered in the company’s<br />
Shareholders’ Register which is kept by Finnish<br />
Central Securities Depository Ltd and have given<br />
notification of their intention to attend the meeting<br />
no later than by 7 April 2000, 4.00 p.m. Shareholders<br />
wishing to attend the meeting are kindly requested<br />
to register with Ms Arja Korhonen or Ms Seija<br />
Mörsky, <strong>Kemira</strong> Oyj, P.O. Box 330, FIN-00101<br />
Helsinki, Finland; e-mail arja.korhonen@kemira.com;<br />
telefax +358 10 862 1375; telephone +358 10 8611 on<br />
weekdays from 8.00 a.m. to 4.00 p.m.<br />
The proposal of the Board of Directors of <strong>Kemira</strong><br />
Oyj for the dividend to be paid out for the <strong>1999</strong><br />
financial year is EUR 0.23 per share. The record date<br />
of the dividend payment is 14 April 2000 and the<br />
date of the payment 26 April 2000.<br />
PROFIT AND LOSS INFORMATION<br />
<strong>Kemira</strong> will publish information on its 2000<br />
financial year in Finnish, Swedish and English as<br />
follows:<br />
Interim <strong>Report</strong> 3 months 9 May 2000<br />
Interim <strong>Report</strong> 6 months 3 August 2000<br />
Interim <strong>Report</strong> 9 months 7 November 2000<br />
Financial Statement Bulletin February 2001<br />
<strong>Annual</strong> <strong>Report</strong> March 2001<br />
These reports can be ordered from <strong>Kemira</strong> Oyj,<br />
Group Communications, tel. +358 10 8611,<br />
fax +358 10 862 1797 or by e-mail at<br />
postitus@kemira.com.<br />
Financial reports and press releases will be<br />
published in Finnish and English also on the<br />
Group’s Internet pages at www.kemira.com.<br />
INVESTOR RELATIONS<br />
<strong>Kemira</strong> Oyj<br />
Kaj Friman, Vice President, Treasury and Group<br />
Communications, tel. +358 10 86 21704,<br />
e-mail: kaj.friman@kemira.com.<br />
CONTENTS<br />
Shareholder information 3<br />
Targets, strategy 4<br />
Business areas 5<br />
CEO’s review 6<br />
Financial statements <strong>1999</strong><br />
Board of Directors’ review 7<br />
Shares and shareholders 13<br />
Key figures 15<br />
Consolidated financial statements 18<br />
Accounting policies 21<br />
Notes to the consolidated financial<br />
statements 23<br />
<strong>Kemira</strong> Oyj financial statements<br />
and notes 36<br />
Proposal for the distribution of profits 40<br />
Auditors’ report 40<br />
Statement of the Supervisory Board 41<br />
<strong>Kemira</strong> Chemicals 42<br />
Tikkurila 45<br />
<strong>Kemira</strong> Agro 48<br />
<strong>Kemira</strong> Pigments 51<br />
Others 53<br />
Environmental report 54<br />
Summaries of main press releases 62<br />
Administration 64<br />
Equity research 66<br />
Glossary 67<br />
Quarterly financial development 69<br />
Group companies 70<br />
Addresses 72<br />
This report is a translation of the original<br />
Finnish-language <strong>Annual</strong> <strong>Report</strong>.<br />
3
STRATEGY<br />
Our strategy is to concentrate on fields requiring many-sided competence within<br />
the chemical industry. We will seek growth within paper and pulp chemicals,<br />
water treatment chemicals and paints. Those fields have promising growth prospects<br />
and are less dependent on economic cycles than is the industry average.<br />
Other priority areas are speciality fertilizers and industrial chemicals.<br />
FINANCIAL TARGETS<br />
<strong>1999</strong> 2000 Target<br />
from 2001<br />
Net sales, growth % 5 over 10<br />
Operating income, % of net sales 4 Restructur- over 10<br />
Earnings per share, growth % neg. ing year over 10<br />
Cash flow return on capital invested, % 9 over 10<br />
Gearing, % 95 40–100<br />
Paints and<br />
coatings 9 %<br />
Colour<br />
processing<br />
systems<br />
5 %<br />
Pigments<br />
19 %<br />
Other 3 %<br />
Pulp & paper chemicals 12 %<br />
Water treatment<br />
chemicals 5 %<br />
Industrial<br />
chemicals<br />
9 %<br />
Speciality<br />
fertilizers<br />
19 %<br />
RESTRUCTURING<br />
For titanium dioxide pigments and<br />
nitrogen fertilizers - the fields falling<br />
outside the new core business - we<br />
will seek, by way of co-operation or<br />
ownership arrangements, solutions<br />
that enhance their cash flow generation<br />
potential. The growth potential<br />
of the Tikkurila CPS unit, which has<br />
specialized in colour processing systems,<br />
will be promoted by separating<br />
it out from the paint business.<br />
Nitrogen fertilizers<br />
19 %<br />
<strong>1999</strong> net sales EUR 2,526 million
BUSINESS AREAS<br />
KEMIRA CHEMICALS<br />
<strong>Kemira</strong> Chemicals is a major<br />
producer of chemicals for the<br />
pulp and paper industry and<br />
a manufacturer of other<br />
industrial chemicals. It is also<br />
the leading European manufacturer<br />
of water treatment<br />
chemicals. It has production<br />
facilities in 24 countries.<br />
Net sales in <strong>1999</strong>, EUR million 697<br />
% of Group net sales 26<br />
Operating income, EUR million 83<br />
% of Group operating income 75<br />
Personnel at 31.12. 3,046<br />
TIKKURILA<br />
H C<br />
Tikkurila is one of Europe’s<br />
leading paint manufacturers.<br />
Its main products are<br />
decorative paints, wood finishes<br />
and coatings for the<br />
metal industry. Tikkurila has<br />
production facilities in 15<br />
countries.<br />
KEMIRA AGRO<br />
<strong>Kemira</strong> Agro is one of<br />
Europe’s largest producers<br />
of speciality fertilizers for<br />
crops and horticulture. It<br />
has production facilities in<br />
10 countries.<br />
Net sales in <strong>1999</strong>, EUR million 357<br />
% of Group net sales 14<br />
Operating income, EUR million 23<br />
% of Group operating income 21<br />
Personnel at 31.12. 2,283<br />
Net sales<br />
2<br />
in <strong>1999</strong>, EUR million 1,015<br />
% of Group net sales 38<br />
Operating income, EUR million -39<br />
% of Group operating income -35<br />
Personnel at 31.12. 2,812<br />
KEMIRA PIGMENTS<br />
The main users of titanium<br />
dioxide pigments are the<br />
paint, paper and plastics<br />
industries. <strong>Kemira</strong> Pigments’<br />
plants are located in<br />
Finland, the Netherlands<br />
and the United States.<br />
<strong>Kemira</strong> is peeling off the two<br />
last-mentioned.<br />
Net sales in <strong>1999</strong>, EUR million 488<br />
% of Group net sales 19<br />
Operating income, EUR million 35<br />
% of Group operating income 31<br />
Personnel at 31.12. 1,705<br />
OTHER COMPANIES<br />
<strong>Kemira</strong> Metalkat manufactures catalytic converters and <strong>Kemira</strong> Safety makes<br />
respiratory protective equipment. <strong>Kemira</strong> Oyj is the parent company of the<br />
Group, and it is responsible for the Group’s strategic management,<br />
administration, finance and other corporate services as well as the sale of<br />
energy. These three companies had aggregate net sales in <strong>1999</strong> of EUR 77<br />
million, representing 3% of consolidated net sales. The number of personnel at<br />
the end of the year was 455 people.<br />
5
TO THE READER<br />
For <strong>Kemira</strong>, the 2000 decade is opening in the midst<br />
of a reassessment of the Group’s business mix.<br />
Towards the end of <strong>1999</strong> we took a decision to<br />
sharpen the focus of our Group strategy.<br />
Our objective is a more stable profit-making<br />
ability and faster growth within paper and pulp<br />
chemicals, water treatment chemicals and paints.<br />
Speciality fertilizers and industrial chemicals<br />
generate cash flow. We will lower substantially the<br />
proportion of capital-intensive, cyclically sensitive<br />
business from the present level. This will mean<br />
ownership and cooperation arrangements within the<br />
titanium dioxide pigment and nitrogen fertilizer<br />
businesses.<br />
In <strong>1999</strong> the world economy<br />
rebounded smartly, spurred by brisk<br />
growth in the United States and<br />
Asia. Within the European chemical<br />
industry the signs of an upswing<br />
began to show up in the latter<br />
months of the year.<br />
Most of <strong>Kemira</strong>’s business areas<br />
developed favourably during the<br />
year under review, but despite this<br />
the Group’s financial result<br />
weakened compared with the<br />
previous year. This was attributable<br />
above all to the large non-recurring costs incurred<br />
by <strong>Kemira</strong> Agro and to the low prices of fertilizers.<br />
Environmental issues are of central importance to<br />
<strong>Kemira</strong>. Environmental issues place great demands<br />
on the chemical industry, but at the same time<br />
solutions to them offer new opportunities for us to<br />
develop our operations. We offer our customers<br />
products and services that enable them to deal with<br />
environmental issues efficiently. Last year the<br />
environmental business generated EUR 313 million<br />
of income, or a good 12 per cent of our net sales.<br />
This business will account for a growing share of<br />
our operations in coming years.<br />
We aim to focus particular attention on research<br />
and development. At the same time we will exploit<br />
more widely than ever before our own expertise<br />
and the synergies among our business areas. An<br />
example of a unifying factor is water: we supply<br />
products and know-how to municipalities and<br />
industry for the purification of drinking and waste<br />
water as well as for the treatment of process water<br />
in the paper industry. We also manufacture waterborne<br />
paints and water-soluble speciality fertilizers. A<br />
special Water Research Centre has been set up in<br />
conjunction with our research centre in Oulu, Finland.<br />
Now that our operations are shifting from<br />
products of the heavy basic chemical industry<br />
towards integrated customer solutions, we must<br />
ensure that our people have new knowledge, skills<br />
and capabilities. Development of the personnel and<br />
rewards for good work are one of the main focuses<br />
of our attention.<br />
The outlook for 2000 is encouraging, both for<br />
<strong>Kemira</strong> and elsewhere. Asia is expected to recover<br />
and reach nearly the growth rate of<br />
past years, whereas Europe may rival<br />
the United States’ growth figures. In<br />
step with improved export prospects,<br />
the chemical industry is expected to<br />
continue its steady growth. CEFIC, the<br />
European chemical industry’s<br />
umbrella organization, has forecast<br />
growth of 3.5% in 2000.<br />
By realigning our strategy, we will<br />
achieve a more efficient use of capital<br />
and improve the Group’s cash flow. A<br />
sharper focus will also enable us to<br />
step up our R&D activities and to direct growth<br />
towards fields with the most stable business<br />
outlook. Our clear-cut objective is to increase<br />
<strong>Kemira</strong>’s shareholder value. Although these major<br />
changes will take time, I nevertheless believe that<br />
<strong>Kemira</strong>’s structure and earnings ability will be<br />
substantially better even by the end of 2000.<br />
I wish to thank our customers, shareholders and<br />
other stakeholders for their contributions during the<br />
past year. A special vote of thanks goes to our<br />
personnel for the good job they have done, and<br />
I furthermore believe that as we give our people a<br />
greater say in how things are done at our company<br />
sites, we will at the same time create a strong spirit<br />
of cooperation across a <strong>Kemira</strong> that is undergoing<br />
fundamental renewal.<br />
Tauno Pihlava<br />
CEO<br />
6
BOARD OF DIRECTORS’ REVIEW<br />
The members of the Board of<br />
Directors of <strong>Kemira</strong> Oyj in<br />
<strong>1999</strong> were (from the left)<br />
Vice Chairman Timo<br />
Mattila, Juhani Kari, Tauno<br />
Pihlava, as from 1 June,<br />
Chairman Heimo Karinen,<br />
Esa Tirkkonen, Leif Ekström<br />
and Sten-Olof Hansén.<br />
<strong>1999</strong> was a spotty year for the <strong>Kemira</strong><br />
Group. The positive trend continued for<br />
both <strong>Kemira</strong> Chemicals and <strong>Kemira</strong> Pigments,<br />
both of which improved their<br />
earnings markedly. <strong>Kemira</strong> Agro suffered<br />
from the oversupply of nitrogen fertilizers<br />
and record-low prices. Tikkurila in turn<br />
fared well in the Finnish and Scandinavian<br />
market, but sales in Russia again<br />
trailed the previous year. Similarly, sales<br />
of Tikkurila’s CPS tinting machines fell<br />
clearly short of the previous year’s figure.<br />
Consolidated net sales were up 5% on<br />
the previous year and were EUR 2,526<br />
million (2,413 million in 1998). Operating<br />
income was EUR 111 million (148 million<br />
in 1998), which includes EUR 28 million<br />
of non-recurring net costs. Operating income<br />
was 4% of net sales.<br />
Income before taxes and minority interests<br />
fell to EUR 59 million, from EUR<br />
97 million a year earlier. Taking into account<br />
the non-recurring costs of the<br />
structural change, the Group’s net income<br />
before extraordinary items was<br />
near the previous year’s level. Income after<br />
taxes was EUR 30 million (EUR 79<br />
million in 1998). Earnings per share were<br />
EUR 0.23 (0.61).<br />
The major factors that influenced the<br />
trend in net sales were the fast growth in<br />
the sales of <strong>Kemira</strong> Chemicals’ pulp and<br />
paper chemicals (in part thanks to the<br />
previous year’s acquisitions) as well as<br />
the marked growth in the sales volumes<br />
of <strong>Kemira</strong> Pigments’ titanium dioxide pigments.<br />
About 82% of the Group’s net<br />
sales came from outside Finland.<br />
The table on page 12 shows the<br />
breakdown of consolidated net sales<br />
among the different business areas.<br />
Return on equity was 3.2%. The cash<br />
flow return on capital invested was 9%.<br />
The Group’s gearing ratio was 95%.<br />
The Board of Directors proposes that<br />
a dividend of EUR 0.23 per share be paid<br />
for the <strong>1999</strong> financial year, or a total dividend<br />
payout of EUR 29.6 million.<br />
NEW STRATEGIC FOCUS<br />
In order to improve competitiveness and<br />
profitability, the Board of Directors decided<br />
to overhaul its business strategy in<br />
such a way that in the future the Group<br />
will concentrate on fields that have promising<br />
growth prospects and are less dependent<br />
on economic cycles than is the<br />
industry average. In accordance with the<br />
new strategy, <strong>Kemira</strong> will seek growth<br />
within paper and pulp chemicals, water<br />
treatment chemicals and paints. Other priority<br />
areas are speciality fertilizers and industrial<br />
chemicals.<br />
For the fields falling outside the new<br />
core business (titanium dioxide pigments<br />
and nitrogen fertilizers) solutions that enhance<br />
their cash flow generation potential<br />
will be sought by way of co-operation or<br />
ownership arrangements. The growth potential<br />
of the Tikkurila CPS unit, which<br />
has specialized in colour processing systems,<br />
will be promoted by separating it<br />
out from the paint business either by listing<br />
it on the stock exchange or by means<br />
of other M&A arrangements.<br />
The arrangements concerning <strong>Kemira</strong><br />
Pigments have progressed the farthest<br />
now that sale agreements have been<br />
signed for the divestment of the plants in<br />
the United States and the Netherlands.<br />
Plans concerning Tikkurila CPS are also<br />
expected to be implemented this year. It<br />
is more difficult to set a time for the arrangements<br />
concerning <strong>Kemira</strong> Agro’s nitrogen<br />
fertilizer business, but the objective<br />
is nevertheless to find a solution already<br />
during the current year.<br />
The cash flow from the arrangements<br />
will be used for the accelerated expansion<br />
of the above-mentioned growth areas,<br />
both organically and via acquisitions.<br />
<strong>Kemira</strong> considers eastern Central Europe,<br />
Russia, North America, and the Far East to<br />
be its geographical growth areas.<br />
In connection with <strong>Kemira</strong>’s strategy<br />
process, the Board of Directors confirmed<br />
the new financial targets for the Group’s<br />
profitable growth. At the same time attention<br />
will be paid to the efficient use of<br />
capital and to the Group’s balance sheet<br />
structure. The objectives are set forth in<br />
the table on page 4.<br />
KEMIRA CHEMICALS<br />
The Group’s fastest growing area was<br />
again <strong>Kemira</strong> Chemicals, whose net sales<br />
rose by 11% to EUR 697 million (630 million<br />
in 1998). All three strategic business<br />
units – Pulp & Paper Chemicals, Kemwa-<br />
7
ter and Industrial Chemicals – grew.<br />
<strong>Kemira</strong> Fine Chemicals also grew further.<br />
<strong>Kemira</strong> Chemicals posted operating income<br />
of EUR 83 million (75 million in<br />
1998), or 12% of net sales (12%). Operating<br />
income for the September-December<br />
period was 27 million, compared with EUR<br />
20 million in the same period a year earlier.<br />
While the previous year’s change in the<br />
actuarial assumptions for calculating the liability<br />
of Finnish pension funds resulted in<br />
a non-recurring cost of about EUR 4 million<br />
as a contribution to the supplementary<br />
pension foundation, another change<br />
brought a nearly equally large credit to income<br />
last year.<br />
Sales by the Pulp & Paper Chemicals<br />
unit, which has been named one of the<br />
Group’s strategic growth areas, grew by<br />
18%. About half of the growth was generated<br />
thanks to the acquisitions made in<br />
1998 (the hydrogen peroxide plants in<br />
South Korea and Canada). The remainder<br />
represented organic growth, because the<br />
production volumes of the pulp and paper<br />
industry developed favourably as the<br />
year wore on.<br />
Demand for hydrogen peroxide held<br />
up well and prices have risen slightly.<br />
The other products of the Pulp & Paper<br />
unit have also sold well, and the unit has<br />
been able to keep up its good profitability.<br />
The unit invested about EUR 5 million<br />
in its plant in Vaasa, with the aim of expanding<br />
the speciality chemicals business<br />
and improving the efficiency of AKD sizing<br />
production and product quality.<br />
In line with its worldwide growth<br />
strategy, the Pulp & Paper Chemicals unit<br />
is strengthening its market position in<br />
South America significantly by building a<br />
paper chemicals plant in the Brazilian<br />
state of Parana and by bringing in its own<br />
expertise to serve the local paper industry.<br />
Production of sizing and speciality<br />
chemicals used in the paper industry is<br />
estimated to get started towards the end<br />
of this year.<br />
The markets of the Kemwater business<br />
unit developed as expected and<br />
growth continued in Eastern and Southern<br />
Europe. Kemwater’s net sales grew by<br />
7%, though operating income was below<br />
last year’s figure owing to start-up costs<br />
and credit loss provisions. Kemwater is<br />
another of the <strong>Kemira</strong> Chemicals units<br />
that belongs to the Group’s strategic<br />
growth areas.<br />
Many of the regional expansions of<br />
the operations that were launched by<br />
Kemwater in the previous year resulted in<br />
larger costs compared with normal operations,<br />
though they did not generate corresponding<br />
income. Kemwater Brasil S.A.<br />
invested EUR 3.1 million in a water chemicals<br />
plant that is to be built in Salvador in<br />
northern Brazil. The new plant will manufacture<br />
solid iron sulphate and it is estimated<br />
to be completed in the first half of<br />
this year. This will make <strong>Kemira</strong> Brasil the<br />
market leader within water chemicals in<br />
Brazil.<br />
At the beginning of last year an agreement<br />
entered into effect by which <strong>Kemira</strong><br />
Chemicals purchased from the Solvay<br />
company of Belgium, its ferrichloride production<br />
located in Rheinberg, Germany.<br />
Kemwater will double the unit’s production<br />
and at the same time modernize the<br />
plant’s production technology so that energy<br />
consumption and waste water flows<br />
can be lowered significantly. The cost of<br />
the capital project is EUR 2.7 million.<br />
In Pori, Kemwater is upgrading its<br />
Ferix plant so that it will be able also to<br />
produce a very pure iron-based coagulant<br />
that is suitable for the purification of<br />
drinking water. In order to gain a foothold<br />
in the growing Chinese market,<br />
<strong>Kemira</strong> Chemicals signed an agreement<br />
on establishing a joint venture manufacturing<br />
water treatment chemicals in China<br />
in the vicinity of Shanghai and Nanking.<br />
<strong>Kemira</strong> Chemicals’ interest in the new<br />
Kemwater (Yixing) Co. Ltd is initially 49%.<br />
Finnfund has an 11% stake in the company.<br />
Kemwater and the City of Helsinki established<br />
a joint service company in the<br />
water treatment field. Kemwater has a<br />
51% stake in the company.<br />
Sales by the Industrial Chemicals unit<br />
were up 4%. The market situation for<br />
phosphoric acid is still stable, but there<br />
has been continued tough competition<br />
within down-stream products made from<br />
phosphoric acid (feed and detergent<br />
phosphates). The exceptionally large-scale<br />
shutdown at the Siilinjärvi plants caused<br />
additional costs. EUR 12 million was invested<br />
on Siilinjärvi to develop the site’s<br />
production and ensure its competitiveness.<br />
The calcium chloride market is tight,<br />
because substitute products are putting<br />
pressure on prices and, additionally, raw<br />
materials are becoming more expensive.<br />
Operations of the sodium percarbonate<br />
plant that was completed in the previous<br />
year showed positive development and<br />
the future outlook is good and the new<br />
product has been well received by customers.<br />
<strong>Kemira</strong> Fine Chemicals increased both<br />
its net sales and operating income. The<br />
unit is a custom manufacturer of demanding<br />
fine chemicals and last year it signed a<br />
five-year agreement with Monsanto concerning<br />
the manufacture of the active ingredient<br />
in a new wheat fungicide.<br />
NET SALES<br />
Other countries<br />
Finland<br />
EUR<br />
million<br />
3000<br />
2500<br />
NET SALES BY BUSINESS<br />
AREA<br />
<strong>Kemira</strong><br />
Chemicals<br />
26 %<br />
Other 3 %<br />
OPERATING INCOME BY<br />
BUSINESS AREA<br />
EUR<br />
million<br />
100<br />
80<br />
2000<br />
60<br />
1500<br />
<strong>Kemira</strong><br />
Agro<br />
38 %<br />
40<br />
20<br />
1000<br />
0<br />
95 96 97 98 99<br />
500<br />
0<br />
Tikkurila<br />
14 %<br />
<strong>Kemira</strong><br />
Pigments<br />
19 %<br />
Chemicals Agro<br />
Tikkurila Pigments<br />
–20<br />
–40<br />
8
TIKKURILA<br />
Tikkurila’s net sales fell 1% short of the<br />
previous year’s figure and were EUR 357<br />
million (361 million in 1998). Sales of<br />
decorative paints in Finland were brisker<br />
than last year, whereas the economic crisis<br />
in Russia still kept sales volumes<br />
small. Worldwide sales of colorants grew<br />
further, but this was offset by the sales<br />
of tinting machines, which were markedly<br />
smaller than they were a year earlier.<br />
Operating income was EUR 23 million<br />
(33 million in 1998), or 6% of net<br />
sales. Operating income in the September-December<br />
period was EUR 1.6 million,<br />
compared with an operating loss of<br />
0.8 million in the same period a year<br />
earlier. Credit loss provisions primarily<br />
for receivables from Russia were booked<br />
in a total amount of EUR 3.1 million, of<br />
which about a quarter came in the last<br />
three-month period.<br />
The control system of Tikkurila’s<br />
Monicolor plant in Vantaa was renewed<br />
and at the same time production capacity<br />
was raised significantly. In the vicinity<br />
of Moscow, construction work got started<br />
on a second paint plant that Tikkurila<br />
will operate in Russia. The target is to<br />
start production in the first half of this<br />
year. Deliveries by the company’s plants<br />
in St Petersburg picked up towards the<br />
end of the year. In Western Europe testing<br />
of a new marketing concept was<br />
started during the year in co-operation<br />
with the Italian company Benetton.<br />
A colorant plant was completed in<br />
Singapore towards the end of the year.<br />
In China too a unit that will manufacture<br />
components for colour processing systems<br />
will be built.<br />
In line with the new strategic focus,<br />
the Group’s objective is to promote the<br />
growth potential of the paint business by<br />
divesting Tikkurila CPS either entirely or<br />
in part.<br />
KEMIRA AGRO<br />
<strong>Kemira</strong> Agro’s net sales declined by 2%<br />
and were EUR 1,015 million. The volume<br />
of sales in Western Europe was at<br />
the previous year’s level. Overseas exports<br />
outside Europe grew significantly,<br />
up 35% on the previous year. On the<br />
other hand, the plant nutrient markets in<br />
Finland’s nearby areas in the Baltic<br />
countries and Poland were in decline.<br />
Prices of plant nutrients fell further,<br />
by 5-15%, particularly within nitrogen<br />
fertilizers in Western Europe and they<br />
ended at an all-time low level. New capacity,<br />
the cost advantage which Russian<br />
nitrogen products enjoy owing to cheap<br />
natural gas, and China’s absence as a<br />
purchaser of nitrogen products have all<br />
been factors keeping prices of these<br />
products low. At present it nevertheless<br />
appears that prices bottomed out towards<br />
the end of the year. Owing to the<br />
risks posed by the East European countries<br />
and the Baltic area, credit loss provisions<br />
were increased by total of EUR 6<br />
million.<br />
The fall in the prices and sales volume<br />
of plant nutrients was reflected in<br />
the company’s operating income, which<br />
fell significantly and was a loss of EUR<br />
39 million. In the September-December<br />
period operating income was EUR 37<br />
million negative, whereas a year earlier<br />
it was EUR 19 million negative. Operating<br />
income in the last four months of the<br />
year includes a total of EUR 23 million<br />
of non-recurring costs that are mainly<br />
connected with the company’s structural<br />
change.<br />
In line with the Group’s strategic<br />
policy, <strong>Kemira</strong> Agro will focus on speciality<br />
fertilizers and withdraw from the nitrogen<br />
fertilizer business either in part or<br />
totally. In anticipation of this change, the<br />
company’s organization was divided into<br />
two parts in January 2000: the speciality<br />
fertilizer business and the nitrogen fertilizer<br />
business.<br />
NPK fertilizer production was wound<br />
up at Pernis in the Netherlands and<br />
plans call for also closing the phosphoric<br />
acid, sulphuric acid and MAP/DAP phosphorus<br />
fertilizer plants in the summer of<br />
this year. <strong>Kemira</strong> Agro booked a total of<br />
EUR 39 million of non-recurring costs for<br />
the past financial year, the bulk of which<br />
was related to the arrangements at<br />
Pernis.<br />
In accordance with the memorandum<br />
of intent that was signed in the previous<br />
year, <strong>Kemira</strong> Agro established a<br />
joint venture that will manufacture potassium<br />
nitrate, which is a speciality fertilizer,<br />
and dicalcium phosphate, a raw<br />
material used in feeds, in Jordan. The<br />
capital project, which is to be completed<br />
in 2002, is based on local raw materials<br />
and <strong>Kemira</strong>-developed cost-effective<br />
technology.<br />
In Italy, <strong>Kemira</strong> Agro acquired a 50%<br />
interest in Biolchim S.p.A, which markets<br />
horticultural fertilizers. A joint venture<br />
that will manufacture urea phosphate<br />
was established in the United Arab<br />
Emirates. The new company will build a<br />
new plant in Dubai with the objective of<br />
starting production by the end of 2000.<br />
The joint ventures in Dubai, Jordan<br />
and Italy will enable <strong>Kemira</strong> Agro to expand<br />
its operations, according to its specialization<br />
strategy, in the irrigation fertilizer<br />
markets in the Mediterranean countries<br />
as well as in the Middle East and<br />
NET SALES BY REGION<br />
OPERATING INCOME AND RESULT<br />
RETURN ON CAPITAL<br />
Asia<br />
7 %<br />
Other<br />
2 %<br />
%<br />
12<br />
Operating income<br />
Income before taxes<br />
Operating margin, %<br />
EUR<br />
million<br />
300<br />
Return on equity, %<br />
Return on capital invested, %<br />
%<br />
14<br />
Americas<br />
13 % Finland<br />
18 %<br />
10<br />
8<br />
250<br />
200<br />
12<br />
10<br />
6<br />
150<br />
8<br />
6<br />
4<br />
100<br />
4<br />
Other<br />
Europe<br />
8 %<br />
Other EU<br />
52 %<br />
2<br />
0<br />
95 96 97 98 99<br />
50<br />
0<br />
95 96 97 98 99<br />
2<br />
0<br />
9
Far East. In Denmark, potassium nitrate<br />
production was expanded, and the plant<br />
extension is being continued through a<br />
new investment that is expected to be<br />
completed in the autumn of 2000.<br />
NPK projects in Southeast Asia progressed<br />
according to plans and the plant<br />
of a joint venture in Malesia, in which<br />
<strong>Kemira</strong> Agro has a 30% holding, started<br />
up in mid-<strong>1999</strong>. Construction works on<br />
the plant in China continued ahead and<br />
the facility is expected to reach completion<br />
in the autumn of 2000. <strong>Kemira</strong> Agro<br />
has a 49% interest and Finnfund a 26%<br />
interest in the joint venture in China.<br />
In Finland, <strong>Kemira</strong> Agro purchased<br />
an 20% holding in the Suomen Rehu animal<br />
feed business, thereby strengthening<br />
the logistics co-operation that has already<br />
been started.<br />
The development programme that<br />
was launched at the beginning of 1998<br />
at <strong>Kemira</strong> Agro has progressed according<br />
to plans. Its objective is to achieve a<br />
significant improvement in earnings,<br />
which will show up to the full extent in<br />
2001.<br />
KEMIRA PIGMENTS<br />
<strong>Kemira</strong> Pigments’ net sales rose by 15%<br />
and were EUR 488 million. Average selling<br />
prices for titanium dioxide pigments<br />
during the year were at the previous<br />
year’s level. Selling prices in the September-December<br />
period were about 2%<br />
lower than prices in the May-August period<br />
and prices in the last four months<br />
of 1998.<br />
Sales volumes of titanium dioxide<br />
pigments were 13% higher than they<br />
were a year earlier. The sales volume in<br />
the last four months of the year was 25%<br />
higher than it was in the last four<br />
months of the previous year, a situation<br />
that may be partly attributable to the<br />
precautions taken by customers on the<br />
eve of the new millennium.<br />
Demand was in decline in Europe<br />
and Asia in the previous year, but it<br />
swung to strong growth during <strong>1999</strong>,<br />
particularly after the January-April period.<br />
In North America demand remained<br />
good, though in Latin America it was<br />
weak throughout the year.<br />
Changes in the titanium dioxide industry<br />
continued when the American<br />
company Huntsman Chemicals acquired<br />
Tioxide from ICI. <strong>Kemira</strong> is also peeling<br />
off its plants in the United States and the<br />
Netherlands.<br />
<strong>Kemira</strong> Pigments’ operating income<br />
was EUR 35 million (22 million in 1998),<br />
or 7% of net sales. Operating income in<br />
the September-December period was<br />
EUR 18 million, as against EUR 10 million<br />
in the previous four month period<br />
and EUR 7 million in the last four month<br />
period of the previous year. A change in<br />
the actuarial assumptions for calculating<br />
the liability of Finnish pension funds resulted<br />
in a non-recurring reversal of<br />
about EUR 3 million in contributions to<br />
the supplementary pension foundation<br />
in the September-December period,<br />
whereas in the previous year the change<br />
resulted in having to book a one-off expense<br />
of the same size.<br />
The debottlenecking project at the<br />
Pori plant was completed according to<br />
plans towards the end of the <strong>1999</strong>.<br />
Thereafter the Pori unit’s production capacity<br />
will be 120,000 tonnes a year.<br />
OTHER UNITS<br />
<strong>Kemira</strong> Metalkat, which manufactures<br />
catalytic converters, reported net sales<br />
growth of 19%, to EUR 36 million. Operating<br />
income was EUR 3.1 million, as<br />
against EUR 1.7 million a year earlier.<br />
Net sales by <strong>Kemira</strong> Safety, which manufactures<br />
personal protection equipment,<br />
were down 1%, to EUR 14 million. Operating<br />
income was EUR 0.9 million (1.3<br />
million in 1998).<br />
GROUP FINANCIAL PERFORMANCE<br />
The Group’s operating income was EUR<br />
111 million (148 million in 1998), or 4%<br />
of net sales. This figure includes a total<br />
of EUR 28 million of non-recurring net<br />
costs. Income before taxes and minority<br />
interests was 59 million (97 million in<br />
1998). Net financial expenses were EUR<br />
52 million (51 million in 1998). Income<br />
after taxes was EUR 30 million (79 million<br />
in 1998). The effective tax rate rose<br />
from 20% to 47%. The increase in the effective<br />
tax rate was mainly due to the<br />
non-recurring costs booked. As was reported<br />
in the previous year’s financial<br />
statements, taxes in the 1998 income<br />
statement were reduced by an EUR 14<br />
million deferred taxes item which resulted<br />
from a review of the accounting policy<br />
in line with changed IAS rules. The<br />
return on capital invested was 5.9%<br />
(8.3%).<br />
CAPITAL EXPENDITURE<br />
The Group’s capital expenditures totalled<br />
168 million (255 million in 1998),<br />
or 6.7% of net sales. Capital expenditures<br />
were at a clearly lower level than<br />
they were a year earlier because no major<br />
acquisitions were made. Depreciation<br />
on fixed assets amounted to EUR 188<br />
million. Proceeds on the sale of fixed assets<br />
amounted to EUR 18 million (14<br />
million in 1998), whereby net capital expenditures<br />
were 150 million, or 5.9% of<br />
net sales. The Group’s environmental<br />
INVESTOINNIT<br />
CAPITAL EXPENDITURE<br />
% As % of net sales<br />
12<br />
10<br />
euroa EUR<br />
million<br />
300<br />
250<br />
CAPITAL EXPENDITURE BY<br />
BUSINESS AREA<br />
<strong>Kemira</strong><br />
Chemicals<br />
29 %<br />
Other<br />
2 %<br />
<strong>Kemira</strong><br />
Agro<br />
28 %<br />
EUR<br />
million<br />
1000<br />
800<br />
NET DEBT AND FINANCING<br />
EXPENSES<br />
Net debt<br />
Net financing expenses, % of<br />
liabilities<br />
%<br />
15<br />
12<br />
8<br />
200<br />
600<br />
9<br />
6<br />
150<br />
4<br />
100<br />
400<br />
6<br />
2<br />
0<br />
95 96 97 98 99<br />
50<br />
0<br />
Tikkurila<br />
13 %<br />
<strong>Kemira</strong><br />
Pigments<br />
28 %<br />
200<br />
0<br />
95 96 97 98 99<br />
3<br />
0<br />
10
protection investments were EUR 13 million.<br />
All the most important capital expenditures<br />
are discussed in the reviews<br />
of the business areas.<br />
The Group spent about EUR 48 million<br />
on research and development, or<br />
about 2% of net sales. The figure does<br />
not include capital expenditures.<br />
ENVIRONMENTAL PROTECTION AND<br />
MANAGEMENT OF RISKS<br />
Environmental protection is an essential<br />
part of the Group’s operations, and a<br />
verified Environmental <strong>Report</strong> is included<br />
in this <strong>Annual</strong> <strong>Report</strong>.<br />
The Group continually pays particular<br />
attention to ensuring that its operations<br />
are safe and its plants run without<br />
disturbances. In view of this, operations<br />
are also evaluated together with the risk<br />
management units of insurance companies.<br />
The <strong>Kemira</strong> Group made the changeover<br />
to the year 2000 without any significant<br />
problems.<br />
FINANCING<br />
The Group’s financial position remained<br />
stable. Interest-bearing net debt at the<br />
end of <strong>1999</strong> stood at EUR 934 million<br />
(892 million at the end of 1998). The<br />
strengthening of the United States dollar,<br />
the British pound and the Swedish krona<br />
against the euro raised the consolidation<br />
values of loans taken out in these currencies.<br />
This lead to an increase in net<br />
debt. During the year two new loans<br />
were raised in a total amount of EUR 25<br />
million and with maturities of about 10<br />
years.<br />
Cash flow before financing was EUR<br />
31 million (119 million negative in 1998).<br />
The Group’s equity ratio was 38% at the<br />
close of the year (39%). The gearing ratio<br />
(net debt as a ratio of shareholders’<br />
equity) was 95%. The amount of liquid<br />
funds remained at the same level as during<br />
the previous year. At the end of the<br />
year they amounted to EUR 88 million<br />
and unused agreed credit facilities<br />
amounted to about 260 million.<br />
Net financing expenses were EUR 52<br />
million (51 million in 1998). The increase<br />
in costs due to the rise in interest<br />
rates was partially compensated by<br />
smaller losses on foreign exchange as<br />
well as to measures taken for hedging<br />
interest rate risks. The proportion which<br />
fixed-interest loans represent within the<br />
total amount of the Group’s interestbearing<br />
long-term loans (excluding pension<br />
loans, which are not considered to<br />
be fixed-interest liabilities) was 41% at<br />
the end of the year. Foreign exchange<br />
losses amounted to EUR 1.6 million (a<br />
foreign exchange loss of EUR 5.4 million<br />
in 1998).<br />
PARENT COMPANY’S FINANCIAL<br />
PERFORMANCE<br />
The parent company’s net sales come<br />
only from the sale of energy in Finland,<br />
both within and outside the Group. The<br />
parent company had net sales of EUR 27<br />
million (32 million in 1998). Operating<br />
income was EUR 3.5 million (an operating<br />
loss of EUR 6.7 million in 1998). The<br />
parent company bears the cost of Group<br />
management and administration.<br />
The parent company and the<br />
Eläkesäätiö Neliapila pension foundation<br />
sold a significant part of their electric<br />
power business for EUR 30 million. The<br />
deal yielded a capital gain of about EUR<br />
9 million for the parent company. For<br />
Eläkesäätiö Neliapila, the capital gain<br />
contributed to lowering contributions to<br />
the fund.<br />
The parent company’s financial income<br />
amounted to EUR 16.5 million (8.2<br />
million in 1998). Income before taxes<br />
and appropriations was EUR 102 million<br />
(108 million in 1998). The parent company’s<br />
capital expenditures amounted to<br />
EUR 67 million, including increases in<br />
the equity of subsidiaries.<br />
PERSONNEL<br />
The Group employed an average of<br />
10,743 people, or 42 less than in the<br />
previous year. Of the total personnel, an<br />
average of 5,653 people were employed<br />
by Group companies outside Finland.<br />
The parent company had an average<br />
payroll of 132 employees , one less than<br />
a year ago.<br />
The Group’s total salaries and wages<br />
were EUR 353 million (338 million in<br />
1998) and the parent company’s total<br />
salaries and wages were EUR 5.2 million<br />
(4.8 million in 1998). Salaries and remuneration<br />
paid to the Supervisory Board,<br />
the members of the Board of Directors<br />
and the managing directors totalled EUR<br />
8.3 million for the Group (EUR 8.2 million<br />
in 1998) and EUR 0.9 million for the<br />
parent company (0.8 million in 1998).<br />
During the year under review the<br />
following persons served on the Board<br />
of Directors of <strong>Kemira</strong> Oyj: Heimo Karinen<br />
(Chairman), Timo Mattila (Vice<br />
Chairman), Juhani Kari, Esa Tirkkonen,<br />
Tauno Pihlava as of 1 June, Leif Ekström<br />
and Sten-Olof Hansén, the last two of<br />
whom served as non-executive directors.<br />
At its meeting on 16 December <strong>1999</strong>, the<br />
Supervisory Board elected the following<br />
six persons to seats on the Board of Directors<br />
for the period of office beginning<br />
on 1 January 2000: Sten-Olof Hansén<br />
(Chairman), Niilo Pellonmaa (Vice Chair-<br />
GEARING<br />
CASH FLOW<br />
PERSONNEL<br />
%<br />
140<br />
120<br />
100<br />
Cash flow from operations EUR<br />
million<br />
Cash flow after capital expenditure<br />
300<br />
200<br />
USA<br />
6 %<br />
Other<br />
countries<br />
23 %<br />
Finland<br />
47 %<br />
80<br />
100<br />
Target<br />
95 96 97 98 99<br />
60<br />
40<br />
20<br />
Net debt divided by net debt plus<br />
equity.<br />
0<br />
95 96 97 98 99<br />
0<br />
–100<br />
–200<br />
Holland<br />
8 %<br />
Sweden<br />
8 %<br />
UK<br />
8 %<br />
The average number of personnel<br />
in <strong>1999</strong> was 10,743.<br />
11
man), Timo Kaisanlahti, Eija Malmivirta,<br />
Anssi Soila and Tauno Pihlava.<br />
CEO and Chairman Heimo Karinen<br />
retired at the end of <strong>1999</strong> and Tauno<br />
Pihlava was elected to succeed him as<br />
CEO effective 1 January 2000.<br />
A large part of the Group’s personnel<br />
are covered by various bonus systems<br />
that vary from country to country. In addition,<br />
the Group has a share option system<br />
for top management. This is discussed<br />
in greater detail on pages 13.<br />
On the basis of an authorization<br />
granted to the Board of Directors by the<br />
<strong>Annual</strong> General Meeting, the company<br />
bought back a total of 1,000,000 of its<br />
own shares during the summer at an average<br />
price of EUR 5.82. The authorization<br />
was for purchasing a total maximum<br />
amount of 2% of the shares outstanding<br />
and the shares are to be used in paying<br />
profit-related bonuses to the personnel<br />
funds in the event that the funds choose<br />
this mode of payment.<br />
OWNERSHIP<br />
The Finnish government’s holding in<br />
<strong>Kemira</strong> was 53.4% at 31 December <strong>1999</strong>.<br />
The proportion held by institutional investors<br />
outside Finland was 19.0%,<br />
whereas Finnish institutional investors<br />
and mutual funds held 21.3% of the<br />
shares. Private investors’ holdings<br />
amounted to 6.3% of the shares outstanding.<br />
CHANGES IN THE GROUP STRUCTURE<br />
Various companies or participations<br />
were established, acquired or divested<br />
during the year, as discussed in the review<br />
of the business areas above. The<br />
changes in the Group structure are<br />
presented in more detail on page 35.<br />
Demand for titanium dioxide pigments<br />
is expected to be good and average<br />
prices to rise higher than last year’s<br />
when the price increases that were announced<br />
towards the end of last year<br />
come into effect at the beginning of the<br />
current year. This year’s net sales will be<br />
highly dependant on the timing of the<br />
closing of the divestment of the US and<br />
Dutch operations, whereas it is not expected<br />
to have any major impact on the<br />
operating income. It is believed that<br />
<strong>Kemira</strong> Pigments’ operating income will<br />
improve on last year’s.<br />
No essential improvement is likely to<br />
take place in the world markets for agricultural<br />
products during 2000. Recently a<br />
number of West European and American<br />
fertilizer producers have announced<br />
plant closures to cut capacity, and prices<br />
have headed upwards. On the other<br />
hand, China is curtailing its imports of<br />
NPK compound fertilizers, and this will<br />
probably lead to smaller export volumes<br />
than before. The higher cost of natural<br />
gas due to the rise in oil prices will lift<br />
costs in continental Europe. Although<br />
the horticultural fertilizer business in expected<br />
to show continued positive development,<br />
and the profit-boosting programme<br />
that was started last year is progressing<br />
according to plans, it is believed<br />
that the operating result within<br />
the framework of <strong>Kemira</strong> Agro’s present<br />
structure will still be in the red. Disposal<br />
of the nitrogen fertilizer business is expected<br />
to improve the result in coming<br />
years, but it is so far not possible to estimate<br />
the one-off impacts of the arrangement.<br />
Demand for Tikkurila’s paints is expected<br />
to grow both in the established<br />
markets and in those which are just beginning<br />
to expand. Growth prospects<br />
are promising, particularly in Russia, the<br />
Baltic countries and Poland. Operating<br />
income is expected to improve on last<br />
year’s. In order to ensure the continued<br />
growth of both the paint and colour<br />
processing system business, <strong>Kemira</strong> intends<br />
to separate the colour processing<br />
business out from the paint business either<br />
by listing it on the stock exchange<br />
or through other ownership arrangements<br />
2000 is expected to be a year of<br />
great changes for <strong>Kemira</strong>, because the<br />
company is withdrawing from a significant<br />
part of its previous core businesses.<br />
At the most, net sales may drop by<br />
about a third from the present level as a<br />
consequence of the divestments. The<br />
funds realized from the disposals will be<br />
applied towards expanding <strong>Kemira</strong>’s<br />
business operations in chosen growth areas:<br />
pulp and paper chemicals, water<br />
treatment chemicals and paints. The objective<br />
is to regain the previous level of<br />
net sales within 3-5 years. This will also<br />
call for acquisitions over the next few<br />
years. Although <strong>Kemira</strong> Agro’s operating<br />
result will remain weak, the operating<br />
result of the other three large businesses<br />
is expected to improve. Net financial expenses<br />
are estimated to remain at the<br />
previous level or to rise only slightly<br />
from the present level. The Group’s result<br />
for the current year is expected to<br />
improve on last year’s earnings.<br />
Beginning this year, <strong>Kemira</strong> will report<br />
its results quarterly. The table on<br />
page 69 presents the quarterly financial<br />
development for <strong>1999</strong> and 1998.<br />
OUTLOOK FOR THE FUTURE<br />
The rise in the rate of capacity utilization<br />
that got under way within the pulp and<br />
paper industry towards the end of <strong>1999</strong><br />
and the improvement in the demand for<br />
paper products are expected to continue<br />
in the current year. This is expected to<br />
have a positive impact on the market situation<br />
for pulp and paper chemicals.<br />
The market for water treatment chemicals<br />
appears stable, and the companies<br />
that were established or acquired last<br />
year are expected to get up to good<br />
speed. The price of phosphoric acid may<br />
fall, but at present this is offset by the<br />
high exchange rate of the dollar against<br />
the euro. It is believed that <strong>Kemira</strong><br />
Chemicals’ operating income will remain<br />
at the present level or grow in 2000.<br />
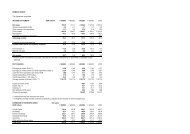
EARNINGS AND PERSONNEL BY BUSINESS AREA IN <strong>1999</strong><br />
EUR million Net sales Operating Income before Personnel,<br />
income extraordinary average<br />
items<br />
<strong>Kemira</strong> Chemicals 697 83 59 3,138<br />
Tikkurila 357 23 19 2,301<br />
<strong>Kemira</strong> Agro 1,015 –39 –59 2,951<br />
<strong>Kemira</strong> Pigments 488 35 15 1,752<br />
Others* 85 9 25 601<br />
Intra-Group sales –116<br />
Group, total 2,526 111 59 10,743<br />
* Includes other businesses, Group administration and eliminations from operating income<br />
and income before extraordinary items.<br />
All forecasts and estimates are based on management’s current judgement of the<br />
economic environment, and the actual results may differ significantly.<br />
12
SHARES AND SHAREHOLDERS<br />
SHARES AND VOTING RIGHTS<br />
The nominal value of the shares of<br />
<strong>Kemira</strong> Oyj was deleted in accordance<br />
with the resolution of the <strong>Annual</strong> General<br />
Meeting, and at the same time the share<br />
capital was redenominated in euros. The<br />
number of shares is 128,800,000 and each<br />
share confers one vote at the meetings of<br />
shareholders. According to the Articles of<br />
Association, the company’s share capital<br />
can be in the range of from EUR 217 to<br />
850 million. The share capital can be<br />
changed within these limits without<br />
amending the Articles of Association. The<br />
share capital of <strong>Kemira</strong> Oyj at present is<br />
EUR 217 million. <strong>Kemira</strong> Oyj shares are<br />
registered within the book-entry system.<br />
DIVIDEND POLICY<br />
<strong>Kemira</strong> aims to distribute a dividend which<br />
in the long term is competitive with that of<br />
major Finnish companies and with foreign<br />
chemicals groups, nevertheless taking into<br />
account the company’s result and capital requirement<br />
at any given time. The company’s<br />
Board of Directors will propose to the<br />
<strong>Annual</strong> General Meeting that a dividend of<br />
EUR 0.23 per share, or EUR 29.6 million, be<br />
paid for the <strong>1999</strong> financial year. This corresponds<br />
to a dividend payout of 100% of the<br />
net income for the year. Taking into account<br />
the Finnish tax base, this amounts to<br />
a taxable dividend of EUR 0.32. The record<br />
date for the dividend payout will be 14<br />
April 2000, and the dividend will be paid<br />
on 26 April 2000.<br />
INCREASE IN SHARE CAPITAL<br />
The Board of Directors of <strong>Kemira</strong> Oyj<br />
does not at present have authorizations to<br />
increase the company’s share capital. During<br />
the past year the share capital was increased<br />
by a transfer of EUR 0.4 million<br />
from the share premium account, whereby<br />
the share capital is now EUR 217 million.<br />
PURCHASE OF OWN SHARES<br />
On 7 April <strong>1999</strong>, the <strong>Annual</strong> General Meeting<br />
passed a resolution to authorize the<br />
company’s Board of Directors to purchase<br />
a maximum of 2,576,000 of the company’s<br />
own shares on the market in order to create<br />
a share-tied incentive system for the<br />
company’s personnel. The authorization is<br />
valid for one year from the date of the <strong>Annual</strong><br />
General Meeting. During June 15 to<br />
August 13 <strong>Kemira</strong> Oyj purchased 1,000,000<br />
of its own shares at an average price of<br />
EUR 5.82. The shares are at present in the<br />
company’s ownership but they will be sold<br />
on to the personnel funds operating within<br />
the company.<br />
INSIDER RULES<br />
In accordance with the decision of the<br />
Board of Directors of <strong>Kemira</strong> Oyj, the<br />
<strong>Kemira</strong> Group has placed in use insider<br />
rules pursuant to the Guidelines for Insiders<br />
issued by Helsinki Exchanges on<br />
28 October <strong>1999</strong>. A list of insiders including<br />
their shareholdings is given on page<br />
66 of the <strong>Annual</strong> <strong>Report</strong>.<br />
LISTING AND SHARE TRADING<br />
<strong>Kemira</strong> Oyj’s shares have been listed on<br />
Helsinki Exchanges since 10 November<br />
1994. In addition to Helsinki, trading in<br />
the shares is done through the SEAQ International<br />
trading system operated by<br />
the London Stock Exchange. <strong>Kemira</strong> is<br />
also part of the PORTAL system in the<br />
United States. In the United States,<br />
<strong>Kemira</strong>’s shares were issued under Regulation<br />
144A, whereby only qualified institutional<br />
buyers permitted under this legislation<br />
are allowed to buy and sell the<br />
shares. <strong>Kemira</strong>’s shares can also be traded<br />
in the United States in the form of<br />
ADS shares. One ADS share corresponds<br />
to two <strong>Kemira</strong> shares.<br />
PRICE AND TRADING VOLUME<br />
The price of <strong>Kemira</strong>’s share on Helsinki<br />
Exchanges weakened by 2.1% on Helsinki<br />
Exchanges during <strong>1999</strong>, whereas the<br />
HEX index rose by 162%. The highest<br />
price of the share was EUR 6.90 and the<br />
lowest price was EUR 5.20. The price of<br />
the share at the end of the year was EUR<br />
6.11. The taxation value of the share in<br />
<strong>1999</strong> was EUR 4.309. Turnover of the<br />
share on Helsinki Exchanges totalled<br />
20,702,853 shares, and in euro terms the<br />
turnover was EUR 121 million. The market<br />
capitalization at the end of <strong>1999</strong> was<br />
EUR 781 million.<br />
DISTRIBUTION OF OWNERSHIP (31 Dec <strong>1999</strong>)<br />
MANAGEMENT BOND ISSUE<br />
WITH WARRANTS, STOCK OPTIONS<br />
AND SHARE OWNERSHIP<br />
On 26 April, 1995, the <strong>Annual</strong> General<br />
Meeting of <strong>Kemira</strong> Oyj passed a resolution<br />
to float an issue of bonds with warrants<br />
targeted at the management of the<br />
<strong>Kemira</strong> Group. The amount of the bond<br />
loan is EUR 100,912.76. Each member of<br />
the Board of Directors who was employed<br />
by <strong>Kemira</strong> Oyj was entitled to<br />
subscribe for a maximum of EUR<br />
13,455.03 of the options. The maturity of<br />
the issue is five years beginning on 2<br />
May 1995, the interest is 6% and the issuing<br />
price was 100%. The issue of bonds<br />
with warrants gives management the right<br />
to subscribe for a maximum of 1,200,000<br />
shares in the company between 1 December<br />
1998 and 31 January 2002 at a<br />
price of EUR 6.73 per share. These subscriptions<br />
can increase the company’s<br />
share capital by a maximum of EUR 2.02<br />
million. Participating in the bond loan<br />
has been subject to a restriction on transfer<br />
of the bonds to a third party before 1<br />
December 1998. The bonds with warrants<br />
were subscribed for by 16 persons.<br />
In accordance with the terms and<br />
conditions of the issue of bonds with<br />
warrants, individuals who have participated<br />
in the issue can subscribe for half<br />
of the shares exercisable with warrants<br />
or sell half of the warrants they own after<br />
1 December 1998. At present, no<br />
one had sold their warrants or converted<br />
them into shares.<br />
The <strong>Annual</strong> General Meeting of <strong>Kemira</strong><br />
Oyj resolved on 22 April 1998 to offer stock<br />
options for subscription by the company’s<br />
management. The total amount of the stock<br />
options is 2,850,000 options and they entitle<br />
their holders to subscribe a total of<br />
2,850,000 <strong>Kemira</strong> Oyj shares. The then<br />
chairman of the Board of Directors of<br />
<strong>Kemira</strong> Oyj was offered 170,000 options<br />
and the other executive directors of <strong>Kemira</strong><br />
Oyj at that time were offered 120,000 options<br />
each. The stock option programme<br />
covers a total of about 50 persons.<br />
The share subscription period will<br />
commence on 1 May 2001 and end on 31<br />
May 2004. It is a condition for commencement<br />
of the subscription that the<br />
consolidated income of <strong>Kemira</strong> Oyj after<br />
financial items and before taxes and extraordinary<br />
items for the financial years<br />
1998 –2000 is a minimum of EUR 3.53<br />
per share. In order to reach this objective,<br />
net income for 2000 after financial<br />
items must be EUR 2.32 per share. Similarly,<br />
it is a further condition that the<br />
price of <strong>Kemira</strong> Oyj’s share has developed<br />
better than that of a peer group.<br />
The subscription price is the average<br />
Number of Number of % of Shares % of shares<br />
shares shareholders shareholders total and votes<br />
1 – 50 1,079 8.07 42,968 0.03<br />
51 – 100 1,070 8.00 83,522 0.07<br />
101 – 1,000 9,068 67.83 3,856,823 2.99<br />
1,001 – 5,000 1,897 14.19 3,586,626 2.79<br />
5,001 – 10,000 118 0.88 914,445 0.71<br />
10,001 – 100,000 101 0.76 3,118,365 2.42<br />
100,001 – 500,000 19 0.14 4,472,900 3.47<br />
500,001 – 1,000,000 8 0.06 5,942,563 4.61<br />
Yli 1,000,000 9 0.07 82,865,517 64.34<br />
Total 13,369 100.00<br />
Nominee-registered shares 23,916,271 18.57<br />
Grand total 128,800,000 100.00<br />
13
DISTRIBUTION OF<br />
SHAREHOLDERS (31 Dec <strong>1999</strong>)<br />
Financial<br />
institutions<br />
and insurance<br />
companies<br />
9.5 %<br />
Private<br />
companies<br />
2.5 %<br />
Foreign<br />
shareholders<br />
19.0 %<br />
EARNINGS/SHARE<br />
95 96 97 98 99<br />
CASH FLOW/SHARE<br />
Public sector<br />
entities<br />
61.7 %<br />
Non-profit<br />
organizations<br />
1.0 %<br />
Households<br />
6.3 %<br />
EUR<br />
1,0<br />
0,8<br />
0,6<br />
0,4<br />
0,2<br />
0<br />
EUR<br />
2,5<br />
20 LARGEST SHAREHOLDERS (31 Dec <strong>1999</strong>)<br />
Shareholder Number of % of shares<br />
shares and votes<br />
1. Finnish State 68,753,920 53.38<br />
2. Sampo Group 4,691,000 3.64<br />
(Sampo Insurance Company Ltd 850,000)<br />
(Industrial Insurance Company Ltd 1,480,000)<br />
(Sampo Enterprise Insurance Company Ltd 450,000)<br />
(Otso Loss of Profits Insurance Company Ltd 425,000)<br />
(Sampo Life Insurance Company Ltd 1,486,000)<br />
3. Ilmarinen Mutual Pension Insurance Company Ltd 3,603,500 2.80<br />
4. Pohjola Group 2,920,000 2.27<br />
(Pohjola Non-Life Insurance Company 1,780,000)<br />
(Pohjola Life Insurance Company Ltd 1,140,000)<br />
5. Varma-Sampo Mutual Pension Insurance Company 2,349,697 1.82<br />
6. Suomi Mutual Life Assurance Company 1,260,000 0.98<br />
7. Tapiola Mutual Pension Insurance Company 1,012,400 0.79<br />
8. The Local Government Pensions Institution 800,000 0.62<br />
9. Tapiola General Mutual Insurance Company 713,500 0.55<br />
10.Norvestia Oyj 760,000 0.59<br />
11.Kaleva Mutual Insurance Company 700,000 0.54<br />
12.Pension Foundation Neliapila s.r. 577,160 0.45<br />
13.Mutual Insurance Company Pension-Fennia 541,903 0.42<br />
14.Tapiola Mutual Life Assurance Company 455,500 0.35<br />
15.Odin Norden 313,500 0.24<br />
16.Neste Pension Foundation s.r. 270,000 0.21<br />
17.Seligson & Co. Fund Management Company Plc 255,500 0.20<br />
18.The LEL Employment Pension Fund 247,500 0.19<br />
19.Finnish Broadcasting Company Pension Foundation s.r 245,500 0.19<br />
20.The Church Central Fund 228,500 0.18<br />
<strong>Kemira</strong> Oyj 1,000,000 0.78<br />
Nominee registered shares* 23,916,271 18.57<br />
Other total 13,184,649 10.24<br />
Grand total 128,800,000 100.00<br />
* Information of the holding of Franklin Resources Inc. in <strong>Kemira</strong> Oyj is given on page 69.<br />
2,0<br />
1,5<br />
1,0<br />
0,5<br />
0<br />
95 96 97 98 99<br />
SHAREHOLDERS’ EQUITY/SHARE<br />
EUR<br />
8<br />
7<br />
6<br />
5<br />
4<br />
3<br />
2<br />
1<br />
0<br />
95 96 97 98 99<br />
price of the company’s share on Helsinki<br />
Exchanges, weighted for trading in the<br />
year 2000, and lowered by double the<br />
percentage figure by which an index calculated<br />
on the share trend of <strong>Kemira</strong><br />
Oyj’s share exceeds the arithmetic average<br />
index calculated in a similar manner<br />
on the share trend in the shares of a peer<br />
group. The subscription price of the share<br />
will furthermore be lowered by the<br />
amount of dividends distributed from 1<br />
June 1998 to 31 May 2001 to the extent<br />
that the total amount exceeds one euro<br />
per share and the dividends to be distributed<br />
after 1 June 2001 will be subtracted<br />
in their entirety. The subscription price is<br />
nevertheless a minimum of EUR 10.41<br />
less the amount of dividends distributed<br />
after 1 June 1998.<br />
The Supervisory Board appointed for<br />
the company a new Board of Directors,<br />
which began discharging its duties at the<br />
beginning of 2000. The members of the<br />
present Board of Directors and the Supervisory<br />
Board as well as the Managing Director<br />
and the Deputy Managing Director<br />
owned 27,080 <strong>Kemira</strong> Oyj shares at the<br />
end of the year. This represents 0.02% of<br />
the company’s shares and voting rights.<br />
The issue of bonds with warrants entitling<br />
holders to <strong>Kemira</strong> Oyj shares has been<br />
subscribed for by the Managing Director<br />
and the Deputy Managing Director in the<br />
amount of EUR 16,818.79, which corresponds<br />
to 200,000 share options. The Managing<br />
Director and the Deputy Managing<br />
Director have subscribed for 290,000<br />
<strong>Kemira</strong> Oyj share options. These warrants<br />
and share options entitle their holders to<br />
subscribe for a total of 490,000 shares.<br />
The members of the Board of Directors<br />
and the Supervisory Board as well as<br />
the Managing Director and the Deputy<br />
Managing Director hold 0.40% of the<br />
company’s shares and voting rights, including<br />
those conferred through the issue<br />
of bonds with warrants and the stock options.<br />
SHARE PRICE DEVELOPMENT<br />
AGAINST PEER GROUP<br />
Index<br />
120<br />
100<br />
80<br />
60<br />
40<br />
20<br />
0<br />
97 98 99<br />
SHARE TURNOVER ON HELSINKI<br />
EXCHANGES (until 31 Dec <strong>1999</strong>)<br />
Million shares<br />
7<br />
6<br />
5<br />
4<br />
3<br />
2<br />
1<br />
0<br />
1/95 1/96 1/97 1/98 1/99<br />
SHARE PRICE*<br />
(until 31.12.<strong>1999</strong>)<br />
*monthly average<br />
<strong>Kemira</strong><br />
HEX<br />
1/95 1/96 1/97 1/98 1/99<br />
EUR<br />
35<br />
30<br />
25<br />
20<br />
15<br />
10<br />
5<br />
0<br />
14
DEFINITIONS OF KEY RATIOS<br />
PER-SHARE DATA<br />
Earnings per share (EPS)<br />
Income before extraordinary items +/– minority interest<br />
– taxes<br />
Adjusted average number of shares<br />
Net income per share<br />
Net income<br />
Adjusted average number of shares<br />
Cash flow from operations<br />
Cash flow from operations, after change in net working<br />
capital and before capital investments<br />
Cash flow from operations per share<br />
Cash flow from operations<br />
Adjusted average number of shares<br />
Dividend per share<br />
Dividends paid<br />
Number of shares at end of year<br />
Dividend payout ratio<br />
Dividend per share x 100<br />
Earnings per share<br />
Dividend yield<br />
Dividend per share x 100<br />
Share price at end of year<br />
Equity per share<br />
Equity at end of year<br />
Number of shares at end of year<br />
FINANCIAL RATIOS<br />
Net liabilities<br />
Interest-bearing liabilities – cash and bank – securities<br />
Equity ratio, %<br />
Shareholders’ equity + minority interest x 100<br />
Total assets – advance payments received<br />
Gearing, %<br />
Net liabilities x 100<br />
Shareholders’ equity + minority interest<br />
Interest cover<br />
Operating income + depreciation<br />
Net financial expenses<br />
Return on capital invested, % (ROI)<br />
Income before extraordinary items + interest expenses +<br />
other financing expenses x 100<br />
Total assets – interest-free liabilities<br />
(average)<br />
Return on equity, % (ROE)<br />
Income before extraordinary items – taxes<br />
Shareholders’ equity + minority interests<br />
(average)<br />
Cash flow return on capital invested (CFROI), %<br />
Cash flow from operations x 100<br />
Total assets – interest-free liabilities<br />
(average)<br />
Share price, year average<br />
Shares traded (EUR)<br />
Shares traded (volume)<br />
Share price, end of year<br />
Weighted average share price of the last trading day<br />
Price per earnings per share (P / E)<br />
Share price at end of year<br />
Earnings per share<br />
Price per equity per share<br />
Share price at end of year<br />
Equity per share<br />
Price per cash flow per share<br />
Share price at end of year<br />
Cash flow from operations per share<br />
Share turnover<br />
Number of shares traded during the year and the proportional<br />
share of number of shares traded to weighted average number<br />
of shares during the year<br />
15
KEY FIGURES<br />
PER-SHARE DATA<br />
<strong>1999</strong> 1998 1997 1996 1995<br />
Per-share data<br />
Earnings per share, EUR 1) 0.23 0.61 0.81 0.86 0.77<br />
Net income per share, EUR 1) 0.23 0.61 0.81 0.86 0.77<br />
Cash flow from operations per share, EUR 1.41 0.96 2.00 2.05 2.25<br />
Dividend per share, EUR 2) 0.23 0.29 0.29 0.27 0.25<br />
Dividend payout ratio, % 2) 100.0 47.2 35.3 31.4 32.8<br />
Dividend yield, % 2) 3.8 4.6 3.3 2.7 4.1<br />
Equity per share, EUR 1) 7.57 7.27 7.16 6.53 5.77<br />
Price per earnings per share (P/E) ratio 1) 26.57 10.30 10.60 11.43 8.00<br />
Price per equity per share 1) 0.81 0.90 1.20 1.50 1.07<br />
Price per cash flow per share 4.33 6.50 4.30 4.78 2.74<br />
Dividend paid, EUR million 2) 29.6 36.8 36.8 34.7 30.5<br />
Share price and turnover<br />
Share price, year high, EUR 6.90 10.60 10.34 10.09 6.71<br />
Share price, year low, EUR 5.20 5.21 7.65 6.05 5.30<br />
Share price, year average, EUR 5.85 8.06 9.01 8.06 6.02<br />
Share price, end of year, EUR 6.11 6.24 8.61 9.81 6.17<br />
Number of shares traded (1000), Helsinki 20,703 30,277 33,241 33,276 22,480<br />
% of number of shares 16 24 26 27 19<br />
Market capitalization, end of year, EUR million 780.9 803.6 1,109.2 1,262.9 741.5<br />
Increase in share capital<br />
Average number of shares (1000) 3) 128,318 128,800 128,800 122,090 120,800<br />
Number of shares at end of year (1000) 3) 127,800 128,800 128,800 128,800 120,800<br />
Increases in number of shares (1000) – – – 8,000 –<br />
Share capital, EUR million 217.0 216.6 216.6 216.6 203.2<br />
Increases in share capital, EUR million – – – 13.5 –<br />
1)<br />
The change in accounting practice (IAS 12) reduced 1998 taxes by EUR 14.0 million.<br />
2)<br />
The <strong>1999</strong> dividend is the Board of Directors’ proposal to the <strong>Annual</strong> General Meeting.<br />
3)<br />
Weighted average number of shares outstanding, adjusted by the number of shares bought back.<br />
16
FINANCIAL RATIOS<br />
<strong>1999</strong> 1998 1997 1996 1995<br />
Income statement<br />
Net sales, EUR million 2,526 2,413 2,420 2,266 2,234<br />
Foreign operations, EUR million 2,073 1,916 1,955 1,764 1,789<br />
Sales in Finland, % 18 21 19 22 20<br />
Exports from Finland, % 20 19 22 24 25<br />
Sales generated outside Finland, % 62 61 59 54 55<br />
Operating income, EUR million 111 148 198 210 225<br />
% of net sales 4 6 8 9 10<br />
Net financing income and expenses, EUR million 52 51 53 67 104<br />
% of net sales 2 2 2 3 5<br />
Interest cover 6 6 7 6 4<br />
Income before extraordinary items, EUR million 59 97 145 143 121<br />
% of net sales 2 4 6 6 5<br />
Extraordinary income and expenses, EUR million – – – – –<br />
Income before taxes and minority<br />
interests, EUR million 59 97 145 143 121<br />
% of net sales 2 4 6 6 5<br />
Net income, EUR million 1) 30 79 104 104 93<br />
Return on capital invested, % 6 8 11 12 13<br />
Return on equity, % 1) 3 8 12 14 14<br />
Cash flow<br />
Cash flow from operations, EUR million 181 123 257 250 272<br />
Sales of fixed assets, EUR million 18 14 61 26 62<br />
Capital expenditure, EUR million 168 255 211 202 156<br />
% of net sales 7 11 9 9 7<br />
Cash flow after capital expenditure,<br />
EUR million 31 –119 107 73 179<br />
Cash flow return on capital invested, % 9 7 14 14 15<br />
Balance sheet<br />
Non-current assets, EUR million 1,486 1,444 1,404 1,366 1,312<br />
Shareholders’ equity, EUR million 1) 968 936 923 840 697<br />
Liabilities, EUR million 1,620 1,504 1,458 1,601 1,616<br />
Total assets, EUR million 2,603 2,453 2,389 2,447 2,316<br />
Net liabilities, EUR million 934 892 745 798 885<br />
Equity ratio, % 1) 38 39 39 35 30<br />
Gearing, % 95 94 80 94 126<br />
Personnel<br />
Personnel (average) 10,743 10,785 10,392 10,631 10,900<br />
of whom in Finland 5,090 5,155 5,176 5,945 6,125<br />
Exchange rates<br />
Key exchange rates (31 December)<br />
USD 1.00460 1.16674 1.09686 1.28033 1.36414<br />
GBP 0.62170 0.70547 0.66122 0.75559 0.88202<br />
NLG 2.20371 2.20371 2.12352 2.23322 2.18714<br />
SEK 8.56250 9.48736 8.66346 8.81110 9.08300<br />
DKK 7.43300 7.44892 7.48079 7.61395 7.56262<br />
BEF 40.33990 40.33990 40.50225 41.03333 40.11940<br />
FIM 5.94573 5.94573 5.94573 5.94573 5.94573<br />
1)<br />
The change in accounting practice (IAS 12) reduced 1998 taxes by EUR 14.0 million.<br />
17
CONSOLIDATED INCOME STATEMENT<br />
1.1. – 31.12.<br />
Note <strong>1999</strong> 1998<br />
EUR million EUR million<br />
Net sales 1, 28 2,526.2 2,412.7<br />
Share of associates’ profits 2, 28 2.8 5.0<br />
Other income from operations 3 32.6 16.4<br />
Cost of sales 4, 5 –2,262.5 –2,115.3<br />
Depreciation 6, 28 –188.1 –170.7<br />
Operating income 28 111.0 148.1<br />
Financing income and expenses 7 –52.4 –50.7<br />
Income before extraordinary items, taxes<br />
and minority interests 58.6 97.4<br />
Extraordinary items 8 – –<br />
Income before taxes and minority interests 58.6 97.4<br />
Direct taxes 9 –27.8 –19.3<br />
Income before minority interests 30.8 78.1<br />
Minority interest –0.9 0.5<br />
Net income 29.9 78.6<br />
Earnings per share, EUR 10 0.23 0.61<br />
18
CONSOLIDATED BALANCE SHEET<br />
31.12.<br />
Note <strong>1999</strong> 1998<br />
EUR million EUR million<br />
ASSETS<br />
Non-current assets 28<br />
Intangible assets 11 79.7 68.7<br />
Tangible assets 12 1,328.2 1,307.6<br />
Investments 13<br />
Holdings in associated companies 50.7 41.6<br />
Other shares and holdings 8.4 7.9<br />
Other investments 18.5 18.4<br />
Total investments 77.6 67.9<br />
Total non-current assets 1,485.5 1,444.2<br />
Current assets 28<br />
Inventories 14 455.9 429.2<br />
Receivables 15<br />
Interest-bearing receivables 23.4 18.2<br />
Other interest-free receivables 549.7 466.0<br />
Total receivables 573.1 484.2<br />
Securities 22 42.4 39.9<br />
Cash and bank 22 46.0 55.6<br />
Total current assets 1,117.4 1,008.9<br />
Total assets 2,602.9 2,453.1<br />
LIABILITIES AND SHAREHOLDERS’ EQUITY<br />
31.12.<br />
Note <strong>1999</strong> 1998<br />
EUR million EUR million<br />
Shareholders’ equity 16, 17<br />
Share capital 217.0 216.6<br />
Share premium account 252.5 252.9<br />
Revaluation reserve 8.3 8.5<br />
Own shares –5.8 –<br />
Other reserves 4.2 3.8<br />
Retained earnings 461.6 375.5<br />
Net profit for the financial year 29.9 78.6<br />
Total shareholders’ equity 967.7 935.9<br />
Minority interests 15.2 13.3<br />
Long-term liabilities<br />
Interest-bearing long-term liabilities 18, 22 848.8 785.4<br />
Deferred tax liabilities 19 56.6 63.5<br />
Provision for liabilities and charges 20 39.2 44.0<br />
Total long-term liabilities 944.6 892.9<br />
Current liabilities 21<br />
Interest-bearing short-term liabilities 22 173.5 202.6<br />
Interest-free short-term liabilities 28 501.9 408.4<br />
Total current liabilities 675.4 611.0<br />
Total liabilities 1,620.0 1,503.9<br />
Total liabilities and shareholders’ equity 2,602.9 2,453.1<br />
19
CONSOLIDATED CASH FLOW STATEMENT<br />
<strong>1999</strong> 1998<br />
EUR million EUR million<br />
Funds from operations<br />
Operating income 111.0 148.1<br />
Adjustments to operating income 1) –6.5 1.3<br />
Depreciation 188.1 170.7<br />
Interest income 6.4 10.7<br />
Interest expense –56.2 –55.8<br />
Dividend received 4.2 4.4<br />
Other financing items 0.1 –7.5<br />
Extraordinary items – –<br />
Taxes –31.5 –38.2<br />
Total funds from operations 215.6 233.7<br />
Change in net working capital<br />
Inventories –26.7 –45.1<br />
Short-term receivables –83.5 –18.7<br />
Interest-free short-term liabilities 75.5 –47.2<br />
Change in net working capital, total –34.7 –111.0<br />
Cash flow from operations 180.9 122.7<br />
Capital expenditure<br />
Acquisitions of Group companies –4.1 –76.9<br />
Acquisitions of associated companies – –7.3<br />
Purchase of other shares –9.9 –0.3<br />
Purchase of other fixed assets –154.1 –171.0<br />
Disposal of Group companies – 0.2<br />
Disposal of associated companies – 4,9<br />
Sales of other shares 0.3 0.4<br />
Sales of other fixed assets 18.2 8.6<br />
Total capital expenditure –149.6 –241.4<br />
Cash flow before financing 31.3 –118.7<br />
Financing<br />
Change in long-term loans (increase +, decrease -) 18.6 60.0<br />
Change in long-term loan receivables (increase -, decrease +) 0.6 4.9<br />
Short-term financing, net (increase +, decrease -) –20.2 52.6<br />
Dividend paid –36.8 –36.8<br />
Other –0.6 –7.6<br />
Financing, total –38.4 73.1<br />
Increase / decrease in liquid funds –7.1 –45.6<br />
Liquid funds at end of year 88.4 95.5<br />
Liquid funds at beginning of year 95.5 141.1<br />
Increase / decrease in liquid funds –7.1 –45.6<br />
The above figures cannot be directly derived from the balance sheets owing to changes, e.g., in the Group<br />
structure and foreign exchange rates. The cash flows of the business areas are shown in the segment data<br />
(p. 34).<br />
1)<br />
Non-cash flow items included in operating income (e.g. results of associated companies) and gains and losses on the<br />
sale of fixed assets.<br />
20
SUMMARY OF SIGNIFICANT ACCOUNTING POLICIES<br />
Basis of presentation<br />
The <strong>Kemira</strong> Group’s financial statements have been prepared<br />
in compliance with the relevant acts and regulations in force<br />
in Finland and in accordance with the Group’s uniform accounting<br />
principles. The Group’s accounting principles are<br />
based on International Accounting Standards (IAS). Accordingly,<br />
the financial statements also correspond to IAS, with<br />
the exception of accounting for pension expenses, IAS 19,<br />
which entered into force on 1 January <strong>1999</strong>. Its effects on the<br />
consolidated income statement and shareholders’ equity are<br />
discussed and presented in Notes 23 and 24 to the consolidated<br />
financial statements.<br />
Principles of consolidation<br />
The consolidated financial statements include the accounts of<br />
the parent company, <strong>Kemira</strong> Oyj, and companies in which it<br />
owns, directly or indirectly through subsidiaries, over 50 percent<br />
of the voting rights. Certain real estate and housing companies,<br />
and captive insurance companies, as well as companies<br />
that had no operations during the financial year, have not<br />
been consolidated. However, the effect of these companies<br />
on the Group’s results and distributable reserves, in cases of<br />
any significance, has been consolidated using the equity<br />
method of accounting. Companies acquired during the accounting<br />
period are consolidated from the date the responsibility<br />
for their operations was transferred to the Group. Similarly,<br />
units or companies sold during the fiscal year are included<br />
in the income statement up to the date of disposition.<br />
All intra-Group transactions have been eliminated as part of<br />
the consolidation process. Acquisitions of companies are accounted<br />
for under the purchase (past-equity) method of accounting.<br />
The excess of the acquisition cost over fair value of<br />
the net assets acquired is recorded as goodwill. Goodwill is<br />
amortized over the useful life of the assets acquired, which<br />
since 1998 has as a rule been a maximum of 5 years. Should a<br />
longer amortization period be justified, it is a maximum of 10<br />
years. The interests of minority shareholders in the net assets<br />
and profit and loss of consolidated subsidiaries is reflected as<br />
a separate item in the Group’s consolidated balance sheet and<br />
income statement.<br />
Companies in which the Group has a participating interest are<br />
associated companies, in which the interest is 20-50%. Holdings<br />
in associated companies are presented in the consolidated financial<br />
statements using the equity method of accounting. Under<br />
the equity method the Group’s proportionate share of the<br />
associated companies’ net income for the financial year is included<br />
in income and expenses from operations. Joint ventures<br />
that are owned on a fifty-fifty basis with another shareholder<br />
and in which the voting rights and management responsibility<br />
are divided evenly between the shareholders have been consolidated<br />
according to the proportionate method of accounting.<br />
Other companies (voting rights owned less than 20 percent)<br />
are stated at cost in the balance sheet and dividends received<br />
are included in the income statement.<br />
Items denominated in foreign currency, and foreign<br />
currency and interest rate derivatives<br />
In day-to-day accounting of each Group company, transactions<br />
in foreign currencies are translated at the rates of exchange<br />
prevailing on the dates of the transactions. At the end<br />
of the accounting period the unsettled balances of foreign<br />
currency transactions are valued at the rates of exchange prevailing<br />
on the balance sheet date. Foreign exchange gains and<br />
losses related to normal business operations are treated as adjustments<br />
to sales and purchases, while those gains and losses<br />
associated with financing and hedging of the total foreign exchange<br />
position are recorded as financing income and expenses.<br />
Derivative financial instruments to hedge currency and interest<br />
rate risks have been recorded in the income statement simultaneously<br />
with the commitment hedged. Derivative financial<br />
instruments which are not considered as hedging instruments<br />
are valued in the financial statements at the market<br />
price in accordance with conservative accounting practice.<br />
The interest portion of currency forwards is recorded as interest<br />
income and expense over the terms of the contract, and<br />
the differences in the foreign exchange rates are booked as a<br />
credit or charged to income when the underlying hedged<br />
transaction has been credited or charged to income in the financial<br />
statements.<br />
In the consolidated financial statements, the income statements<br />
of foreign subsidiaries have been translated into euro<br />
amounts using the average exchange rates and the balance<br />
sheets have been translated using the year-end exchange<br />
rates. The translation difference, which arises in translating<br />
the income statement and balance sheet using the different<br />
exchange rates, is entered in non-restricted equity.<br />
The Group seeks to hedge the translation risk of its investment<br />
in the net assets of foreign subsidiaries, which includes<br />
the original cost of ownership plus any undistributed post-acquisition<br />
profits and losses of those subsidiaries. Accordingly,<br />
the foreign currency-denominated shareholders’ equity in the<br />
Group’s non-Finnish subsidiaries are hedged against exchange<br />
rate changes using long-term foreign currency-denominated<br />
loans as well as forward and currency swap contracts.<br />
In the consolidated financial statements, the exchange rate<br />
gains and losses of such loans and forward and currency<br />
swap contracts are credited or charged against the translation<br />
differences arising from the translation of the shareholders’<br />
equity amounts of the last confirmed balance sheets of the<br />
subsidiaries. Other translation differences affecting shareholders’<br />
equity are stated as an increase or decrease in the non-restricted<br />
shareholders’ equity.<br />
The foreign exchange rates on the balance sheet date are given<br />
on page 17.<br />
Pension arrangements<br />
The Group has various pension schemes in accordance with<br />
the local conditions and practices in the countries in which it<br />
operates. The schemes are generally funded through payments<br />
to separate funds or to insurance companies. Contributions<br />
are based on periodic actuarial calculations and are<br />
charged against profits.<br />
The parent company’s pension arrangements have been<br />
handled within the separate pension funds. The uncovered<br />
liabilities of pension funds are presented in the parent<br />
company’s financial statements in short-term interest-free<br />
receivables and in short-term interest-free liabilities.<br />
In <strong>1999</strong>, IAS 19 was not applied, but the effect of applying the<br />
standard on the Group’s net income and retained earnings<br />
has been calculated and stated in Notes 23-24. The liability resulting<br />
from the changeover to applying IAS 19, which came<br />
into force in <strong>1999</strong>, has been calculated at the Group level so<br />
that the accumulated entitlement has been periodized over<br />
the time of the employment according to the accrual rules for<br />
21
pension arrangements (Projected Unit Credit method). The<br />
pension calculations are based on studies carried out by actuaries.<br />
Research expenditure is expensed. Development expenditure<br />
is also expensed except for major projects for which investment<br />
decisions have been made. These are capitalized. Capitalized<br />
development costs are presented in the item “Other<br />
long-term expenditures” and amortized over their economic<br />
life, not exceeding, however, five years.<br />
Net sales<br />
Net sales include the total invoicing value of products sold<br />
and services provided less sales tax, discounts, rebates and foreign<br />
exchange differences in accounts receivable.<br />
Extraordinary income and expenses<br />
Extraordinary income and expenses consist of items not incurred<br />
in the normal course of business, such as exceptionally<br />
large one-time expenses arising from the closures of plants<br />
and the reorganization of operations and divestments of entire<br />
businesses.<br />
Income and expenses of recurring nature and connected with<br />
operations, for example, gains and losses on the sales of fixed<br />
assets, are included in operating income.<br />
Extraordinary items of the parent company include Group<br />
contributions received and paid.<br />
Direct taxes<br />
The consolidated financial statements include direct taxes,<br />
which are based on the taxable results of the Group companies<br />
for the accounting period calculated according to local tax<br />
rules, and the change in the deferred tax liability and asset.<br />
The Group’s deferred tax liabilities and assets have been calculated<br />
according to IAS 12 which came into force from the<br />
beginning of 1998 and which is allowed by the Finnish legislation.<br />
The deferred tax liability has been calculated for all<br />
significant temporary differences, which have been obtained<br />
by comparing the book value of each balance sheet item and<br />
the taxation value. Deferred tax assets are included in the financial<br />
statements only if the company considers that the<br />
temporary difference or tax loss will probably be realized in<br />
the near future and that the taxable unit will probably generate<br />
a sufficient amount of taxable income in order to be able<br />
to make use of the tax claim. Tax assets on confirmed losses<br />
have been stated observing particular caution. In calculating<br />
the deferred tax liability, the tax rate enacted at the time of<br />
preparing the financial statements has been applied.<br />
The effect of the change that has been made in calculating<br />
taxes has been reported in its entirety in the direct taxes for<br />
1998 and for revaluation items it is included directly in shareholders’<br />
equity. The figures for comparison years have not<br />
been changed. The effect of the change on taxes for 1998 is<br />
discussed in the Notes to the financial statements.<br />
The tax charged in the income statement of the parent company<br />
comprises direct taxes calculated on an accrual basis.<br />
The untaxed reserves of the parent company are shown as a<br />
separate item. Provision for deferred tax liability for the untaxed<br />
reserves has not been made in the balance sheet of the<br />
parent company.<br />
Research and development expenditure<br />
Fixed assets and depreciation<br />
Non-current (fixed) assets are generally stated at cost, except<br />
for certain land and water areas and buildings which are stated<br />
at revalued amounts, less accumulated depreciation, as<br />
applicable.<br />
Depreciation is calculated on a straight-line basis so as to<br />
write off carrying value of fixed assets over their expected<br />
useful lives. The depreciation periods adopted are as follows:<br />
Machinery and equipment<br />
Buildings and constructions<br />
Other capitalized expenses<br />
Goodwill on consolidation<br />
3–15 years<br />
25 years<br />
5–10 years<br />
5–10 years<br />
As a general rule, interest expense is not capitalized, except<br />
in the United States. However, interest expenses related to<br />
capital borrowed to finance major capital investment projects<br />
can, when specifically approved by the Board, be capitalized<br />
as part of the total investment costs.<br />
Gains and losses on the sale of fixed assets are included either<br />
in income and expenses of operations or in extraordinary<br />
items, depending on the nature of the transaction. In recent<br />
years, new revaluations have not been made within the Group.<br />
Large, seldom performed maintenance works<br />
Large, seldom performed maintenance works are treated as a<br />
capital expenditure as from <strong>1999</strong> and acquisition costs are depreciated<br />
over their useful lifetimes (IAS 37). Previously, provisions<br />
for expenses were booked for them in advance. The<br />
effect of the change on net income and shareholders’ equity<br />
is stated in Note 16.<br />
Leasing<br />
Leasing payments are treated as rental expenses except for finance<br />
leasing agreements, in which the leased property is<br />
presented as part of the Group’s fixed assets and the leasing<br />
debt is shown as a long-term liability. In respect of finance<br />
leasing agreements, the depreciation on the leased property<br />
and the interest expense on the debt are shown in the income<br />
statement instead of leasing rents.<br />
Inventories<br />
Inventories are stated at the lower of cost or net realizable<br />
value. Cost is determined on a first in first out (FIFO) basis.<br />
Net realizable value is the amount which can be realized from<br />
the sale of the asset in the normal course of business, after allowing<br />
for the costs of realization. The cost of finished goods<br />
and work in process include an allocable proportion of production<br />
overheads.<br />
Securities and other short-term investments<br />
Securities and other short-term investments are a part of the<br />
Group’s cash management and are stated at lower of cost or<br />
market.<br />
22
NOTES TO CONSOLIDATED FINANCIAL STATEMENTS<br />
INCOME STATEMENT (EUR million) <strong>1999</strong> 1998<br />
1. NET SALES<br />
Net sales by division<br />
<strong>Kemira</strong> Chemicals 697.0 629.7<br />
Tikkurila 357.5 360.5<br />
<strong>Kemira</strong> Agro 1,014.7 1,030.3<br />
<strong>Kemira</strong> Pigments 488.5 422.9<br />
Other operations 84.5 84.4<br />
Intra-Group invoicing –116.0 –115.1<br />
Total 2,526.2 2,412.7<br />
Distribution of net sales by geographic market areas, as a percentage of total net sales<br />
Finland 18 21<br />
Other European Union countries 52 53<br />
Other European countries 8 8<br />
North and South America 13 11<br />
Asia 7 5<br />
Other countries 2 2<br />
Total 100 100<br />
2. SHARE OF ASSOCIATES’ PROFITS<br />
Share of associates’ profits 4.9 5.8<br />
Share of associates’ losses –2.1 –0.8<br />
Total 2.8 5.0<br />
3. OTHER INCOME FROM OPERATIONS<br />
Gains on the sale of fixed assets 14.1 3.2<br />
Sales of scrap and waste 0.5 0.2<br />
Insurance compensation 10.1 2.6<br />
Income from royalties, knowhow and licences 0.5 3.6<br />
Rent income 3.0 2.6<br />
Other income 4.4 4.2<br />
Total 32.6 16.4<br />
The capital gain on the sale of fixed assets in <strong>1999</strong> includes a EUR 9.2 million gain on the disposal of<br />
shares in power utilities.<br />
4. COST OF SALES<br />
Change in inventories of finished goods –6.1 –20.5<br />
Own work capitalized 1) –6.6 –5.2<br />
Materials and services<br />
Materials and supplies<br />
Purchases during the financial year 1,075.9 1,124.8<br />
Change in inventories of materials and supplies 1.1 –22.1<br />
External services 85.7 23.9<br />
Total materials and services 1,162.7 1,126.6<br />
Personnel expenses 456.6 439.1<br />
Rents 34.3 23.9<br />
Losses on the sales of fixed assets 0.3 –1.1<br />
Other expenses 621.3 552.5<br />
Total 2,262.5 2,115.3<br />
In <strong>1999</strong> costs included a reduction in long-term provision for liabilities and charges in a total amount<br />
of EUR 4.8 million (an increase of EUR 1.9 million in 1998).<br />
1)<br />
Own work capitalized comprises mainly wages, salaries and other personnel expenses and changes in inventories<br />
relating to self-constructed fixed assets for own use.<br />
23
NOTES TO CONSOLIDATED FINANCIAL STATEMENTS<br />
INCOME STATEMENT (EUR million) <strong>1999</strong> 1998<br />
5. PERSONNEL EXPENSES AND NUMBER OF PERSONNEL<br />
Emoluments of the Supervisory Board – –<br />
Emoluments of boards of directors and managing directors 1) 8.3 8.2<br />
Other wages and salaries 344.8 329.5<br />
Pension expenses 40.6 40.2<br />
Other personnel expenses 62.9 61.2<br />
Total 456.6 439.1<br />
1)<br />
Profit sharing bonuses to the management were EUR 0.5 million in <strong>1999</strong> and EUR 0.7 million in 1998<br />
Management’s pension commitments<br />
The managing director and deputy managing director of <strong>Kemira</strong> Oyj are entitled to retire at the age<br />
of 60. This possibility is based on the benefits of the supplementary pension foundation that has<br />
been closed to new members since 1 January 1991. The supplementary pension foundation’s benefits<br />
concern all the personnel whose years of service and other conditions concerning the granting<br />
of a pensions have been fulfilled. Similar arrangements have been made in the other Group companies.<br />
Personnel, average<br />
<strong>Kemira</strong> Chemicals 3,138 3,114<br />
Tikkurila 2,301 2,214<br />
<strong>Kemira</strong> Agro 2,951 3,071<br />
<strong>Kemira</strong> Pigments 1,752 1,794<br />
Other companies 601 592<br />
Total 10,743 10,785<br />
Personnel in Finland, average 5,090 5,155<br />
Personnel outside Finland, average 5,653 5,630<br />
Total 10,743 10,785<br />
The total personnel of joint ventures that have been consolidated according to the proportionate<br />
method of accounting was in average 279 (206 in 1998).<br />
Personnel at year end 10,436 10,508<br />
6. DEPRECIATION<br />
Scheduled depreciation<br />
Intangible assets<br />
Intangible rights 2.0 1.6<br />
Goodwill 1.2 1.1<br />
Goodwill on consolidation 4.5 4.2<br />
Other long-term expenditures 6.1 4.0<br />
Tangible assets<br />
Buildings and constructions 23.5 22.7<br />
Machinery and equipment 145.5 133.7<br />
Other tangible assets 5.3 3.4<br />
Total 188.1 170.7<br />
Scheduled depreciation for goodwill on consolidation was EUR 4.5 million (EUR 4.2 million in<br />
1998). No depreciation has been made in the negative goodwill in <strong>1999</strong> and 1998.<br />
7. FINANCING INCOME AND EXPENSES<br />
Financing income<br />
Dividend income 0.7 1.1<br />
Interest income from long-term investments 1.1 0.7<br />
Other interest income 5.3 7.8<br />
Other financing income 0.5 0.4<br />
Total 7.6 10.0<br />
24
NOTES TO CONSOLIDATED FINANCIAL STATEMENTS<br />
INCOME STATEMENT (EUR million) <strong>1999</strong> 1998<br />
Financing expenses<br />
Interest expenses –56.2 –53.6<br />
Other financing expenses –2.2 –1.6<br />
Exchange losses –1.6 –5.5<br />
Total –60.0 –60.7<br />
Total financing income and expenses –52.4 –50.7<br />
Net financing expenses as a percentage of net sales 2.1 2.1<br />
Net interests as a percentage of net sales 2.0 1.9<br />
Exchange gains and losses<br />
Realized 1.8 2.8<br />
Unrealized –3.4 –8.3<br />
Total –1.6 –5.5<br />
Interest expenses were not capitalized during the <strong>1999</strong> financial year. In 1998 capitalized interest<br />
expenses amounted to EUR 0.1 million.<br />
The exchange differences on foreign currency loans and foreign currency derivatives have been credited<br />
or charged directly to shareholders’ equity and matched against the translation differences arising<br />
from the consolidation of foreign subsidiaries according to the so called equity hedging method.<br />
In <strong>1999</strong> these foreign exchange losses totalled EUR 11.4 million (in 1998 foreign exchange gains were<br />
EUR 3.1 million).<br />
There were no financing income and expenses from associates.<br />
8. EXTRAORDINARY ITEMS<br />
There were no extraordinary income or expenses in <strong>1999</strong> and 1998.<br />
9. DIRECT TAXES<br />
Direct taxes, current year –30.9 –37.7<br />
Direct taxes, previous years –0.5 –0.5<br />
Deferred taxes 3.6 4.9<br />
Tax related to changes in accounting practices – 14.0<br />
Total –27.8 –19.3<br />
Deferred tax liabilites and tax assets have been calculated according to IAS regulations, effective from<br />
1 Jan. 1998. The change in accounting practises has reduced taxes EUR 14.0 million in the 1998 income<br />
statement. In addition a EUR 9.4 million tax liability has been calculated for previous years’ revaluations.<br />
This amount has been deducted from the 1998 equity.<br />
There were no calculated tax expenses related to extraordinary items in <strong>1999</strong> and in 1998.<br />
Certain Group subsidiaries have tax losses which can be applied against future taxable income.<br />
According to the principle of prudence, all tax losses have not been entered as deferred tax assets<br />
because there is uncertainty regarding the extent to which they can be used.<br />
10. EARNINGS PER SHARE<br />
Income before extraordinary items and taxes 58.6 97.4<br />
Minority interests –0.9 0.5<br />
Direct taxes of the financial year –27.8 –19.3<br />
Net income 29.9 78.6<br />
Weighted average number of shares 1) 128,318,000 128,800,000<br />
Earnings per share, EUR 0.23 0.61<br />
1)<br />
Weighted average number of shares outstanding, adjusted by the number of shares bought back.<br />
25
NOTES TO CONSOLIDATED FINANCIAL STATEMENTS<br />
BALANCE SHEET (EUR million)<br />
11. INTANGIBLE ASSETS<br />
Intangible<br />
rights<br />
Goodwill<br />
Goodwill on<br />
consolidation<br />
1)<br />
Other longterm<br />
expenditures<br />
Advances<br />
paid<br />
Acquisition cost at beginning of year 31.6 12.7 71.8 62.9 0.3 179.3 148.6<br />
Increases 2.4 1.2 0.8 16.6 – 21.0 36.2<br />
Decreases – – – – – – –0.7<br />
Exchange differences and other changes – 0.2 –0.6 5.0 0.1 4.7 –4.8<br />
Acquisition cost at end of year 34.0 14.1 72.0 84.5 0.4 205.0 179.3<br />
Accumulated depreciation at<br />
beginning of year –22.0 –5.9 –45.4 –37.3 – –110.6 –104.5<br />
Accumulated depreciation relating to<br />
decreases and transfers – – – – – – –0.6<br />
Depreciation during the financial year –2.0 –1.2 –4.5 –6.1 – –13.8 –10.9<br />
Exchange differences and other changes 0.2 – 0.2 –1.3 – –0.9 5.4<br />
Accumulated depreciation at end of year –23.8 –7.1 –49.7 –44.7 – –125.3 –110.6<br />
Net book value at end of year 10.2 7.0 22.3 39.8 0.4 79.7 68.7<br />
1) There was no goodwill on consolidation or negative goodwill on consolidation related to associates in <strong>1999</strong>.<br />
<strong>1999</strong><br />
total<br />
1998<br />
total<br />
12. TANGIBLE ASSETS<br />
Land and<br />
water<br />
areas 1)<br />
Buildings<br />
and constructions<br />
2)<br />
Machinery<br />
and<br />
equipment 3)<br />
Other tangible<br />
assets<br />
Advances paid<br />
and fixed<br />
assets under<br />
construction<br />
Acquisition cost at beginning of year 98.6 601.3 2,361.1 88.1 66.2 3,215.3 3,136.8<br />
Increases 0.6 21.7 110.6 7.0 –2.8 137.1 211.6<br />
Decreases –0.3 –1.1 –3.1 – – –4.5 –3.7<br />
Exchange differences and other changes 5.4 –15.8 27.7 –2.4 1.4 16.3 –129.4<br />
Acquisition cost at end of year 104.3 606.1 2,496.3 92.7 64.8 3,364.2 3,215.3<br />
Accumulated depreciation at<br />
beginning of year – –296.0 –1,561.0 –50.7 – –1,907.7 –1,847.4<br />
Accumulated depreciation relating to<br />
decreases and transfers – 0.3 –4.9 – – –4.6 29.4<br />
Depreciation during the financial year – –23.5 –145.5 –5.3 – –174.3 –159.8<br />
Exchange differences and other changes – 23.9 24.2 2.5 – 50.6 70.1<br />
Accumulated depreciation at end of year – –295.3 –1,687.2 –53.5 – –2,036.0 –1,907.7<br />
Net book value at end of year 104.3 310.8 809.1 39.2 64.8 1,328.2 1,307.6<br />
1)<br />
The acquisition cost and book value of land and water areas include EUR 23.3 million revaluations in <strong>1999</strong> and in 1998.<br />
2)<br />
The acquisition cost of buildings and constructions include EUR 20.1 million revaluations in <strong>1999</strong> and in 1998. Book value was<br />
EUR 8.6 million at the end of <strong>1999</strong> and EUR 9.5 million at the end of 1998.<br />
3)<br />
Non-depreciated capitalized interest expenses included in buildings were EUR 0.5 million in <strong>1999</strong> (EUR 0.4 million in 1998), in<br />
machinery and equipment EUR 2.4 million in <strong>1999</strong> (EUR 2.3 million in 1998). Interest expenses were not capitalized in <strong>1999</strong>. Interest<br />
expenses capitalized on machinery and equipment in 1998 amounted to EUR 0.1 million.<br />
<strong>1999</strong><br />
total<br />
1998<br />
total<br />
13. INVESTMENTS<br />
Acquisition cost at beginning of year 41.6 7.9 0.8 17.6 67.9 70.5<br />
Share of net income of associates 1.5 – – – 1.5 3.0<br />
Increases 9.7 0.3 – – 10.0 7.6<br />
Decreases – –0.3 – – –0.3 –5.4<br />
Transfers – – – – – –1.9<br />
Exchange differences and other changes –2.1 0.3 0.1 – –1.7 –0.8<br />
Reduction in value – 0.2 – – 0.2 –0.3<br />
Receivables from associates – – – – – 0.3<br />
Other receivables – – – – – –5.1<br />
Net book value at end of year 50.7 8.4 0.9 17.6 77.6 67.9<br />
Shares and holdings are specified in Note 27.<br />
Holdings in<br />
associates<br />
Other<br />
shares and<br />
holdings<br />
Receivables<br />
from<br />
associates<br />
Other<br />
investments<br />
<strong>1999</strong><br />
total<br />
1998<br />
total<br />
14. INVENTORIES <strong>1999</strong> 1998<br />
Materials and supplies 187.1 165.8<br />
Work in process 15.1 19.0<br />
Finished goods 252.3 241.8<br />
Advances paid 1.4 2.6<br />
Total 455.9 429.2<br />
26
NOTES TO CONSOLIDATED FINANCIAL STATEMENTS<br />
BALANCE SHEET (EUR million) <strong>1999</strong> 1998<br />
15. RECEIVABLES<br />
Long-term receivables<br />
Interest-bearing long-term receivables<br />
Loan receivables from associates – 0.8<br />
Loan receivables from others – 0.1<br />
Other receivables from others 0.1 0.1<br />
Total interest-bearing long-term receivables 0.1 1.0<br />
Interest-free long-term receivables<br />
Prepaid expenses and accrued income from others 4.3 0.3<br />
Accounts receivable from others 5.5 10.7<br />
Other receivables from others 0.8 0.6<br />
Total interest-free long-term receivables 10.6 11.6<br />
Total long-term receivables 10.7 12.6<br />
Current receivables<br />
Interest-bearing short-term receivables<br />
Loan receivables from associates 2.6 –<br />
Loan receivables from others 9.5 3.2<br />
Other receivables from others 11.3 14.0<br />
Total interest-bearing short-term receivables 23.4 17.2<br />
Interest-free short-term receivables<br />
Accounts receivable from associates 4.1 3.6<br />
Accounts receivable from others 471.6 393.3<br />
Advances paid from others 2.7 1.8<br />
Prepaid expenses and accrued income from others 22.5 26.0<br />
Other receivables from associates 0.9 0.2<br />
Other receivables from others 37.2 29.5<br />
Total interest-free short-term receivables 539.0 454.4<br />
Total current receivables 562.4 471.6<br />
Total receivables 573.1 484.2<br />
Loans to the management of the Group companies – 0.1<br />
16. SHAREHOLDERS’ EQUITY<br />
Share<br />
capital<br />
Share<br />
premium<br />
account<br />
Revaluationreserve<br />
and<br />
other funds<br />
Translation<br />
reserve<br />
Retained<br />
earnings<br />
Shareholder’s equity at 1 Jan.1998 216.6 252.9 17.9 –18.3 454.2 923.3<br />
Change in accounting principles 1) – – – – –9.2 –9.2<br />
Net profit for the financial year – – – – 78.6 78.6<br />
Dividends paid – – – – –36.8 –36.8<br />
Exchange differences – – – –18.6 – –18.6<br />
Other changes – – –1.0 – –0.4 –1.4<br />
Transfers – – –4.6 – 4.6 –<br />
Shareholder’s equity at 31 Dec. 1998 216.6 252.9 12.3 –36.9 491.0 935.9<br />
Shareholder’s equity at 1 Jan. <strong>1999</strong> 216.6 252.9 12.3 –36.9 491.0 935.9<br />
Change in accounting principles 1) – – – – 18.6 18.6<br />
Net profit for the financial year – – – – 29.9 29.9<br />
Dividends paid – – –36.8 –36.8<br />
Exchange differences – – – 26.6 – 26.6<br />
Own shares – – – – –5.8 –5.8<br />
Other changes – – 0.2 – –0.9 –0.7<br />
Transfers 0.4 –0.4 – – – –<br />
Shareholder’s equity at 31 Dec. <strong>1999</strong> 217.0 252.5 12.5 –10.3 496.0 967.7<br />
1)<br />
The change in accounting principles includes a charge of EUR 9.2 million for the deferred tax liability on<br />
revaluations (IAS 12) in 1998, and an increase in equity of EUR 18.6 million after taxes for the change in<br />
accounting policy for major maintenance works (IAS 37). The change in accounting policy for maintenance<br />
works, after tax, was a charge of EUR 0.1 million in the income statement in <strong>1999</strong>.<br />
Total<br />
27
NOTES TO CONSOLIDATED FINANCIAL STATEMENTS<br />
BALANCE SHEET (EUR million)<br />
The Group’s non-restricted shareholders’ equity, which limits the parents company’s dividend payout,<br />
was EUR 351.4 million in <strong>1999</strong> and EUR 318.1 million in 1998. This figure is obtained by adding<br />
to retained earnings the net income for the financial year and subtracting from it the proportion of<br />
untaxed reserves which has been transferred to shareholders’ equity and own shares. Research, establishment<br />
and development expenses that have a limiting effect on the distribution of profits have<br />
not been capitalized in the balance sheet.<br />
Details of the company’s breakdown of shareholders’ equity and the regulations of the Articles of Association<br />
are given on page 14. In <strong>1999</strong> the company purchased 1,000,000 of its own shares, which<br />
represent 0.8% of the aggregate votes conferred by all the shares and 0.5% of the share capital.<br />
17. APPROPRIATIONS<br />
In the consolidated financial statements the appropriations of each individual company have been divided<br />
into equity and deferred tax liability. Appropriations in the balance sheets of the Group companies<br />
are accumulated depreciation difference.<br />
<strong>1999</strong> 1998<br />
Of which equity 134.3 136.0<br />
Of which deferred tax liability 54.8 53.8<br />
Total accumulated depreciation difference 189.1 189.8<br />
18. LONG-TERM INTEREST-BEARING LIABILITIES<br />
Debentures and other bond loans 61.7 61.7<br />
Loans from financial institutions 398.6 293.2<br />
Loans from pension institutions 296.4 334.1<br />
Other long-term liabilities to associated companies 0.4 –<br />
Other long-term liabilities to others 91.7 96.4<br />
Total 848.8 785.4<br />
Long-term interest-bearing liabilities maturing in<br />
2001 (2000) 44.6 29.8<br />
2002 (2001) 33.6 50.5<br />
2003 (2002) 192.8 39.8<br />
2004 (2003) 150.7 175.7<br />
2005 (2004) or later 427.1 489.6<br />
Total 848.8 785.4<br />
Interest-bearing liabilities maturing in 5 years or longer<br />
Loans from financial institutions 99.7 145.2<br />
Loans from pension institutions 283.9 274.9<br />
Other long-term interest-bearing liabilities 43.5 69.5<br />
Total 427.1 489.6<br />
Other long-term liabilities include a EUR 0.1 million issue of bonds with warrants offered to senior<br />
management. The issue is described in greater detail on page 10.<br />
Long-term loans by currency, %<br />
EUR 35 –<br />
FIM 18 46<br />
SEK 15 14<br />
BEF 1 7<br />
USD 11 9<br />
DKK 5 6<br />
GBP 7 7<br />
NLG – 6<br />
DEM – 2<br />
Other 8 3<br />
Total 100 100<br />
The Group has no convertible bonds.<br />
28
NOTES TO CONSOLIDATED FINANCIAL STATEMENTS<br />
BALANCE SHEET (EUR million) <strong>1999</strong> 1998<br />
Debentures and other bond loans<br />
Loan<br />
Loan currency<br />
FI 0003008581 1998-2003 EUR 45.2 45.2<br />
FI 0003008599 1998-2006 EUR 16.5 16.5<br />
Total 61.7 61.7<br />
19. DEFERRED TAX LIABILITIES<br />
Deferred tax liabilities 82.3 82.6<br />
Deferred tax assets 25.7 18.9<br />
Net deferred tax liabilities 56.6 63.5<br />
Temporary differences 9.1 14.7<br />
Untaxed reserves 54.8 53.8<br />
Consolidation entries –7.3 –5.0<br />
Total 56.6 63.5<br />
Deferred tax liabilities and tax assets have been calculated according to IAS regulations, effective<br />
from 1 January 1998.<br />
The deferred tax liabilities related to untaxed reserves of the Finnish Group companies amounted to<br />
EUR 54.8 million in <strong>1999</strong> and EUR 53.8 millon in 1998. The deferred tax assets are mainly tax assets<br />
from tax losses, finance lease and intra-Group profits.<br />
20. PROVISION FOR LIABILITIES AND CHARGES<br />
Pension liabilities<br />
Uncovered liabilities of pension funds 0.4 0.7<br />
Other pension liabilities 18.3 22.8<br />
Total 18.7 23.5<br />
Other provisions for liabilities and charges<br />
Provisions for reorganization 7.0 6.8<br />
Provision for accidents and enviromental liabilities 7.5 6.8<br />
Other provisions 6.0 6.9<br />
Total 20.5 20.5<br />
Total provision for liabilities and charges 39.2 44.0<br />
Provisions for liabilities and charges are expected to fall due in a year at the earliest. Short-term provisions<br />
(EUR 20.8 million in <strong>1999</strong> and EUR 12.4 million in 1998 ) are included in accrued expenses<br />
and prepaid income.<br />
21. CURRENT LIABILITIES<br />
Interest-bearing short-term liabilities<br />
Loans from financial institutions 28.6 40.0<br />
Loans from pension institutions 3.2 3.8<br />
Current portion of other long-term loans to others 19.4 21.5<br />
Bills of exchange from others 2.4 2.1<br />
Other interest-bearing short-term liabilities to associates 1.2 0.5<br />
Other interest-bearing short-term liabilities to others 118.7 134.7<br />
Total interest-bearing short-term liabilities 173.5 202.6<br />
Interest-free short-term liabilities<br />
Advances received from others 18.5 17.1<br />
Accounts payable to associates 0.8 0.6<br />
Accounts payable to others 235.3 195.5<br />
Accrued expenses and prepaid income to others 202.3 168.2<br />
Other interest-free short-term liabilities to others 45.0 27.0<br />
Total interest-free short-term liabilities 501.9 408.4<br />
Total current liabilities 675.4 611.0<br />
Accrued expenses<br />
Accrued expenses and prepaid income in <strong>1999</strong> include mainly salaries, personnel expenses, interests<br />
and taxes.<br />
29
NOTES TO CONSOLIDATED FINANCIAL STATEMENTS<br />
BALANCE SHEET (EUR million) <strong>1999</strong> 1998<br />
22. NET LIABILITIES<br />
Interest-bearing long-term liabilities 848.8 785.4<br />
Interest-bearing short-term liabilities 173.5 202.6<br />
Securities –42.4 –39.9<br />
Cash and bank –46.0 –55.6<br />
Total 933.9 892.5<br />
23. PENSION LIABILITIES ACCORDING TO IAS 19<br />
Present value of funded obligations as at 31.12.1998 830.4 –<br />
Fair value of plan assets as at 31.12.1998 –836.9 –<br />
Present value of unfunded obligations as at 31.12.1998 6.1 –<br />
Net liability in the balance sheet as at 31.12.1998 –0.4 –<br />
Increase in the liability in <strong>1999</strong> 7.7 –<br />
Liability at 31.12.<strong>1999</strong> 7.3 –<br />
Increase in the net liability is the following:<br />
Current service cost 10.6 –<br />
Interest on obligation 44.4 –<br />
Expected return on plan assets –40.9 –<br />
Other 0.5 –<br />
Contributions to pension plans –6.9 –<br />
Total 7.7 –<br />
24. THE FINANCIAL IMPACT OF IAS 19<br />
If IAS 19 had been applied in the consolidated financial statements and the increase in liabilities resulting<br />
from the changeover had been entered in its entirety in the income statement, earnings for<br />
<strong>1999</strong> would have been EUR 7.7 million smaller, shareholders’ equity EUR 7.3 million smaller (EUR<br />
0.4 million larger at 31 December 1998) and net debt EUR 7.3 million larger (EUR 0.4 million smaller<br />
at 31 december 1998) than in the financial statements prepared at 31 December <strong>1999</strong>.<br />
25. COLLATERAL AND CONTINGENT LIABILITIES<br />
Loans secured by mortgages in the balance sheet<br />
and for which mortgages given as collateral<br />
Loans from financial institutions 10.0 8.2<br />
Mortgages given 9.9 9.9<br />
Loans from pension institutions 89.1 111.2<br />
Mortgages given 110.9 142.1<br />
Other loans 6.6 1.1<br />
Mortgages given 6.9 5.7<br />
Total mortgage loans 105.7 120.5<br />
Total mortgages given 127.7 157.7<br />
Contingent liabilities<br />
Assets pledged<br />
On behalf of own commitments 7.0 10.4<br />
On behalf of others 1.1 1.1<br />
Guarantees<br />
On behalf of associates 39.7 24.4<br />
On behalf of others 4.2 8.3<br />
Leasing obligations 1) 5.1 4.8<br />
Other obligations<br />
On behalf of associates 1.2 1.1<br />
On behalf of others 1.0 1.0<br />
In liabilities there are EUR 55.5 million of debts related to finance lease.<br />
There were no collaterals or contingent liabilities related to managing directors, members or deputy<br />
members of board of directors and supervisory board.<br />
1)<br />
Commitments for paying leasing rents in future years total EUR 13.8 million.<br />
Litigation<br />
The Group has extensive international operations and is a defendant or plaintiff in a number of proceedings<br />
incidental to those operations. The Group does not expect the outcome of any legal proceedings<br />
currently pending, either individually or in the aggregate, to have material adverse effect<br />
upon the Group’s consolidated financial position or results of operations.<br />
30
NOTES TO CONSOLIDATED FINANCIAL STATEMENTS<br />
26. MANAGEMENT OF FINANCIAL RISKS<br />
The Group’s Treasury functions are managed<br />
on a centralized basis. Treasury Management<br />
functions as an internal bank via which the<br />
subsidiaries handle all their borrowing, investment<br />
and hedging needs. Treasury Management<br />
also sees to the investment of liquid<br />
funds, the management of interest rate and<br />
foreign exchange risk as well as the maintenance<br />
of cash pools. The policy of <strong>Kemira</strong>’s<br />
Treasury operations is approved by the company’s<br />
Board of Directors. In addition, the<br />
Management Board confirms an action plan<br />
for treasury operations each year. The objective<br />
of financial risk management is to protect<br />
the company from unfavourable changes occurring<br />
in the financial markets and thus to<br />
contribute to safeguarding the company’s<br />
earnings trend and its shareholders’ equity.<br />
The company employs various financial instruments,<br />
such as forward rate agreements,<br />
options and futures, within the framework of<br />
the limits which have been set. Only such instruments<br />
are used whose market values and<br />
risks can be tracked continually and reliably<br />
within the company’s risk management system.<br />
Derivative instruments are used only for<br />
hedging purposes, not for speculative gain.<br />
Foreign exchange risk<br />
The introduction of the euro has reduced the<br />
Group’s currency flow exposure. The majority<br />
of the Group’s production in the euro<br />
zone is also sold within the area. Currency<br />
flow risk nevertheless arises from net currency<br />
flows in other currencies than the home<br />
currency, both within and outside of the<br />
euro zone. Also, the translation into euro of<br />
the result and balance sheet items of companies<br />
outside of the euro zone causes currency<br />
risk.<br />
Currency flow exposure is hedged selectively<br />
in such a way that already assured foreign currency<br />
flows are hedged completely and a part<br />
of the forecast cash flows are hedged, to an increasing<br />
extent, the more probable it is that the<br />
flow will materialize. The basic guideline is<br />
that a minimum of 30% of the foreign currency<br />
flow that is forecast for the next 12 months<br />
must be hedged. Each subsidiary is separately<br />
responsible for taking its own hedging decisions.<br />
The hedging undertaken by the subsidiaries<br />
is supplemented, according to the<br />
Group’s needs, by means of Group-level hedging<br />
measures that are carried out by Group<br />
Treasury and for which the limit set for <strong>1999</strong><br />
was EUR 35 million. On a monthly basis, an<br />
average of about EUR 14 million of this limit<br />
was in use. As part of this position, measures<br />
are taken to ensure that both external and internal<br />
borrowing and lending in foreign currency<br />
are nearly fully in balance. Hedging<br />
measures at the Group level had limits relating<br />
to both the nominal value and the market value,<br />
and the actual figures were tracked daily.<br />
In future the monitoring of currency flow exposure<br />
will be changed because as a rule 50 %<br />
of the net foreign currency flow that is forecast<br />
for the next twelve months will be hedged.<br />
This includes both hedging orders submitted<br />
by subsidiaries and hedging at the group level.<br />
Treasury Management has an authorisation to diverge<br />
by +/- EUR 100 million from this 50 % level.<br />
The hedging of this forecast cash flow must<br />
nevertheless always be a minimum of 30 % and a<br />
maximum of 100 %. Use of the limits are tracked<br />
daily. In <strong>1999</strong> the total volume of all external foreign<br />
exchange contracts and options was about<br />
EUR 4000 million. This figure includes transactions<br />
made both on behalf of subsidiaries and at<br />
the group level.<br />
The Group strives to hedge balance sheet risk by<br />
keeping foreign currency-denominated liabilities<br />
in balance, currency by currency, with the asset<br />
items in the balance sheet. The foreign currencydenominated<br />
shareholders’ equity items of subsidiaries<br />
are hedged against foreign exchange<br />
fluctuations in accordance with the so-called equity<br />
hedging method by means of long-term foreign<br />
currency-denominated loans as well as by<br />
forward rate agreements and currency swaps. Because<br />
euro interest rates are clearly lower than,<br />
say, the interest rates for the US dollar and the<br />
British pound, balance sheet hedging by means<br />
of foreign currency loans results in a substantial<br />
cost, which is taken into account when taking decisions<br />
regarding hedging. In hedging balance<br />
sheet risk, the equity ratio was monitored such<br />
that if a change of +/- 2.5% in the foreign exchange<br />
rates caused a one percentage point<br />
change in the equity ratio, hedging measures had<br />
to be undertaken. For 2000, the new range of<br />
fluctuation for changes in foreign exchange rates<br />
is +/- 5 %, which may cause a max. 1.5 persentage<br />
point change in the equity ratio. In practice<br />
this means that in the balance sheet the value of<br />
unhedged shareholders’ equity could be a maximum<br />
of EUR 500 million in <strong>1999</strong>, whereas in future<br />
this limit will be EUR 375 million. The degree<br />
of hedging of shareholders’ equity in currencies<br />
outside the euro area was about 25% at the<br />
end of <strong>1999</strong>. The largest unhedged exposures are<br />
in Swedish kronor and British pounds.<br />
Interest rate risk<br />
In accordance with the Group’s risk management<br />
policy, the objective is to hedge against<br />
significant interest rate risks. In order to manage<br />
interest rate risks, the Group’s borrowing and investments<br />
are spread out between fixed and variable<br />
interest rate instruments. In addition, interest<br />
rate swaps and forward rate agreements are<br />
used actively, as are other derivatives. A maximum<br />
of 50% of the Group’s long-term liabilities<br />
can be fixed-rate borrowings. At the end of<br />
<strong>1999</strong>, 28% of the Group’s entire loan portfolio<br />
consisted of fixed-interest borrowings. Pension<br />
loans are considered to be variable-interest<br />
loans. Treasury Management also monitors the<br />
duration of the loan portfolio as well as its sensitivity<br />
to changes in the interest rate curve. The<br />
average duration of the entire loan portfolio at<br />
the end of <strong>1999</strong> was about 16 months, with the<br />
duration for pension loans set at one year. In<br />
2000 the duration of the loan portfolio can very<br />
in a range of 6 - 24 months. In <strong>1999</strong> a change of<br />
one percentage point in the interest rate curve<br />
was allowed to cause a maximum change of<br />
EUR 13.5 million in the market value of the asset/liability<br />
portfolio. During <strong>1999</strong> a change of<br />
one percentage point would have led on aver-<br />
31
NOTES TO CONSOLIDATED FINANCIAL STATEMENTS<br />
age to a change of about EUR 8 million in the<br />
asset/liability porfolio. For 2000, the new limit is<br />
EUR 15 million. By a decision of the Management<br />
Board, the limits can be changed in accordance<br />
with the market situation. As a consequence<br />
of this policy, the Group’s average interest<br />
rate level has in general been higher than<br />
the market level of short-term interest rates<br />
when low rates prevail and, on the other hand,<br />
lower than the market level when high rates<br />
prevail.<br />
Counterparty risk<br />
Counterparty risk is due to the fact that a contractual<br />
party to a financing transaction is not necessarily<br />
able to fulfil its obligations under the agreement.<br />
Counterparty risks in treasury operations<br />
are mainly connected with investing funds and<br />
with the counterparty risks of derivative contracts.<br />
The Group accepts as its counterparty only financial<br />
institutions that have a good credit rating. At<br />
present there are more than 20 approved counterparties.<br />
A counterparty that has received a<br />
credit rating under the A level or that is unrated<br />
must have a separate approval. At present this<br />
condition applies only to a few counterparties.<br />
Before being accepted as a counterparty, the financial<br />
institution must go through a special approval<br />
process. In addition, Treasury Management<br />
approves the new banking relationships of<br />
subsidiaries. Counterparty risk is monitored on a<br />
monthly basis by defining from the market values<br />
of receivables the maximum risk associated with<br />
each counterparty. For each financial institution,<br />
there is an approved limit. Of these limits, the<br />
maximum amount in use at the turn of the year<br />
was 33 %. Short-term investments are made in<br />
liquid instruments that have a low risk. Credit<br />
risks in treasury operations did not result in credit<br />
losses during the financial year.<br />
Funding risk<br />
The Group diversifies its funding risk by obtaining<br />
financing from different sources in different<br />
markets. The Group has bank loans,<br />
pension loans, insurance company loans, a Medium<br />
Term Note Programme as well as shortterm<br />
domestic and foreign commercial paper<br />
programmes. The objective is to balance the<br />
maturity schedule of the bond and loan portfolio<br />
and to maintain a sufficiently long maturity<br />
for long-term loans. The Group’s solvency and<br />
funding arrangements are safeguarded by maintaining<br />
good liquidity and by means of revolving<br />
credit facilities. The Group has a commercial<br />
paper programme, providing for the raising<br />
of a maximum of EUR 150 million as well as a<br />
Euro Commercial Paper (ECP) programme,<br />
within which a maximum of USD 200 million<br />
can be raised. The ECP programme was used<br />
to a very minor extent in <strong>1999</strong>. The Group’s average<br />
liquidity in <strong>1999</strong> was EUR 91 million. At<br />
the end of <strong>1999</strong> the liquidity was EUR 88 million<br />
as well as an unutilized revolving credit facility<br />
of about EUR 260 million, or a total of<br />
EUR 348 million. The management of liquidity<br />
is being developed continually through more<br />
effective use of the Group’s cash pool arrangements.<br />
The introduction of the euro from the<br />
beginning of <strong>1999</strong> and the euro cash pool that<br />
is to be developed as a consequence of it will<br />
facilitate the management of liquid funds considerably.<br />
As plans now stand, a euro cash pool<br />
will be started up stage by stage during 2000.<br />
Documentation risk<br />
The Group’s documentation risk of financing<br />
agreement is managed by concentrating the<br />
approval of financing agreements within<br />
Group Treasury as well as by using standardized<br />
agreement models.<br />
Financial instruments 31.12.<strong>1999</strong> 31.12.1998<br />
Nominal Fair Nominal Fair<br />
value value value value<br />
Currency instruments<br />
Forward contracts 318.9 1.9 378.9 –4.2<br />
Of which for hedging of future currency flows 47.7 3.2 125.2 –2.5<br />
Currency options<br />
Bought 5.8 0.1 38.7 0.9<br />
Sold 11.6 –0.5 59.3 –0.9<br />
Currency swaps 183.2 –9.9 198.9 –5.6<br />
Interest rate instruments<br />
Interest rate swaps 173.9 –3.6 120.5 –6.3<br />
Forward rate agreements 290.0 – 321.2 0.1<br />
Of which open – – 15.8 0.1<br />
Bond futures 2.0 – – –<br />
Of which open – – – –<br />
Nominal values of the financial instruments do not necessarily correspond with the actual cash flows<br />
between the counterparties and do not therefore give a fair view of the risk position of the Group.<br />
Fair values are based on market valuation on the date of reporting for the instruments which are<br />
publicly traded. Other instruments have been valued based on net present values of future cash<br />
flows. A valuation model has been used to estimate the fair values of options.<br />
32
NOTES TO CONSOLIDATED FINANCIAL STATEMENTS<br />
27. SHARES AND HOLDINGS OF GROUP COMPANIES<br />
Holding<br />
%<br />
Associated companies 1)<br />
A/S Ammonia Fredericia Denmark 33.3<br />
Alufluor AB Helsingborg Sweden 50.0<br />
Aluminium Sulphate Co. of Egypt, S.A.E. Cairo Egypt 26.1<br />
Aquanorm V.O.F. Gorinchem The Netherlands 50.0<br />
Corob India PVT.LTD Mumbai India 25.5<br />
DA Kemikaalide AS Tallinn Estonia 40.0<br />
Farmit Website Oy Helsinki Finland 33.3<br />
Indkoebsselskabet for Kali I/S Fredericia Denmark 50.0<br />
Kemax B.V. Rozenburg The Netherlands 50.0<br />
<strong>Kemira</strong> Arab Potash Company Amman Jordan 48.0<br />
<strong>Kemira</strong> Compound Fertiliser (Zhanjiang) Co. Ltd. Zhanjiang China 49.0<br />
<strong>Kemira</strong> Emirates Fertilizer Company (Kefco) Dubai United Arab Emirates 39.8<br />
<strong>Kemira</strong> Kuok Fertilizer Sdn. Bhd. Kuala Lumpur Malaysia 30.0<br />
<strong>Kemira</strong> Thai Co. Ltd Bangkok Thailand 49.5<br />
<strong>Kemira</strong> Trading Oy Helsinki Finland 100.0<br />
<strong>Kemira</strong>-Ube Ltd Tokyo Japan 50.0<br />
Kemwater Phil., Corp. Manila Philippines 40.0<br />
Kemwater (Yixing) Co., Ltd Yixing City China 49.0<br />
KK Animal Nutrition (Pty) Ltd. Durban South Africa 50.0<br />
Movere Oy Lahti Finland 40.0<br />
Oy Polargas Ab Oulu Finland 30.0<br />
PK Düngerhandelsgesellschaft m.b.H. Hannover Germany 50.0<br />
Seco S.A. Ribécourt France 49.9<br />
Superstar Fertilizers Co. Ltd Bangkok Thailand 40.0<br />
Spruce Vakuutus Oy Helsinki Finland 100.0<br />
Swedish Water Corporation AB Stockholm Sweden 25.0<br />
UAB <strong>Kemira</strong> Lifosa Kedainiai Lithuania 33.1<br />
Union <strong>Kemira</strong> Co. Abu Dhabi United Arab Emirates 49.0<br />
Varteko Valduse AS Pärnu Estonia 41.8<br />
1)<br />
Including such wholly owned companies that have been consolidated according to the equity method.<br />
Real estate and housing companies are included in other shares.<br />
Other shares and holdings<br />
Ekokem Oy Ab Finland 3.0<br />
Peder P. Hedegaard A/S Denmark 5.0<br />
Vierumäen Kuntokylä Oy Finland 8.0<br />
Forcit Oy Finland 15.4<br />
Suomen Rehu Oy Finland 19.9<br />
A list of consolidated subsidiaries is on pages 70–71.<br />
28. SEGMENT DATA<br />
Primary segment - business segment<br />
The Group is organized into the following main business areas: <strong>Kemira</strong> Chemicals, Tikkurila, <strong>Kemira</strong><br />
Agro and <strong>Kemira</strong> Pigments.<br />
Intra-Group transfer prices are based primarily on market prices. In some cases, for example,<br />
where marketing companies are involved, cost-based prices are used, thereby including the margin<br />
(so-called cost plus method).<br />
The assets and liabilities of businesses comprise asssets and liabilities which can be allocated, directly<br />
or justifiably, to the businesses in question. The assets of the business segments include tangible<br />
and intangible assets, interest in associated companies, inventories and non-interest-bearing receivables.<br />
Short-term non-interest-bearing liabilities are included in the liabilities of the business segments.<br />
33
NOTES TO CONSOLIDATED FINANCIAL STATEMENTS<br />
Sagment data (EUR million)<br />
<strong>1999</strong> <strong>Kemira</strong> Tikkurila <strong>Kemira</strong> <strong>Kemira</strong> Other Group<br />
Chemicals Agro Pigments<br />
Income statement<br />
External net sales 629.4 357.3 1,000.4 477.7 61.4 2,526.2<br />
Intra-Group sales 67.6 0.2 14.3 10.8 –92.9 –<br />
Net sales, total 697.0 357.5 1,014.7 488.5 –31.5 2,526.2<br />
Share of associates’ profits 2.9 – –0.5 – 0.4 2.8<br />
Operating income 83.2 23.1 –38.8 34.9 8.6 111.0<br />
Other information<br />
Assets of businesses 777.2 297.5 792.5 538.4 58.5 2,464.1<br />
of which holdings in associated companies 29.3 – 16.5 0.6 4.3 50.7<br />
Unallocated assets 138.8<br />
Consolidated assets, total 2,602.9<br />
Liabilities of businesses 112.1 59.1 231.4 93.0 6.0 501.6<br />
Unallocated liabilities 1,118.4<br />
Consolidated liabilities, total 1,620.0<br />
Capital expenditure 48.9 22.6 47.4 46.2 3.0 168.1<br />
Depreciation 56.0 18.1 64.2 46.2 3.6 188.1<br />
Cash flow<br />
Operations 75.0 27.5 36.5 55.1 –13.2 180.9<br />
Capital expenditure –48.5 –20.5 –46.3 –46.2 11.9 –149.6<br />
Financing –14.5 –5.8 3.7 –1.4 –20.4 –38.4<br />
1998<br />
Income statement<br />
External net sales 566.6 360.5 1,011.1 411.8 62.7 2,412.7<br />
Intra-Group sales 63.1 – 19.2 11.1 –93.4 –<br />
Net sales, total 629.7 360.5 1,030.3 422.9 –30.7 2,412.7<br />
Share of associates’ profits 4.0 – –0.1 – 1.1 5.0<br />
Operating income 75.1 32.6 18.7 22.3 –0.6 148.1<br />
Other information<br />
Assets of businesses 707.2 285.2 771.8 485.6 63.3 2,313.1<br />
of which holdings in associated companies 26.7 9.1 0.6 5.2 41.6<br />
Unallocated assets 140.0<br />
Consolidated assets, total 2,453.1<br />
Liabilities of businesses 149.2 82.0 195.9 87.5 –106.2 408.4<br />
Unallocated liabilities 1,095.5<br />
Consolidated liabilities, total 1,503.9<br />
Capital expenditure 126.3 22.8 62.1 40.4 3.9 255.5<br />
Depreciation 48.2 16.1 57.2 44.1 5.1 170.7<br />
Cash flow<br />
Operations 79.4 9.0 19.4 37.4 –22.5 122.7<br />
Capital expenditure –125.3 –15.4 –61.0 –37.9 1.8 –237.8<br />
Financing 57.0 7.6 15.0 –8.3 1.8 73.1<br />
34
NOTES TO CONSOLIDATED FINANCIAL STATEMENTS<br />
Secondary segment - Geographical segment<br />
<strong>1999</strong> 1998<br />
Net sales<br />
Finland 453.5 497.2<br />
Other EU countries 1,324.5 1,275.3<br />
Rest of Europe 211.7 206.1<br />
North and South America 328.9 267.7<br />
Asia 167.8 124.5<br />
Other countries 39.8 41.9<br />
Total 2,526.2 2,412.7<br />
Assets (tangible and intangible fixed assets)<br />
Finland 535.5 531.1<br />
Other EU countries 603.8 608.8<br />
Rest of Europe 34.5 27.9<br />
North and South America 190.0 170.9<br />
Asia 42.4 37.6<br />
Other countries 1.7 –<br />
Total 1,407.9 1,376.3<br />
Capital expenditure<br />
Finland 77.6 82.7<br />
Other EU countries 58.9 71.0<br />
Rest of Europe 9.8 8.6<br />
North and South America 20.4 52.3<br />
Asia 1.3 40.8<br />
Other countries 0.1 0.1<br />
Total 168.1 255.5<br />
29. CHANGES IN GROUP STRUCTURE<br />
Acquisitions of Group companies, and new subsidiaries that have been founded<br />
• A. Jalander Eesti Oü, a wholly-owned subsidiary of A. Jalander Oy that was established in Estonia,<br />
began operations.<br />
• <strong>Kemira</strong> Agro Oy acquired a 50% stake in the Italian company Biolchim S.p.A., which will operate as a<br />
joint venture.<br />
• Tikkurila Paints Oy established a wholly-owned subsidiary in Moscow. The company’s name is<br />
OOO Kraski Tikkurila.<br />
• <strong>Kemira</strong> Agro Oy established an associated company in Dubai, United Arab Emirates, together with<br />
Union <strong>Kemira</strong> Co. and Emirates Food Company (EFC). The holdings are 30%, 20% and 50%, respectively.<br />
The company’s name is <strong>Kemira</strong> Emirates Fertilizer Company (Kefco).<br />
• <strong>Kemira</strong> Agro Oy acquired a 33.3% holding in Farmit Website Oy, a company in Helsinki.<br />
• <strong>Kemira</strong> Agro Oy established an associated company in Jordan under the name <strong>Kemira</strong> Arab Potash<br />
Company. Its stake in the company is 48%. The new company is owned by <strong>Kemira</strong> Danmark A/S.<br />
• <strong>Kemira</strong> Chemicals Oy established an associated company in China under the name Kemwater (Yixing)<br />
Co., Ltd. The stake in the company is 49%.<br />
• <strong>Kemira</strong> Chemicals Oy established in Hungary a wholly-owned marketing company named <strong>Kemira</strong><br />
Chemicals Hungaria KFT.<br />
• On 21 December <strong>1999</strong> <strong>Kemira</strong> Chemicals Oy established in Canada a company named <strong>Kemira</strong> Chemicals<br />
Canada NRO, Inc.<br />
• In January 2000 <strong>Kemira</strong> Chemicals Oy and the City of Helsinki established a company named Kemwater<br />
Services Oy, which will be engaged in the treatment of waste water. <strong>Kemira</strong> Chemicals Oy has a<br />
51% holding in the company and the City of Helsinki has 49%.<br />
• <strong>Kemira</strong> Agro increased its ownership in Chinese <strong>Kemira</strong> Compound Fertiliser (Zhanjiang) Co. Ltd. from<br />
35% to 49%.<br />
Changes in holdings in Group companies within the Group<br />
• <strong>Kemira</strong> N.I. Ltd was merged with <strong>Kemira</strong> Agro U.K. Ltd, and <strong>Kemira</strong> Agro U.K. Ltd became the parent<br />
company of <strong>Kemira</strong> Ireland Ltd.<br />
• <strong>Kemira</strong> Chemicals Oy sold the company named <strong>Kemira</strong> Kemwater GmbH to Tikkurila Coatings Oy.<br />
The company’s name was changed to Tikkurila Coatings GmbH.<br />
• Corob S.p.A. was merged with Taotek S.p.A. on 31 December <strong>1999</strong>. In connection with the merger,<br />
Taotek S.p.A.’s name was changed to Corob S.p.A.<br />
• In Denmark <strong>Kemira</strong> Oyj established a company named <strong>Kemira</strong> Danmark Holding A/S, to which<br />
<strong>Kemira</strong> Danmark A/S was transferred from the ownership of <strong>Kemira</strong> Agro Oy and <strong>Kemira</strong> Miljø A/S<br />
was transferred from the ownership of <strong>Kemira</strong> Kemi AB.<br />
Name changes<br />
• Taotek North America Inc changed its name to Corob North America Inc.<br />
• Taotek Asia Ltd was renamed Corob Ltd.<br />
• AS Tikkurila International Coatings was renamed AS Tikkurila Coatings.<br />
• <strong>Kemira</strong> Color B.V.’s name was changed as from 1 January 2000 to Tikkurila Coatings B.V.<br />
• <strong>Kemira</strong> Coatings Ltd’s name was changed as from 1 January 2000 to Tikkurila Coatings Ltd.<br />
• <strong>Kemira</strong> Coatings (Ireland) Ltd’s name was changed as from 1 January 2000 to Tikkurila Coatings<br />
(Ireland) Ltd.<br />
35
KEMIRA OYJ FINANCIAL STATEMENTS<br />
INCOME STATEMENT (EUR million)<br />
1.1. – 31.12.<br />
Note <strong>1999</strong> 1998<br />
Net sales 1 27.2 31.7<br />
Other income from operations 2 9.8 0.5<br />
Cost of sales 3, 4 –32.5 –37.1<br />
Depreciation 5 –1.0 –1,8<br />
Operating income 3.5 –6.7<br />
Financing income and expenses 6 16.5 8.2<br />
Income before extraordinary items, 20.0 1.5<br />
appropriations and taxes<br />
Extraordinary items 7 81.6 106.1<br />
Income before appropriations and taxes 101.6 107.6<br />
Appropriations 5 0.0 0.8<br />
Direct taxes 9 –28.4 –30.4<br />
Net income 73.2 78.0<br />
CASH FLOW STATEMENT (EUR million) <strong>1999</strong> 1998<br />
Funds from operations<br />
Operating income 3.5 –6.7<br />
Depreciation 1.0 1.7<br />
Interest income 31.0 26.0<br />
Interest expense –22.5 –17.4<br />
Dividend received 1.3 3.5<br />
Other financing items 17.4 2.9<br />
Taxes –20.4 –23.7<br />
Total funds from operations 11.3 –13.7<br />
Change in net working capital<br />
Short-term receivables –2.7 30.0<br />
Non-interest-bearing short-term liabilities 7.5 –41.1<br />
Change in net working capital, total 4.8 –11.1<br />
Cash flow from operations 16.1 –24.8<br />
Capital expenditure<br />
Acquisitions of Group companies –66.3 –9.7<br />
Acquisitions of associated companies – –1.4<br />
Purchase of other fixed assets –0.8 –0.6<br />
Disposal of associated companies – 0.8<br />
Sales of other fixed assets 0.2 0.3<br />
Total capital expenditure –66.9 –10.6<br />
Cash flow before financing –50.8 –35.4<br />
Financing<br />
Change in long-term loans (increase +, decrease -) 120.8 94.5<br />
Change in long-term loan receivables<br />
(increase -, decrease +) –47.6 –90.4<br />
Short-term financing, net (increase +, decrease -) –28.3 124.8<br />
Group contribution 109.1 62.4<br />
Dividend paid –36.8 –36.8<br />
Other –5.9 –0.1<br />
Financing, total 111.3 154.4<br />
Increase / decrease in liquid funds 60.5 119.0<br />
Liquid funds at end of year 337.0 276.5<br />
Liquid funds at beginning of year 276.5 157.5<br />
Increase / decrease in liquid funds 60.5 119.0<br />
BALANCE SHEET (EUR million)<br />
31.12.<br />
Note <strong>1999</strong> 1998<br />
ASSETS<br />
Non-current assets<br />
Intangible assets 10 0.4 0.3<br />
Tangible assets 11 21.4 21.9<br />
Investments 12<br />
Shares in Group companies 434.7 380.0<br />
Holdings in associates 5.0 5.0<br />
Other shares and holdings 3.1 3.1<br />
Own shares 5.8 –<br />
Total investments 477.3 429.7<br />
Other investments 925.9 817.8<br />
Total non-current assets 947.7 840.0<br />
Current assets<br />
Receivables 13<br />
Interest-bearing receivables 114.1 70.6<br />
Interest-free receivables 123.4 136.7<br />
Total receivables 237.5 207.3<br />
Securities 14 334.3 272.3<br />
Cash and bank 2.7 4.2<br />
Total current assets 574.5 483.8<br />
Total assets 1,522.2 1,323.8<br />
LIABILITIES AND SHAREHOLDERS’ EQUITY<br />
Shareholders’ equity 15<br />
Share capital 217.0 216.6<br />
Share premium account 252.5 252.9<br />
Reserve for own shares 5.8 –<br />
Retained earnings 184.9 149.5<br />
Net profit for the financial year 73.2 78.0<br />
Total shareholders’ equity 733.4 697.0<br />
Appropriations 16 0.5 0.5<br />
Long-term liabilities<br />
Interest-bearing long-term liabilities 17 525.2 385.1<br />
Interest-free long-term liabilities 18 – 1.5<br />
Total long-term liabilities 525.2 386.6<br />
Current liabilities 19<br />
Interest-bearing short-term liabilities 217.5 202.8<br />
Interest-free short-term liabilities 45.6 36.9<br />
Total current liabilities 263.1 239.7<br />
Total liabilities 788.3 626.3<br />
Total liabilities and shareholders’ equity 1,522.2 1,323.8<br />
36
NOTES TO KEMIRA OYJ FINANCIAL STATEMENTS<br />
INCOME STATEMENT (EUR million)<br />
1. NET SALES <strong>1999</strong> 1998<br />
Net sales 27.2 31.7<br />
Net sales consist of sale of electricity to Finnish Group<br />
companies and other external customers in Finland.<br />
2. OTHER INCOME FROM OPERATIONS<br />
Gains on the sale of fixed assets 9.3 0.1<br />
Other income 0.5 0.4<br />
Total 9.8 0.5<br />
3. COST OF SALES<br />
Materials and services<br />
Materials and supplies<br />
Purchases during the financial year 20.8 25.6<br />
External services – 0.2<br />
Total materials and services 20.8 25.8<br />
Personnel expenses 6.4 5.9<br />
Rents 2.3 2.5<br />
Losses on the sales of fixed assets 0.0 0.0<br />
Other expenses 3.0 2.9<br />
Total 32.5 37.1<br />
4. PERSONNEL EXPENSES AND NUMBER OF PERSONNEL<br />
Emoluments of the Supervisory Board 0.1 0.0<br />
Emoluments of boards of directors<br />
and managing directors 1) 0.9 0.8<br />
Other wages and salaries 4.2 4.0<br />
Pension expenses 0.7 0.6<br />
Other personnel expenses 0.5 0.5<br />
Total 6.4 5.9<br />
1)<br />
Performance-related bonuses were not paid to management in <strong>1999</strong>, whereas<br />
in 1998 performance-related bonuses amounted to EUR 0.03 million.<br />
Management’s pension commitments<br />
The managing director and deputy managing director of <strong>Kemira</strong> Oyj are<br />
entitled to retire at the age of 60. This possibility is based on the benefits of the<br />
supplementary pension foundation that has been closed to new menbers since<br />
1 January 1991. The supplementary pension foundation’s benefits concern all<br />
the personnel whose years of service and other conditions concerning the<br />
granting of a pension have been fulfilled.<br />
The pension commitments to the management of the company do not differ<br />
from those to the other permanent staff.<br />
Personnel<br />
Personnel average 132 133<br />
Personnel at year end 133 130<br />
5. DEPRECIATION<br />
Scheduled depreciation<br />
Intangible assets<br />
Intangible rights 0.1 0.1<br />
Other long-term expenditures 0.0 0.1<br />
Tangible assets<br />
Buildings and constructions 0.3 0.9<br />
Machinery and equipment 0.6 0.7<br />
Other tangible assets 0.0 0.0<br />
Total 1.0 1.8<br />
Decrease in difference between scheduled and actual depreciation<br />
Intangible assets 0.0 0.0<br />
Other long-term expenditures –0.1 0.0<br />
Buildings and constructions –0.2 0.4<br />
Machinery and equipment 0.3 0.4<br />
Total 0.0 0.8<br />
6. FINANCING INCOME AND EXPENSES<br />
Financing income<br />
Dividend income<br />
Dividend income from Group companies – 2.8<br />
Dividend income from associates 1.6 0.5<br />
Dividend income from others 0.2 1.5<br />
Total dividend income 1.8 4.8<br />
Interest income<br />
From long-term investments from<br />
Group companies 26.5 25.5<br />
From short-term investments from<br />
Group companies 12.6 8.5<br />
From short-term investments from<br />
others 1.8 3.6<br />
Total interest income 40.9 37.6<br />
<strong>1999</strong> 1998<br />
Other financing income<br />
Other financing income from Group companies 0.2 0.2<br />
Other financing income from others 0.0 0.1<br />
Other financing income total 0.2 0.3<br />
Exchange differences<br />
Exchange differences from Group companies 75.2 –<br />
Exchange differences from others –69.3 –<br />
Total exchange differences 5.9 –<br />
Total financing income 48.8 42.7<br />
Financing expenses<br />
Interest expenses<br />
Interest expenses to Group companies –2.1 0.5<br />
Interest expenses to others –29.7 –23.8<br />
Total interest expenses –31.8 –23.3<br />
Other financing expenses –0.5 –0.8<br />
Exchange differences<br />
Exchange differences from Group companies – –24.7<br />
Exchange differences from others – 14.3<br />
Total exchange differences – –10.4<br />
Total financing expenses –32.3 –34.5<br />
Total financing income and expenses 16.5 8.2<br />
Exchange gains and losses<br />
Realized 17.7 3.4<br />
Unrealized –11.8 –13.8<br />
Total 5.9 –10.4<br />
7. EXTRAORDINARY ITEMS<br />
Extraordinary income<br />
Group contribution received 96.1 112.0<br />
Total 96.1 112.0<br />
Extraordinary expenses<br />
Group contribution granted 2.9 2.5<br />
Write-downs on shares 11.6 3.4<br />
Total 14.5 5.9<br />
Total extraordinary income and expenses 81.6 106.1<br />
8. CHANGE IN APPROPRIATIONS<br />
Decrease in depreciation difference 0.0 0.8<br />
Total 0.0 0.8<br />
9. DIRECT TAXES<br />
Direct taxes on extraordinary items 22.8 29.7<br />
Direct taxes, current year 5.6 0.6<br />
Direct taxes, previous years 0.0 0.1<br />
Other 0.0 0.0<br />
Total 28.4 30.4<br />
10. INTANGIBLE ASSETS<br />
Intangible Other longterm<br />
<strong>1999</strong> 1998<br />
rights<br />
expen-<br />
total total<br />
ditures<br />
Acquisition cost at beginning of year 0.6 1.2 1.8 2.0<br />
Increases 0.1 0.1 0.2 0.0<br />
Decreases 0.0 –0.8 –0.8 –0.2<br />
Acquisition cost at end of year 0.7 0.5 1.2 1.8<br />
Accumulated depreciation at<br />
beginning of year –0.4 –1.1 –1.5 –1.4<br />
Accumulated depreciation relating to<br />
decreases and transfers 0.0 0.8 0.8 0.0<br />
Depreciation during the financial year 0.0 –0.1 –0.1 –0.1<br />
Accumulated depreciation at end of year –0.4 –0.4 –0.8 –1.5<br />
Net book value at end of year 0.3 0.1 0.4 0.3<br />
37
NOTES TO KEMIRA OYJ FINANCIAL STATEMENTS<br />
BALANCI SHEET (EUR million)<br />
11. TANGIBLE ASSETS<br />
Land and<br />
water areas 1)<br />
Buildings and<br />
constructions 2)<br />
Machinery<br />
and<br />
equipment<br />
Other<br />
tangible<br />
assets<br />
Advances<br />
paid and fixed<br />
assets under<br />
construction<br />
<strong>1999</strong><br />
total<br />
1998<br />
total<br />
Acquisition cost at beginning of year 2.7 28.2 9.5 0.5 0.1 41.0 40.6<br />
Increases 0.0 0.0 0.5 0.0 –0.1 0.4 0.6<br />
Decreases 0.0 0.0 –1.2 0.0 0.0 –1.2 –0.2<br />
Acquisition cost at end of year 2.7 28.2 8.8 0.5 0.0 40.2 41.0<br />
Accumulated depreciation at beginning of year 0.0 –11.2 –7.5 –0.4 0.0 –19.1 –17.6<br />
Accumulated depreciation relating to<br />
decreases and transfers 0.0 0.0 1.2 0.0 0.0 1.2 0.1<br />
Depreciation during the financial year 0.0 –0.3 –0.6 0.0 0.0 –0.9 –1.6<br />
Accumulated depreciation at end of year 0.0 –11.5 –6.9 –0.4 0.0 –18.8 –19.1<br />
Net book value at end of year 2.7 16.7 1.9 0.1 0.0 21.4 21.9<br />
1) The acquisition cost and the book value of land and water areas include revaluations of EUR 0.6 million in <strong>1999</strong> and in 1998.<br />
2) The acquisition cost of buildings and constructions include revaluations of EUR 5.0 million in <strong>1999</strong> and in 1998.<br />
12. INVESTMENTS<br />
Holdings in<br />
associates<br />
Group<br />
company and<br />
other shares<br />
Investments in<br />
Group<br />
companies<br />
Own<br />
shares<br />
<strong>1999</strong><br />
total<br />
1998<br />
total<br />
Acquisition cost at beginning of year 5.0 383.1 429.7 – 817.8 720.5<br />
Increases 0.0 66.4 0.0 5.8 72.2 11.1<br />
Decreases 0.0 –11.7 0.0 – –11.7 –4.2<br />
Receivables from Group companies 0.0 0.0 47.6 – 47.6 90.4<br />
Net book value at end of year 5.0 437.8 477.3 5.8 925.9 817.8<br />
Shares and holdings are specified in Note 21.<br />
Taxable values of real estate and <strong>1999</strong> 1998<br />
securities included in non-current assets<br />
Land and water areas 0.5 0.5<br />
Buildings and constructions 14.3 14.3<br />
Shares in subsidiaries 481.5 421.5<br />
Other shares and holdings 5.4 4.6<br />
To the extent that taxation values have not been confirmed for shares and<br />
holdings, book values have been used.<br />
13. RECEIVABLES<br />
Long-term receivables<br />
Interest-free long-term receivables<br />
Receivable from pension liability at 1 Jan. 1.5 1.4<br />
Transfer to other short-term<br />
interest-free receivables –1.5 –<br />
Increase / Decrease – 0.1<br />
Receivables from pension liability at 31 Dec. – 1.5<br />
Total interest-free long-tem receivables – 1.5<br />
Total long-term receivables – 1.5<br />
Current receivables<br />
Interest-bearing short-term receivables<br />
Loan receivables from Group companies 114.1 70.6<br />
Total interest-bearing short-term receivables 114.1 70.6<br />
Interest-free short-term receivables<br />
Accounts receivable<br />
Accounts receivable from Group companies 3.2 2.7<br />
Accounts receivable from others 1.0 1.8<br />
Total accounts receivable 4.2 4.5<br />
Advances paid 0.1 0.1<br />
Prepaid expenses and accrued income<br />
Prepaid expenses and accrued<br />
income from Group companies 111.0 124.7<br />
Prepaid expenses and accrued<br />
income from others 6.7 5.9<br />
Total prepaid expenses and accrued income 117.7 130.6<br />
Other interest-free short-term receivables<br />
Receivables from pension liability at 1 Jan. – –<br />
Transfer from long-term receivables 1.5 –<br />
Decrease –0.2 –<br />
Receivable from pension liability at 31 Dec. 1.3 –<br />
Other receivables<br />
Other receivables 0.1 –<br />
Total other interest-free short-term receivables 1.4 –<br />
Total interest-free current receivables 123.4 135.2<br />
Total receivables 237.5 207.3<br />
Loans to the management – –<br />
<strong>1999</strong> 1998<br />
Prepaid expenses and accrued income<br />
From interests 9.9 11.5<br />
From exchange differences 5.9 2.8<br />
From Group contribution 96.1 112.0<br />
Other 5.8 4.3<br />
Total 117.7 130.6<br />
14. SECURITIES<br />
Securities in Group companies 308.2 249.0<br />
Securities in other companies 26.1 23.3<br />
Total 334.3 272.3<br />
15. SHAREHOLDERS’ EQUITY<br />
Share capital at 1 Jan. 216.6 216.6<br />
Change 0.4 –<br />
Share capital at 31 Dec. 217.0 216.6<br />
Share premium account at 1 Jan. 252.9 252.9<br />
Change –0.4 –<br />
Share premium account at 31 Dec. 252.5 252.9<br />
Fund for own shares at 1 jan. – –<br />
Purchase of own shares 5.8 –<br />
Funf for own shares at 31 Dec. 5.8 –<br />
Retained earnings at 1 Jan. 227.5 186.3<br />
Net profit for the year 73.2 78.0<br />
Dividends paid –36.8 –36.8<br />
Purchase of own shares –5.8 –<br />
Donations 0.0 0.0<br />
Retained earnings and net<br />
profit for the year at 31 Dec. 258.1 227.5<br />
Total shareholders’ equity at 31 Dec. 733.4 697.0<br />
16. APPROPRIATIONS<br />
Appropriations<br />
Appropriations in the balance sheets are as follows:<br />
Buildings and constructions 0.0 –0.2<br />
Machinery and equipment 0.4 0.7<br />
Other tangible assets 0.1 0.1<br />
Intangible rights 0.0 0.0<br />
Other long-term expenditures 0.0 –0.1<br />
Total 0.5 0.5<br />
Change in appropriations<br />
Appropriations at 1 Jan. 0.5 1.3<br />
Change in untaxed reserves 0.0 –0.8<br />
Appropriations at 31 Dec. 0.5 0.5<br />
Deferred tax liabilities on accumulated depreciations was EUR 0.1 million at 31<br />
Dec.<strong>1999</strong> and EUR 0.1 million at 31 Dec.1998.<br />
38
NOTES TO KEMIRA OYJ FINANCIAL STATEMENTS<br />
BALANCI SHEET (EUR million)<br />
<strong>1999</strong> 1998<br />
17. LONG-TERM INTEREST-BEARING LIABILITIES<br />
Debentures and other bond loans 61.7 61.7<br />
Loans from financial institutions 380.7 258.0<br />
Loans from pension institutions 56.3 65.3<br />
Other long-term liabilities 26.5 0.1<br />
Total 525.2 385.1<br />
Long-term interest-bearing liabilities maturing in<br />
2001 (2000) 45.5 0.4<br />
2002 (2001) 8.7 17.5<br />
2003 (2002) 174.3 7.1<br />
2004 (2003) 142.2 134.8<br />
2005 (2004) or later 154.5 225.3<br />
Total 525.2 385.1<br />
Liabilities maturing in 5 years or longer<br />
Loans from pension institutions 56.3 65.3<br />
Other long-term liabilities 98.2 160.0<br />
Total 154.5 225.3<br />
Debentures and other bond loans<br />
Loan<br />
Loan currency<br />
FI 0003008581 1998-2003 EUR 45.2 45.2<br />
FI 0003008599 1998-2006 EUR 16.5 16.5<br />
Total 61.7 61.7<br />
The Group has no convertible bonds.<br />
18. LONG-TERM INTEREST-FREE LIABILITIES<br />
Pension liabilities<br />
Uncovered liabilities of pension funds 0.1 0.1<br />
Other pension liabilities 1.4 1.4<br />
Transfer to other interest-free liabilities –1.5 –<br />
Total – 1.5<br />
19. CURRENT LIABILITIES<br />
Interest-bearing short-term liabilities<br />
Loans from financial institutions 87.6 101.0<br />
Current portion of other long-term loans to<br />
others 11.5 30.8<br />
Other interest-bearing short-term liabilities<br />
to Group companies 79.2 57.6<br />
to others 39.2 13.4<br />
Total interest-bearing short-term liabilities 217.5 202.8<br />
Repayments of other long-term loans include EUR 0.1 million of bonds with<br />
warrants targeted at management. Details of the issue are given on page 14.<br />
Interest-free short-term liabilities<br />
Accounts payable<br />
to Group companies 0.0 0.0<br />
to others 3.0 2.7<br />
Total accounts payable 3.0 2.7<br />
Accrued expenses and prepaid income<br />
to Group companies 3.9 6.7<br />
to others 37.4 27.2<br />
Total accrued expenses and prepaid income 41.3 33.9<br />
Pension liabilities<br />
Transfer from interest-free long-term liablities 1.5 –<br />
Change in pension liabilities –0.3 –<br />
Total pension liabilities 1.2 –<br />
Other interest-free liabilities to others 0.1 0.3<br />
Total interest-free short-term liabilities 45.6 36.9<br />
Total current liabilities 263.1 239.7<br />
<strong>1999</strong> 1998<br />
20. COLLATERAL AND CONTINGENT LIABILITIES<br />
Loans secured by mortgages in the balance sheet and<br />
for which mortgages given as collateral<br />
Loans from pension institutions 4.3 5.0<br />
Mortgages given 5.0 5.0<br />
Contingent liabilities<br />
Assets pledged<br />
On behalf of own commitments 0.2 3.5<br />
On behalf of Group companies 10.9 10.9<br />
Guarantees<br />
On behalf of Group companies<br />
For loans 70.0 121.2<br />
For leasing obligations 54.1 50.5<br />
For other obligations 7.7 1.1<br />
On behalf of associates 20.2 22.8<br />
On behalf of others 1.9 2.2<br />
Total 153.9 197.8<br />
Letter of Comfort obligations 1)<br />
On behalf of Group companies<br />
For credits 0.2 2.0<br />
For leasing agreements 3.7 4.5<br />
Total 3.9 6.5<br />
1)<br />
Letter of Comfort obligations do not constitute a legal guarantee.<br />
The nominal values and market values of financing instruments are included in the<br />
Notes to the consolidated financial statements.<br />
21. SHARES AND HOLDINGS OF KEMIRA OYJ<br />
Holding<br />
%<br />
Shares in subsidiaries<br />
<strong>Kemira</strong> Agro Oy Helsinki Finland 100<br />
<strong>Kemira</strong> Chemicals Oy Helsinki Finland 100<br />
<strong>Kemira</strong> Pigments Holding B.V. Rotterdam The Netherlands<br />
1)<br />
17.8<br />
<strong>Kemira</strong> Metalkat Oy Helsinki Finland 100<br />
<strong>Kemira</strong> Pigments Oy Helsinki Finland 100<br />
<strong>Kemira</strong> Safety Oy Helsinki Finland 100<br />
Tikkurila Oy Helsinki Finland 100<br />
Spruce Vakuutus Oy Helsinki Finland 100<br />
<strong>Kemira</strong> Danmark Holding A/S Fredericia Denmark 100<br />
Other shares and holdings<br />
Ekokem Oy Ab Finland 1.4<br />
Forcit Oy Finland 15.4<br />
Innopoli Oy Finland 0.7<br />
Liikkeenjohdon koulutuskeskus Finland 2.0<br />
Luoston Huolto Oy Finland 1.3<br />
Tahkoluodon Polttoöljy Oy Finland 6.8<br />
Teollisuuden Voima Oy Finland 1.9<br />
Shares in housing and real estate companies<br />
Shares in telephone companies<br />
1)<br />
The ownership of the Group is 100%.<br />
Accrued expenses and prepaid income<br />
From salaries 0.9 0.9<br />
From interests and exchange differences 26.9 22.4<br />
From taxes 7.6 6.6<br />
From Group contribution 0.2 0.2<br />
Other 5.7 3.8<br />
Total 41.3 33.9<br />
39
PROPOSAL FOR THE DISTRIBUTION OF PROFITS<br />
The net profit of <strong>Kemira</strong> Oy for the <strong>1999</strong> financial<br />
year was EUR 73,241,803 and the distributable<br />
equity at 31 December <strong>1999</strong> was EUR<br />
258,105,760. The Group’s non-restricted equity<br />
was EUR 485,650,000. The parent company’s<br />
payment of a dividend is limited by the Group’s<br />
distributable equity, EUR 351,388,000, which is<br />
obtained when the share of untaxed reserves<br />
that has been transferred to shareholders’ equity<br />
and own shares are subtracted from the non-restricted<br />
equity shown in the Consolidated Balance Sheet.<br />
It is proposed to the <strong>Annual</strong> General Meeting that a dividend<br />
of EUR 0.23 per share, or EUR 29,624,000, be paid<br />
for the financial year. It is proposed that EUR 500,000 be<br />
reserved for use by the Board of Directors for purposes<br />
promoting the common good (among other things, for<br />
donations to the <strong>Kemira</strong> Oyj Foundation).<br />
Helsinki, 14 February 2000<br />
Sten-Olof Hansén<br />
Niilo Pellonmaa<br />
Eija Malmivirta<br />
Timo Kaisanlahti<br />
Tauno Pihlava<br />
Anssi Soila<br />
AUDITORS’ REPORT<br />
To the shareholders of <strong>Kemira</strong> Oyj<br />
We have audited the accounting records and the<br />
financial statements, as well as the administration<br />
by the Supervisory Board, the Board of Directors<br />
and the Managing Director of <strong>Kemira</strong> Oyj for the<br />
year ended 31 December <strong>1999</strong>. The financial statements,<br />
which include the report of the Board<br />
of Directors, consolidated and parent company<br />
income statements, balance sheets and notes to<br />
the financial statements, have been prepared by<br />
the Board of Directors and the Managing Director.<br />
Based on our audit we express an opinion<br />
on these financial statements and the company’s<br />
administration.<br />
We have conducted our audit in accordance with<br />
Finnish Generally Accepted Auditing Standards.<br />
Those standards require that we plan and perform<br />
the audit in order to obtain reasonable<br />
assurance about whether the financial statements<br />
are free of material misstatement. An audit includes<br />
examining, on a test basis, evidence supporting<br />
the amounts and disclosures in the financial statements,<br />
assessing the accounting principles used and<br />
significant estimates made by the management, as well<br />
as evaluating the overall financial statement presentation.<br />
The purpose of our audit of the administration has<br />
been to examine that the Supervisory Board, the Board<br />
of Directors and the Managing Director have complied<br />
with the rules of the Finnish Companies Act.<br />
In our opinion, the financial statements have been prepared<br />
in accordance with the Finnish Accounting Act<br />
and other rules and regulations governing the preparation<br />
of financial statements in Finland. The financial statements<br />
give a true and fair view, as defined in the Accounting<br />
Act, of both the consolidated and parent company<br />
result of operations, as well as of the financial position.<br />
The financial statements can be adopted and the<br />
members of the Supervisory Board, the Board of Directors<br />
and the Managing Director of the parent company<br />
can be discharged from liability for the period audited<br />
by us. The proposal made by the Board of Directors on<br />
how to deal with the retained earnings is in compliance<br />
with the Finnish Companies Act.<br />
Helsinki, 16 February 2000<br />
KPMG WIDERI OY AB<br />
Hannu Niilekselä<br />
Authorized Public Accountant<br />
40
STATEMENT OF THE SUPERVISORY BOARD<br />
The Supervisory Board of <strong>Kemira</strong> Oyj has read the<br />
financial statements of the parent company and the<br />
Group for <strong>1999</strong> and studied the Auditors’ report at<br />
its meeting today.<br />
The Supervisory Board advises the 2000 <strong>Annual</strong> General<br />
Meeting that the company has been managed<br />
well and that it has no comments to make on the financial<br />
statements of the parent company and the<br />
Group for <strong>1999</strong>. The Supervisory Board proposes<br />
that the financial statements of the parent company<br />
and the Group be adopted and that the Board of<br />
Directors, the Managing Director and his deputies<br />
be discharged from liability. The Supervisory Board<br />
concurs with the proposal of the Board of Directors<br />
for the distribution of profit funds.<br />
Helsinki, 17 February 2000<br />
Timo Kalli<br />
Hanna Markkula-Kivisilta<br />
Risto Ranki<br />
Pekka Kainulainen<br />
Kari Rajamäki<br />
Helena Rissanen<br />
Sirpa Hertell<br />
Mikko Långström<br />
41
KEMIRA CHEMICALS<br />
EUR<br />
million<br />
800<br />
600<br />
400<br />
200<br />
0<br />
MANAGEMENT<br />
President: Yrjö Sipilä<br />
Pulp & Paper Chemicals:<br />
Juhani Lindholm<br />
Kemwater: Lennart Johansson<br />
Industrial Chemicals:<br />
Harri Kerminen<br />
Yrjö<br />
Sipilä<br />
NET SALES<br />
Net sales<br />
Operating margin, %<br />
95 96 97 98 99<br />
CAPITAL EXPENDITURE<br />
95 96 97 98 99<br />
NET SALES BY BUSINESS UNIT<br />
Fine<br />
Chemicals 4 %<br />
Industrial<br />
Chemicals<br />
34 %<br />
%<br />
20<br />
15<br />
10<br />
5<br />
0<br />
EUR<br />
million<br />
150<br />
120<br />
90<br />
60<br />
30<br />
Pulp & Paper<br />
Chemicals<br />
43 %<br />
Kemwater 19 %<br />
0<br />
NET SALES AND PROFITS UP<br />
It was a mixed year for <strong>Kemira</strong> Chemicals.<br />
There was wide variation among<br />
different products and different market<br />
areas: some products had good sales,<br />
whereas others faced conditions that<br />
were even tantamount to a price war.<br />
The chemical industry’s difficulties in<br />
the wake of the Asian crisis continued<br />
in many fields. Within the pulp and<br />
paper industry, which is our most important<br />
customer group, business was<br />
depressed in the early months of the<br />
year, but by mid-year the demand for<br />
paper products and the price of pulp<br />
recovered. In the latter part of the year<br />
an upswing was already under way.<br />
<strong>Kemira</strong> Chemicals continued its<br />
brisk growth in <strong>1999</strong>. Net sales rose by<br />
11% and were EUR 697 million (1998:<br />
EUR 630 million). Operating income<br />
was up 11% to EUR 83 million (EUR<br />
75 million).<br />
All the strategic business units increased<br />
their sales. Net sales of the<br />
Pulp and Paper Chemicals unit rose by<br />
18% and were EUR 326 million. Kemwater’s<br />
net sales were up 7% to EUR<br />
145 million. Industrial Chemicals’ net<br />
sales were EUR 256 million, an increase<br />
of 4%. <strong>Kemira</strong> Fine Chemicals<br />
Oy reported net sales of EUR 30 million,<br />
up 15%.<br />
A LARGELY GOOD MARKET TREND<br />
Pulp & Paper Chemicals. The rise in<br />
the rate of capacity utilization at pulp<br />
and paper mills in the latter half of the<br />
year showed up quickly in the sales<br />
volumes of the Pulp & Paper Chemicals<br />
unit.<br />
The market situation for hydrogen<br />
peroxide varied from place to place.<br />
In Europe and Asia there was marginal<br />
growth, but in the United States and<br />
Canada it was quite brisk. This was<br />
due mainly to the fact that the American<br />
pulp industry went over to ECF<br />
bleaching and it was also attributable<br />
to the rise in the level of mechanical<br />
pulp bleaching. The price level of hydrogen<br />
peroxide was relatively stable<br />
and slightly rising.<br />
Kemwater. The market for water<br />
treatment chemicals developed in line<br />
with expectations. Growth continued<br />
in eastern and southern Europe. The<br />
situation in the developing countries<br />
varied according to the economic situation<br />
of each country. In Asia the situation<br />
showed slight signs of a rebound,<br />
but a recovery to pre-crisis levels<br />
still does not seem to have taken<br />
place. The Chinese market was the<br />
most buoyant. In certain areas of the<br />
established markets in Europe there<br />
were price pressures that affected the<br />
result of the Kemwater unit. Russia’s<br />
exports have not yet recovered to the<br />
level preceding the devaluation, but<br />
signs of a revival can be seen there,<br />
too.<br />
Industrial Chemicals. The price of<br />
phosphoric acid and demand for the<br />
product held steady. The appreciation<br />
against the euro of the United States<br />
dollar, which is used as the pricing<br />
currency for phosphoric acid, increased<br />
the phosphoric acid unit’s<br />
margin, though it was burdened by an<br />
extensive shutdown for repairs. Value<br />
added products made from phosphoric<br />
acid - feed phosphates and detergent<br />
phosphates - faced continuing tough<br />
competition, resulting in a higher cost<br />
in dollars of phosphoric acid. It was<br />
difficult for Industrial Chemicals to factor<br />
this increase into prices.<br />
The sodium percarbonate plant<br />
that was completed in Helsingborg,<br />
Sweden, in the previous year operated<br />
according to expectations and its<br />
ECOX product has been well received<br />
by customers. The sales outlook for<br />
KEMIRA CHEMICALS<br />
EUR million <strong>1999</strong> 1998 1997 1996 1995<br />
Net sales 697 630 582 520 472<br />
Cost of sales –558 –507 –462 –407 –371<br />
Depreciation –56 –48 –45 –42 –38<br />
Operating income 83 75 75 71 63<br />
Net financing expenses –24 –19 –17 –20 –27<br />
Income before extraordinary items 59 56 58 51 36<br />
Capital invested (average) 596 524 453 415 405<br />
Return on capital invested % 13 14 17 18 16<br />
Capital expenditure 56 126 86 72 33<br />
Personnel (average) 3,138 3,114 2,845 2,283 2,251<br />
42
Alongside pulp and paper chemicals as well as paints, one of the <strong>Kemira</strong> Group’s<br />
most important growth areas is water, spearheaded by the operations Kemwater.<br />
Pulp & Paper Chemicals and <strong>Kemira</strong> Agro have plenty of water-related synergy.<br />
Water management is one of the future cornerstones of <strong>Kemira</strong>’s operations.<br />
the product looks good over the next<br />
few years.<br />
Calcium chloride had to compete<br />
with substitute products. Calcium chloride<br />
gets its raw material from the hydrochloric<br />
acid arising in the manufacture<br />
of calcium sulphate. In <strong>1999</strong> the<br />
marketing of potassium sulphate was<br />
difficult because China was almost entirely<br />
absent from the market, and potassium<br />
sulphate production had to be<br />
curtailed. For this reason, the hydrochloric<br />
acid needed to make calcium<br />
chloride was not generated, and Industrial<br />
Chemicals had to increase its<br />
purchases of hydrochloric acid from<br />
outside suppliers.<br />
<strong>Kemira</strong> Fine Chemicals. The company’s<br />
most important area of expertise<br />
is life sciences products, which the<br />
large companies in the field use as<br />
their raw materials. Demand is growing<br />
rapidly because life sciences companies<br />
are concentrating on research<br />
and development along with marketing.<br />
GREEN CHEMISTRY GAINS GROUND<br />
<strong>Kemira</strong> Chemicals engaged in a wideranging<br />
dialogue on the company’s future<br />
guidelines and we announced our<br />
new vision: A Vision of Green Chemistry.<br />
This vision defines the priorities<br />
for our future operations. Important<br />
growth areas in the years ahead are<br />
water management, recycling and environmental<br />
chemicals. These three areas<br />
are involved in all the sectors in<br />
which <strong>Kemira</strong> Chemicals operates. In<br />
<strong>1999</strong> a Water Research Centre was set<br />
up in Oulu. Another joint research<br />
project, which will concentrate on recycling,<br />
was set in motion in Helsingborg.<br />
New information management systems<br />
have now been in use for the<br />
first year, and the feedback on them<br />
has been good. At some plants and<br />
companies, development work in this<br />
area is still going on. At present the information<br />
management programme<br />
mainly involves introducing a process<br />
organization, for which about 500<br />
<strong>Kemira</strong> Chemicals staff were trained<br />
during the year. Process organization<br />
training has been extended to reach<br />
from top management right down to<br />
the shop floor level. Concurrently, the<br />
process organization will be rounded<br />
out by deploying a core competence<br />
approach across our units.<br />
The changover to the year 2000<br />
was made without problems.<br />
Pulp & Paper Chemicals. The two<br />
hydrogen peroxide plants that were<br />
purchased in Korea and Canada a year<br />
ago were integrated into <strong>Kemira</strong><br />
Chemicals’ operations. Both companies<br />
have performed well in accordance<br />
with plans. Following these two<br />
acquisitions, <strong>Kemira</strong> is the world’s fifth<br />
largest producer of hydrogen peroxide<br />
and it operates in all the main market<br />
areas in Europe, North America and<br />
Asia.<br />
During the report year the accent<br />
in development work was on speciality<br />
chemicals for the paper industry. A<br />
decision was taken to build an extension<br />
to the AKD wax plant in Vaasa,<br />
Finland. AKD wax is used as a paper<br />
sizing. Another investment that is<br />
geared towards speciality chemicals is<br />
the building of a plant in Brazil. The<br />
company that is to be established will<br />
serve Brazil’s paper industry, making<br />
available to it <strong>Kemira</strong>’s expertise within<br />
paper sizing and other speciality<br />
chemicals.<br />
Kemwater. At Kemwater several<br />
modernization and plant extension investments<br />
that have already been started<br />
up are in progress, including an expansion<br />
of the ferrichloride business in<br />
Germany, increasing the manufacture<br />
of aluminium sulphate in the Czech<br />
Republic and a plant investment in<br />
Brazil.<br />
In <strong>1999</strong> acquisitions were largely<br />
on hold, with only one new company<br />
being purchased for the Kemwater<br />
family in addition to Solvay’s ferrichloride<br />
business in Germany: an interest<br />
HYDROGEN PEROXIDE (100%)<br />
IN WESTERN EUROPE<br />
DEM/t<br />
(Estimated averages)<br />
1994 1995 1996 1997 1998 <strong>1999</strong><br />
1600<br />
1400<br />
1200<br />
1000<br />
800<br />
600<br />
400<br />
200<br />
0<br />
Original source: Bleaching Chemicals<br />
43
in a Chinese company that manufactures<br />
polyaluminium chloride. By way<br />
of this investment we gained a foothold<br />
in the growing Chinese market<br />
for water treatment chemicals. The<br />
new company, Kemwater (Yixing) Co.<br />
Ltd will be developed in step with<br />
growth in the market.<br />
Kemwater and the City of Helsinki<br />
established a joint service company in<br />
the water treatment field. Kemwater<br />
has a 51 % stake in the company.<br />
Industrial Chemicals. The unit continued<br />
to concentrate on developing<br />
ECOX percarbonate grades and on ensuring<br />
its ability to produce this product.<br />
GROWTH HINGES ON RESEARCH<br />
AND DEVELOPMENT<br />
Research and development are the key<br />
condition for the continuing growth of<br />
<strong>Kemira</strong> Chemicals. At <strong>Kemira</strong> Chemicals,<br />
research is organized under the<br />
business units, which direct research<br />
in line with market demands. The research<br />
priority is projects run by or for<br />
Pulp & Paper Chemicals and Kemwater.<br />
Each year <strong>Kemira</strong> Chemicals<br />
spends about 2.5% of its net sales on<br />
research and development. The most<br />
important research results have centred<br />
on speciality chemicals for the paper<br />
industry and the development of<br />
pulp bleaching. At Kemwater a<br />
number of new iron-based coagulant<br />
solutions have been developed for water<br />
treatment plants. The Krepro waste<br />
water sludge recycling system was also<br />
developed further.<br />
GOOD FUTURE PROSPECTS<br />
<strong>Kemira</strong> Chemicals wants to offer total solutions to its customers in the pulp and<br />
paper industry. A part of this integrated programme is hydrogen peroxide, which<br />
is produced at <strong>Kemira</strong> Chemicals’ plants in Europe, North America and Asia.<br />
The economic outlook for 2000 is by<br />
and large positive. The rise in the degree<br />
of capacity utilization in the paper<br />
industry, which got under way late<br />
in <strong>1999</strong>, and the improvement in the<br />
demand for paper products are likely<br />
to continue on into the first part of<br />
2000.<br />
Kemwater’s markets appear stable<br />
and we believe that many of the new<br />
joint ventures that have been established<br />
in recent years will get up to<br />
speed.<br />
The market outlook for Industrial<br />
Chemicals’ products is spottier. Slight<br />
price pressures are affecting the price<br />
of phosphoric acid, but at present<br />
these are offset by the high exchange<br />
rate of the dollar against the euro. The<br />
market prospects for potassium sulphate<br />
are unstable and it is not likely<br />
that production cutbacks affecting this<br />
product can be avoided in 2000. The<br />
calcium chloride market appears stable.<br />
It is also believed that the market<br />
for feed phosphates will hold up,<br />
though detergent phosphates are facing<br />
price pressures.<br />
<strong>Kemira</strong> Chemicals will continue to<br />
develop all its units, with an accent on<br />
the development of speciality chemicals<br />
for the paper industry as well as<br />
on Kemwater’s new projects and<br />
boosting market share.<br />
<strong>Kemira</strong> Chemicals has prepared a<br />
new strategic process that seeks to<br />
generate new business and growth.<br />
The process is based on the core competence<br />
approach and on making<br />
wide-ranging use of the company’s expertise<br />
in all areas of development<br />
work. New growth will be sought in<br />
the three synergy areas that are connected<br />
with the unit’s present businesses:<br />
water chemistry expertise, recycling<br />
and environmental chemicals.<br />
<strong>Kemira</strong> Chemicals’ earnings in 2000<br />
are expected to remain good.<br />
PHOSPHORIC ACID<br />
US Gulf<br />
C&F NW<br />
Europe<br />
94 95 96 97 98 99<br />
USD/t<br />
450<br />
400<br />
350<br />
300<br />
250<br />
200<br />
150<br />
Source: Fertilizer Week<br />
44
TIKKURILA<br />
EARNINGS HIT BY THE FALL IN<br />
EASTERN EXPORTS<br />
Tikkurila had net sales in <strong>1999</strong> of EUR<br />
357 million (361 million in 1998). Operations<br />
outside Finland accounted for<br />
75% of Tikkurila’s net sales.<br />
Operating income was EUR 23 million<br />
(33 million in 1998), or 6% of net<br />
sales. Operating income was mainly<br />
reduced by the significant fall in exports<br />
to the east and outlays on new<br />
markets.<br />
MARKET SITUATION<br />
A strong market for Tikkurila Paints.<br />
The company manufactures paint<br />
products for consumers and professional<br />
painters. Its production plants<br />
are located in Finland, Estonia, Latvia,<br />
Russia, Poland and Italy. In addition,<br />
Tikkurila has sales companies in Sweden,<br />
Lithuania, Hungary and the UK.<br />
Paint sales were very good in Finland.<br />
The weather favoured house<br />
painters during the outdoor painting<br />
season. Economic activity was also at<br />
a fairly good level, leading to a pickup<br />
in building construction and in the<br />
housing market. Market share in Sweden<br />
was increased as a result of structural<br />
changes in trade channels.<br />
A number of new product releases,<br />
such as tinted interior lacquers, were<br />
well received. Benetton interior paints<br />
were brought out on the new product<br />
market and full-scale marketing of the<br />
products got started in the UK. In addition,<br />
marketing was launched in<br />
Sweden, Finland and Japan, and it is<br />
getting under way in Central Europe.<br />
Despite the crisis in Russia, St Petersburg-based<br />
ZAO Finncolor succeeded<br />
in maintaining its dealer network<br />
intact. In part, this was attributable<br />
to the expansion of the company’s<br />
own production. Russia’s economic situation<br />
has begun to improve, and<br />
there are already clear signs of a revival<br />
in trade.<br />
Tikkurila Baltcolor Sp. z o.o. in<br />
Szczecin, Poland, a company that is<br />
run jointly by Tikkurila and Baltchem,<br />
operated in accordance with plans.<br />
The Hungarian sales company Tikkurila<br />
Festék Kft. has continued its positive<br />
development. The customer network<br />
has been strengthened further and<br />
Tikkurila products have achieved a<br />
permanent foothold in Hungary.<br />
The economic crisis in Russia and<br />
its repercussions in the Baltic countries<br />
cut into the earnings of Baltic Color, the<br />
joint venture between Tikkurila Paints<br />
and Alcro-Beckers. The company has<br />
nevertheless further strengthened its<br />
leading position in the Baltic Rim.<br />
Uneven markets for Tikkurila Coatings.<br />
The company manufactures and<br />
markets paints and coatings for industry.<br />
Production plants are located in<br />
Finland, the UK, the Netherlands, and<br />
Poland. The unit has sales companies<br />
in Sweden, Ireland, Estonia, Russia<br />
and Hungary.<br />
The plant in Finland increased its<br />
sales, with the largest growth coming<br />
in products for the woodworking industry.<br />
New, water-borne products<br />
were introduced in both the metal and<br />
woodworking industry. Sales of coil<br />
coatings declined in the first months of<br />
the year owing to the weak market situation<br />
for the end product – coated<br />
thin sheet – but they picked up considerably<br />
in the latter months of the<br />
year in both the domestic and export<br />
markets.<br />
The shrinkage in the total market<br />
for the Finnish metal industry has also<br />
led to a reduced need for paints used<br />
by this industry. Exports, however, are<br />
growing, especially to Russia.<br />
The overseas subsidiaries fared reasonably<br />
well. Dickursby Färg AB in<br />
Sweden was slightly behind last year’s<br />
sales figures, primarily owing to the<br />
weak sales of coil coatings.<br />
Tikkurila Coatings has a solid position<br />
in the Baltic furniture and joinery<br />
industry. Sales to the metal industry<br />
TIKKURILA<br />
EUR million <strong>1999</strong> 1998 1997 1996 1995<br />
Net sales 357 361 349 255 237<br />
Cost of sales –316 –312 –288 –208 –202<br />
Depreciation –18 –16 –13 –10 –11<br />
Operating income 23 33 48 37 24<br />
Net financing expenses –4 –5 –4 –4 –4<br />
Income before extraordinary items 19 28 44 33 20<br />
Capital invested (average) 234 211 181 170 172<br />
Return on capital invested % 10 16 27 22 15<br />
Capital expenditure 23 23 47 25 10<br />
Personnel (average) 2,301 2,214 1,902 1,520 1,585<br />
EUR<br />
million<br />
400<br />
300<br />
200<br />
100<br />
0<br />
Raimo<br />
Piironen<br />
NET SALES<br />
Net sales<br />
Operating margin, %<br />
95 96 97 98 99<br />
CAPITAL EXPENDITURE<br />
95 96 97 98 99<br />
MANAGEMENT<br />
Tikkurila Oy<br />
President: Raimo Piironen<br />
Tikkurila Coatings Oy<br />
President: Tapio Käär<br />
Tikkurila CPS Oy<br />
President: Raimo Piironen<br />
Vice President: Vesa Aulanko<br />
Tikkurila Paints Oy<br />
President: Visa Pekkarinen<br />
Tikkurila Services Oy<br />
President: Tom Nurmi<br />
%<br />
20<br />
15<br />
10<br />
5<br />
0<br />
EUR<br />
million<br />
50<br />
NET SALES BY MARKET AREA<br />
Finland<br />
25 %<br />
Other<br />
countries<br />
12 %<br />
East Europe<br />
16 %<br />
Other EU<br />
43 %<br />
40<br />
30<br />
20<br />
10<br />
0<br />
Other West<br />
Europe<br />
4%<br />
45
oth directly and through dealers have<br />
grown considerably. Sales by the Estonian<br />
subsidiary AS Tikkurila Coatings<br />
have developed favourably and the<br />
unit has expanded its operations.<br />
The new products which the plant<br />
in Poland manufactures according to<br />
Tikkurila’s formulas now already outsell<br />
old products. The sales company<br />
in Budapest, Tikkurila Coatings Kft,<br />
strengthened its position on the Hungarian<br />
market.<br />
<strong>Kemira</strong> Color B.V., the plant in the<br />
Netherlands, performed satisfactorily.<br />
The company in the UK, <strong>Kemira</strong> Coatings<br />
Ltd, had a poor year in <strong>1999</strong>. The<br />
reasons for this are a strong pound<br />
against the other euro currencies as<br />
well as a contraction in the total market<br />
for paints used in the metal industry.<br />
The market in Ireland, however,<br />
has developed well.<br />
Tikkurila CPS has great potential.<br />
Tikkurila CPS is the world’s leading<br />
supplier of advanced tinting systems<br />
and its products are mainly delivered<br />
to the paint industry on all continents.<br />
The product range includes all the<br />
components of colour processing systems:<br />
colourants, equipment, software<br />
and tools for colour marketing.<br />
CPS produces colourants in Australia,<br />
South Africa, the Netherlands,<br />
Singapore, Finland and the United<br />
States. Corob manufactures tinting machines<br />
in India, Italy, Finland, Uruguay<br />
and the United States. CPS and Corob<br />
furthermore have sales companies in<br />
Sweden, the UK and Germany as well<br />
as service units in China and Australia.<br />
The colourant plant Tikkurila Inc. in<br />
the United States is getting up to speed,<br />
as is the tinting machine plant Corob<br />
North America Inc. Tikkurila CPS (SEA)<br />
Pte Ltd started up colourant production<br />
in Singapore in the late <strong>1999</strong>.<br />
The situation in the main market in<br />
Europe was according to expectations,<br />
but in Eastern Europe market disturbances,<br />
particularly in Russia, had<br />
somewhat of an impact on sales volumes.<br />
The market in South America<br />
and Asia was affected for most of the<br />
year by the weaker economic situation,<br />
causing growth to fall somewhat<br />
short of expectations.<br />
CPS has launched new systems in<br />
nearly all its markets, and the use of<br />
systems that are already on the market<br />
has increased. In several markets CPS<br />
has only just started ascending its<br />
growth curve.<br />
For economic reasons, the paint industry<br />
has invested cautiously in machines,<br />
and especially the introduction<br />
of new tinting systems has slowed<br />
down or been postponed. Branches of<br />
industry outside the paint industry<br />
have discovered large tinting equipment,<br />
and sales of colourants to other<br />
industrial sectors, particularly to the<br />
leather industry, have also increased<br />
substantially.<br />
OUTLAYS FOR DEVELOPING THE<br />
DOMESTIC AND EXPORT MARKETS<br />
Tikkurila seeks to be always a step<br />
ahead of others in matters related to<br />
the environment and quality. Most of<br />
its production and sales companies already<br />
have certified quality or environmental<br />
systems, or the development of<br />
such systems has been started.<br />
In Vantaa, EUR 2 million was invested<br />
in the Monicolor plant which<br />
was built in 1975 and is still one of the<br />
world’s most highly automated paint<br />
plants. The operations control system<br />
complete with software and equipment<br />
was modernized in line with future<br />
challenges. Concurrently, production<br />
capacity will increase significantly.<br />
Tikkurila Paints has continued its<br />
long-term actions to strengthen its<br />
market position in Russia, and it has<br />
started construction works on a second<br />
paint plant in Ramenskoye, to the<br />
southeast of Moscow. The project, including<br />
equipment, will have a cost of<br />
about EUR 5 million. Plans call for<br />
starting up production at OOO Kraski<br />
Tikkurila in the first half of 2000.<br />
Revamping of Temaspeed Colour<br />
Service, which was brought out on the<br />
industrial paint market at the turn of<br />
the year 1998-99, progressed according<br />
to plans. The environmentally sound<br />
Temaspeed tinting system that represents<br />
the latest technology in the field<br />
means an improvement in stock turnover<br />
and makes it easier than ever before<br />
to expand the product range by<br />
adding new products.<br />
Product development on industrial<br />
wood finishes has been advanced by<br />
investing in a highly modern testing<br />
laboratory (Customer Service Center).<br />
By means of production-scale painting<br />
line equipment, product performance<br />
can be checked in various surface<br />
treatment conditions, at the same time<br />
offering customers the possibility of<br />
testing new solutions.<br />
The Tikkurila CPS colourant plant<br />
that started up in Singapore towards<br />
the end of the year will serve the developing<br />
markets in Asia and the Indian<br />
subcontinent. In <strong>1999</strong> approval was<br />
given for investing in a new production<br />
unit that will be located in China.<br />
Tikkurila CPS has started an extensive<br />
information system project that<br />
will be instrumental in supporting the<br />
operations of its new worldwide organization.<br />
In addition, functional<br />
models and product solutions have<br />
been developed for different types of<br />
tinting systems.<br />
New machines have been developed<br />
for point-of-sale tinting. At the<br />
same time, new solutions for tinting in<br />
plants have been developed.<br />
AN INCREASE IN SKILLED PERSONNEL<br />
The Tikkurila Group had a payroll of<br />
2,282 employees at the end of <strong>1999</strong>,<br />
an increase of 100 on the previous<br />
year. The number of employees who<br />
worked in Finland was 938. The personnel’s<br />
professional skill was further<br />
developed systematically. Tikkurila<br />
employees were the first within the<br />
Finnish paint industry to obtain professional<br />
qualification in the chemical industry.<br />
THE ENVIRONMENT AND<br />
QUALITY ARE KEY AREAS FOR<br />
PRODUCT DEVELOPMENT<br />
Environmental aspects were again the<br />
motive force behind Tikkurila Paints’<br />
product development in <strong>1999</strong>. Aesthetic<br />
requirements have also been gaining<br />
prominence.<br />
A number of interior paints have<br />
M1 approval, meaning that their emissions<br />
are minimal. In the development<br />
of exterior paints, particular attention<br />
has been paid to technical quality and<br />
weather resistance.<br />
The emphasis in Tikkurila Coatings’<br />
product development has been<br />
on industrial coatings and paint systems<br />
that bring significant reductions<br />
in solvent emissions whilst improving<br />
the quality and durability of surface<br />
treatment as well as overall economy.<br />
Products developed for the metal<br />
industry include water-borne stoved<br />
enamels and air-drying dip coatings as<br />
well as so-called high-build coatings<br />
that enable customers to achieve the<br />
required film thickness and quality<br />
even with a single application. Product<br />
development within industrial wood<br />
finishes has centered particularly on<br />
water-borne and UV-cured products in<br />
cooperation with customers. A new<br />
generation PVC plastisol that has an<br />
extended lifetime was brought out on<br />
the market and the new coil coating<br />
complies with the very latest in health<br />
and environmental protection requirements.<br />
At CPS too, sales of environmentally<br />
compliant alternatives are growing<br />
continuously. Accordingly, the bulk of<br />
the resources employed in developing<br />
46
colourants goes towards these products.<br />
Customized solutions and flexibility<br />
are increasingly important aspects of<br />
the tinting business. Paint Composer, a<br />
system that enables the user to select<br />
not only the colour of paint but also<br />
its grade or other characteristics, is already<br />
available in a demo and pilot<br />
version at Tikkurila.<br />
Tikkurila’s R&D expenses amounted<br />
to 3.3% of net sales in <strong>1999</strong>.<br />
The changeover to the year 2000<br />
took place without problems.<br />
THE FUTURE PROMISES<br />
STRONG GROWTH<br />
The paint industry is one of CPS’s<br />
main client sectors. In some cases the<br />
development of both the paint and<br />
tinting business has been clearly hampered<br />
by the conflict of interest arising<br />
from this dual role. This is why <strong>Kemira</strong><br />
has decided to separate these business<br />
areas clearly apart from each other.<br />
How this is to be done will probably<br />
be worked out during the first half of<br />
2000.<br />
The worldwide reorganization of<br />
the tinting business has resulted in a<br />
more market-oriented way of working,<br />
and it is believed that this will bring<br />
positive results. In the years ahead,<br />
strong growth in sales is anticipated in<br />
North and South America as well as<br />
Asia, and the prospects in Europe too<br />
are very favourable. Because marketing<br />
inputs only begin to produce results<br />
over the medium term, CPS has<br />
made outlays on cultivating several<br />
new market areas. The current year is<br />
expected to bring strong growth that<br />
also has good potential further out.<br />
Tikkurila Paints decorative paints<br />
and Tikkurila Coatings’ industrial coatings<br />
have promising growth prospects<br />
in Eastern Europe, especially in Poland<br />
and Russia. Growth within industrial<br />
coatings is also anticipated in the Baltic<br />
countries. The Tikkurila companies<br />
are striving to reinforce further their<br />
position in their existing markets. Concurrently,<br />
Tikkurila is on the lookout<br />
for new business opportunities and<br />
new market areas.<br />
The Valassaari Lighthouse on the west<br />
coast of Finland is the work of Henri<br />
Lepaute, who designed the Eiffel Tower.<br />
Thanks to paints supplied by Tikkurila<br />
Coatings, the graceful structure that<br />
was completed in 1886 will live on for<br />
years.<br />
In the summer of 2000 the European<br />
Swimming Championships will be held<br />
at the Mäkelänrinne Swimming Hall<br />
in Helsinki. Tikkurila Coatings<br />
supplied products that were used in<br />
painting the hall’s ceiling structures,<br />
and Tikkurila Paints’ products were<br />
used on the indoor walls.<br />
47
KEMIRA AGRO<br />
EUR<br />
million<br />
1200<br />
1000<br />
800<br />
600<br />
400<br />
200<br />
0<br />
MANAGEMENT<br />
President: Risto Keränen<br />
Vice President:<br />
Rauno Valkonen<br />
Agriculture: Timo Lainto<br />
Horticulture: Hannu Virolainen<br />
Process Chemicals: R.A. Chorlton<br />
Risto<br />
Keränen<br />
NET SALES<br />
Net sales<br />
Operating margin, %<br />
95 96 97 98 99<br />
CAPITAL EXPENDITURE<br />
95 96 97 98 99<br />
NET SALES BY MARKET<br />
AREA<br />
Other<br />
countries<br />
3 %<br />
Asia<br />
8 %<br />
EU<br />
85 %<br />
Other Europe 4 %<br />
%<br />
12<br />
9<br />
6<br />
3<br />
0<br />
–3<br />
–6<br />
EUR<br />
million<br />
80<br />
60<br />
40<br />
20<br />
0<br />
LOW PRICES PUSH THE RESULT<br />
INTO THE RED<br />
<strong>Kemira</strong> Agro’s net sales remained<br />
slightly below the previous year’s level<br />
and were EUR 1,015 million (1,030<br />
million in 1998). The company reported<br />
an operating loss of EUR 39 million<br />
(operating income of 19 million in<br />
1998). The figure includes EUR 39 million<br />
of non-recurring net costs that<br />
were mainly incurred in closing the<br />
Pernis plant.<br />
CONVENTIONAL FERTILIZERS DOWN,<br />
SPECIAL PRODUCTS UP<br />
Agriculture. The sales and also the<br />
profitability posted by <strong>Kemira</strong> Agro’s<br />
largest strategic business unit declined<br />
further.<br />
The use of nutrients worldwide declined<br />
by about 2%. The weak situation<br />
of agriculture has led to a shrinkage in<br />
the demand for fertilizers, putting pressure<br />
on prices. For example, the prices<br />
of maize and soya were the lowest in a<br />
decade. In addition, there was an abundance<br />
of grain in storage.<br />
It was a difficult year for the<br />
world’s fertilizer industry. Prices fell<br />
further, by 5-15 %, particularly within<br />
nitrogen fertilizers in Western Europe<br />
and they ended at an all-time low<br />
level. China remained absent from the<br />
urea market, and this also cut into the<br />
demand for nitrogen. At the same<br />
time, new ammonia and urea capacity<br />
came on stream. The price of natural<br />
gas was very low in Russia, making<br />
production there very competitively<br />
priced.<br />
In the EU the 10% compulsory setaside<br />
acreage requirement is continuing<br />
up to 2006. The import of fertilizers<br />
to Europe has remained at the<br />
same level as in previous years, about<br />
25% of aggregate use. The use of nitrogen<br />
in Western Europe declined by<br />
slightly less than a per cent, the use of<br />
phosphorus by about 2% and the consumption<br />
of potassium by about 4%.<br />
The consumption of nutrients in Western<br />
Europe is continuing to fall at an<br />
annual rate of 0.5-1%. Concurrently,<br />
the efficiency of fertilizer use is improving.<br />
Owing to contracting markets and<br />
persistently large imports, Western Europe<br />
now has substantial overcapacity<br />
in fertilizer production. The association<br />
of European fertilizer producers,<br />
EFMA, defended Western Europe’s<br />
markets, especially against East European<br />
producers, by initiating a number<br />
of anti-dumping projects, with partial<br />
success. Towards the end of the year,<br />
plant closures and plans to close down<br />
capacity were announced. These will<br />
bring a total reduction of about 1.5<br />
million tonnes in the aggregate production<br />
volume. The calculated overcapacity<br />
in Western Europe is about 3<br />
million tonnes.<br />
After several years of holding fairly<br />
steady, the price of diammonium<br />
phosphate headed downhill in the second<br />
half of the year. The slide has<br />
nevertheless now evened out. The fall<br />
is due to new capacity in India, Australia<br />
and Morocco that is coming on<br />
to the market. The price of potassium<br />
remained stable throughout the year.<br />
The EU has set a minimum price on<br />
potassium imports, and this has<br />
helped to keep prices at a reasonable<br />
level. The market situation for potassium<br />
sulphate has nevertheless been<br />
weak, mainly owing to the lack of purchases<br />
by China, and the prevailing<br />
situation has sent prices downwards.<br />
The weak profitability of the nitrogen<br />
fertilizer business also led to major<br />
closures of capacity in the United<br />
States. <strong>Kemira</strong> Agro decided to close<br />
down the sulphuric acid, phosphoric<br />
KEMIRA AGRO<br />
EUR million <strong>1999</strong> 1998 1997 1996 1995<br />
Net sales 1,015 1,030 1,079 1,056 1,030<br />
Cost of sales –990 –954 –941 –871 –849<br />
Depreciation –64 –57 –53 –59 –71<br />
Operating income –39 19 85 126 110<br />
Net financing expenses –20 –17 –21 –23 –27<br />
Income before extraordinary items –59 2 64 103 83<br />
Capital invested (average) 663 645 602 595 652<br />
Return on capital invested % –5 5 14 21 18<br />
Capital expenditure 47 62 48 40 42<br />
Personnel (average) 2,951 3,071 3,117 3,415 3,475<br />
48
An NPK compound fertilizer plant based on a new cost-efficient process started<br />
up in Malaysia. Its products will be used in oil palm and vegetable plantations.<br />
According to <strong>Kemira</strong>’s new strategy, speciality fertilizers such as NPK are one of<br />
the operational priorities.<br />
acid, diammonium phosphate and<br />
NPK fertilizer production at the Pernis<br />
plant in the Netherlands.<br />
<strong>Kemira</strong> Agro’s overseas exports<br />
grew substantially (35%) compared<br />
with the previous year, especially<br />
thanks to the positive trend in exports<br />
to China. On the other hand, the business<br />
in the Baltic countries and Poland<br />
slumped because the use of fertilizers<br />
contracted as a consequence of the fall<br />
in food exports from these countries to<br />
Russia. The recession caused financing<br />
difficulties for retailers and wholesalers,<br />
and <strong>Kemira</strong> Agro’s previously<br />
small provisions for credit losses<br />
notched up in <strong>1999</strong>. The fertilizer market<br />
in the Baltic countries and Poland also<br />
felt the brunt of competition from Russia.<br />
The devaluation of the rouble<br />
made the export of fertilizers from Finland<br />
to Russia unprofitable. <strong>Kemira</strong><br />
Agro has launched a capital project for<br />
building a blending plant in the vicinity<br />
of Moscow in order to ensure a<br />
presence in this developing market<br />
area. The products to be put on the local<br />
market will mainly be intended for<br />
special cultivation and home gardening.<br />
Sales on the Finnish market fell by<br />
about 6%.<br />
Horticulture. <strong>Kemira</strong> Agro’s Horticulture<br />
business unit developed in line<br />
with plans. Sales grew by 28% and<br />
profitability remained good. There was<br />
growth especially in the demand for<br />
fully water-soluble fertilizers that are<br />
added to irrigation water. The price<br />
level held fairly steady throughout the<br />
year.<br />
Process Chemicals. Operations of<br />
the Process Chemicals business unit<br />
mainly comprise intermediate and end<br />
products of the nitrogen industry as<br />
well as inorganic acids. The products<br />
have enjoyed good demand, but the<br />
weak market situation for fertilizer nitrogen<br />
has been reflected clearly in the<br />
form of increased competition. Accordingly,<br />
product prices have fallen<br />
to some extent. The unit has nevertheless<br />
kept up its good profitability. The<br />
Process Chemicals business will be<br />
transferred away from <strong>Kemira</strong> Agro as<br />
part of the ownership arrangements<br />
being made in the nitrogen industry.<br />
IMPROVED PRODUCTION<br />
RELIABILITY<br />
Within production the emphasis was<br />
on improving safety, reliability, quality<br />
and cost management. Total output<br />
grew despite the closure of NPK fertilizer<br />
production at Pernis. The accident<br />
rate fell by 44% and during the<br />
second half of the year it was already<br />
at a good international level. In materials<br />
handling at the Rozenburg plant a<br />
fire broke out in the first part of the<br />
year, though its effect on deliveries<br />
was nevertheless minor. A very regrettable<br />
accident that claimed the life of<br />
one man occurred in Uusikaupunki on<br />
11 January 2000.<br />
The changeover to the year 2000<br />
took place without information technology<br />
problems.<br />
An expansion of potassium nitrate<br />
production at Fredericia and a modernization<br />
of the Uusikaupunki fertilizer<br />
line contributed to bringing the<br />
plants’ production up to good levels of<br />
output and quality during the year.<br />
HIGH AMMONIA<br />
PRODUCTION COSTS<br />
Higher oil prices raised the price of<br />
natural gas and the trend is continuing.<br />
This has an essential impact on<br />
the production costs of ammonia, particularly<br />
in continental Europe. At the<br />
same time, the average price of ammonia<br />
has been at its lowest point since<br />
NPK IN GERMANY (15–15–15)<br />
DEM/100 kg<br />
40<br />
35<br />
30<br />
25<br />
20<br />
92 93 94 95 96 97 98 99<br />
Source: Fertecon<br />
AMMONIUM NITRATE<br />
IN THE U.K.<br />
92 93 94 95 96 97 98 99<br />
GBP/t<br />
150<br />
140<br />
130<br />
120<br />
110<br />
100<br />
90<br />
80<br />
Source: Farm Brief<br />
AMMONIA<br />
FOB Black Sea port<br />
C&F NW<br />
Europe<br />
USD/t<br />
300<br />
250<br />
200<br />
150<br />
100<br />
50<br />
94 95 96 97 98 99<br />
Sorce: Fertecon<br />
49
1993. New ammonia capacity is coming<br />
on stream in Indonesia, Malaysia,<br />
Argentina and Venezuela, and this will<br />
fuel oversupply on the market. Capacity<br />
has already been closed and it is expected<br />
that more closures will be<br />
made in future.<br />
CONCENTRATING ON<br />
SPECIALITY FERTILIZERS<br />
In accordance with the new strategy<br />
that <strong>Kemira</strong> announced in October,<br />
<strong>Kemira</strong> Agro’s speciality fertilizers will<br />
be one of <strong>Kemira</strong>’s business priorities.<br />
New ownership alternatives will be<br />
sought for the nitrogen fertilizer business,<br />
which comprises about half of<br />
<strong>Kemira</strong> Agro’s present net sales.<br />
To facilitate the implementation of<br />
<strong>Kemira</strong>’s new strategy, in January 2000<br />
the <strong>Kemira</strong> Agro organization was divided<br />
into two business areas: speciality<br />
fertilizers and nitrogen fertilizers.<br />
Agriculture expands into the Far<br />
East. During the year an NPK plant<br />
based on a new cost-effective process<br />
started up in Malaysia. The plant is a<br />
joint venture with Kuok (Singapore)<br />
Limited. The construction works on<br />
the NPK plant in China were able to<br />
move ahead in the autumn when the<br />
cooperation partner’s share of the financing<br />
came through. Together with<br />
Finnfund, <strong>Kemira</strong> owns a 75% stake in<br />
this joint venture that will go into operation<br />
in the autumn of 2000.<br />
Commercialization and further development<br />
of the KEMIRA LORIS satellite-controlled<br />
precision fertilizing system<br />
was continued in the European<br />
market.<br />
In Finland <strong>Kemira</strong> Agro purchased<br />
a 20% stake in the Suomen Rehu feed<br />
business with the aim of strengthening<br />
cooperation in logistics and marketing.<br />
Horticulture strengthens its position<br />
in the Middle East. The Horticulture<br />
business is growing mainly in areas<br />
outside Europe, where its sales and<br />
marketing organization is being reinforced.<br />
Potassium nitrate production was<br />
expanded successfully in Denmark,<br />
where production will be boosted further<br />
through a new investment project<br />
that will start up in the autumn of 2000.<br />
New projects that will expand the<br />
production of fully water-soluble fertilizer<br />
components got under way in<br />
Jordan and the United Arab Emirates.<br />
In Jordan the partner in cooperation is<br />
Arab Potash Company. The plant,<br />
which will become operational in<br />
2002, will manufacture potassium nitrate<br />
and dicalcium phosphate, with<br />
sales of the latter product being handled<br />
by <strong>Kemira</strong> Chemicals. The product<br />
to be produced in the United Arab<br />
Emirates is urea phosphate, and the<br />
partner of <strong>Kemira</strong> Agro and its associated<br />
company Union <strong>Kemira</strong> is Emirates<br />
Food Company. The plant will<br />
start up in 2001.<br />
ADDITIONAL RESEARCH FUNDING<br />
Within <strong>Kemira</strong> Agro’s research effort,<br />
alongside conventional R&D activities<br />
an essential part is played by the Ventures<br />
unit which concentrates on carrying<br />
ahead longer-term research<br />
projects that have a higher risk.<br />
<strong>Kemira</strong> Agro’s business based on speciality<br />
fertilizers will call for a relatively<br />
larger research outlay in future.<br />
At present about 1% of net sales is<br />
spent on research.<br />
A POSITIVE OUTLOOK FOR<br />
SPECIALITY FERTILIZERS<br />
There is not expected to be any essential<br />
improvement in the world market<br />
for agricultural products during 2000.<br />
Recently a number of West European<br />
producers (apart from <strong>Kemira</strong>,<br />
Norsk Hydro, BASF, Fertiberia) have<br />
announced closures of plant capacity,<br />
sending prices upward. On the other<br />
hand, China is cutting down on imports<br />
of NPK fertilizers, which means<br />
that volumes are likely to be smaller<br />
than previously. China is also expected<br />
to be absent from the urea market.<br />
Nor is any change likely to take place<br />
in the sharply reduced use of fertilizers<br />
in Russia in the near future.<br />
The Horticultural fertilizer business<br />
is set to continue developing favourably.<br />
<strong>Kemira</strong> Agro’s EUR 34 million<br />
profit-boosting programme has progressed<br />
according to plans and its full<br />
impact on earnings will feed through<br />
in 2001.<br />
<strong>Kemira</strong> Agro’s strategy is to withdraw<br />
from the nitrogen fertilizer business<br />
in part or completely. This will<br />
have major implications for <strong>Kemira</strong><br />
Agro’s business orientation. Henceforth<br />
the company will concentrate on<br />
developing its speciality fertilizer business.<br />
<strong>Kemira</strong> Agro’s business based on<br />
speciality fertilizers will call for a<br />
relatively larger research outlay<br />
in future. The use of slow-release<br />
fertilizer in growing strawberries<br />
is being monitored on <strong>Kemira</strong>’s<br />
test farm.<br />
50
KEMIRA PIGMENTS<br />
EUR<br />
million<br />
500<br />
NET SALES<br />
Net sales<br />
Operating margin, %<br />
%<br />
20<br />
400<br />
15<br />
300<br />
10<br />
200<br />
5<br />
100<br />
0<br />
0<br />
95 96 97 98 99<br />
–5<br />
CAPITAL EXPENDITURE<br />
EUR<br />
million<br />
80<br />
60<br />
40<br />
20<br />
95 96 97 98 99<br />
0<br />
NET SALES BY MARKET AREA<br />
<strong>Kemira</strong> Pigments continually develops new products to meet its customers’ needs.<br />
Development work on two new grades of titanium dioxide pigment was completed<br />
and the products were presented to customers.<br />
OPERATING INCOME UP 50%<br />
<strong>Kemira</strong> Pigments had net sales of EUR<br />
488 million, an increase of 15% on the<br />
previous year (1998: EUR 423 million).<br />
The average prices of titanium dioxide<br />
pigment remained at roughly the previous<br />
year’s level, but <strong>Kemira</strong> Pigments’<br />
sales volumes grew substantially.<br />
Operating income rose by 57% and<br />
was EUR 35 million (1998: EUR 22 million).<br />
DEMAND IS GROWING SLOWLY<br />
Over the past 10 years demand for titanium<br />
dioxide pigment has nevertheless<br />
grown at the same rate as gross<br />
domestic product in the industrial<br />
countries, which are the largest users<br />
KEMIRA PIGMENTS<br />
EUR million <strong>1999</strong> 1998 1997 1996 1995<br />
Net sales 488 423 412 355 383<br />
Cost of sales –407 –357 –374 –318 –305<br />
Depreciation –46 –44 –44 –40 –35<br />
Operating income 35 22 –6 –3 43<br />
Net financing expenses –20 –19 –21 –19 –17<br />
Income before extraordinary items 15 3 –27 –22 26<br />
Capital invested (average) 403 385 400 411 392<br />
Return on capital invested % 9 6 –2 –1 11<br />
Capital expenditure 46 40 27 60 61<br />
Personnel (average) 1,752 1,794 1,851 1,939 1,971<br />
MANAGEMENT<br />
President: Frits Visser<br />
Sales & Marketing: Matti Lapinleimu<br />
Savannah plant:<br />
G.L. Roberts, III<br />
Pori plant: Jukka Lehtonen<br />
Rotterdam plant:<br />
Philip Bouman<br />
Frits<br />
Visser<br />
Other<br />
countries<br />
17 %<br />
Europe 35 %<br />
North<br />
and<br />
Central<br />
America<br />
48 %<br />
51
of TiO 2<br />
. The growth has thus been<br />
even, but fairly modest. According to<br />
estimates at the moment, worldwide<br />
consumption of TiO 2<br />
will grow over<br />
the long term by 2-3% and will scarcely<br />
rise at a faster rate later on, either. On<br />
the other hand, there can be great annual<br />
fluctuation in demand owing to<br />
the cyclical sensitivity in this industry.<br />
THE MARKET PICKS UP<br />
Demand for titanium dioxide pigments<br />
rebounded after the downhill slide a<br />
year ago. The first part of the year was<br />
slow, but towards year-end all producers,<br />
<strong>Kemira</strong> Pigments included, were<br />
hard pressed to satisfy the strong demand.<br />
This was attributable both to the<br />
trend in the TiO 2<br />
cycle itself and also to<br />
the fact that the main customers, i.e.<br />
the paint, plastics and paper industry,<br />
topped up their stocks to be prepared<br />
for the millennium changeover.<br />
Although the TiO 2<br />
industry has become<br />
increasingly global, the markets<br />
nevertheless behave in different ways<br />
in different parts of the world. In North<br />
America there was good demand<br />
throughout the year, and in Asia demand<br />
improved markedly towards the<br />
end of the year, whereas the Latin<br />
American market was flat.<br />
Price increases were carried out in<br />
all the markets. The rises started off in<br />
Asia in the summer, with Europe following<br />
suit in the autumn and last of<br />
all, at the beginning of 2000, prices in<br />
the United States headed upwards. In<br />
Latin America too prices are rising,<br />
though slowly.<br />
TITANIUM DIOXIDE PIGMENT<br />
C&F NW Europe<br />
DEM/<br />
kg<br />
4,0<br />
3,0<br />
2,0<br />
1,0<br />
CONSOLIDATION IN THE INDUSTRY<br />
Consolidation is moving ahead in the<br />
titanium dioxide industry. In the autumn<br />
the <strong>Kemira</strong> Group announced its<br />
change in strategy, according to which<br />
the <strong>Kemira</strong> Pigments business no longer<br />
belongs to the Group’s core business<br />
areas. Ownership arrangements concerning<br />
the <strong>Kemira</strong> Pigments business<br />
are in progress, and it is believed that<br />
they will be carried out during 2000.<br />
A major acquisition was made in<br />
the industry during the report year<br />
when the world’s third largest producer<br />
- Tioxide - was ultimately sold to<br />
Huntsman Chemicals.<br />
BOOSTING PRODUCTION EFFICIENCY<br />
The structural transformation projects<br />
under way at all sites moved ahead according<br />
to plans. The objective of the<br />
projects is to cut annual costs by a total<br />
of EUR 44 million by the start of 2001<br />
at the latest. The Pori plant will account<br />
for about EUR 17 million of this<br />
figure. The efficiency boosting programme<br />
at Pori has already been largely<br />
completed.<br />
Debottlenecking at the Pori plant<br />
was completed in December, raising<br />
the plant’s production capacity to<br />
120,000 tonnes a year.<br />
Because sales of speciality products<br />
have developed favourably, additional<br />
investments have been made in the<br />
UV-Titan business. Even though speciality<br />
product capacity at the Pori plant<br />
is currently being doubled, it was decided<br />
to expand it further. The extension<br />
works have progressed smoothly,<br />
and the new capacity will come on<br />
stream in the latter half of 2000. The<br />
expansion of FinnTi production was<br />
completed during the report year.<br />
NEW PRODUCTS UNDER<br />
DEVELOPMENT<br />
Worldwide and local product development<br />
programmes continued. Development<br />
work on two new grades of titanium<br />
dioxide pigment were completed<br />
and the products were introduced to<br />
customers. The products are a multipurpose,<br />
high-gloss and high-durability<br />
KEMIRA 635 pigment which the Rotterdam<br />
plant manufactures for the paint<br />
industry and KEMIRA UDA Prime anatase<br />
slurry, which is produced by the<br />
Savannah plant for the paper industry.<br />
New products that are marketed to<br />
the plastics and laminate paper industry<br />
and came on to the market in the previous<br />
year strengthened their position<br />
on this market.<br />
The division pushed ahead with development<br />
work on pigmentary and<br />
transparent titanium dioxide grades,<br />
which are intended for uses in the plastics<br />
industry. In addition to plastic<br />
grades, the Speciality Products unit<br />
concentrated on microfine transparent<br />
titanium dioxide products that are used<br />
in paints and cosmetics. Development<br />
work was also done on titanium chemicals.<br />
Test methods that are used in quality<br />
control were harmonized at all three<br />
production plants, promoting the communication<br />
of more uniform information<br />
to customers and further ensuring<br />
product quality.<br />
Introduction of an SAP R/3 system<br />
went smoothly at all the <strong>Kemira</strong> Pigments<br />
units, both at plants and in the<br />
sales offices, during <strong>1999</strong>. The changeover<br />
to the year 2000 went without any<br />
problems.<br />
POSITIVE EXPECTATIONS FOR 2000<br />
Sales of titanium dioxide pigment got<br />
off to a brisk start during the current<br />
year. In spite of the US producers’<br />
stocks being larger than normally, fullyear<br />
expectations for 2000 are positive.<br />
The TiO 2<br />
cycle is still in an upswing<br />
and the market is expected to remain<br />
good.<br />
94 95 96 97 98 99<br />
0<br />
Source: ICIS–LOR Group Ltd.<br />
TITANIUM DIOXIDE PIGMENT<br />
ILMENITE<br />
AUD/t<br />
170<br />
RUTILE<br />
USD/t<br />
700<br />
USA Asia<br />
US cts/<br />
pound<br />
120<br />
100<br />
80<br />
60<br />
40<br />
20<br />
0<br />
94 95 96 97 98 99<br />
150<br />
600<br />
130<br />
500<br />
110<br />
400<br />
90<br />
300<br />
94 95 96 97 98 99<br />
70<br />
94 95 96 97 98 99<br />
200<br />
Source: ICIS–LOR Group Ltd.<br />
Source: Industrial Minerals<br />
Source: Industrial Minerals<br />
52
KEMIRA<br />
METALKAT<br />
<strong>Kemira</strong> Metalkat’s favourable trend in<br />
operations continued in <strong>1999</strong> and we<br />
posted the best result in our history. Both<br />
net sales and operating income came in<br />
ahead of budget. Net sales<br />
grew by 19% to EUR 36<br />
million (30 million in<br />
1998). Operating income<br />
was EUR 3.1 million (1.7<br />
million in 1998).<br />
Net sales during the<br />
past year consisted mainly<br />
of deliveries of catalytic<br />
converters to the European<br />
automotive industry.<br />
The long-awaited market<br />
for small combustion engines<br />
got under way and<br />
significant sales volumes<br />
are expected within a<br />
couple of years.<br />
Metalkat’s product range is extensive<br />
and series sizes vary greatly. For this reason,<br />
during the report year we paid particular<br />
attention to costs and the efficiency<br />
of manufacturing and operations.<br />
Customer wishes were a special focus<br />
of product development. Catalytic<br />
converter systems were jointly developed<br />
to meet the requirements of increasingly<br />
tougher emission norms. Several<br />
approvals of catalytic converters for<br />
small combustion engines were obtained<br />
from the authorities.<br />
EUR 1.3 million was spent on capital<br />
projects. The investments were aimed at<br />
improving and ensuring high-calibre operations<br />
and quality in all subareas.<br />
Net sales and earnings in 2000 will<br />
fall because certain car models for which<br />
we are supplying equipment will be removed<br />
from production, and new deliveries<br />
of the same size will not yet start<br />
up during the current year.<br />
The development of the emission-control<br />
systems of the future in close cooperation<br />
with customers is one of <strong>Kemira</strong><br />
Metalkat’s key areas. The photograph<br />
shows a Maserati being tested at the<br />
Metalkat engine laboratory.<br />
KEMIRA SAFETY<br />
<strong>Kemira</strong> Safety’s result was satisfactory.<br />
Net sales were EUR 14.2 million (14.4<br />
million in 1998) and operating income<br />
was EUR 0.9 million (1.3 million in<br />
1998).<br />
Military protective masks accounted<br />
for a smaller share of net sales, 6% as<br />
against 15% a year earlier. By contrast,<br />
net sales generated by respiratory protective<br />
devices for industrial use and<br />
other occupational safety applications<br />
continued their growth in all three product<br />
groups: masks, filters and powered<br />
respiratory protectors.<br />
Thanks to product development and<br />
improvements in product safety, our<br />
sales increased in all the main market areas:<br />
Western Europe, Scandinavia and<br />
Finland. Large outlays on product development<br />
and marketing, coupled with the<br />
fast pace of capital expenditures on new<br />
products and production equipment<br />
nevertheless cut into our earnings in<br />
<strong>1999</strong>.<br />
We brought out on the market Proflow2,<br />
a new battery-powered motorized<br />
respiratory protector, and a new generation<br />
industrial protective mask – Promask.<br />
Both products won the unreserved<br />
approval of their users and a<br />
good position was established on the<br />
market. All three product groups now<br />
have strong core products: Promask<br />
within protective masks, the Pro2000 series<br />
within filters and the Proflow family<br />
within motorized respiratory protectors.<br />
Capital investments went for raising production<br />
capacity, new products and information<br />
technology.<br />
We will be able to increase our market<br />
share in the current year, too. Net<br />
sales are expected to grow strongly in<br />
the main market area. We achieved an<br />
important foothold in the nuclear power<br />
industry in Great Britain, and we believe<br />
<strong>Kemira</strong> Safety brought out on the<br />
market a new powered respiratory<br />
protector named Proflow2, as well as<br />
Promask, a new generation industrial<br />
protective mask. These products will<br />
contribute to strengthening the<br />
company’s position as a European<br />
manufacturer of respiratory protective<br />
devices.<br />
that this will strengthen <strong>Kemira</strong> Safety’s<br />
position as a European manufacturer of<br />
respiratory protective devices. In addition,<br />
we got off to a good start in the<br />
United States and Australia. This further<br />
boosts our growth potential. Earnings<br />
are expected to improve.<br />
KEMIRA OYJ<br />
<strong>Kemira</strong> Oyj comprises Group management<br />
and administration as well as<br />
certain service functions. <strong>Kemira</strong> Oyj’s<br />
net sales consist of the sale of electricity<br />
to the Group’s companies in Finland<br />
and to outside companies. Net sales<br />
for <strong>1999</strong> were EUR 27 million (EUR 32<br />
million), of which 52% came from outside<br />
the Group.<br />
The parent company’s paramount<br />
task is the Group’s strategic management.<br />
It sets objectives for the Group<br />
and the subsidiaries, defines operating<br />
principles and contributes to exploiting<br />
the Group’s internal synergies. In<br />
addition to the energy business, the<br />
parent company handles the Group’s<br />
financing and certain other headquarters<br />
service functions.<br />
<strong>Kemira</strong> Oyj employed 132 (133)<br />
people in the average.<br />
53
KEMIRA GROUP ENVIRONMENTAL REPORT <strong>1999</strong><br />
INTRODUCTION AND PURPOSE<br />
This report is the seventh consecutive<br />
annual environmental report by<br />
<strong>Kemira</strong> in the 90s. The structure of the<br />
reports has not changed, while the<br />
content has been gradually developed<br />
in accordance with the relevant European<br />
reporting guidelines 1,2 . In addition<br />
to this regular annual disclosure,<br />
<strong>Kemira</strong> issued a comprehensive standalone<br />
Product Stewardship report in<br />
<strong>1999</strong>.<br />
The environmental report deals<br />
with <strong>Kemira</strong> Group companies in line<br />
with the consolidation policy adopted<br />
in financial reporting.<br />
SUMMARY<br />
The overall situation in environmental<br />
protection did not change substantially<br />
at the production sites. Most releases<br />
into water declined slightly from the<br />
previous year, while those into the air<br />
showed both minor increases and decreases.<br />
Hazardous waste generation<br />
increased due to one-time remediation<br />
activities and growth in fine chemicals<br />
production.<br />
Major environmental investment<br />
projects were not conducted or initiated.<br />
Thus, the capital expenditures on<br />
environmental protection declined by<br />
about 16% from the previous year.<br />
This was counterbalanced by 8%<br />
growth in environmental operating<br />
costs.<br />
The environmental business continued<br />
on a steady growth curve. Sales of<br />
environment and safety-related products<br />
totaled EUR 313 million (EUR 264<br />
million in 1998).<br />
The year was not fully satisfactory<br />
in respect of safety. The number of<br />
significant environmental spills and industrial<br />
accidents increased. In occupational<br />
safety, the number of losttime<br />
incidents was reduced to all-time<br />
low levels, particularly in <strong>Kemira</strong> Agro.<br />
However, one employee died in an accident<br />
at the Uusikaupunki plant in<br />
Finland in January, 2000.<br />
Many sites obtained ISO 14001 certificates<br />
or were actively developing<br />
environmental management systems.<br />
<strong>Kemira</strong> was accepted as a component<br />
of the newly launched worldwide<br />
Dow Jones Sustainability Group Index.<br />
In Finland, <strong>Kemira</strong> again earned an<br />
award for good annual environmental<br />
reporting.<br />
ENVIRONMENTAL STRATEGY<br />
<strong>Kemira</strong> published in October a new<br />
strategy, which is expected to have<br />
positive consequences also for the environmental<br />
protection and sustainable<br />
development activities within the<br />
Group. With the planned divestment<br />
of the nitrogen fertilizer and titanium<br />
dioxide businesses, the portfolio of the<br />
Group is becoming environmentally<br />
lighter. In practice, it is anticipated that<br />
most of the Groups’ environmental releases<br />
into the air and water will decrease<br />
significantly. A substantial reduction<br />
is also expected to take place<br />
in energy intensity and greenhouse gas<br />
releases, as well as in environmental<br />
costs. Actual changes will depend on<br />
the extent of realization of the planned<br />
reorganization, as well as on the precise<br />
nature of the projected business<br />
growth.<br />
Furthermore, the strategic reorientation<br />
emphasizes growth in the environmental<br />
businesses. For example,<br />
clean water has been selected as one<br />
of the growth components. The strategy<br />
and core values of <strong>Kemira</strong> Chemicals,<br />
one of the growth companies,<br />
were also sharpened along these environment-driven<br />
lines.<br />
ENVIRONMENTAL POLICY AND<br />
MANAGEMENT SYSTEMS<br />
Much of the progress continued to<br />
centre on developing ISO 14001 environmental<br />
management systems.<br />
Within <strong>Kemira</strong> Chemicals, the Pulp<br />
& Paper business unit obtained ISO<br />
14001 certificate covering its operations<br />
in Helsingborg. Certification of<br />
Industrial Chemicals is expected in<br />
2000 at the same site. The hydrogen<br />
peroxide plant at Ulsan, South Korea,<br />
also got final approval for its plantspecific<br />
ISO 14001.<br />
In the Kemwater business unit the<br />
Flix plant of <strong>Kemira</strong> Ibérica S.A. in<br />
Spain received EMAS and ISO 14001<br />
1<br />
CEFIC (European Chemical Industry Council): Health, Safety and Environmental <strong>Report</strong>ing Guidelines. November 1998.<br />
2<br />
”Communication on the Interpretation of Certain Articles in the Fourth and Seventh Accounting directives.” European Commission, 98/C 16/04.<br />
Figure 1 Figure 2 Figure 3<br />
ENVIRONMENTAL LOAD<br />
AND NET SALES<br />
Net sales index<br />
Environmental index<br />
%<br />
120<br />
ENERGY CONSUMPTION<br />
DIVIDED BY NET SALES<br />
toe/EUR million<br />
1000<br />
900<br />
800<br />
700<br />
600<br />
500<br />
400<br />
300<br />
200<br />
100<br />
0<br />
GREENHOUSE GAS EMISSIONS<br />
N2O<br />
CO2<br />
1000 tonnes CO 2 eq.<br />
8000<br />
100<br />
80<br />
7000<br />
6000<br />
5000<br />
60<br />
4000<br />
40<br />
20<br />
3000<br />
2000<br />
1000<br />
90 91 92 93 94 95 96 97 98 99<br />
The environment index consists of<br />
seven different releases and of nonhazardous<br />
waste.<br />
0<br />
1995<br />
1996 1997 1998 <strong>1999</strong><br />
1995 1996 1997 1998 <strong>1999</strong><br />
0<br />
54
certificates. The Lauterbourg plant in<br />
France is preparing for certification in<br />
2000. The Prerov plant in the Czech<br />
Republic obtained endorsement for the<br />
Responsible Care programme.<br />
At the Siilinjärvi plants in Finland, a<br />
safety assessment was conducted according<br />
to the ISRS (International Safety<br />
Rating) system. The Oulu plant continued<br />
to incorporate ISO 14001 into<br />
the overall management system.<br />
<strong>Kemira</strong> Pigments reached the voluntary<br />
targets set in the EMS system of<br />
the Pori plant in Finland. The plant<br />
also passed a safety audit according to<br />
the Seveso II directive and started application<br />
of the safety management<br />
system. At <strong>Kemira</strong> Pigments B.V., Rotterdam,<br />
the Netherlands, authority approval<br />
was obtained for the company<br />
environmental plan and a safety programme<br />
was started with the aim of<br />
fulfilling the national implementation<br />
of the Seveso II directive.<br />
<strong>Kemira</strong> Agro started developing<br />
ISO 14001 for all major fertilizer plants<br />
in Europe. The Tertre plant in Belgium<br />
expects to be certified in 2000 and the<br />
Rozenburg plant in the Netherlands<br />
started a similar development effort.<br />
ENVIRONMENT PROTECTION AT<br />
THE PRODUCTION PLANTS<br />
<strong>Kemira</strong> Chemicals. <strong>Kemira</strong> Kemi AB,<br />
Helsingborg, Sweden, successfully investigated<br />
possibilities for reducing<br />
waste to landfills. A permit was obtained<br />
for using significant amounts of<br />
waste and by-products as alternative<br />
raw materials. Permits to expand hydrochloric<br />
acid production were also<br />
issued. The planned expansion includes<br />
the construction of a new treatment<br />
plant for reducing the HCl emissions.<br />
The Ulsan hydrogen peroxide plant<br />
in South Korea reduced energy and<br />
solvent consumption substantially by<br />
changing operational conditions. The<br />
Maitland plant in Canada completed a<br />
VOC survey and an environmental risk<br />
assessment, and it obtained a waste<br />
generation permit. Steam is now purchased<br />
from a neighbouring company,<br />
which is also responsible for associated<br />
emissions.<br />
The Kemwater business unit reduced<br />
waste at Kvarntorp, Sweden, by<br />
starting the recycling of acidic sludge<br />
filtrate. The total recycling of aluminium<br />
hydrate allowed the Police plant in<br />
Poland to reach zero process waste<br />
disposal. The Rozenburg plant in the<br />
Netherlands also minimized waste by<br />
increasing its filtration capacity. The<br />
Fredrikstad plant in Norway renewed<br />
chlorine detectors. The Prerov plant in<br />
the Czech Republic obtained permits<br />
to double capacity and improved safety<br />
control.<br />
<strong>Kemira</strong> Chemicals B.V., Rozenburg,<br />
completed five environmental improvement<br />
projects mainly to reduce<br />
VOC, noise and waste. A new chemical<br />
storage was also built.<br />
The Oulu plants in Finland made<br />
improvements in odour and noise control<br />
as well as in safety equipment. Recycling<br />
of aluminum oxide and further<br />
processing of soot were investigated.<br />
The plant also obtained a waste management<br />
permit and submitted an application<br />
for a renewal of the waste<br />
water permit.<br />
At the Siilinjärvi plants and mine in<br />
Finland, the extensive renovation of<br />
phosphoric acid and energy production<br />
facilities improved environmental<br />
and safety controls. Air and water releases<br />
remained very low, and enhanced<br />
water recycling diminished nitrogen<br />
discharges below target values.<br />
The plant also obtained a renewed<br />
waste water permit and an important<br />
new waste management permit. The<br />
latter, even if still not final, may impose<br />
new requirements for the rehabilitation<br />
of the piling and storage of areas<br />
for by-products and waste.<br />
The Kokkola plant completed demolition<br />
of an old sulphuric acid unit,<br />
and removed 10,400 m 3 of surface soil<br />
that was contaminated with mercury<br />
for final off-site disposal. In addition, a<br />
soil and ground water survey of heavy<br />
metals was conducted on the whole<br />
site without significant new findings.<br />
Sulphur emissions increased by one<br />
third due to temporary heat exchanger<br />
problems at the sulphuric acid plant.<br />
<strong>Kemira</strong> Pigments. <strong>Kemira</strong> Pigments<br />
Inc., Savannah, made numerous modifications<br />
to prevent low pH excursions<br />
Figure 4 Figure 5 Figure 6<br />
SULPHUR EMISSIONS<br />
HEAVY METAL DISCHARGES<br />
NITROGEN DISCHARGES<br />
Other countries<br />
Finland<br />
Tonnes<br />
45000<br />
Tonnes<br />
50<br />
Other countries<br />
Finland<br />
Tonnes<br />
3000<br />
40000<br />
35000<br />
40<br />
2500<br />
30000<br />
25000<br />
20000<br />
15000<br />
30<br />
20<br />
2000<br />
1500<br />
1000<br />
10000<br />
5000<br />
10<br />
500<br />
80 90 91 92 93 94 95 96 97 98 99<br />
All sulphur compounds calculated as SO 2 .<br />
0<br />
90 91 92 93 94 95 96 97 98 99<br />
Sum of five different heavy metals,<br />
mostly chromium.<br />
0<br />
90 91 92 93 94 95 96 97 98 99<br />
0<br />
55
in plant ditches. Crossflow oxidation<br />
scrubbers were upgraded to improve<br />
chlorine control. An extensive soil and<br />
ground water survey on the site did<br />
not reveal significant reportable contamination.<br />
The authorities issued two<br />
consent orders and proposed two others,<br />
mainly dealing with occasional releases<br />
into the air.<br />
The Pori plant managed to keep<br />
low levels in all releases after the major<br />
investment projects reported in<br />
previous years. The renewal programmes<br />
of digester gas scrubbing<br />
systems and jet mill dust separation<br />
were completed. Some difficulties<br />
were encountered in complying with<br />
the strict limit on NO x<br />
in power plant<br />
releases, requiring more efficient operational<br />
control. A project for building a<br />
new gypsum landfill was started. An<br />
important waste management permit<br />
was also obtained, mainly putting the<br />
EU landfill regulations in place for the<br />
piling and future rehabilitation of<br />
waste and by-products at the site.<br />
Sales of by-products remained at a<br />
high level thanks to the efforts of a<br />
new business unit.<br />
<strong>Kemira</strong> Agro. At the Uusikaupunki<br />
plants, nitrogen discharges diminished<br />
because of closer spillage control. An<br />
estimated amount of 5 tonnes of phosphorus<br />
leaked accidentally into the sea<br />
from a broken phosphoric acid loading<br />
line in February.<br />
The Harjavalta plant in Finland further<br />
improved water recycling in its<br />
methylene urea production and reduced<br />
packaging waste. The plant also<br />
decided to take part in an extensive<br />
ground water management programme<br />
with the authorities, the city and other<br />
local industry.<br />
The Fredericia plant in Denmark<br />
improved energy efficiency and investigated<br />
nitrous oxide emissions from<br />
its nitric acid production. <strong>Kemira</strong> S.A./<br />
N.V. stopped production at the smaller<br />
sites in Longlier and Sombreffe in Belgium.<br />
The Tertre plant obtained a new<br />
waste water permit for the entire site<br />
and the company continued with soil<br />
and ground water investigations at<br />
both Tertre and Willebroek.<br />
<strong>Kemira</strong> Agro decided to stop production<br />
at the Pernis site in the Netherlands,<br />
partly due to difficulties in<br />
meeting forthcoming environmental<br />
requirements in a profitable manner.<br />
Pending that, the plant continued with<br />
investigations and pilot-tests of gypsum<br />
re-use (Pro-Gips) and made preliminary<br />
surveys for reducing dust<br />
emissions and nitrogen discharges.<br />
<strong>Kemira</strong> Agro Rozenburg B.V. installed<br />
low-NO x<br />
burners in its boilers<br />
to reduce NO x<br />
-emissions by about<br />
50%. The plant had two environmental<br />
incidents leading to major spills of nitrogen<br />
into the water, and complaints<br />
were made of heavy smoke caused by<br />
the fire.<br />
In the UK, the Ince plant investigated<br />
possiblities to reduce air emissions<br />
from the NPK plant and NO x<br />
from the ammonia production. The<br />
Environment Agency issued tighter<br />
limits for NO x<br />
from nitric acid production<br />
as well as for ammonia discharges<br />
into surface water. The bunding of<br />
storage tanks was scheduled to the<br />
end of 2001.<br />
Tikkurila. VOC emissions from<br />
Tikkurila’s production continued to<br />
decrease in <strong>1999</strong>. One objective of the<br />
modernization of the plant automation<br />
at the Tikkurila Paints plants in Vantaa,<br />
Finland and Szczecin, Poland was to<br />
reduce environmental releases. Similar<br />
improvements were made by Tikkurila<br />
Coatings at Bury in the UK.<br />
PRODUCT DEVELOPMENT AND<br />
ENVIRONMENTAL BUSINESS<br />
For a comprehensive discussion of this<br />
topic, the reader is referred to our specific<br />
report entitled ‘Products and the<br />
Environment’.<br />
Sales of environment- and safety-related<br />
products and services totalled EUR<br />
313 million in <strong>1999</strong> (see Figure 12).<br />
Growth accelerated to 19% thanks to a<br />
step-up in chlorine-free bleaching<br />
agents, water treatment chemicals and<br />
environmental equipment. Environmentdriven<br />
businesses now account for more<br />
than 12% of the Group’s net sales.<br />
Market growth, price development<br />
and the first full year of consolidation<br />
Figure 7 Figure 8 Figure 9<br />
LOST TIME INCIDENTS<br />
30<br />
25<br />
NON-HAZARDOUS WASTE<br />
Other countries<br />
Finland<br />
By-product/waste*, Finland<br />
1000<br />
tonnes<br />
2500<br />
2000<br />
HAZARDOUS WASTE<br />
TREATMENT<br />
On-site<br />
Off-site<br />
Incineration<br />
Final disposal<br />
Tonnes<br />
25000<br />
20000<br />
20<br />
1500<br />
15000<br />
15<br />
10<br />
5<br />
0<br />
95 96 97 98 99 90 91 92 93 94 95 96 97 98 99<br />
Number of incidents per million<br />
working hours.<br />
* Comprises three major material streams, which<br />
are piled on site in Finland. The classification<br />
of these as waste is a matter of interpretation.<br />
1000<br />
500<br />
0<br />
Recycling<br />
Other<br />
treatment<br />
On-site incineration is not reported<br />
in the data table as waste which is<br />
finally disposed of.<br />
10000<br />
5000<br />
0<br />
56
of the two newly acquired plants<br />
boosted the sales of hydrogen peroxide<br />
by <strong>Kemira</strong> Chemicals by as much<br />
as 75%. The Kemwater business unit<br />
continued its solid growth, with sales<br />
up 10% on the previous year, mainly<br />
by building new production facilities<br />
and strengthening the existing markets<br />
around the world. Recycling and use<br />
of secondary raw materials (the Green<br />
Concept) was intensified. The first fullscale<br />
municipal sludge recovery and<br />
treatment process (Krepro) will be<br />
built by Kemwater for the city of<br />
Malmö, Sweden.<br />
Strong growth also continued in<br />
the environmental equipment businesses<br />
of <strong>Kemira</strong> Metalkat and <strong>Kemira</strong><br />
Safety. Sales of catalytic converters and<br />
personal protection devices rose by<br />
15-20%.<br />
Sales of co-products and products<br />
developed from waste decreased by<br />
about 10%. On the other hand <strong>Kemira</strong><br />
Agro Horticulture advanced substantially<br />
the sales of biocontrol products<br />
and organo-mineral fertilizers.<br />
Tikkurila Paints concentrated on<br />
expanding the market for indoor<br />
paints that are free of solvents as well<br />
as alkylphenoletoxylates. Tikkurila<br />
Coatings focused on industrial coatings<br />
and coating systems which can substantially<br />
reduce solvent emissions in<br />
painting while at the same time improving<br />
durability, quality and the<br />
overall economy of the final applications.<br />
Customers are increasingly<br />
adopting this approach to comply with<br />
the EU’s VOC-directive.<br />
DATA 3 ON ENVIRONMENTAL<br />
RELEASES, WASTE, ENERGY<br />
AND SAFETY<br />
The overall production volumes were<br />
practically the same as in 1998. Three<br />
newly acquired, medium-sized sites<br />
were included in the reporting system<br />
for the first time. However, most of the<br />
reported environmental indicators here<br />
can reasonably well be compared to<br />
the figures for the previous year.<br />
Not unexpectedly, total energy<br />
consumption remained at the same<br />
level as in 1998. However, the Group’s<br />
eco-efficiency, measured in terms of<br />
energy use per net sales, improved by<br />
4 percentage points.<br />
Releases of sulphur compounds,<br />
nitrogen oxides and dust into the air<br />
increased slightly after sharing a continuous<br />
downward trend in the 1990s.<br />
The same was true for carbon dioxide,<br />
but these increases were not significant.<br />
Volatile inorganic emissions decreased<br />
to an all-time low due to improved<br />
gas scrubbing within <strong>Kemira</strong><br />
Agro. Volatile organic compounds also<br />
diminished further, thanks to Tikkurila’s<br />
production efforts.<br />
Waste water volumes and releases<br />
were somewhat lower than in 1998.<br />
This was especially true for nitrogen<br />
and the sum of most toxic heavy metals,<br />
which was halved. Discharges of<br />
phosphorus were up slightly, mainly<br />
originating from production at <strong>Kemira</strong><br />
Agro Pernis. The closure of this site<br />
will be reflected in significantly reduced<br />
Group totals for phosphorus,<br />
suspended solids and certain heavy<br />
metals in 2000.<br />
Non-hazardous waste generation<br />
remained static. By-products of the<br />
two key sites in Finland diminished<br />
mainly due to water mass balance differences,<br />
as waste figures are given on<br />
a wet basis. Deliveries of hazardous<br />
waste for external final disposal and<br />
incineration increased substantially.<br />
This is largely explained by a one-time<br />
removal of contaminated soil from the<br />
Kokkola site in Finland and the<br />
growth in <strong>Kemira</strong> Fine Chemicals’ production.<br />
The environment index in Figure 1<br />
summarizes the developments explained<br />
above. The value of the index<br />
is practically the same as in 1998,<br />
while the business volume is almost<br />
5% higher. The environmental performance<br />
of the Group improved by<br />
more than one half during the 1990s,<br />
and this trend is expected to continue<br />
due to the announced changes in the<br />
business portfolio.<br />
3<br />
The data in this report have been compiled from statistics from many sites and sources. Whilst every effort has been made to ensure that the<br />
information is neither incomplete nor misleading, it cannot be considered as reliable as the financial data published in the <strong>Annual</strong> <strong>Report</strong>.<br />
Figure 10 Figure 11 Figure 12<br />
ENVIRONMENTAL CAPITAL<br />
SPENDING AND OPERATING COSTS<br />
Operating costs<br />
Capital spending<br />
EUR million<br />
60<br />
50<br />
40<br />
30<br />
20<br />
10<br />
GROWTH OF<br />
ENVIRONMENTAL BUSINESS<br />
EUR million<br />
350<br />
300<br />
250<br />
200<br />
150<br />
100<br />
50<br />
SALES OF ENVIRONMENT AND<br />
SAFETY RELATED PRODUCTS IN <strong>1999</strong><br />
Eco-products<br />
Waste recycling<br />
1 %<br />
5 %<br />
Equipment 15 %<br />
Environmental<br />
chemicals 80 %<br />
90 91 92 93 94 95 96 97 98 99<br />
0<br />
93 94 95 96 97 98 99<br />
0<br />
Total ca<br />
EUR 313 million<br />
57
ENVIRONMENTAL INVESTMENTS<br />
AND OPERATING COSTS<br />
The Group’s capital expenditures on<br />
environmental projects declined by<br />
about 16%, to EUR 13 million (Figure<br />
10) or about 7.5% of all investments.<br />
Environmental operating costs rose<br />
by approximately 8% to an all-time<br />
high of EUR 53 million. The increase<br />
was the most pronounced in the titanium<br />
dioxide and fertilizer businesses.<br />
Environmental costs totaled EUR 65<br />
million, with practically no change<br />
from the previous year. These costs<br />
correspond to 2.6% of Group net sales,<br />
on a par with the previous year. As the<br />
announced change in the Group’s<br />
business portfolio will progress, these<br />
costs are expected to decrease further.<br />
ENVIRONMENTAL RISKS,<br />
LIABILITIES AND LEGAL ISSUES<br />
Compliance and permits. Overall compliance<br />
with site-level permit conditions<br />
was satisfactory in <strong>1999</strong>. A noncompliance<br />
situation was observed at<br />
four sites. The authorities have been<br />
informed and corrective action has<br />
been taken.<br />
<strong>Kemira</strong> Pigments Inc., Savannah,<br />
received two final Consent orders regarding<br />
environmental issues as well<br />
as two proposals for such orders by<br />
Georgia Environmental Protection Division.<br />
One of the proposed orders,<br />
regarding a failed calciner stack test,<br />
was finalized in January, 2000.<br />
New environmental permits or renewals<br />
of existing ones were again issued<br />
to many of the reporting sites, often<br />
spelling out tighter limits for specific<br />
releases.<br />
The waste management permits issued<br />
to the Pori and Siilinjärvi plants<br />
in Finland contained significant requirements<br />
concerning future measures<br />
in the piling and rehabilitation of<br />
by-products and waste at the two sites.<br />
However, there were no conditions<br />
causing significant immediate action,<br />
and the Siilinjärvi permit is subject to<br />
an appeal in the Highest Administrative<br />
Court. The outcome of these cases<br />
cannot yet be fully predicted. At<br />
<strong>Kemira</strong> Agro Pernis, the plant closure<br />
has stopped all permit procedures,<br />
which were expected to have adverse<br />
effects on that particular business.<br />
No significant difficulties were encountered<br />
in obtaining the necessary<br />
environmental permits to expand or to<br />
continue industrial operations.<br />
Accidents, occasional releases and<br />
environmental impacts. The number of<br />
industrial accidents and environmental<br />
incidents reported by the sites increased<br />
from the previous year. The<br />
following cases caused local environmental<br />
impacts or concern:<br />
– February: A broken loading line in<br />
the harbour of the <strong>Kemira</strong> Agro<br />
Uusikaupunki plant in Finland<br />
caused leakage of 5 tonnes of phophorus<br />
in the form of acid. This may<br />
increase eutrophication of the sea<br />
water close to the plant.<br />
– April: A fire broke out in the fertilizer<br />
storage building of <strong>Kemira</strong> Agro<br />
Rozenburg, the Netherlands, causing<br />
property damage, heavy smoke formation<br />
and a spill of about 7 tonnes<br />
of calcium ammonium nitrate compounds<br />
into the river.<br />
– September: Approximately 6 tonnes<br />
of fuel oil was found to have leaked<br />
into the river from a storage tank of<br />
the granulation plant at <strong>Kemira</strong> Agro<br />
Pernis, the Netherlands.<br />
– September: 400 tonnes of urea ammonium<br />
nitrate leaked from a storage<br />
tank at <strong>Kemira</strong> Agro Rozenburg.<br />
– November: A fire on the roof of the<br />
<strong>Kemira</strong> Pigments Pori plant in Finland<br />
caused property damage and<br />
smoke formation.<br />
Other reported spills and accidents<br />
did not cause significant environmental<br />
impacts outside the plant areas. All<br />
accidents were investigated in detail<br />
and reported to the authorities, and<br />
appropriate insurance procedures have<br />
been undertaken.<br />
<strong>Kemira</strong> Pigments Inc. had eight reportable<br />
releases of chlorine, caustic<br />
and sulphuric acid in Savannah, Georgia.<br />
The Group companies paid approximately<br />
EUR 0.2 million in compensation<br />
for environment-related<br />
damage, or in penalties.<br />
Lost-time incidents showed a good<br />
trend, decreasing by about 22% from<br />
the previous year. However, a fatal accident<br />
occurred on 11 January 2000 at<br />
the <strong>Kemira</strong> Agro Uusikaupunki plant<br />
in Finland. One employee died after<br />
falling from the roof of a fertilizer<br />
sludge reactor during maintenance<br />
work. The <strong>Kemira</strong> Group deeply regrets<br />
this loss of life.<br />
Environmental liabilities. Soil and<br />
ground water contamination and other<br />
risks associated with past activities<br />
have been assessed at all major<br />
Group-owned properties. Several complementary<br />
investigations were reported<br />
on.<br />
Mergers and acquisitions or plant<br />
closures did not change the environmental<br />
liabilities significantly in <strong>1999</strong>.<br />
Detailed environmental due diligence<br />
projects were conducted in connection<br />
with the completed acquisitions and<br />
with the pending divestment of the titanium<br />
dioxide business.<br />
At present, there is a requirement<br />
or commitment to undertake a limited<br />
clean-up at five sites, and appropriate<br />
provisions have been made. Remedial<br />
action or demolition were carried out<br />
at six sites. The costs of current cleanup<br />
activities are reported as environmental<br />
operating costs (see above).<br />
The Group also continued to build up<br />
a reserve for unforeseen remediation<br />
costs.<br />
<strong>Kemira</strong> Chemicals removed soil<br />
contaminated by mercury at the Kokkola<br />
plants (see above), but the cost<br />
was not significant. Investigations of<br />
arsenic in the sediment of the small<br />
lake close to the Vaasa plants are continuing.<br />
Ground water clean-up was<br />
temporarily halted at <strong>Kemira</strong> Kemi AB,<br />
Helsingborg, Sweden, because of low<br />
residual levels achieved. In December<br />
elevated concentrations of hexachlorobenzene<br />
were found in the sediment,<br />
mussels and fish in the plants’<br />
harbour basin. Investigations of the<br />
sources and releases of organochlorine<br />
compounds are going on at Helsingborg<br />
and Kokkola.<br />
At the Tertre plant of <strong>Kemira</strong> Agro<br />
in Belgium, manganese nitrate was<br />
found in waste water due to subsurface<br />
transport from a neigbouring industrial<br />
property.<br />
Legal cases. There were no significant<br />
environmental legal cases pending<br />
against the Group companies.<br />
Environmental taxes and fees. Environment-based<br />
taxes totaled EUR 11.5<br />
million calculated on a net basis, on a<br />
par with 1998. Proposed increases in<br />
environmental taxation are not expected<br />
to hurt the competitive position of<br />
the Group.<br />
58
ENVIRONMENTAL COMMUNICATION<br />
<strong>Kemira</strong> was pleased to become a component<br />
of the Dow Jones Sustainability<br />
Group Index in September. This new,<br />
worldwide index comprises 229 companies<br />
selected as top performers in<br />
different branches of business, based<br />
on extensive questionnaires and<br />
benchmarking surveys. The index has<br />
been designed to help ethical and sustainable<br />
investors globally.<br />
<strong>Kemira</strong>’s first Product Stewardship<br />
report (Products and the Environment)<br />
was issued in the summer. The response<br />
has been positive among many<br />
interest groups. The report gives information<br />
on the overall environmental<br />
life cycles of major products and discusses<br />
product development and<br />
chemicals management within the<br />
Group.<br />
<strong>Kemira</strong> Oyj achieved a second<br />
award for good annual environmental<br />
reporting in Finland in a comparison<br />
of publicly listed companies. <strong>Kemira</strong><br />
Pigments Oy was granted the first environmental<br />
award of the City of Pori<br />
for its good results in water protection<br />
and other environmental management.<br />
The web pages of <strong>Kemira</strong> Oyj and the<br />
Group companies (www.kemira.com)<br />
contain a growing amount of businessspecific<br />
environmental reports and<br />
other information for the customers<br />
and the public.<br />
Miljö<br />
Environm<br />
mpäri<br />
59
ENVIRONMENTAL DATA FOR THE KEMIRA GROUP<br />
1990 1996 1997 1998 <strong>1999</strong><br />
Releases into water, tonnes<br />
Chemical Oxygen Demand (COD) 1 •• 9,776 5,616 5,694 5,397<br />
Nitrogen (N) 2,500 1,258 1,121 1,163 1,019<br />
Phosphorus (P) 2 4,952 1,717 1,993 1,933 1,967<br />
Suspended solids, 1,000 tonnes 2 934 795 841 799 773<br />
Metals (Hg+Cd+Pb+Cr+As) 49 21 12 10 5.3<br />
Metals (Hg+Cd+Pb+Cr+As+Cu+Ni+Zn) •• 48 66.8<br />
Releases into air, tonnes<br />
Particulates 1,950 1,504 1,364 896 936<br />
Sulphur dioxide (SO 2<br />
) 3 23,138 9,106 5,765 5,630 5,687<br />
Nitrogen oxide (NO 2<br />
) 4 8,546 6,345 6,202 5,840 5,951<br />
Carbon dioxide (CO 2<br />
), 1,000 tonnes 3,445 3,508 3,326 3,344<br />
Volatile organics (VOC) 5 •• 484 369 374 321<br />
Volatile inorganics (VIC) 6 •• 4,305 3,508 3,152 2,594<br />
Waste 7, tonnes<br />
Hazardous waste, total 8,669 21,185 8,153*<br />
8,795 26,092<br />
– Off-site landfill •• 12,105 4,274 5,117 19,479<br />
– Off-site incinertion •• 3,206 1,845 2,926 5,630<br />
– On-site landfill •• 2,390 362 375 118<br />
– other treatment •• 3,484 1,672 377 864<br />
Non-hazardous, 1,000 tonnes 2,254 2,159 2,308 2,278 2,170<br />
Natural resources<br />
Fuel consumption, ktoe 8 1,758 1,791 1,777 1,773<br />
Purchased electricity, TJ 5,300 5,500 5,700 5,800<br />
Total, ktoe 2,101 2,148 2,146 2,150<br />
Cooling water volume, million m 3 , appr. 407 399 393 398<br />
Waste water volume, million m 3 , appr. 86 78 82 76<br />
Safety<br />
Number of incidents 9 per<br />
million working hours 21.2 18.2 16.3 12.7<br />
Reference data, EUR million<br />
Group net sales 2,087 2,266 2,420 2,413 2,526<br />
Environmental capital expenditure 31.1 31.3 18.5 15.0 12.6<br />
Environmental operating costs 32.3 47.1 49.8 48.8 52.6<br />
Total environmental costs, % of net sales 3.0 3.5 2.8 2.6 2.6<br />
*<br />
*<br />
1<br />
Estimate. In this case, mainly caused by inorganic discharges,<br />
and hence not a very relevant parameter for the Group.<br />
2<br />
Originates mostly from phosphogypsum.<br />
3<br />
All sulphur compounds calculated as SO 2<br />
.<br />
4<br />
Nitric oxide and nitrogen dioxide calculated as NO 2<br />
.<br />
5<br />
VOC is a sum of volatile organic compounds.<br />
6<br />
Sum of ammonia, hydrogen chloride and six other simple<br />
inorganic compounds, mostly ammonia in this case.<br />
7<br />
Waste as defined in EU legislation. <strong>Report</strong>ed figures do not include<br />
mining by-products, on-site incineration, waste which is<br />
further processed into products at the sites, or sold as a coproduct<br />
to external recycling. Figures are on wet basis.<br />
8<br />
1,000 tonnes of oil equivalent. Includes fuel as a raw material.<br />
9<br />
Incidents causing an employee absence of at least one day.<br />
* These figures have been changed because of a redefinition.<br />
60
VERIFICATION STATEMENT<br />
At the request of <strong>Kemira</strong>, we have reviewed the basis of the “<strong>Kemira</strong> Group Environmental <strong>Report</strong><br />
<strong>1999</strong>”. The report is the responsibility of and has been approved by the Board of Directors of <strong>Kemira</strong><br />
Oyj. The inherent limitations of completeness and the accuracy of the data are set out in the report.<br />
Our review has consisted of the following procedures:<br />
– making enquiries of management responsible for compiling the report;<br />
– an examination of relevant supporting information;<br />
– review in more detail of the systems for gathering and reporting environmental data at<br />
operating level at one site outside Finland and one site in Finland, selected by us.<br />
Based on our review we are assured that:<br />
– the statements made in the report are supported by underlying information;<br />
– the data has been properly collated from information provided by the sites;<br />
– for the two sites visited, data has been properly extracted from their information systems.<br />
The report has been prepared in line with the CEFIC Health, Safety and Environmental <strong>Report</strong>ing<br />
Guidelines, excluding information on occupational illnesses and distribution incidents. <strong>Kemira</strong>’s<br />
approach to reporting continues to be in line with the European Commission interpretative<br />
communication concerning certain articles of the fourth and seventh Council Directives on accounting<br />
and, where appropriate, meets the requirements of International Accounting Standard IAS 37<br />
Provisions, Contingent Liabilities and Contingent Assets. It is our opinion that the <strong>Kemira</strong> Group<br />
Environmental <strong>Report</strong> <strong>1999</strong> gives, in all material respects, a fair and balanced view on the group’s<br />
environmental performance.<br />
Helsinki, 16 February 2000<br />
KPMG WIDERI OY AB<br />
Hannu Niilekselä<br />
Authorized Public Accountant<br />
61
SUMMARIES OF MAIN PRESS RELEASES<br />
JANUARY<br />
<strong>Kemira</strong> Chemicals’ Kemwater business<br />
unit will build a coagulant plant in<br />
northern Brazil. The plant will produce<br />
solid ferric sulphate, which has<br />
been developed by Kemwater. The<br />
product will be used in the production<br />
of drinking water and in the treatment<br />
of municipal and industrial waste water.<br />
The capital expenditure is EUR 3<br />
million.<br />
FEBRUARY<br />
<strong>Kemira</strong> Fine Chemicals Oy, a subsidiary<br />
of <strong>Kemira</strong> Chemicals, and Monsanto<br />
Europe S.A. signed a 5-year contract<br />
for custom-manufacturing of silthiopham,<br />
the active ingredient of Monsanto’s<br />
new wheat fungicide. The value<br />
of the contract is EUR 33 million.<br />
Tikkurila Coatings upgraded its tinting<br />
system for industrial coatings. Temaspeed<br />
Colour Service comprises<br />
modernised base paints, colourants,<br />
tinting equipment and software. The<br />
new system has only two base paints<br />
and 11 tinting colourants. The role of<br />
service is emphasized in the new concept.<br />
MARCH<br />
<strong>Kemira</strong> Pigments initiated a EUR 18<br />
million efficiency improvement programme<br />
at their titanium dioxide pigments<br />
production plant in Savannah,<br />
Georgia. The programme is to be completed<br />
by the end of 2000.<br />
<strong>Kemira</strong> Agro and the Italian manufacturer<br />
of water-soluble horticultural fertilizers<br />
Biolchim S.p.A. entered into an<br />
agreement whereby 50 % of Biolchim<br />
shares were acquired by <strong>Kemira</strong> Agro.<br />
Biolchim is Italy’s most important<br />
manufacturer and distributor of watersoluble<br />
horticultural fertilisers. The<br />
Mediterranean is an important strategic<br />
area for the <strong>Kemira</strong> Agro Horticulture<br />
unit.<br />
APRIL<br />
Tauno Pihlava was appointed as the<br />
new CEO of <strong>Kemira</strong> Oyj as from 1 January<br />
2000.<br />
<strong>Kemira</strong> Chemicals decided to invest<br />
nearly EUR 12 million in development<br />
of its Siilinjärvi site in Finland and ensuring<br />
that it remains competitive.<br />
MAY<br />
Risto Keränen was appointed as the<br />
President of <strong>Kemira</strong> Agro Oy and Frits<br />
Visser as the President of <strong>Kemira</strong> Pigments<br />
Oy as from 1 July <strong>1999</strong>.<br />
<strong>Kemira</strong> Chemicals signed a joint venture<br />
contract with Jiangsu Yixing Purifying<br />
Agent Plant and the Finnish<br />
Fund for Industrial Cooperation<br />
(Finnfund) for the founding of a company<br />
producing mainly inorganic coagulants<br />
for water treatment in the<br />
province of Jiangsu, China.<br />
JUNE<br />
The Supervisory Board of <strong>Kemira</strong> Oyj<br />
approved an investment in potassium<br />
nitrate and dicalcium phosphate production<br />
in Aqaba, Jordan. The new<br />
company will be held on a joint venture<br />
basis by <strong>Kemira</strong> and the Arab Potash<br />
Company in Jordan. Total investment<br />
in the plant will be EUR 90 million.<br />
A letter of intent concerning the<br />
investment was signed in 1998.<br />
<strong>Kemira</strong> Agro announced its plan to<br />
close down the NPK fertilizer granulation<br />
plant in Pernis, the Netherlands,<br />
as well as the nitric acid plant and the<br />
ammonium nitrate plant connected<br />
with the NPK plant.<br />
<strong>Kemira</strong> Oyj decided to start repurchasing<br />
the company’s shares according to<br />
authorization granted at the annual<br />
general meeting of shareholders. The<br />
decision allows for a possible repurchase<br />
of a maximum of 2,576,000<br />
shares through the Exchange at current<br />
market prices. This corresponds<br />
to max. 2 percent of <strong>Kemira</strong> Oyj’s issued<br />
share capital. The shares will be<br />
used for the payment of bonuses to<br />
the personnel funds operating within<br />
the company.<br />
<strong>Kemira</strong> Chemicals’ strategic business<br />
unit Pulp & Paper Chemicals decided<br />
to invest about EUR 5 million in its<br />
Speciality Paper Chemicals plant in<br />
Vaasa, Finland to further expand its<br />
sizing chemicals business with emphasis<br />
also on AKD production efficiency<br />
and product quality.<br />
Tikkurila Coatings and Technical Coatings<br />
Co. North America in the USA<br />
signed a cooperation agreement which<br />
includes exchanging information and<br />
manufacturing and promoting each<br />
other’s products in their respective areas<br />
of market dominance. The agreement<br />
covers special products for the<br />
metal-working industry, coil coating of<br />
sheet metal, and can coatings for metal<br />
packaging.<br />
<strong>Kemira</strong> Chemicals and the City of Helsinki<br />
signed a letter of intent to establish<br />
a joint venture company in the<br />
water utilities field. <strong>Kemira</strong> Chemicals<br />
would hold 51% and Helsinki 49% of<br />
the proposed company. The company,<br />
Kemwater Services Oy, will make use<br />
of the special skills acquired by the<br />
parties in the field of drinking and<br />
wastewater purification.<br />
JULY<br />
Emirates Food Company (EFC),<br />
<strong>Kemira</strong> Agro and Union <strong>Kemira</strong> entered<br />
into an agreement to establish a<br />
new joint venture company called<br />
<strong>Kemira</strong> Emirates Fertilizer Company<br />
(Kefco) in Dubai, United Arab Emirates.<br />
EFC will have a 50% shareholding<br />
in Kefco, <strong>Kemira</strong> Agro 30% and<br />
Union <strong>Kemira</strong> 20%. The company will<br />
start production of urea phosphate.<br />
The plant will be located in the Jebel<br />
Ali Free Zone in Dubai and its production<br />
capacity will be 30,000 t/a.<br />
Tikkurila Paints established a subsidiary<br />
named OOO Kraski Tikkurila in<br />
Moscow. The new company will build<br />
facilities for paint production and<br />
warehousing in Ramenskoye, to the<br />
south-east of Moscow. Production is<br />
scheduled to start before the summer<br />
of 2000.<br />
SEPTEMBER<br />
<strong>Kemira</strong> Chemicals’ Kemwater unit announced<br />
it was making further investment<br />
in its plants in Pori, Finland and<br />
Rheinberg, Germany. Both plant manufacture<br />
coagulants for water treatment.<br />
The <strong>Kemira</strong> Group was included as a<br />
component in the worldwide environmental<br />
Dow Jones Sustainability<br />
Group Index. This index assesses<br />
companies on the basis both of their<br />
economic factors and performance in<br />
sustainable development.<br />
62
OCTOBER<br />
A new company established by Avena<br />
Group and <strong>Kemira</strong> Agro acquired the<br />
animal feed producer Suomen Rehu<br />
Oy from Cultor Oyj, a subsidiary of<br />
Danisco A/S. <strong>Kemira</strong> holding of the<br />
new company is 20%.<br />
<strong>Kemira</strong> decided to sharpen up Group<br />
strategy to improve competitiveness<br />
and profitability. The <strong>Kemira</strong> Group<br />
will focus on areas with sound growth<br />
prospects and below average dependancy<br />
on economic cycles. <strong>Kemira</strong> will<br />
seek growth in pulp and paper chemicals,<br />
water treatment chemicals, as<br />
well as in paints and coatings. Other<br />
areas of focus will include speciality<br />
fertilizers and industrial chemicals.<br />
NOVEMBER<br />
Malmö Water, the municipal potable<br />
and waste water company of the<br />
Malmö city, Sweden, decided to install<br />
the Krepro process for the treatment of<br />
sewage sludge. The total investment in<br />
Malmö is estimated at EUR 7.3 million.<br />
The Krepro prcess has been developed<br />
by <strong>Kemira</strong> Chemicals’ Kemwater<br />
unit.<br />
<strong>Kemira</strong> Chemicals will build a paper<br />
chemicals plant in Parana state, Brazil.<br />
The production of sizing and speciality<br />
chemicals used in papermaking will<br />
start by the end of 2000, generating a<br />
turnover of EUR 9 million at the first<br />
stage.<br />
The supervisory board of <strong>Kemira</strong> Oyj<br />
appointed the new board for the company<br />
for the new term of office from 1<br />
January 2000 on. The chairman of the<br />
board would be Sten-Olof Hansén and<br />
the Vice Chairman Niilo Pellonmaa,<br />
and the other members would be Eija<br />
Malmivirta, Anssi Soila, Timo Kaisanlahti<br />
and Tauno Pihlava. Esa Tirkkonen<br />
was appointed deputy to the<br />
CEO.<br />
<strong>Kemira</strong> Agro announced its intention to<br />
bring to an end the production of<br />
phosphoric acid, sulphuric acid and<br />
MAP/DAP phosphate fertilizers in<br />
Pernis, the Netherlands, by July 2000.<br />
Tikkurila was in negotiations for increasing<br />
its ownership in a paint factory<br />
in Szczecin, Poland. The jointly<br />
owned company Tikkurila Baltcolor<br />
Sp. z o.o. started operating a year earlier.<br />
According to plans, the negotiations<br />
aiming at a 100 per cent ownership<br />
by Tikkurila would be brought to<br />
conclusion in early 2000.<br />
The management board consists of<br />
Tauno Pihlava, CEO, chairman, Esa<br />
Tirkkonen, Executive Vice President,<br />
deputy chairman, and members consisting<br />
of Group division presidents<br />
and senior vice presidents in Group<br />
management.<br />
<strong>Kemira</strong> Agro was reorganized into two<br />
units: <strong>Kemira</strong> Agro Nitrogen (KAN)<br />
and <strong>Kemira</strong> Agro Specialities (KAS).<br />
<strong>Kemira</strong> Agro’s commercial activities<br />
will continue as before.<br />
Tikkurila CPS will invest into a new<br />
plant for tinting system components in<br />
Shanghai, China. Production is due to<br />
start in early 2001.<br />
FEBRUARY 2000<br />
<strong>Kemira</strong> announced the sale of its titanium<br />
dioxide pigment production<br />
units and related businesses in Savannah,<br />
Georgia, USA and in Rotterdam,<br />
the Netherlands, to Kerr-McGee Chemical<br />
Corporation LLC. The purchase<br />
price is approx. EUR 400 million.<br />
The press releases can be read in full<br />
on <strong>Kemira</strong>’s Internet pages at<br />
JANUARY 2000<br />
www.kemira.com.<br />
DECEMBER<br />
The <strong>Kemira</strong> Oyj Board of Directors<br />
confirmed the appointment of a management<br />
board. The task of the man-<br />
News<br />
agement board is to act in a preparatory<br />
capacity to the board of directors.<br />
Nyhete<br />
utisia<br />
63
ADMINISTRATION<br />
According to the Articles of Association<br />
of <strong>Kemira</strong> Oyj, the company’s affairs are<br />
managed by a Supervisory Board, a<br />
Board of Directors and a managing director.<br />
One or more deputy managing<br />
directors can be named for the company.<br />
The Supervisory Board is composed<br />
of a minimum of eight and a maximum<br />
of ten members, all of whom are elected<br />
by the <strong>Annual</strong> General Meeting for one<br />
year at a time, counting from the <strong>Annual</strong><br />
General Meeting at which the election<br />
was held. The <strong>Annual</strong> General Meeting<br />
elects one member as chairman and a<br />
maximum of two vice chairmen.<br />
The Board of Directors, which is<br />
elected by the Supervisory Board, comprises<br />
a minimum of four and a maximum<br />
of eight members. The Supervisory<br />
Board elects one member as chairman<br />
and one member as vice chairman.<br />
SUPERVISORY BOARD<br />
The task of the Supervisory Board is to<br />
oversee that the company’s affairs are<br />
managed according to sound business<br />
principles and with a view to profitability,<br />
in observance of the regulations of<br />
the Articles of Association, resolutions of<br />
meetings of shareholders and other confirmed<br />
standing rules. It is the task of<br />
the Supervisory Board to decide, within<br />
the limits indicated by the Articles of Association,<br />
on the number of members of<br />
the Board of Directors, to appoint and<br />
dismiss the managing director, deputy<br />
managing directors and members of the<br />
Board of Directors as well as to determine<br />
their compensation. It also decides<br />
on matters concerning a considerable<br />
constriction or expansion of operations,<br />
and decides on instructions to be given<br />
to the Board of Directors concerning<br />
matters of wide-ranging import or which<br />
are important in principle. The Supervisory<br />
Board gives its statement to the <strong>Annual</strong><br />
General Meeting concerning the<br />
parent company and consolidated financial<br />
statements and the Auditors’ <strong>Report</strong><br />
as well as decides on calling meetings of<br />
shareholders. The emoluments of the Supervisory<br />
Board are decided by the <strong>Annual</strong><br />
General Meeting.<br />
The Supervisory Board meets about six<br />
times a year. During the past financial year<br />
the Supervisory Board met eight times.<br />
BOARD OF DIRECTORS<br />
The task of the Board of Directors is to<br />
prepare matters that will be dealt with at<br />
meetings of shareholders and meetings<br />
of the Supervisory Board as well as to<br />
see to the implementation of decisions<br />
of the meetings of shareholders and the<br />
Supervisory Board. Its task is also to appoint<br />
and dismiss other officers upon a<br />
proposal by the managing director and<br />
to determine their compensation. The<br />
Board of Directors handles those administrative<br />
tasks that do not belong to the<br />
Supervisory Board or which have not<br />
been assigned to the managing director<br />
or to other individuals. The Board of Directors<br />
decides on the transfer and pledging<br />
of property as well as grants and cancels<br />
authorizations to sign the company’s<br />
business name. The Board of Directors<br />
also handles the other tasks in its competence<br />
under the Companies Act.<br />
The Board of Directors is responsible<br />
for duly organizing the company’s accounting<br />
and overseeing the management<br />
of its funds. The Board of Directors<br />
is also responsible for seeing to it<br />
that the company’s financial statements<br />
give correct and sufficient information<br />
and that the income statement and balance<br />
sheet have been prepared in conformity<br />
with the acts and regulations in<br />
force in Finland and following the Group’s<br />
uniform accounting practices, which are<br />
based on the International Accounting<br />
Standards (IAS).<br />
The company maintains an internal<br />
control system for the purpose of ensuring<br />
the reliability of financial reporting<br />
and to provide protection against significant<br />
misuse or loss of company assets.<br />
The internal control system is supported<br />
by approved policies and procedures<br />
which are observed at all Group companies<br />
as well as by an internal audit department<br />
whose staff operate in accordance<br />
with the procedures and principles<br />
confirmed by the Board of Directors.<br />
The Board of Directors of <strong>Kemira</strong> Oyj<br />
met 19 times during the financial year.<br />
MANAGING DIRECTOR<br />
According to the Articles of Association,<br />
the task of the managing director, whose<br />
title is Chief Executive Officer, is to manage<br />
and develop the company and the<br />
Group in accordance with the instructions<br />
and regulations issued by the<br />
Board of Directors. The managing director<br />
is responsible for ensuring that the<br />
interests of the company and the Group<br />
are taken into account at subsidiaries<br />
and associated companies that are<br />
owned by the parent company. The<br />
managing director likewise implements<br />
the decisions of the Board of Directors.<br />
The managing director of <strong>Kemira</strong> Oyj<br />
since 1.1.2000 has been Tauno Pihlava.<br />
The managing director’s deputy has<br />
been Esa Tirkkonen from the same date.<br />
AUDITORS<br />
The <strong>Annual</strong> General Meeting elects as auditors<br />
a minimum of one and a maximum<br />
of three ordinary auditors and as needed<br />
one deputy auditor. One of the auditors<br />
must be an auditor approved by the Central<br />
Chamber of Commerce. The auditor of<br />
<strong>Kemira</strong> Oyj is the firm of public accountants<br />
KPMG Wideri Oy Ab, with Hannu<br />
Niilekselä acting as responsible auditor.<br />
The members of the Board of Directors of <strong>Kemira</strong> Oyj in 2000: (from the left) Anssi<br />
Soila, Eija Malmivirta, Tauno Pihlava, Chairman Sten-Olof Hansén, Vice<br />
Chairman Niilo Pellonmaa and Timo Kaisanlahti. With the exception of Tauno<br />
Pihlava, the new Board members are non-excutive directors.<br />
64
SUPERVISORY BOARD<br />
Timo Kalli, Chairman, b. 1947,<br />
farmer.<br />
Member of Parliament.<br />
Kari Rajamäki, I Vice Chairman,<br />
b. 1948, M.Sc.(Admin.).<br />
Member of Parliament.<br />
Hanna Markkula-Kivisilta,<br />
II Vice Chairman, b. 1965,<br />
M.Sc.(Pol.Sc.).<br />
Member of Parliament.<br />
Helena Rissanen, b. 1949, chairman of<br />
the Union of Salaried Employees in Industry<br />
in Finland.<br />
Risto Ranki, b. 1948, Licentiate in<br />
Political Science, B.Sc.<br />
Deputy Director General of the<br />
Ministry of Trade and Industry.<br />
Sirpa Hertell, b. 1955, horticulturist.<br />
Secretary General of the Green<br />
Women’s Association.<br />
Pekka Kainulainen, b. 1941, Lic.Tech.<br />
Managing Director: Oy Liikkeenjohdon<br />
koulutuskeskus Ab.<br />
Chairman of the Board: Amer Group Plc.<br />
Vice Chairman of the Board:<br />
Yleiselektroniikka Oy.<br />
Member of the Board: Oy Talentum Ab.<br />
600 <strong>Kemira</strong> shares.<br />
Mikko Långström, b. 1940,<br />
M.Sc.(Econ.), B.Sc.(Eng.).<br />
Managing Director: Longinvest Oy.<br />
11,100 <strong>Kemira</strong> shares.<br />
Employee representatives (right of attendance<br />
and expression of views, no<br />
voting rights):<br />
Pertti Kautto, b. 1945, safety manager.<br />
Represents managerial employees.<br />
815 <strong>Kemira</strong> shares.<br />
Jorma Luukkonen, b. 1945,<br />
work planner.<br />
Represents technical employees.<br />
500 <strong>Kemira</strong> shares.<br />
Oili Kuusjärvi, b. 1947, copyist.<br />
Represents clerical employees.<br />
Jukka Virta, b. 1942, operator.<br />
Represents workers.<br />
165 <strong>Kemira</strong> shares.<br />
Tauno Korhonen, b. 1946, operator.<br />
Represents workers.<br />
AUDITORS<br />
KPMG Wideri Oy Ab,<br />
with Hannu Niilekselä,<br />
Authorized Public Accountant,<br />
acting as responsible auditor.<br />
BOARD OF DIRECTORS<br />
Sten-Olof Hansén, b. 1939,<br />
D.Sc.(Econ.), Chairman.<br />
Chairman of the Board at Urho<br />
Tuominen Oy, Medinet International<br />
Oy, Vetcare Oy, Innomedica Oy.<br />
Member of the Board at Perlos Oyj,<br />
Liikesivistysrahasto,<br />
Turun Seudun Osuuspankki.<br />
2,605 <strong>Kemira</strong> shares.<br />
Niilo Pellonmaa, b. 1941, M.Sc.(Econ.),<br />
Vice Chairman.<br />
Chairman of the Board at PMJ-Automec<br />
Oyj, Rocla Oyj.<br />
Member of the Board at Finvest Oyj,<br />
Asko Oyj, Uponor Oyj, Menire Oyj.<br />
11,000 <strong>Kemira</strong> shares.<br />
Eija Malmivirta, b. 1941, M.Sc.(Eng.).<br />
Chairman of the Board at Merei<br />
Energy Oy Ltd.<br />
Member of the Board at VR-Group Ltd,<br />
Tosco Corporation.<br />
500 <strong>Kemira</strong> shares.<br />
Anssi Soila, b. 1949, M.Sc.(Eng.&Econ.).<br />
Chairman of the Board at Sponda Oy,<br />
Årcarton AB, Normet Oy.<br />
Member of the Board at Leonia Oy,<br />
Lindström Oy.<br />
Timo Kaisanlahti, b. 1962, D.LL.,<br />
M.Sc.(Econ.).<br />
Government Counsellor at the Ministry<br />
of Trade and Industry.<br />
Member of the Board at FY-Industries<br />
Oy.<br />
Member of the Supervisory Board:<br />
Mortgage Society of Finland.<br />
Tauno Pihlava, b. 1946, M.Sc.(Eng.).<br />
Chief Executuve Officer of <strong>Kemira</strong> Oyj.<br />
200 <strong>Kemira</strong> shares and 250,000 share<br />
options.<br />
65
MANAGEMENT BOARD<br />
Tauno Pihlava, Chairman.<br />
See above (Board of Directors).<br />
Esa Tirkkonen, Vice Chairman, b. 1949,<br />
M.Sc.(Eng.)<br />
Executive Vice President and CFO of<br />
<strong>Kemira</strong> Oyj.<br />
Juhani Kari, b. 1944, LL.M.<br />
Senior Vice President of <strong>Kemira</strong> Oyj.<br />
Yrjö Sipilä, b. 1949, B.Sc.(Econ.).<br />
President of <strong>Kemira</strong> Chemicals Oy.<br />
Raimo Piironen, b. 1949, B.Sc.(Econ.).<br />
President of <strong>Kemira</strong> Chemicals Oy.<br />
Risto Keränen, b. 1949, Lic.Tech.<br />
President of <strong>Kemira</strong> Agro Oy.<br />
Frits Visser, b. 1942, M.Sc.<br />
President of <strong>Kemira</strong> Pigments Oy.<br />
OTHER GROUP ADMINISTRATION<br />
Raija Arasjärvi, b. 1957, M.Sc.(Econ.)<br />
Finance<br />
Kari Autio, b. 1945, M.Sc.(Eng.)<br />
Business Development<br />
Kaj Friman, b. 1953, LL.M., B.Sc.(Econ.)<br />
Secretary to the Supervisory Board and<br />
Board of Directors<br />
Treasury and Group Communications<br />
Timo Leppä, b. 1957, M.Sc.(Eng.), CEFA<br />
Corporate Planning<br />
Timo Mattila, b. 1943, Lic.Tech.<br />
Chairman of the Board of <strong>Kemira</strong><br />
Metalkat Oy and of <strong>Kemira</strong> Safety Oy.<br />
Orvo Rauma, b. 1940, B.Sc.(Econ.)<br />
Human Resources<br />
Aarno Salminen, b. 1956, M.A.<br />
Environmental Management<br />
Eero Sipilä, b. 1953, M.Sc.<br />
Human Resources (from 1 March 2000)<br />
Mikko Sivonen, b. 1941, M.Sc.(Eng.)<br />
Energy<br />
INSIDERS<br />
The statutory insiders of <strong>Kemira</strong> Oyj include<br />
the members of the Supervisory<br />
Board and of the Board of Directors<br />
(see above) as well as the Chief Executive<br />
Officer (see above) and his deputy,<br />
Esa Tirkkonen (1,075 <strong>Kemira</strong> shares).<br />
In addition, the following persons are<br />
regarded as insiders (in parentheses the<br />
number of <strong>Kemira</strong> shares owned by the<br />
person):<br />
Juhani Kari, Senior Vice President (1,075),<br />
Yrjö Sipilä, President, (1,575),<br />
Raimo Piironen, President, (250),<br />
Risto Keränen, President, (200),<br />
Frits Visser, President, (0),<br />
Raija Arasjärvi, Group Controller (660),<br />
Kaj Friman, Group Treasurer and<br />
VP Group Communications (1,702),<br />
Anneli Juutinen, Secretary (0),<br />
Liisa Karonen, Secretary (0),<br />
Arja Korhonen, Secretary (0) and<br />
Kirsti Laakso, Administrative Assistant (0).<br />
INVESTMENT ANALYSIS<br />
The following banks and brokerage<br />
firms are known to have prepared an<br />
investment analysis of <strong>Kemira</strong> in <strong>1999</strong>:<br />
Alfred Berg Finland Oy<br />
Kluuvikatu 3<br />
00100 Helsinki<br />
Finland<br />
Aros Securities<br />
P.O. Box 786<br />
00101 Helsinki<br />
Finland<br />
D. Carnegie Ab<br />
Finland Branch<br />
Eteläesplanadi 12<br />
00130 Helsinki<br />
Finland<br />
Conventum Securities Ltd<br />
Aleksanterinkatu 44<br />
00100 Helsinki<br />
Finland<br />
Crédit Agricole Indosuez<br />
Cheuvreux International Ltd<br />
CU Building St Helens<br />
1 Undershaft<br />
London EC3P 3DQ<br />
U.K.<br />
Credit Suisse First Boston (Europe) Ltd<br />
One Cabot Square<br />
London E14 4QJ<br />
U.K.<br />
Den Danske Bank<br />
Holmens Kanal 2 – 12<br />
1092 Copenhagen K<br />
Denmark<br />
Dresdner Kleinwort Benson<br />
20 Fenchurch Street<br />
London EC3P 3DB<br />
U.K.<br />
Enskilda Research<br />
P.O. Box 630<br />
00101 Helsinki<br />
Finland<br />
Evli Securities Plc<br />
Aleksanterinkatu 19<br />
P.O. Box 1081<br />
00101 Helsinki<br />
Finland<br />
Goldman Sachs International<br />
Peterborough Court<br />
133 Fleet Street<br />
London EC4A 2BB<br />
U.K.<br />
Handelsbanken Markets<br />
P.O. Box 315<br />
00131 Helsinki<br />
Finland<br />
Mandatum Stockbrokers Ltd<br />
P.O. Box 117<br />
00121 Helsinki<br />
Finland<br />
Merita Securities Oy<br />
Fabianinkatu 29 B<br />
00020 Merita<br />
Finland<br />
Merrill Lynch International Ltd<br />
20 Farringdon Road<br />
London EC1M 3NH<br />
U.K.<br />
Opstock Securities Ltd<br />
P.O. Box 362<br />
00101 Helsinki<br />
Finland<br />
Salomon Smith Barney<br />
Victoria Plaza<br />
111 Buckingham Palace Road<br />
London SW1W 0SB<br />
U.K.<br />
WestLB Research GmbH<br />
Elisabethstrasse 44-46<br />
40217 Düsseldorf<br />
Deutschland<br />
66
GLOSSARY<br />
ACE<br />
Agricultural, construction and earthmoving<br />
(equipment).<br />
AKD wax<br />
The active ingredient in AKD sizing used<br />
in paper manufacture. Sizing makes paper<br />
less water absorbing and controls its<br />
printing properties. AKD = alkylketenedimer.<br />
Alkyd paint<br />
An outdoor or indoor paint that is based<br />
on an air-drying alkyd binder. Alkyd is<br />
an oil-modified polyester resin. Alkyd<br />
paint dries faster than conventional oil<br />
paint.<br />
Aluminium sulphate<br />
Mainly used in the paper industry. Also<br />
used as a coagulant in water purification.<br />
It is generally made from aluminium<br />
hydroxide using sulphuric acid.<br />
Ammonia<br />
A basic chemical that is produced from<br />
natural gas and is mainly a nitrogen-containing<br />
raw material in fertilizers.<br />
Ammonium nitrate (AN)<br />
A nitrogen fertilizer.<br />
Anatase<br />
A certain type of titanium dioxide pigment<br />
used by the paper industry in particular.<br />
Audit<br />
A systematic, independent and documented<br />
inspection or evaluation in<br />
which operations are compared with<br />
given requirements or guidelines. An audit<br />
can be performed by an external party<br />
or by an internal expert.<br />
Calcium ammonium nitrate (CAN)<br />
A nitrogen fertilizer. Ammonium<br />
nitrate into which powdered limestone is<br />
mixed as part of the production process.<br />
Calcium chloride<br />
An industrial salt that is made from limestone<br />
using hydrochloric acid. It has a<br />
variety of uses such as in dust binding<br />
on roads, oil drilling and applications in<br />
the food-processing industry.<br />
Can coatings<br />
Can coatings for the beverage and food<br />
industry. The coating acts as an insulating<br />
layer between the food product and<br />
the can or cap.<br />
Carbon sink<br />
A part of the earth that permanently removes<br />
carbon dioxide from the atmosphere<br />
and binds it in organic compounds.<br />
The most important carbon<br />
sinks are the world’s oceans and forests.<br />
CEFIC<br />
The umbrella organization of the European<br />
Chemical industry (Confédération<br />
Européenne des Fédérations de<br />
l’Industrie Chimique).<br />
Chemical Oxygen Demand (COD)<br />
A quantity connected with waste waters.<br />
It mainly serves to measure the ability of<br />
organic substances to consume oxygen<br />
in water.<br />
Coagulant<br />
Precipitates impurities in water.<br />
Coil coating<br />
A method of coating metal sheets.<br />
Compound fertilizer<br />
A fertilizer that contains in every granule<br />
a number of elements that are essential<br />
for plants.<br />
CPS<br />
Colour Processing Systems.<br />
Diammonium phosphate (DAP)<br />
A nitrogen and phosphorus fertilizer for<br />
crops and horticulture.<br />
Dicalcium phosphate (DCP)<br />
A raw material for animal feed, manufactured<br />
from raw phosphate and limestone.<br />
ECF bleaching<br />
Elemental chlorine free pulp bleaching.<br />
ECOX<br />
Product name for sodium percarbonate.<br />
Used as detergent bleach.<br />
EHS<br />
Environment, Health and Safety.<br />
EMAS<br />
(Eco-Management and Audit Scheme)<br />
An environmental management system<br />
that is based on a European Community<br />
regulation. Industrial companies can register<br />
for it voluntarily.<br />
Environmental business<br />
The sale of products and services that<br />
are used directly for environmental protection<br />
or are closely related to it.<br />
Environmental chemical<br />
A chemical that is used for environmental<br />
protection purposes or closely connected<br />
to it. For example, chemicals<br />
used in treating waste water.<br />
Environmental disclosure<br />
A yearly report by a company on the releases<br />
caused by its operations as well<br />
as their environmental impacts, liabilities,<br />
costs, legislative compliance and<br />
other related environmental issues of<br />
major importance. It is becoming an increasingly<br />
integral part of the financial<br />
reporting.<br />
Environmental<br />
management system<br />
A company’s regular, documented description<br />
of how it acts in managing environmental<br />
affairs. The main components<br />
are the drawing up of an environmental<br />
policy, the setting and measuring<br />
of objectives as well as auditing.<br />
Environmental report<br />
A company’s public report that is freeform<br />
in terms of its content and deals<br />
with environmental issues connected<br />
with the company’s operations. It is published<br />
either separately or as part of the<br />
<strong>Annual</strong> <strong>Report</strong> at discretionary intervals.<br />
Environmental technology<br />
Equipment used for environmental protection<br />
purposes.<br />
Ferix<br />
Product name. Granular ferrisulphate,<br />
a water treatment chemical.<br />
Ferrichloride<br />
An iron-based water treatment chemical.<br />
Ferrous sulphate<br />
An iron-based water treatment chemical<br />
or a raw material used in such chemicals.<br />
It is generated as a byproduct in<br />
the manufacture of titanium dioxide pigment.<br />
Also used in feeds.<br />
FinnTi<br />
Product name for titanium dioxide pigment.<br />
Formamide<br />
A solvent and raw material used in the<br />
chemical and pharmaceutical industries,<br />
a derivative of formic acid.<br />
Formic acid<br />
Manufactured from carbon monoxide<br />
and methanol. Mainly used in silage additives<br />
as well as in the textile, pharmaceutical<br />
and rubber industries.<br />
Greenhouse gases<br />
Gases that promote heating of the atmosphere,<br />
the most important of which<br />
are carbon dioxide, methane and laughing<br />
gas (nitrous oxide).<br />
HAZOP<br />
A risk analysis method that is used in<br />
the process industry to improve working<br />
methods and the technical safety of<br />
equipment.<br />
Hydrogen peroxide<br />
A reactive oxygen chemical that is used<br />
especially in the environmentally sound<br />
bleaching of pulp, and also as a disinfectant<br />
and in environmental applications.<br />
Its raw materials are hydrogen and<br />
the oxygen found in air.<br />
IFA<br />
International Fertilizer Industry Association.<br />
Ilmenite<br />
The raw material of titanium dioxide<br />
pigment, an ore which has a relatively<br />
low concentration of titanium.<br />
ISO<br />
The International Standards<br />
Organization.<br />
67
ISO 14001<br />
An International standard that defines<br />
the requirements of an environmental<br />
management system. A company or institution<br />
that complies with the requirements<br />
can obtain a certificate according<br />
to the standard.<br />
KREPRO<br />
The Kemwater Recycling Process separates<br />
metals, heavy metals, phosphorus<br />
and carbon out from waste water sludge<br />
and recirculates them for useful purposes.<br />
LORIS (KEMIRA LORIS)<br />
(Local Resource Information System)<br />
A satellite-controlled precision farming<br />
system.<br />
Methylene urea<br />
A slow-acting nitrogen fertilizer.<br />
Monocalcium phosphate (MCP)<br />
A feed raw material that is manufactured<br />
using limestone and pure phosphoric<br />
acid.<br />
Nitric acid<br />
A basic chemical that is made from ammonia<br />
by catalytic combustion. An important<br />
intermediale in fertilizer manufacture.<br />
Nitrogen (N)<br />
An element that is essential for the<br />
growth of plants.<br />
Nitrogen oxides<br />
Mainly nitrogen monoxide (NO) and nitrogen<br />
dioxide (NO 2<br />
). Nitrogen gases<br />
that are formed as emissions in combustion<br />
and, for example, in the manufacture<br />
of nitric acid. Nitric oxides cause<br />
acidification and impair air quality.<br />
NK fertilizer<br />
Fertilizer containing nitrogen and potassium.<br />
NPK fertilizer<br />
A compound fertilizer containing nitrogen,<br />
phosphorus and potassium as its<br />
main nutrients. A number of trace elements<br />
can also be added to it.<br />
Organic mineral fertilizer<br />
Composed of both organic substances<br />
(e.g. peat) and inorganic salts.<br />
Peracetic acid<br />
A reactive acid chemical that is used in<br />
the environmentally sound bleaching of<br />
pulp.<br />
Phosphate<br />
A phosphorus compound which occurs<br />
in natural ores and is used as a raw material<br />
in fertilizers, animal feeds and detergents.<br />
Phosphogypsum<br />
A gypsum that is formed as a byproduct<br />
in the manufacture of phosphoric acid.<br />
68<br />
Phosphoric acid<br />
An acid that is manufactured from phosphate<br />
concentrate using sulphuric acid<br />
and is used as a raw material in products<br />
such as compound fertilizers, feed phosphates,<br />
detergents and processed foods.<br />
Phosphorus (P)<br />
An element that is essential for life. One<br />
of the three main nutrients in fertilizers.<br />
It is obtained by processing phosphatecontaining<br />
ores.<br />
Pickling liquor<br />
An acidic solution that is used to surface<br />
coat metals.<br />
PK fertilizer<br />
Fertilizer containing phosphorus and potassium.<br />
Plastisol<br />
Precoated thin sheet for roofing.<br />
Polyaluminium chloride<br />
A chemical coagulant that is used in the<br />
treatment of drinking water and waste<br />
water.<br />
POP<br />
Persistent Organic Pollutant.<br />
Potassium (K)<br />
An element. One of the three main nutrients<br />
in compound fertilizers. It is excavated<br />
mainly in salt mines in the form of<br />
potassium chloride.<br />
Potassium nitrate<br />
A nitrogen and potassium fertilizer that<br />
is used in horticulture.<br />
Potassium sulphate<br />
A sulphur and potassium fertilizer used<br />
in horticulture, or the raw material for<br />
fertilizer.<br />
Process chemicals<br />
Products that are primarily sold to the<br />
process industry, such as nitric acid, ammonia<br />
and technical urea.<br />
ProGips<br />
Product name. Gypsum raw material<br />
used by the construction industry.<br />
Responsible Care (RC)<br />
The chemical industry’s voluntary,<br />
worldwide environmental and safety<br />
programme.<br />
Rutile ore<br />
A raw material in titanium dioxide pigment.<br />
It contains a large amount of titanium<br />
dioxide.<br />
Sodium percarbonate<br />
A raw material in detergents. It is made<br />
from soda using hydrogen peroxide.<br />
Sodium tripolyphosphate (STPP)<br />
Used in detergents as builder to soften<br />
the water. Prevents dirt particles from<br />
adhering back to the garment.<br />
Straight fertilizer<br />
A fertilizer containing one plant nutrient.<br />
Sulphur dioxide<br />
An industrial gas which is used mainly<br />
by the forest industry and is manufactured,<br />
for example, by burning elementary<br />
sulphur or by means of its recovery<br />
from process gases. It is also an acidification-causing<br />
emission that is produced<br />
when sulphur-containing fuels are burnt.<br />
Sulphuric acid<br />
A widely used basic chemical that is produced<br />
from sulphur dioxide gas. The<br />
raw gas is obtained from the roasting of<br />
certain ores, or by burning elementary<br />
sulphur.<br />
Stabilization<br />
Bringing to a permanent state. For example,<br />
the chemical composition of a hazardous<br />
waste can be changed or the solubility<br />
in water of the waste can be lowered<br />
by means of various treatment techniques<br />
Tinting system<br />
A method of producing coloured paint.<br />
The system comprises (base paints,) tinting<br />
colourants, tinting formulae, dispensing<br />
machines, shakers, colour matching<br />
systems, PC software, and colour cards.<br />
TiO 2<br />
Titanium dioxide.<br />
Titanium dioxide pigment<br />
A white pigment. An important raw material<br />
in the manufacture of paint, paper,<br />
plastics and printing ink. It is manufactured<br />
from titanium-containing ores and<br />
slag in a complex process involving the<br />
use of sulphuric acid or chlorine and numerous<br />
auxiliary chemicals. The methods<br />
of manufacture are the sulphate<br />
process and the chloride process.<br />
UC cured product<br />
Lacquer or paint cured by ultra-violet radiation.<br />
Ultrafine TiO 2<br />
A very fine crystal titanium dioxide that<br />
is invisible in the product application<br />
and protects against UV radiation.<br />
Urea<br />
A single-nutrient fertilizer that contains a<br />
large amount of nitrogen and is manufactured<br />
from ammonia and carbon dioxide.<br />
It is also used in resin adhesives.<br />
Water chemical<br />
A chemical used in treating water.<br />
VIC<br />
(Volatile Inorganic Compounds)<br />
These compounds include ammonia,<br />
chlorine and fluorine that are formed as<br />
emissions mainly from the processes of<br />
the basic inorganic industries.<br />
VOC<br />
(Volatile Organic Compounds)<br />
These compounds are mainly solvents<br />
which in normal conditions evaporate<br />
into the air, notably with effects on the<br />
generation of ozone.
QUARTERLY FINANCIAL DEVELOPMENT (The figures are unaudited)<br />
EUR million<br />
<strong>1999</strong> 1998<br />
I/99 II/99 III/99 IV/99 I/98 II/98 III/98 IV/98<br />
Net sales<br />
<strong>Kemira</strong> Chemicals 172.5 172.8 169.2 182.5 150.3 164.5 159.8 155.0<br />
Tikkurila 79.0 97.1 101.7 79.7 91.1 99.8 101.1 68.5<br />
<strong>Kemira</strong> Agro 289.9 268.7 215.4 240.6 330.0 275.8 218.4 206.0<br />
<strong>Kemira</strong> Pigments 107.6 121.3 131.0 128.6 107.7 117.0 106.8 91.4<br />
Other including<br />
eliminations –9.3 –7.5 –2.3 –12.3 –8.4 –9.6 –6.8 –5.7<br />
Total 639.7 652.4 615.0 619.1 670.7 647.5 579.3 515.2<br />
Operating income<br />
<strong>Kemira</strong> Chemicals 19.4 21.1 19.4 23.3 22.3 23.3 12.4 17.1<br />
Tikkurila 1.9 11.2 15.3 –5.3 10.1 13.1 11.2 –1.8<br />
<strong>Kemira</strong> Agro 5.1 2.1 –14.3 –31.7 15.7 14.7 0.3 –12.0<br />
<strong>Kemira</strong> Pigments 5.4 9.6 3.3 16.6 6.1 9.2 0.9 6.1<br />
Other including<br />
eliminations –2.2 –0.2 1.2 9.8 –0.7 –1.0 –0.8 1.9<br />
Total 29.6 43.8 24.9 12.7 53.5 59.3 24.0 11.3<br />
Financing expenses 12.6 12.1 12.3 15.4 12.8 11.0 11.1 15.8<br />
Income before extraordinary<br />
items and taxes 17.0 31.7 12.6 –2.7 40.7 48.3 12.9 –4.5<br />
Net income 11.8 19.6 8.8 –10.3 29.0 32.5 8.9 8.2<br />
Earnings per share 0.09 0.15 0.07 –0.08 0.23 0.25 0.07 0.06<br />
THE HOLDING OF FRANKLIN RESOURCES INC.<br />
Franklin Resources Inc. has notified <strong>Kemira</strong> Oyj that its holdings of the company’s shares and voting rights on<br />
the dates below were as follows:<br />
Shares % of shares % of votes<br />
01.04. <strong>1999</strong><br />
Mutual fund holdings 3,864,502 3.00 3.00<br />
Assets managed under agreement 4,351,248 3.38 3.38<br />
Total 6,38<br />
05.05.<strong>1999</strong><br />
Mutual fund holdings 7,745,202 6.01 6.01<br />
Assets managed under agreement 5,150,248 4.00 4.00<br />
Total 10.01<br />
27.05.<strong>1999</strong><br />
Mutual fund holdings 7,719,002 5.99 5.99<br />
Assets managed under agreement 5,146,808 4.00 4.00<br />
Total 9.99<br />
These shares are included in nominee-registered shares because Franklin Resources Inc. has not registered the<br />
shares it owns within the book-entry register kept by Finnish Central Securities Depository Ltd.<br />
69
GROUP COMPANIES<br />
31 December <strong>1999</strong><br />
Company Group holding Location<br />
%<br />
Company<br />
Group ho<br />
<strong>Kemira</strong> Oyj<br />
Finland, Helsinki<br />
<strong>Kemira</strong> Chemicals Oy 100 Finland, Helsinki <br />
<strong>Kemira</strong> Kemi AB 100 Sweden, Helsingborg <br />
<strong>Kemira</strong> Chimie S.A. 100 France, Lauterbourg <br />
<strong>Kemira</strong> Chemicals AS 100 Norway, Gamle Fredrikstad <br />
Kemwater Cristal S.A. 73 Rumania, Bucharest <br />
Alchim S.R.L. 73 Rumania, Tulcea <br />
Societatea Comercala Chimbis S.A. 50 Rumania, Bistrita <br />
Scandinavian Silver Eel AB 100 Sweden, Helsingborg <br />
Aliada Quimica S.A. 100 Spain, Barcelona <br />
<strong>Kemira</strong> Ibérica S.A. 100 Spain, Barcelona <br />
<strong>Kemira</strong> lbérica Internacional S.L. 100 Spain, Barcelona <br />
Aliada Quimica de Portugal Lda. 74 Portugal, Estarreja <br />
<strong>Kemira</strong> Chimica S.p.A. 100 Italy, Ossona <br />
Kemifloc a.s. 51 Czech Republic, Prerov <br />
Kemwater Närke AB 92 Sweden, Kumla <br />
Kemipol Sp.z.o.o. 51 Poland, Police <br />
<strong>Kemira</strong> Kopparverket KB 100 Sweden, Helsingborg <br />
Ahlbo Kemi AB 100 Sweden, Helsingborg <br />
Kemwater Brasil S.A. 51 Brazil, São Paulo <br />
Kemwater de México, S.A. de C.V. 51 Mexico, Tlaxcala <br />
Kemwater ProChemie s.r.o. 60 Czech Republic, Bakov nad Jizerou <br />
Kemwater Diper Environmental Chemicals Inc. 51 Turkey, Izmir <br />
<strong>Kemira</strong> Fine Chemicals Oy 100 Finland, Kokkola <br />
<strong>Kemira</strong> Chemicals (UK) Ltd 100 United Kingdom, Harrogate <br />
<strong>Kemira</strong> Chemie GmbH 100 Germany, Hanau <br />
<strong>Kemira</strong> Chemie Ges.mbH 100 Austria, Vienna <br />
<strong>Kemira</strong> Chem Holding B.V. 100 The Netherlands, Rotterdam <br />
<strong>Kemira</strong> Chemicals B.V. 100 The Netherlands, Rozenburg <br />
Prospector B.V. 100 The Netherlands, Rozenburg <br />
Kemwater B.V. 100 The Netherlands, Rotterdam <br />
<strong>Kemira</strong> Kemax B.V. 100 The Netherlands, Rozenburg <br />
<strong>Kemira</strong> Chemicals S.A./N.V. 100 Belgium, Wavre <br />
<strong>Kemira</strong> Chemicals Inc. 100 United States, Savannah, GA <br />
<strong>Kemira</strong> Paper Chemicals Inc. 100 United States, Savannah, GA <br />
<strong>Kemira</strong> Paper Chemicals Canada Inc. 100 Canada, Dorion, Que. <br />
<strong>Kemira</strong> Chemicals Korea Corporation 100 South Korea, Ulsan <br />
<strong>Kemira</strong> Chemicals Canada Inc. 100 Canada, Maitland, Ont. <br />
<strong>Kemira</strong> Chemicals U.S. Inc. 100 United States, Philadelphia, PA <br />
<strong>Kemira</strong> Chemicals Canada NRO, Inc. 100 Canada, Maitland <br />
<strong>Kemira</strong> Chemicals Hungaria KFT 100 Hungary, Budapest <br />
AS Kemivesi 50 Estonia, Tallinn <br />
Kemwater (Thailand) Ltd 49 Thailand, Bangkok <br />
<strong>Kemira</strong> Pigments Oy 100 Finland, Pori <br />
<strong>Kemira</strong> Holdings Inc. 100 United States, Savannah, GA <br />
<strong>Kemira</strong> Pigments Inc. 100 United States, Savannah, GA <br />
<strong>Kemira</strong> Pigments AB 100 Sweden, Helsingborg <br />
<strong>Kemira</strong> Pigments Kereskedelmi KFT 100 Hungary, Budapest <br />
<strong>Kemira</strong> Pigments Holding B.V. 100 The Netherlands, Rotterdam <br />
<strong>Kemira</strong> Pigments B.V. 100 The Netherlands, Rozenburg <br />
<strong>Kemira</strong> Pigmente GmbH 100 Germany, Cologne <br />
<strong>Kemira</strong> Services Holland B.V. 100 The Netherlands, Rotterdam <br />
<strong>Kemira</strong> International Finance B.V. 100 The Netherlands, Rotterdam <br />
<strong>Kemira</strong> Agro Rozenburg B.V. 100 The Netherlands, Europoort Rt <br />
<strong>Kemira</strong> Agro Pernis B.V. 100 The Netherlands, Rotterdam <br />
<strong>Kemira</strong> Finance B.V. 100 The Netherlands, Rozenburg <br />
<strong>Kemira</strong> Pigments S.A. 1) 100 Belgium, Wavre <br />
<strong>Kemira</strong> Pigments Asia Pacific Pte. Ltd. 100 Singapore <br />
<strong>Kemira</strong> Pigments Latin America Comercial Ltda. 100 Chile, Santiago <br />
<strong>Kemira</strong> Agro Oy<br />
<strong>Kemira</strong> Agro Holdings Ltd<br />
<strong>Kemira</strong> Agro U.K. Ltd<br />
<strong>Kemira</strong> Ltd<br />
<strong>Kemira</strong> Ireland Ltd<br />
<strong>Kemira</strong> S.A./N.V.<br />
Battaille S.A.<br />
Engrais Battaille S.A.<br />
<strong>Kemira</strong> Engrais S.A.<br />
<strong>Kemira</strong> Agro Holding B.V.<br />
<strong>Kemira</strong> B.V.<br />
<strong>Kemira</strong> Pernis B.V.<br />
Kencica Speciaalmeststoffen B.V.<br />
<strong>Kemira</strong> Deutschland GmbH<br />
Comercial de Fertilizantes Liquidos S.A.<br />
Viljavuuspalvelu Oy<br />
Mykora Oy<br />
A. Jalander Oy<br />
A. Jalander Eesti Oü<br />
SiA <strong>Kemira</strong> Agro Latvija<br />
ZAO <strong>Kemira</strong> Agro<br />
<strong>Kemira</strong> Agro Poland Sp. z o.o.<br />
<strong>Kemira</strong> Sdn. Bhd.<br />
<strong>Kemira</strong> Agro Hungary Ltd Co.<br />
AS <strong>Kemira</strong> Agro Eesti<br />
UAB <strong>Kemira</strong> Agro Vilnius<br />
AS Fertimix<br />
Biolchim S.p.A. 2)<br />
Tikkurila Oy<br />
Tikkurila Paints Oy<br />
AS Baltic Color<br />
UAB Baltic Color<br />
ZAO Finncolor<br />
OOO Kraski Tikkurila<br />
Tikkurila Festék KFT<br />
Imagica Ltd<br />
Spetra S.r.l.<br />
A/S Baltic Color 2)<br />
Tikkurila Baltcolor Sp. z o.o. 3)<br />
Tikkurila Coatings Oy<br />
<strong>Kemira</strong> Coatings Ltd 5)<br />
<strong>Kemira</strong> Coatings (Ireland) Ltd 6)<br />
Northern Universal Coatings Ltd<br />
Industrial Coatings Eastern Ltd<br />
Industrial Coatings Northern Ltd<br />
Industrial Coatings Western Ltd<br />
Southern Coatings and Services Ltd<br />
Universal Surface Coatings Ltd<br />
Chiltern Surface Coatings Ltd<br />
Dickursby Färg AB 3)<br />
Tikkurila Ltd<br />
Becker Acroma Ltd 2)<br />
Becker Acroma (Ireland) Ltd 2)<br />
AS Tikkurila Coatings<br />
Tikkurila Coatings KFT<br />
ZAO Tikkurila Coatings<br />
Tikkurila Coatings GmbH<br />
Tikkurila CPS Oy<br />
Winter-Bouts B.V.<br />
70
= production<br />
= marketing<br />
= holding<br />
= service<br />
<strong>Kemira</strong> Chemicals<br />
<strong>Kemira</strong> Pigments<br />
<strong>Kemira</strong> Agro<br />
Tikkurila<br />
Other<br />
lding<br />
%<br />
Location<br />
Company Group holding Location<br />
%<br />
100 Finland, Helsinki <br />
100 United Kingdom, Ince <br />
100 United Kingdom, Ince <br />
100 United Kingdom, Ince <br />
100 Ireland, Dublin <br />
100 Belgium, Wavre <br />
100 Belgium, Basècles <br />
100 Belgium, France, Fresnes s/ Escaut <br />
100 France, Ribécourt <br />
100 The Netherlands, Vondelingenplaat Rt <br />
100 The Netherlands, Vondelingenplaat Rt <br />
100 The Netherlands, Vondelingenplaat Rt<br />
100 The Netherlands, Maastricht <br />
100 Germany, Hannover <br />
50 Spain, Valencia <br />
80 Finland, Mikkeli <br />
100 Finland, Kiukainen <br />
100 Finland, Muurla <br />
100 Estonia, Tallinn <br />
100 Latvia, Riga <br />
100 Russia, Moscow <br />
100 Poland, Warsaw <br />
100 Malaysia, Kuala Lumpur <br />
100 Hungary, Hódmezóvásárhely <br />
100 Estonia, Tallinn <br />
100 Lithuania, Vilnius <br />
100 Estonia, Tallinn <br />
50 Italy, Bologna <br />
100 Finland, Vantaa <br />
100 Finland, Vantaa <br />
50 Estonia, Tallinn <br />
50 Lithuania, Vilnius <br />
100 Russia, St. Petersburg <br />
100 Russia, Moscow <br />
100 Hungary, Budapest <br />
100 United Kingdom, Uxbridge <br />
100 Italy, Modena <br />
50 Latvia, Riga <br />
60 Poland, Sczcecin <br />
100 Finland, Vantaa <br />
100 United Kingdom, Bury <br />
100 Ireland, Cork <br />
100 United Kingdom, Heywood <br />
100 United Kingdom, Colchester <br />
100 United Kingdom, North Shields <br />
75 United Kingdom, Bristol <br />
75 United Kingdom, Sutton <br />
100 United Kingdom, Sutton-in-Ashfield <br />
100 United Kingdom, Aylesbury <br />
100 Sweden, Spånga <br />
100 United Kingdom, Haverhill <br />
50 United Kingdom, Haverhill <br />
50 Ireland, Bray <br />
100 Estonia, Tallinn <br />
100 Hungary, Budapest <br />
100 Russia, St. Petersburg <br />
100 Germany, Hanau <br />
100 Finland, Vantaa <br />
100 The Netherlands, Sittard <br />
<strong>Kemira</strong> Color B.V. 7) 100 The Netherlands, Dordrecht <br />
Winter-Bouts GmbH 100 Germany, Hamburg <br />
Winter-Bouts South Africa (Pty) Ltd 100 South Africa, Edenvale <br />
Tikkurila Ltda 100 Brazil, São Paulo <br />
Tikkurila Pty Ltd 100 Australia, Wetherill Park <br />
Corob International AG 50 Switzerland, Aarau <br />
Corob Oy 50 Finland, Ulvila <br />
Corob Color Robots B.V. 50 Holland, Eindhoven <br />
Corob S.p.A. 50 Italy, Modena <br />
Corob Scandinavia AB 50 Sweden, Gothenburg <br />
Corob CPS Service Systems Ltd 50 United Kingdom, Henley <br />
Corob Sudamericana S.A. 50 Uruguay, Montevideo <br />
Corob North America Inc. 50 United States, Charlotte, NC <br />
Corob Ltd 50 Hong Kong <br />
Matherson S.p.A. 100 Italy, Bergamo <br />
Tikkurila Inc. 100 United States, Philadelphia, PA <br />
Tikkurila CPS (SEA) Pte Ltd 100 Singapore <br />
Tikkurila Services Oy 100 Finland, Vantaa <br />
<strong>Kemira</strong> Engineering Oy 4) 100 Finland, Helsinki <br />
<strong>Kemira</strong> Metalkat Oy 100 Finland, Laukaa <br />
Metpela Oy 100 Finland, Laitila <br />
Convertitori Catalitici Europa S.r.l. 100 Italy, Genova <br />
<strong>Kemira</strong> Katalysatoren GmbH 100 Germany, Wiesbaden <br />
<strong>Kemira</strong> Safety Oy 100 Finland, Vaasa <br />
<strong>Kemira</strong> Safety Ltd 100 United Kingdom, Bromsgrove <br />
<strong>Kemira</strong> Danmark Holding A/S 100 Denmark, Fredericia <br />
<strong>Kemira</strong> Danmark A/S 100 Denmark, Fredericia <br />
<strong>Kemira</strong> Miljö A/S 100 Denmark, Esbjerg <br />
1)<br />
Owned in equal shares by <strong>Kemira</strong> Pigments Oy and <strong>Kemira</strong> Pigments B.V.<br />
2)<br />
Joint venture.<br />
3)<br />
Owned in equal shares by Tikkurila Coatings Oy and Tikkurila Paints Oy.<br />
4)<br />
Owned in equal shares by <strong>Kemira</strong> Chemicals Oy, <strong>Kemira</strong> Pigments Oy and <strong>Kemira</strong> Agro Oy.<br />
5)<br />
From 1 January 2000 Tikkurila Coatings Ltd<br />
6)<br />
From 1 January 2000 Tikkurila Coatings (Ireland) Ltd<br />
7)<br />
From 1 January 2000 Tikkurila Coatings B.V.<br />
Companies not operative in <strong>1999</strong> are excluded.<br />
71
ADDRESSES<br />
FINLAND<br />
KEMIRA OYJ<br />
Porkkalankatu 3<br />
P.O. Box 330<br />
00101 Helsinki<br />
Tel. +358 10 8611<br />
Fax +358 10 862 1119<br />
www.kemira.com<br />
KEMIRA CHEMICALS OY<br />
Porkkalankatu 3<br />
P.O. Box 330<br />
00101 Helsinki<br />
Tel. +358 10 861 211<br />
Fax +358 10 862 1124<br />
KEMIRA CHEMICALS OY<br />
P.O. Box 20<br />
71801 Siilinjärvi<br />
Tel. +358 10 861 215<br />
Fax +358 10 862 6000<br />
KEMIRA CHEMICALS OY<br />
P.O. Box 171<br />
90101 Oulu<br />
Tel. +358 10 861 214<br />
Fax +358 10 862 5000<br />
KEMIRA CHEMICALS OY<br />
Research Centre<br />
P.O. Box 171<br />
90101 Oulu<br />
Tel. +358 10 861 214<br />
Fax +358 10 862 5678<br />
KEMIRA CHEMICALS OY<br />
P.O. Box 74<br />
67101 Kokkola<br />
Tel. +358 10 861 217<br />
Fax +358 10862 8000<br />
KEMIRA CHEMICALS OY<br />
P.O. Box 500<br />
65101 Vaasa<br />
Tel. +358 10 861 216<br />
Fax +358 10 862 7000<br />
KEMIRA CHEMICALS OY<br />
29200 Harjavalta<br />
Tel. +358 10 861 517<br />
Fax +358 10 862 4000<br />
KEMIRA FINE CHEMICALS OY<br />
Porkkalankatu 3<br />
P.O. Box 330<br />
00101 Helsinki<br />
Tel. +358 10 861 219<br />
Fax +358 10 862 1624<br />
KEMWATER SERVICES OY<br />
P.O. Box 330<br />
00101 Helsinki<br />
Tel +358 10 861 211<br />
Fax +358 10 862 1968<br />
KEMIRA PIGMENTS OY<br />
Porkkalankatu 3<br />
P.O. Box 330<br />
00101 Helsinki<br />
Tel. +358 10 861 414<br />
Fax +358 10 862 1794<br />
KEMIRA PIGMENTS OY<br />
28840 Pori<br />
Tel. +358 2 628 1000<br />
Fax +358 2 628 1149<br />
KEMIRA AGRO OY<br />
Porkkalankatu 3<br />
P.O. Box 330<br />
00101 Helsinki<br />
Tel. +358 10 861 511<br />
KEMIRA AGRO OY<br />
Espoo Research Centre<br />
Luoteisrinne 2<br />
P.O. Box 44<br />
02271 Espoo<br />
Tel. +358 10 861 516<br />
Fax +358 10 862 2000<br />
KEMIRA AGRO OY<br />
P.O. Box 5<br />
23501 Uusikaupunki<br />
Tel. +358 10 861 518<br />
Fax +358 10 862 3000<br />
KEMIRA AGRO OY<br />
29200 Harjavalta<br />
Tel. +358 10 86 1517<br />
Fax +358 10 86 24219<br />
TIKKURILA OY<br />
P.O. Box 53, Kuninkaalantie 1<br />
01301 Vantaa<br />
Tel. +358 9 857 721<br />
Fax +358 9 8577 6900<br />
www.tikkurila.fi<br />
TIKKURILA PAINTS OY<br />
P.O. Box 53, Kuninkaalantie 1<br />
01301 Vantaa<br />
Tel. +358 9 857 731<br />
Fax +358 9 8577 6902<br />
TIKKURILA COATINGS OY<br />
P.O. Box 53, Kuninkaalantie 1<br />
01301 Vantaa<br />
Tel. +358 9 857 741<br />
Fax +358 9 8577 6911<br />
TIKKURILA CPS OY<br />
P.O. Box 53, Kuninkaalantie 1<br />
01301 Vantaa<br />
Tel. +358 9 857 751<br />
Fax +358 9 8577 6904<br />
TIKKURILA SERVICES OY<br />
P.O. Box 53, Kuninkaalantie 1<br />
01301 Vantaa<br />
Tel. +358 9 857 721<br />
Fax +358 9 8577 6915<br />
COROB OY<br />
Sammontie 5<br />
28400 Ulvila<br />
Tel. +358 2 677 7700<br />
Fax +358 2 677 7701<br />
KEMIRA ENGINEERING OY<br />
Porkkalankatu 3<br />
P.O. Box 330<br />
00101 Helsinki<br />
Tel. +358 10 861 616<br />
Fax +358 10 862 1127<br />
KEMIRA METALKAT OY<br />
P.O. Box 20<br />
41331 Vihtavuori<br />
Puh. +358 10 861 1717<br />
Fax +358 10 863 5000<br />
KEMIRA SAFETY OY<br />
P.O. Box 501<br />
65101 Vaasa<br />
Tel. +358 10 861 811<br />
Fax +358 10 863 6591<br />
METPELA OY<br />
Turuntie 41<br />
23800 Laitila<br />
Tel. +358 2 85 731<br />
Fax +358 2 856 305<br />
VILJAVUUSPALVELU OY<br />
Graanintie 7, P.O. Box 500<br />
50101 Mikkeli<br />
Tel. +358 15 320 400<br />
Fax +358 15 320 4050<br />
A. JALANDER OY<br />
Muurlantie 101 B<br />
25130 Muurla<br />
Tel. +358 2 728 050<br />
Fax +358 2 728 0520<br />
MYKORA OY<br />
27400 Kiukainen<br />
Tel. +358 2 8387 7000<br />
Fax +358 2 8387 7011<br />
ALGERIA<br />
KEMIRA ALGÉRIE, SPA<br />
1, Rue Doudon Mokntar<br />
Ben Aknoum, Alger<br />
Tel. 999 213 2 912 100<br />
Fax 999 213 2 912 069<br />
AUSTRALIA<br />
TIKKURILA PTY LTD<br />
P.O. Box 7110<br />
33–35 Redfern Street<br />
Wetherill Park, NSW 2164<br />
Tel. +61 2 9604 8300<br />
Fax +61 2 9604 8333<br />
AUSTRIA<br />
KEMIRA CHEMIE GES.MBH<br />
Mariahilfer Strasse 103<br />
A-1060 Wien<br />
Tel. +43 1 597 3767<br />
Fax +43 1 597 376 720<br />
BELGIUM<br />
KEMIRA PIGMENTS S.A.<br />
Avenue Einstein 11<br />
B-1300 Wavre<br />
Tel. +32 10 232 700<br />
Fax +32 10 229 892<br />
KEMIRA S.A./N.V.<br />
Avenue Einstein 11<br />
B-1300 Wavre<br />
Tel. +32 10 232 711<br />
Fax +32 10 228 988<br />
KEMIRA S.A./N.V.<br />
P.O. Box 6<br />
Rue de la Carbo<br />
B-7333 Tertre<br />
Tel. +32 65 712 211<br />
Fax +32 65 641 917<br />
BATTAILLE S.A.<br />
Rue Octave Battaille, 192<br />
B-7971 Basècles<br />
Tel. +32 69 778 521<br />
Fax +32 69 771 347<br />
BRAZIL<br />
KEMWATER BRASIL S.A.<br />
Estrada Particular<br />
Eiji Kikuti, 397<br />
Cooperativa<br />
São Bernardo do Campo - SP<br />
CEP 09852-040<br />
Tel. +55 11 4392 4400<br />
Fax +55 11 4392 4400<br />
TIKKURILA LTDA<br />
Rua Vieira de Morais, 1558<br />
04617-005 – Campo Belo<br />
São Paulo – SP<br />
Tel. +55 11 5561 7122<br />
Fax +55 11 543 0553<br />
CANADA<br />
KEMIRA CHEMICALS CANADA<br />
INC.<br />
1380 County Rd. No 2,<br />
P.O. Box 615<br />
Canada KOE IPO<br />
Tel. +1 613 348 7711<br />
Fax +1 613 348 7700<br />
CHILE<br />
KEMIRA PIGMENTS LATIN<br />
AMERICA COMERCIAL<br />
LIMITADA<br />
Luis Thayer Ojeda 166 Of. 504<br />
Providencia<br />
Santiago<br />
Tel. +56 2 234 0977<br />
Fax +56 2 232 8587<br />
CHINA<br />
KEMWATER<br />
(YIXING) CO., LTD<br />
Nanyue Village,<br />
China Yixing Industrial Park<br />
CN-214205 Yixing City<br />
Puh. +86 510 7062090/800<br />
Fax +86 510 7063284<br />
KEMIRA AGRO OY BEIJING<br />
REPRESENTATIVE OFFICE<br />
Room 802, Scite Tower<br />
No. 22, Jianguomenwai Ave.<br />
100004 Beijing<br />
Tel. +86 10 6512 3321<br />
Fax +86 10 6512 3320<br />
KEMIRA COMPOUND<br />
FERTILISER (ZHANJIANG)<br />
CO., LTD<br />
No, 11 Huguang Road<br />
Zhanjiang<br />
524012 Guangdong<br />
Tel. +86 759 221 2214<br />
Fax +86 759 228 6207<br />
COROB Ltd<br />
Room 403, 4/F.<br />
Printing House<br />
6 Duddell Street Central<br />
Hong Kong<br />
Tel. +852 2557 8108<br />
Fax +852 2566 7160<br />
TIKKURILA CPS OY<br />
Representative Office<br />
No 93–7 of 2nd Quanyuan Rd.<br />
Dongling District<br />
110015 Shenyang City<br />
Tel. +86 24 2423 0438<br />
Fax +86 24 2323 7108<br />
CZECH REPUBLIC<br />
KEMIFLOC A.S.<br />
Nábr. Dr E Benese 24<br />
CZ 75062 Prerov<br />
Tel. +420 641 253 032<br />
Fax +420 641 253 033<br />
KEMWATER PROCHEMIE s.r.o.<br />
Úpravna vody Bradlec<br />
CZ-293 06 Kosmonosy<br />
Tel. +420 326 724 034<br />
Fax +420 326 724 030<br />
DENMARK<br />
KEMIRA MILJØ A/S<br />
Måde Industrivej 19<br />
DK-6705 Esbjerg<br />
Tel. +45 7545 2555<br />
Fax +45 7545 2575<br />
KEMIRA DANMARK A/S<br />
Kongensgade 107<br />
Box 167<br />
DK-7000 Fredericia<br />
Tel. +45 7922 3366<br />
Fax +45 7922 3322<br />
KEMIRA AGRO OY<br />
(Copenhagen office)<br />
Dronningens Tvaergade 9, 3. fl.<br />
DK1302 Copenhagen<br />
Denmark<br />
Tel. +45 3336 0545<br />
Fax +45 3336 0547<br />
ESTONIA<br />
AS KEMIVESI<br />
Filtri tee 9A<br />
EE-10132 Tallinn<br />
Tel. +372 601 4206<br />
Fax +372 601 4203<br />
KEMIRA AGRO EESTI AS<br />
Merivälja tee 5<br />
EE 11911 Tallinn<br />
Tel. +372 6 300 155<br />
Fax +372 6 300 157<br />
AS BALTIC COLOR<br />
Liimi 5<br />
10621 Tallinn<br />
Tel. +372 6 501 100<br />
Fax +372 6 501 110<br />
AS TIKKURILA COATINGS<br />
Liimi 5<br />
10621 Tallinn<br />
Tel. +372 6 598 950<br />
Fax +372 6 598 951<br />
FRANCE<br />
KEMIRA CHIMIE S.A.<br />
Route de Mothern<br />
F-67630 Lauterbourg<br />
Tel. +33 38854 9850<br />
Fax +33 38854 9851<br />
KEMIRA CHIMIE S.A.<br />
207, Rue de Bercy<br />
F-75012 Paris<br />
Tel. +33 1 4346 2260<br />
Fax +33 1 4346 2269<br />
KEMIRA ENGRAIS S.A.<br />
Marché d’Intérêt National 80<br />
F-84953 Cavaillon Cedex<br />
Tel. +33 9071 0333<br />
Fax +33 9071 4567<br />
GERMANY<br />
KEMIRA CHEMIE GMBH<br />
Langstrasse 60<br />
D-63450 Hanau<br />
Tel. +49 6181 92 470<br />
Fax +49 6181 924 720<br />
KEMIRA PIGMENTE GMBH<br />
Langstrasse 60<br />
D-63450 Hanau<br />
Tel. +49 6181 924728<br />
Fax +49 6181 924730<br />
KEMIRA DEUTSCHLAND GMBH<br />
Postfach 51 07 20<br />
D-30637 Hannover 51<br />
Tel. +49 511 647 4620<br />
Fax +49 511 647 4625<br />
KEMIRA KATALYSATOREN<br />
GMBH<br />
Friedrichstrasse 55<br />
D-65185 Wiesbaden<br />
Tel. +49 611 992 420<br />
Fax +49 611 992 4299<br />
HUNGARY<br />
KEMIRA PIGMENTS KFT.<br />
Bécsi út 25.<br />
H-1023 Budapest<br />
Hungary<br />
Tel. +36 1 346 7070<br />
Fax +36 1 346 7072<br />
KEMIRA AGRO HUNGARY LTD.<br />
CO.<br />
Vöröskereszt street 6<br />
H-6800 Hódmezóvásárhely<br />
Tel. +36 62 245 404<br />
Fax +36 62 242 183<br />
TIKKURILA COATINGS KFT.<br />
Ecseri út 14–16<br />
H-1097 Budapest<br />
Tel. +36 1 280 8825<br />
Fax +36 1 280 6739<br />
TIKKURILA FESTÉK KFT.<br />
Gyáli út 27-29<br />
H-1097 Budapest<br />
Tel. +36 1 280 8825<br />
Fax +36 1 280 6739<br />
KEMIRA CHEMACALS<br />
HUNGÁRIA KFT<br />
Bécsi út 25<br />
HU-1023 Budapest<br />
Tel. +36 1 346 70 75, -76<br />
Fax +36 1 346 70 77<br />
INDIA<br />
COROB INDIA PVT. LTD.<br />
Warden House, 1st Floor<br />
Sir P. M. Road, Fort<br />
Mumbai 400 001<br />
Tel. +91 22 287 2295<br />
Fax +91 22 287 3475<br />
INDONESIA<br />
KEMIRA CHEMICALS<br />
REPRESENTATIVE OFFICE<br />
JI. Jatiwaringin Raya 54<br />
Pondok Gede 17411<br />
Jawa Barat<br />
Tel. +62 21 8499 0250<br />
Fax +62 21 8499 0251<br />
KEMIRA AGRO OY<br />
REPRESENTATIVE OFFICE<br />
Mr Asul Amru<br />
JI. Jatiwaringin Raya 54<br />
Pondok Gede 17411<br />
Tel. +62 21 8499 5628<br />
Fax +62 21 8499 5626<br />
IRELAND<br />
TIKKURILA COATINGS<br />
(IRELAND) LTD<br />
Unit B1, Marina<br />
Centrepoint<br />
Cork city<br />
Tel. +353 21 310 675<br />
Fax +353 21 310 671<br />
ITALY<br />
KEMIRA CHIMICA S.p.A.<br />
Via Rosellini 12<br />
I-20124 Milano<br />
Tel. +39 02 693 3901<br />
Fax +39 02 693 39050<br />
BIOLCHIM S.p.A.<br />
Via S. Carlo, 2130<br />
40059 Medicina<br />
Bologna<br />
Tel. +39 051 850 150<br />
Fax +39 051 852 884<br />
COROB S.p.A.<br />
Via Agricoltura, 103<br />
41038 San Felice s/P<br />
Modena<br />
Tel. +39 0535 6630<br />
Fax +39 0535 663 600<br />
MATHERSON S.p.A.<br />
Via Olimpia, 2<br />
24030 Presezzo<br />
Bergamo<br />
Tel. +39 035 468 711<br />
Fax +39 035 611 644<br />
SPETRA S.r.L.<br />
Via Venezia, 14/A<br />
41034 Finale Emilia<br />
Modena<br />
Tel. +39 0535 92 530<br />
Fax +39 0535 93 400<br />
CCE-CONVERTITORI<br />
CATALITICI EUROPA S.R.L.<br />
Via Colano 9A/14D<br />
16162 Genova (GE)<br />
Tel. +39 010 726 1653<br />
Fax +39 010 726 1690<br />
JAPAN<br />
KEMIRA-UBE, LTD.<br />
Ube Building<br />
3-11, Higashi-shinagawa<br />
Shinagawa-ku<br />
Tokyo, 140<br />
Tel. +81 3 5460 3365<br />
Fax +81 3 5460 3442<br />
KEMIRA-UBE, LTD.<br />
Ube Plant<br />
2575 Ohaza Fujimagari<br />
Ube-City<br />
Yamaguchi Prefecture 755<br />
Tel. +81 836 353 000<br />
Fax +81 836 352 288<br />
K0REA<br />
KEMIRA CHEMICALS<br />
KOREA CORPORATION<br />
Kukje Building 13 th Floor<br />
111, Da-dong, Choong-ku<br />
Seoul, 100-180 Korea<br />
Tel. +82 2 318 3770<br />
Fax +82 2 318 3776<br />
72
KEMIRA CHEMICALS<br />
KOREA CORP.,<br />
ULSAN PLANT<br />
482-3, Sangge-dong,<br />
Nam-ku 680-180<br />
Ulsan<br />
Tel. +82 52 270 4000<br />
Fax +82 52 270 4009<br />
LATVIA<br />
SIA KEMIRA AGRO LATVIJA<br />
Dzirnavu iela 140<br />
702.ist<br />
LV-1050 Riga<br />
Tel. +371 7 212 512<br />
Fax +371 7 830 280<br />
A/S BALTIC COLOR<br />
Kruzes 3<br />
Riga LV-1046<br />
Tel. +371 7 611 131<br />
Fax +371 7 617 531<br />
LITHUANIA<br />
UAB KEMIRA AGRO VILNIUS<br />
Smelio 8<br />
2055 Vilnius<br />
Tel. +370 2 709 175<br />
Fax +370 2 709 770<br />
UAB KEMIRA LIFOSA<br />
Juodkiskio 50<br />
LT-5030 Kedainiai<br />
Tel. +370 57 60111<br />
Fax +370 57 60 424<br />
UAB BALTIC COLOR<br />
Sietyno g. 8<br />
2050 Vilnius<br />
Tel. +370 2 706 413<br />
Fax +370 2 706 414<br />
MALAYSIA<br />
KEMIRA SDN. BHD.<br />
Level 12A, Lot 1202A<br />
Uptown 3<br />
No.3, Jalan SS21/39<br />
Damansara Uptown<br />
47400 Petaling Jaya<br />
Selangor Darul Ehsan<br />
Malaysia<br />
Tel. +60 3 716 4181<br />
Fax +60 3 712 2479<br />
KEMIRA-KUOK FERTILIZERS<br />
SDN. BHD.<br />
4th Floor, Kompleks Kemajuan<br />
No. 2 Jalan 19/1B,<br />
46300 Petaling Jaya<br />
Selangor Darul Ehsan<br />
Tel. +60 3 757 7644<br />
Fax +60 3 757 7670<br />
MEXICO<br />
KEMWATER DE MEXICO, S.A.<br />
DE C.V.<br />
Carretera Xoxtla-Tlaltenango<br />
S/N<br />
San Miguel Analco<br />
MX-90729 Nativitas, Tlaxcala<br />
Tel. +52 1 2 281 5336<br />
Fax +52 1 2 281 5366<br />
NETHERLANDS<br />
KEMIRA CHEMICALS B.V.<br />
P.O. Box 1015<br />
NL-3180 AA Rozenburg<br />
Tel. +31 10 295 2540<br />
Fax +31 295 2536<br />
KEMWATER B.V.<br />
P.O. Box 1015<br />
NL-3180 AA Rozenburg<br />
Tel. +31 181 281 320<br />
Fax +31 181 281 330<br />
KEMAX B.V.<br />
Oosterhorn 4<br />
P.O. Bax 124<br />
NL-9930 AC Delfzijl<br />
Tel. +31 596 647 550<br />
Fax +31 596 648 173<br />
KEMIRA PIGMENTS B.V.<br />
Prof. Gerbrandyweg 2<br />
3197 KK Rotterdam<br />
P.O. Box 1013<br />
NL-3180 AA Rozenburg<br />
Tel. +31 181 246600<br />
Fax +31 181 213169<br />
KEMIRA AGRO<br />
ROZENBURG B.V.<br />
Moezelweg 151<br />
P.O. Box 6105<br />
NL-3196 ZG Vondelingenplaat Rt.<br />
Tel. +31 10 295 2911<br />
Fax +31 10 295 2374<br />
KEMIRA AGRO PERNIS B.V.<br />
Vondelingenplaat 17<br />
P.O. Box 6105<br />
NL-3196 ZG Vondelingenplaat Rt.<br />
Tel. +31 10 295 2911<br />
Fax +31 10 295 2374<br />
MULTIRANGE B.V.<br />
P.O. Box 6105<br />
NL-3196 ZG Vondelingenplaat Rt.<br />
Tel. +31 10 295 2911<br />
Fax +31 10 295 2374<br />
TIKKURILA COATINGS B.V.<br />
P.O. Box 83<br />
Mijlweg 65<br />
NL-3300 AB Dordrecht<br />
Tel. +31 78 652 7599<br />
Fax +31 78 651 0886<br />
WINTER-BOUTS B.V.<br />
P.O. Box 809<br />
NL-6130 AV Sittard<br />
Nusterweg 98<br />
NL-6136 KV Sittard<br />
Tel. +31 46 457 0100<br />
Fax +31 46 457 0150<br />
NORWAY<br />
KEMIRA CHEMICALS AS<br />
Box 1177<br />
N-1631 Gamle Fredrikstad<br />
Tel. +47 69 358 585<br />
Fax +47 69 358 595<br />
KEMIRA CHEMICALS AS<br />
Veritasvn. 1<br />
N-1322 Høvik<br />
Tel. +47 67 565 870<br />
Fax +47 67 565 888<br />
PHILIPPINES<br />
KEMWATER PHIL. CORP.<br />
Chemphil Building,<br />
851 Antonio Arnaiz Avenue,<br />
H4-1229 Makati City<br />
Tel. +63 2 818 8711<br />
Fax +63 2 817 4851<br />
POLAND<br />
KEMIPOL LTD.<br />
ul. Kuznicka 6<br />
PL-72010 Police<br />
Tel. +48 91 317 3220<br />
Fax +48 91 317 3120<br />
KEMIRA AGRO<br />
POLAND Sp. z o.o.<br />
ul. Migdazowa 4<br />
02-796 Warszawa<br />
Tel. +48 22 645 1465<br />
Fax +48 22 645 1721<br />
TIKKURILA BALTCOLOR<br />
Sp. z o.o.<br />
Ul. Ksiedza Kujota 16<br />
70-605 Szczecin<br />
Tel. +48 91 462 4606<br />
Fax +48 91 462 4343<br />
PORTUGAL<br />
ALIADA QUIMICA DE<br />
PORTUGAL LTDA<br />
Quinta da Industria,<br />
Beduido PT-3860 Estarreja<br />
Tel. +351 2 348 10 300<br />
Fax +351 2 348 10 306<br />
ROMANIA<br />
KEMWATER CRISTAL S.A.<br />
Str. Muncii Nr 14<br />
Fundulea<br />
Calarasi County Cod. 8264<br />
Tel./Fax 40 42 317 141<br />
RUSSIA<br />
ZAO KEMIRA AGRO<br />
p. Koteljniki-1<br />
Ljuberetskij rajon<br />
140053, Moskovskaja oblastj<br />
Tel. +7 095 550 6478<br />
ZAO FINNCOLOR<br />
Pr. 9-go Yanvarya, d.15<br />
192289 St. Peterburg<br />
Tel. +7 812 172 6348<br />
Fax +7 812 172 6348<br />
TIKKURILA COATINGS ZAO<br />
Pr. 9-go Yanvarya, d.15<br />
192289 St. Peterburg<br />
Tel. +7 812 101 4413<br />
Fax +7 812 101 4413<br />
SINGAPORE<br />
KEMIRA PIGMENTS<br />
ASIA PACIFIC PTE. LTD.<br />
10 Anson Road<br />
International Plaza #33-06A<br />
Singapore 079 903<br />
Tel. +65 227 1757<br />
Fax +65 227 1613<br />
TIKKURILA CPS (SEA)<br />
PTE LTD<br />
No. 4, Tuas Link 1<br />
Singapore 638591<br />
Tel. +65 890 2600<br />
Fax +65 890 2626<br />
SOUTH AFRICA<br />
WINTER-BOUTS B.V.<br />
P.O. Box 1659<br />
1610 Edenvale<br />
57 Brunton Circle<br />
Founders View South<br />
Edenvale<br />
Tel. +27 11 609 0118<br />
Fax +27 11 609 0559<br />
SPAIN<br />
KEMIRA IBÉRICA, S.A.<br />
Gran Via Corts Catalanes, 641<br />
E-08010 Barcelona<br />
Tel. +34 93 412 3050<br />
Fax +34-93 412 0884<br />
COMERCIAL DE FERTILI-ZANTES<br />
LIQUIDOS S.A.<br />
Avda Alicante, 20<br />
E-46460 Silla (Valencia)<br />
Tel. +34 6 121 05 40<br />
Fax +34 6 120 04 58<br />
SWEDEN<br />
KEMIRA KEMI AB<br />
Box 902<br />
S-251 09 Helsingborg<br />
Tel. +46 42 171 000<br />
Fax +46 42 140 635<br />
ALUFLUOR AB<br />
Box 902<br />
S-251 09 Helsingborg<br />
Tel. +46 42 171 020<br />
Fax +46 42 135 285<br />
KEMWATER NÄRKE AB<br />
Kvarntorp<br />
S-692 92 Kumla<br />
Tel. +46 19 585 700<br />
Fax +46 19 585 710<br />
KEMIRA PIGMENTS AB<br />
Box 902<br />
Industrigatan 83<br />
S-251 09 Helsingborg<br />
Tel. +46 42 171 081<br />
Fax +46 42 171 084<br />
DICKURSBY FÄRG AB<br />
Box 3014<br />
Arrendevägen 36<br />
S-163 03 Spånga<br />
Tel. +46 8 598 916 00<br />
Fax +46 8 598 917 00<br />
THAILAND<br />
KEMWATER<br />
(THAILAND) CO. LTD<br />
Metro Building<br />
180-184 Rajawongse Road Bangkok,<br />
10100<br />
Tel. +66 2 622 6461<br />
Fax +66 2 622 6460<br />
KEMIRA THAI CO., LTD<br />
Metro Building, 7th floor<br />
180-184 Rajawongse Road Bangkok,<br />
10100<br />
Tel. +66 2 226 3871<br />
Fax +66 2 224 5672<br />
TURKEY<br />
KEMWATER DIPER ENV.<br />
CHEMICALS A.S.<br />
P.O. Box 42<br />
Kemalpasa<br />
TR-35171 Izmir<br />
Tel. 90 232 877 1243<br />
Fax 90 232 877 1244<br />
UNITED KINGDOM<br />
IMAGICA LTD<br />
3 Gregories Court,<br />
Gregories Rd.<br />
Beacousfield<br />
Buckinghamshire HP9 1HQ<br />
Tel. +44 1494 689 700<br />
Fax +44 1494 689 701<br />
KEMIRA<br />
CHEMICALS (UK) LTD<br />
Orm House<br />
2 Hookstone Park<br />
Harrogate<br />
N Yorkshire HG2 8QT<br />
Tel. +44 1423 885 005<br />
Fax +44 1423 885 939<br />
KEMIRA<br />
CHEMICALS (UK) LTD<br />
Kemwater<br />
New Potter Grande Road<br />
MG2 Trading Estate<br />
Goole DN14 6BZ<br />
Tel. +44 1405 765 131<br />
Fax +44 1405 765 147<br />
KEMIRA AGRO U.K. LTD<br />
Ince<br />
Chester CH2 4LB<br />
Tel. +44 151 357 2777<br />
Fax +44 151 357 1755<br />
KEMIRA N.I. LTD<br />
5 Ballygowan Road<br />
Hillsborough<br />
Co. Down BT26 6HX<br />
Tel. +44 1846 682 121<br />
Fax +44 1846 683 189<br />
TIKKURILA COATINGS LTD<br />
(Protective Coatins)<br />
Warth Mills, Radcliffe Road<br />
Bury<br />
Lancashire BL9 9NB<br />
Tel. +44 161 764 6017<br />
Fax +44 161 764 6102<br />
TIKKURILA COATINGS LTD<br />
(DEM Industrial)<br />
Kelvin Way<br />
West Bromwich<br />
West Midlands B70 7JZ<br />
Tel. +44 121 525 5665<br />
Fax +44 121 553 2787<br />
KEMIRA SAFETY LTD<br />
Unit 14 B<br />
Harris Business Park<br />
Hanbury Road<br />
Stoke Prior<br />
Bromsgrove B60 4EH<br />
Tel. +44 1527 579 990<br />
Fax +44 1527 579 991<br />
UAE<br />
UNION KEMIRA PLANT<br />
P.O. Box 16938,<br />
Jebel Ali Free Zone<br />
Dubai<br />
Tel. +971 4 815 139<br />
Fax +971 4 815 399<br />
UNITED STATES<br />
KEMIRA PAPER CHEMICALS,<br />
INC.<br />
P.O. Box 368<br />
Savannah, GA 31402<br />
Tel. +1 800 688 5992<br />
Fax +1 912 652 1160<br />
KEMIRA PIGMENTS INC.<br />
P.O. Box 368<br />
Savannah, GA 31402<br />
Tel. +1 912 652 1000<br />
Fax +1 912 652 1184<br />
COROB<br />
NORTH AMERICA INC.<br />
13315-G Carowinds Blvd.<br />
Charlotte, NC 28273<br />
Tel. +1 704 588 8408<br />
Fax +1 704 588 8471<br />
TIKKURILA INC.<br />
7600 State Road<br />
Philadelphia, PA 19136<br />
Tel. +1 215 335 7331<br />
Fax +1 215 335 7354<br />
URUGUAY<br />
COROB SUDAMERICANA S.A.<br />
Cardal 3092<br />
C.P. 11600<br />
Montevideo<br />
Tel. +598 2 487 0732<br />
Fax +598 2 487 0736<br />
73
Production<br />
Sales<br />
74
Graphic design and layout by Matti Savimaa, printed by Sävypaino ISO 9002 2000