A Passion for Solutions
A Passion for Solutions
A Passion for Solutions

You also want an ePaper? Increase the reach of your titles
YUMPU automatically turns print PDFs into web optimized ePapers that Google loves.
Annual Report 2004<br />
A <strong>Passion</strong> <strong>for</strong> <strong>Solutions</strong>
A <strong>Passion</strong> <strong>for</strong><br />
<strong>Solutions</strong><br />
The best brains <strong>for</strong> the most convincing<br />
ideas: That’s the motto which<br />
Panalpina’s 13,000 employees follow<br />
day in day out in seeking intelligent<br />
solutions to the highly demanding <strong>for</strong>warding<br />
and logistics problems of<br />
their customers around the globe. And<br />
they do so with passion.<br />
As one of the world’s leading providers<br />
of <strong>for</strong>warding and logistics services, this<br />
global Swiss-based group specializes<br />
in intercontinental air freight and ocean<br />
freight consignments and the associated<br />
supply chain management services.<br />
Thanks to its in-depth industry knowhow<br />
and state-of-the-art IT systems,<br />
Panalpina provides globally integrated<br />
door-to-door <strong>for</strong>warding solutions tailored<br />
to its customers’ individual needs.<br />
The Panalpina Group operates a closeknit<br />
network with some 500 offices in<br />
80 countries. In a further 60 countries,<br />
it cooperates closely with partner companies.<br />
As a clearly focused corporation with<br />
a leading market position, Panalpina has<br />
specialized know-how in all the key<br />
industries. It thus offers its global key<br />
account customers true added value.<br />
At the same time, Panalpina is firmly<br />
embedded among internationally active<br />
small and medium-sized enterprises,<br />
and earns approximately three-quarters<br />
of its revenues in this segment.<br />
Thanks to a lean and efficient organization,<br />
a non-asset-based business<br />
model, competitive pricing and the wide<br />
experience of its management team,<br />
Panalpina is extremely well equipped<br />
<strong>for</strong> profitable future growth.<br />
Key Figures<br />
in CHF millions Change<br />
2004 2003 in %<br />
Invoiced Forwarding Services 7,452.3 6,560.9 13.6<br />
Customs, duty and taxes (1,331.9) (1,198.5) 11.1<br />
Net <strong>for</strong>warding revenue 6,120.3 5,362.4 14.1<br />
Gross profit (contribution margin) 1,341.1 1,238.9 8.2<br />
in % of net <strong>for</strong>warding revenue 21.9 23.1<br />
Operating result be<strong>for</strong>e<br />
depreciation and amortization<br />
(EBITDA) 212.0 195.4 8.5<br />
in % of gross profit 15.8 15.8<br />
Operating result be<strong>for</strong>e<br />
amortization (EBITA) 174.4 152.6 14.3<br />
in % of gross profit 13.0 12.3<br />
Operating result (EBIT) 152.9 138.1 10.7<br />
in % of gross profit 11.4 11.1<br />
Consolidated net earnings 111.4 97.7 14.0<br />
in % of shareholders’ equity 14.0 13.2<br />
Cash flow 212.2 194.9 8.9<br />
in % of gross profit 15.8 15.7<br />
Net cash flow from operating<br />
activities 33.9 89.6 –62.1<br />
in % of gross profit 2.5 7.2<br />
Total capital expenditure 89.9 51.1 76.1<br />
in % of net operating cash flow 264.9 57.0<br />
Net capital expenditure 74.5 39.7 87.5<br />
in % of net operating cash flow 219.3 44.3<br />
Depreciation and amortization 59.1 57.4 3.1<br />
in % of gross profit 4.4 4.6<br />
Total balance sheet size 1,574.3 1,486.8 5.9<br />
Total Financial debts 36.6 32.2 13.9<br />
Shareholders’ equity 796.8 737.1 8.1<br />
Financial debts to equity in % 4.6 4.4 5.4<br />
Return on equity (ROE) in % 14.5 13.8 5.3<br />
Return on capital employed<br />
(ROCE) in % 23.7 26.0 –9.1<br />
Number of employees 13,224 12,344 7.1<br />
Gross profit per employee (CHF) 104,901 99,880 5.0
On 6 continents<br />
Some 500 offices in 80 countries,<br />
13,000 employees and a worldwide<br />
air- and ocean freight network.<br />
Group Management Structure<br />
as of May 2005<br />
Corporate Auditor Board of Directors<br />
Gerhard Fischer, Chairman<br />
Wilfried Rutz, Vice Chairman<br />
Heinz Kühnlein<br />
Roger Schmid<br />
Heinrich Walti<br />
CFO<br />
Roland Wider<br />
Corporate Financial<br />
Reporting & Tax Management<br />
Corporate Treasury<br />
Corporate Controlling &<br />
Corporate Credit Control<br />
President & CEO<br />
Bruno Sidler<br />
CIO<br />
Monika Ribar<br />
Management In<strong>for</strong>mation<br />
Systems<br />
Project Management<br />
Business Processes & Quality<br />
Corporate In<strong>for</strong>mation<br />
Technology<br />
Members of the Executive Board Corporate Functions<br />
Regional CEO, EMEA<br />
Jörg Eggenberger<br />
Europe / Middle East /<br />
Africa / Central Asia / CIS<br />
Air Freight<br />
Oil and Gas<br />
Panprojects<br />
Steering Committee<br />
Gerhard Fischer, Chairman<br />
Wilfried Rutz<br />
Roger Schmid<br />
Bruno Sidler<br />
Roland Wider<br />
Corporate Marketing & Sales<br />
Corporate Development<br />
Corporate Human Resources<br />
Corporate Secretary<br />
Corporate Legal Services Corporate Communications<br />
Regional CEO, LATAM<br />
Beat Simon<br />
Latin America<br />
Operations<br />
Regional CEO, NORAM<br />
Peter Merath<br />
USA / Canada<br />
Regional CEO, APAC<br />
Lars-Ola Gunnarsson<br />
Asia-Pacific<br />
Ocean Freight
Core Activities<br />
14 Ocean Freight<br />
In 2004 Panalpina increased its transport volume to<br />
824,200 TEUs. Strong growth rates were achieved mainly<br />
in the trade lanes from and to Asia and Latin America.<br />
Key Industries<br />
24 Hi-Tech<br />
20 Oil and Gas<br />
Panalpina as a global market<br />
leader serves the oil and<br />
gas industry everywhere in the<br />
world. The name Panalpina<br />
stands <strong>for</strong> high quality, safe and<br />
environmentally responsible<br />
logistics services with a clear<br />
customer focus.<br />
Hi-tech industries such as consumer electronics and<br />
telecommunications are among the big winners of<br />
globalization and rising living standards around the world.<br />
Panalpina helps Hi-tech companies to improve their<br />
supply chain and thus to be able to market their products<br />
even more successfully.<br />
28 Health Care<br />
Due to its traditionally strong<br />
customer base in this field,<br />
Panalpina focuses on the<br />
health care sector as one of<br />
its core industries. The<br />
worldwide health care market<br />
is expanding strongly<br />
and Panalpina keeps the<br />
cargo flow running between<br />
producers and consumers.<br />
12 Air Freight<br />
Panalpina increased its air<br />
freight transport volume again<br />
in 2004 and transported<br />
a total of over 750,000 tons.<br />
This was an increase of<br />
21% on 2003. A major driving<br />
<strong>for</strong>ce was the strong Asian<br />
export market, in particular<br />
China.<br />
16 Supply Chain Management<br />
In today’s global village, customers are increasingly<br />
demanding more than just transportation of their goods<br />
between A and B. Internationally active companies are<br />
relocating production to sites around the world, resulting<br />
in more and more complex supply chains.<br />
22 Automotive<br />
The international automotive industry is a truly globalized<br />
sector. Vehicles are no longer completely manufactured<br />
in one plant. Instead, components are sourced from around<br />
the world and shipped to a central location <strong>for</strong> the final<br />
assembly. Panalpina’s supply chain management skills and<br />
its international network are key elements that help to<br />
keep the production lines running.<br />
30 Industrial<br />
Projects<br />
26 Retail and<br />
Fashion<br />
Considering the importance<br />
of the retail and<br />
fashion business and its<br />
future potential, and<br />
following intensive discussions<br />
with customers, it<br />
was a logical step to put a<br />
strong focus on the retail<br />
and fashion markets.<br />
Providing transport services <strong>for</strong> big industrial projects<br />
requires special skills, high flexibility, total commitment and<br />
a true passion <strong>for</strong> solutions. All these requirements are<br />
provided by the 185 staff of Panprojects, the specialist project<br />
division of the Panalpina Group.<br />
Contents<br />
Key Figures<br />
Interview with<br />
the Chairman and the CEO 4<br />
Executive Board 8<br />
Core Activities<br />
Air Freight 12<br />
Ocean Freight 14<br />
Supply Chain Management 16<br />
Key Industries<br />
Oil and Gas 20<br />
Automotive 22<br />
Hi-Tech 24<br />
Retail and Fashion 26<br />
Health Care 28<br />
Industrial Projects 30<br />
In<strong>for</strong>mation Technology 32<br />
Human Resources 34<br />
Social Responsibility 36<br />
Financial Statements 2004<br />
Interview with the CFO 40<br />
Consolidated Financial<br />
Statements 2004 42<br />
Annual Financial<br />
Statements 2004 Panalpina<br />
World Transport (Holding) Ltd. 80<br />
Main offices worldwide 88<br />
Impressum 91<br />
Panalpina Annual Report 2004 3
4 Panalpina Annual Report 2004<br />
Interview with the Chairman Gerhard Fischer and the CEO Bruno Sidler<br />
Growth has outper<strong>for</strong>med the market<br />
average in every core area,<br />
with new business in all key industries<br />
Another successful business year, further organic growth and<br />
consistent implementation of the new strategic direction<br />
chosen in 2002 has put Panalpina in an ideal position to continue<br />
benefiting from the effects of globalization.<br />
How would you assess the past financial year?<br />
Gerhard Fischer 2004 has been a successful year,<br />
and we were able to achieve our main targets.<br />
Panalpina has grown in all regions against the background<br />
of a generally favourable economic climate.<br />
Of course, the main source of revenues has<br />
been major relocation of production activities to<br />
Asia with the consequent strong growth in freight<br />
“We will also extend our commitment to complex<br />
supply chain management services.”<br />
volumes. However, the fact that we have once again<br />
outper<strong>for</strong>med the market shows that we are not<br />
simply relying on the business cycle to drive growth.<br />
We have done our homework. For example, the<br />
reorganization of our global marketing and sales<br />
structures has borne fruit which we are now harvesting<br />
in the <strong>for</strong>m of improved sales skills. I am<br />
also very pleased with the fact that 99% of our<br />
growth has been organic, i.e. has not entailed major<br />
acquisitions. The global <strong>for</strong>warding sector continued<br />
to suffer the effects of the weak dollar last year.<br />
This influence is of course tangible in a sector<br />
such as ocean freight in which almost all transactions<br />
take place in dollars. Pressure on margins<br />
in our highly competitive environment is a further<br />
challenge. However, we have coped with this challenge<br />
successfully in 2004 thanks to a further<br />
increase in the efficiency of our services and rigorous<br />
lowering of our transaction costs.<br />
How strong was Panalpina’s growth in each<br />
sector?<br />
Bruno Sidler We are very pleased with the trend<br />
in our core activities. Our total tonnage in air<br />
freight rose by 21%, confirming our position as<br />
the world’s second largest provider of airfreight<br />
services. Sea container freight volume rose by 21%,<br />
and revenues in our third main area of activity,<br />
supply chain management, went up<br />
by 23%. We have gained new cus-<br />
tomers both in the SME segment,<br />
which accounts <strong>for</strong> around threequarters<br />
of our turnover, and among<br />
major global companies. We have<br />
acquired new customers or concluded<br />
more comprehensive contracts with existing<br />
customers in all key industries. In 2004 we have<br />
been awarded important new business by Intel,<br />
Nokia, Ericsson, Alcatel, Siemens and Samsung in<br />
the Hi-tech and telecommunications sector, expanding<br />
our leading position as a provider of services<br />
to global network suppliers and mobile telephone<br />
manufacturers. We have also concluded major<br />
new or additional contracts with Adidas, Escada,<br />
H & M and Otto Versand in the retail and fashion<br />
sector, with BMW, Porsche and Hyundai in the<br />
automotive industry, and with BP (Azerbaijan) and<br />
Agip KCO (Kazakhstan) in the oil and gas sector,<br />
where we have been the unchallenged market leader<br />
<strong>for</strong> many years.
Interview with the Chairman and the CEO<br />
Panalpina Annual Report 2004 5
Interview with the Chairman and the CEO<br />
6 Panalpina Annual Report 2004<br />
Gerhard Fischer<br />
Chairman of the Board of Directors<br />
“This non-asset-based business model increases our<br />
flexibility, reduces risks and improves our liquidity.”<br />
What improvements in productivity were<br />
achieved in the year under review?<br />
Bruno Sidler Following the launch of our regional<br />
management structure in 2002 and preparations<br />
<strong>for</strong> the move to a functional organization in 2003,<br />
our central procurement, operational and sales &<br />
marketing organizations have been working in the<br />
new structure since January 1, 2004. With the rollout<br />
of the “target model project” the old <strong>for</strong>warding<br />
structure is now firmly a thing of the past, and<br />
the per<strong>for</strong>mance of each business unit is measured<br />
consistently against its own targets. We are<br />
“We will continue to aim at sustained growth in<br />
revenues well above the market average.”<br />
very satisfied with the results so far. The introduction<br />
of the Shared Services Centres and further moves<br />
to standardize our IT applications in the year under<br />
review have also led to a rise in productivity per<br />
employee, which has had a direct impact on our<br />
operating result.<br />
What are your aims <strong>for</strong> the coming years?<br />
Gerhard Fischer We aim to achieve a continuous<br />
rise in revenues well above the market average.<br />
We will continue to benefit from globalization, a<br />
lasting phenomenon that will act as a general<br />
driver <strong>for</strong> growth, and from the fact that our sector<br />
is still highly fragmented. We will also gradually<br />
expand our range of services, responding to customers’<br />
demands <strong>for</strong> added value above and<br />
beyond simply transporting objects from A to B.<br />
Will Panalpina’s strategy change?<br />
Gerhard Fischer The main elements of our tried and<br />
tested strategy – the clear focus on international<br />
air and ocean freight transport – will be maintained<br />
in future too. We will also extend our commitment<br />
to related supply chain management services. This<br />
is a deliberate choice and marks us out from our<br />
main rivals who offer integrated contract logistics<br />
and generally use their own infrastructure to store<br />
goods and distribute them by land <strong>for</strong> major customers.<br />
We see our role differently, preferring to act<br />
as a lead logistics provider, concentrating on the<br />
intelligent management of these logistics chains and<br />
providing the same solutions via selected best-inclass<br />
subcontractors and strategic partnerships in<br />
the various regions. This non-asset-based business<br />
model increases our flexibility, reduces risks<br />
and improves our liquidity.<br />
What role do acquisitions play in your growth?<br />
Bruno Sidler As we have already said, acquisitions<br />
accounted <strong>for</strong> a tiny proportion of our revenue<br />
growth in the year under review. However, the takeover<br />
of Grampian gave a considerable<br />
boost to our leading position in<br />
the oil and gas sector, and the integration<br />
of Korean IAF improves our<br />
position in Asia, as was the intention.<br />
The aim of these types of acquisitions<br />
is to continue to grow steadily,<br />
strengthening our position on geographical markets<br />
(particularly North America, Europe and Asia)<br />
or key industries by taking over leading local air<br />
and ocean freight <strong>for</strong>warders. Buying up existing<br />
partners has proven to be a particularly attractive<br />
option, as the long-standing relationship and<br />
absence of network duplication in most cases<br />
makes integration much easier.
What will Panalpina get out of a stock<br />
market launch?<br />
Gerhard Fischer The planned IPO would give the<br />
company easier access to the capital markets<br />
and thus support its growth strategy. The group’s<br />
status and profile would also, of course, improve,<br />
thus helping us to market our services. Not least,<br />
going public would enhance the industrial competencies<br />
of our board committees, which can only<br />
be beneficial <strong>for</strong> the company.<br />
Our current shareholder will, in any case, retain a<br />
substantial stake in Panalpina over the long term.<br />
This is a direct consequence of the foundation<br />
bylaws, requiring an entrepreneurial asset management.<br />
This strategy is much welcomed by the<br />
company.<br />
Furthermore, we have never been afraid of comparisons<br />
with our direct competitors. This year the<br />
Board of Directors filed an application to the<br />
General Meeting that the ordinary dividend be increased<br />
by 10 million Swiss francs, bringing the<br />
total payout to 40 million francs and placing our<br />
distribution ratio on a par with that of our main<br />
rivals.<br />
What role does sustainability play in your plans?<br />
Bruno Sidler Sustainable growth <strong>for</strong> the benefit of<br />
shareholders and employees remains our top<br />
priority. The fact that in 2004 we created new jobs<br />
and at the same time increased gross profit per<br />
employee shows that we have been successful.<br />
We consolidated the already well established<br />
Panalpina brand last year by further ef<strong>for</strong>ts to improve<br />
the quality of our service and by the launch<br />
of our world-wide branding campaign.<br />
Bruno Sidler<br />
President & CEO<br />
10 major factors <strong>for</strong> success<br />
Panalpina operates its own global network, manages<br />
capacity centrally and is represented on<br />
all the key markets with its own local organizations.<br />
The company is justifiably proud of its<br />
staff; they not only work <strong>for</strong> Panalpina but have<br />
assimilated its corporate culture and hence also<br />
its commitment to customer service. CEO Bruno<br />
Sidler sums up the Group’s strengths in the<br />
following 10 points:<br />
• A global network combined with a strong<br />
presence on local markets<br />
• High brand recognition<br />
• A healthy balance between major global<br />
customers and SMEs<br />
• A strong customer base in all key industries<br />
• Global market leader in the oil and gas<br />
industry’s supply chain<br />
• Central procurement and air and ocean freight<br />
capacity management<br />
• A non-asset-based business model<br />
• Process-integrated IT plat<strong>for</strong>ms<br />
• <strong>Passion</strong>ate staff<br />
• A management team with long-term<br />
experience in the industry<br />
Interview with the Chairman and the CEO<br />
Panalpina Annual Report 2004 7
Bruno Sidler<br />
President & CEO<br />
Born 1957. President of the<br />
Executive Board since 1998.<br />
Also directly responsible <strong>for</strong><br />
Marketing & Sales, Corporate<br />
Development, Corporate<br />
Communications, Legal Services<br />
and Human Resources.<br />
8 Panalpina Annual Report 2004<br />
Executive Board<br />
“We have met most of our targets,<br />
and the first successes yielded<br />
by the strategic and organizational<br />
group restructuring launched<br />
in 2002 are now clearly visible.”<br />
“Well trained IT specialists, an efficient control<br />
of data flows as well as secure systems enable<br />
us to solve complex problems.”<br />
Monika Ribar<br />
CIO<br />
“The revenue growth we have<br />
achieved, both among global<br />
accounts and small and mediumsized<br />
enterprises, clearly show<br />
that our investments in marketing<br />
and sales have paid off.”<br />
Roland Wider<br />
CFO<br />
Born 1959. Member of the Executive Board since 2000.<br />
Responsible <strong>for</strong> Corporate In<strong>for</strong>mation Technology, Management In<strong>for</strong>mation<br />
Systems, Project Management, Business Processes & Quality.<br />
Born 1959. Member of the Executive Board since 2002.<br />
Responsible <strong>for</strong> Corporate Finances, Investor Relations, Financial<br />
Reporting & Tax Management, Treasury, Controlling and Credit Control.
“Our decades of experience in<br />
central procurement and<br />
capacity management are<br />
generating good growth<br />
potential in a highly fragmented<br />
air freight market.”<br />
Beat Simon<br />
Regional CEO LATAM<br />
Born 1966. Member of the Executive<br />
Board since 2003.<br />
Regional responsibility: Latin America.<br />
Functional responsibility: Operations.<br />
Peter Merath<br />
Regional CEO NORAM<br />
Born 1942. Member of the Executive Board since 2005.<br />
Regional responsibility: USA and Canada.<br />
“By ‘Operational Excellence’ we<br />
not only mean ongoing improvements<br />
to our service quality,<br />
but consistent increases in our<br />
employees’ productivity and<br />
motivation.”<br />
Lars-Ola Gunnarsson<br />
Regional CEO APAC<br />
Born 1948. Member of the Executive Board since 2002.<br />
Regional responsibility: Asia-Pacific.<br />
Functional responsibility: Ocean Freight.<br />
Jörg Eggenberger<br />
Regional CEO EMEA<br />
Executive Board<br />
Born 1961. Member of the Executive Board<br />
since 2000.<br />
Regional responsibility: Europe, Middle East,<br />
CIS, Central Asia and Africa. Functional<br />
responsibility: Air Freight, Oil and Gas,<br />
Panprojects.<br />
“Motivated staff, solution-driven<br />
service concepts and impressive<br />
<strong>for</strong>warding, logistics and industry<br />
competencies are a guarantee<br />
of satisfied customers in future<br />
too.”<br />
“The continuing development of our partnership<br />
with selected leading shipping lines<br />
guarantees top-quality service and <strong>for</strong>ms the<br />
basis <strong>for</strong> double-digit growth in volumes.”<br />
Panalpina Annual Report 2004 9
Core Activities<br />
10 Panalpina Annual Report 2004<br />
5000 kilometres<br />
Placed end to end, the containers handled by Panalpina<br />
would <strong>for</strong>m a line around 5000 km long.<br />
7500 Jumbo Jets<br />
The 750,000 tons of air freight flown by Panalpina<br />
would fit in 7500 B747 cargo planes.
Core Activities<br />
• Air Freight<br />
• Ocean Freight<br />
Core Activities<br />
Panalpina Annual Report 2004 11
Core Activities<br />
12 Panalpina Annual Report 2004<br />
Air Freight<br />
Network expansion to profit from<br />
strong market growth<br />
Panalpina increased its air freight transport volume again in 2004<br />
and transported a total of over 750,000 tons. This was an<br />
increase of 21% on 2003. A major driving <strong>for</strong>ce was the strong<br />
Asian export market, in particular China.<br />
Panalpina’s central procurement and capacity<br />
management system and its capability to provide<br />
capacity even during the peak season proved to<br />
be a success factor. This was particularly evident<br />
towards the end of the year, when the demand<br />
<strong>for</strong> capacity was especially high. Panalpina could<br />
offer customers additional space and increase<br />
frequencies, mainly out of Asia.<br />
The Asian export market to Europe is expected to<br />
continue its strong upwards trend in 2005. The<br />
transpacific routes also developed successfully.<br />
In response to customer demand, Panalpina has<br />
extended its services on Asia-North America routes.<br />
The twice-weekly B747-400F service between<br />
Hong Kong and the hub in Huntsville, USA, that<br />
was launched in 2004 was extremely successful.<br />
On the transatlantic the westbound/eastbound<br />
traffic balance between North America and Europe<br />
improved.<br />
Latin America showed<br />
good import growth, with<br />
a clear increase in shipments<br />
such as electronics<br />
and automotive parts<br />
to Brazil. Northbound<br />
volumes were also rising,<br />
and a further increase<br />
in Latin American exports<br />
in 2005 is expected. Africa developed strongly<br />
thanks to the oil and gas industry, and Panalpina<br />
offered more capacity by increasing cargo flights<br />
from five to seven per week.<br />
Unique Panalpina Multi Hub Strategy<br />
The central procurement and capacity management<br />
(CCM) concept has been further developed and<br />
will be gradually extended in 2005. The Panalpina<br />
Air Freight Division centrally handles capacity and<br />
procurement, organizes and coordinates the global<br />
air freight network and the traffic flows supported<br />
by a hub and sub-hub system. A best-in-class IT<br />
tool ensures transparency of the capacity and<br />
booking situation and the steering of the air freight<br />
networks in a multi hub environment.<br />
In Europe, Panalpina<br />
operates three equallyimportant<br />
air freight hubs:<br />
Luxembourg, Frankfurt<br />
and Paris. Panalpina’s<br />
strong presence in North<br />
America will be further<br />
extended when New York<br />
(JFK) will complement<br />
the existing hub-network consisting of Huntsville,<br />
Chicago, Miami and Los Angeles. Panalpina Air<br />
Freight, with 550 staff, also operates a road feeder<br />
service to and from the hubs and sub-hubs.<br />
Achieve the optimal capacity mix<br />
Panalpina Air Freight combines the capacity of<br />
selected commercial airline partners with the own<br />
scheduled freighter operations in order to achieve<br />
the optimal capacity mix. This is being balanced<br />
out during the low and high season to achieve<br />
best capacity utilization on a daily basis.<br />
The worldwide charter operations are controlled<br />
round the clock from the hubs in Luxembourg,<br />
Huntsville and Hong Kong which ensures immediate<br />
response to customer requests in the three<br />
time zones. It developed well in 2004 and – in average<br />
– Panalpina operates three charter flights<br />
every day. The charter market offers good growth<br />
potential, mainly <strong>for</strong> emergency shipments to big<br />
production plants and oil and gas exploring sites.<br />
New product portfolio<br />
As part of the product re-definition to offer customers<br />
clearly-defined, easy to understand services,<br />
Panalpina has drawn up new air freight product<br />
names. Priority offers a typical airport-airport transit<br />
time of 1–2 days <strong>for</strong> time-critical shipments<br />
using the fastest available connection. Standard,<br />
with a typical transit time of 3–4 days, provides<br />
cost-effective and rapid transportation. Economy<br />
offers transit times of 5–6 days. For vitally-urgent<br />
shipments, the “Now” service uses the fastest<br />
possible solution, including onboard couriers, charters<br />
or helicopter transfers. Customers can also<br />
select any combination of airport and door collection<br />
and delivery options.
Core Activities<br />
Panalpina Annual Report 2004 13
Core Activities<br />
14 Panalpina Annual Report 2004
Ocean Freight<br />
21% global growth and volume increase<br />
in all trade lanes<br />
In 2004 Panalpina increased its transport volume to 824,200 TEUs.<br />
Strong growth rates were achieved mainly in the trade lanes from and<br />
to Asia and Latin America.<br />
Panalpina outgrew the overall international<br />
ocean freight transport market last year. Total<br />
ocean freight volumes rose 21% to 824,200 TEU.<br />
The major drivers were the dynamic Asian export<br />
markets, especially China. Traffic with Asia (from<br />
and to Europe, North America, Latin America) grew<br />
to about 446,700 TEU. Considerable growth rates<br />
were also achieved in traffic from Latin America<br />
to North America and Europe and vice versa.<br />
Between Asia and North America the transport<br />
volume grew by 33%. Capacity out of Asia and<br />
Latin America was generally very tight, leading to<br />
higher westbound rates.<br />
The strong growth in the ocean freight market is<br />
expected to continue in 2005 and Panalpina is<br />
convinced it can achieve above-average growth<br />
rates again. Furthermore, Panalpina will further<br />
develop its intra-Asian and transpacific ocean freight<br />
volumes.<br />
Availability of capacity even in peak season<br />
Panalpina offers globally active and SME customers<br />
a choice of standardized products that<br />
provide reliable and efficient worldwide ocean<br />
freight transportation. Through its worldwide LCL<br />
(Less than Container Load) and NVOCC (Non<br />
Vessel Operating Common Carrier) products it<br />
offers seamless door-to-door services on the<br />
basis of long-term capacity and rate agreements<br />
with leading carriers.<br />
Having centralized<br />
capacity procurement<br />
and allocation within<br />
Panalpina Ocean Freight,<br />
the group can ensure<br />
capacity <strong>for</strong> its customers<br />
throughout the<br />
year on all trade lanes,<br />
even during the peak<br />
season. The consequent<br />
development of partnerships<br />
with selected<br />
leading shipping lines<br />
ensures highest service<br />
quality and contributes<br />
to further growth on all<br />
major routes.<br />
Standardized ocean freight products <strong>for</strong> all<br />
customers<br />
Panalpina offers clear<br />
“easy freight” solutions<br />
<strong>for</strong> all kinds of customer<br />
requirements. The full<br />
container load (FCL)<br />
product comprises complete<br />
schedule flexibility,<br />
a high frequency of<br />
sailings and available<br />
equipment. LCL, the competitively-priced consolidation<br />
product, provides reliable per<strong>for</strong>mance and<br />
cost-effective transportation. LCL shipments are<br />
handled through a dense network of strategicallylocated<br />
hubs in Europe, North America and Asia.<br />
A special focus in 2005 will be the extension of<br />
the network in Asia and further improved connections<br />
within North America.<br />
Service close to the customer<br />
Panalpina is committed to serving customers close<br />
to their location. New customer service teams<br />
have been successfully <strong>for</strong>med to handle order<br />
acceptance and to advise customers. Separate<br />
back-office staff will process orders and documentation.<br />
The combination of global contracts with<br />
carriers and local service <strong>for</strong> the customers enables<br />
Panalpina to respond quickly to changing customer<br />
requirements. At the same time, productivity<br />
can be increased.<br />
Security rules improve quality<br />
Panalpina has successfully implemented new security<br />
procedures – including setting up appropriate<br />
IT tools – following the introduction of international<br />
security rules <strong>for</strong> ocean freight shipments in July<br />
2004. In line with the obligatory standard operating<br />
procedures introduced by the International Maritime<br />
Organization, Panalpina is providing advance<br />
manifest in<strong>for</strong>mation about its ocean freight shipments<br />
to the relevant authorities.<br />
Core Activities<br />
Panalpina Annual Report 2004 15
Supply Chain Management<br />
16 Panalpina Annual Report 2004<br />
Supply Chain<br />
Management<br />
180 football fields<br />
Panalpina manages a total of more than 1.1 million<br />
square metres of storage space at 240 locations<br />
around the world.
Supply Chain Management<br />
Adding value<br />
to the customer’s business<br />
In today’s global village, customers are increasingly demanding<br />
more than just transportation of their goods between A and B.<br />
Internationally active companies are relocating production to<br />
sites around the world, resulting in more and more complex<br />
supply chains.<br />
Parts, semi-finished goods and complete products<br />
have to be stored, packaged and at<br />
times assembled on their way between production<br />
sites or as they head <strong>for</strong> the point of sale. National,<br />
regional and local distribution centres are turning<br />
into logistics hubs. This is where Panalpina<br />
as a logistics expert comes into the picture. With<br />
decades of experience in international freight<br />
<strong>for</strong>warding, Panalpina offers high-quality supply<br />
chain management solutions <strong>for</strong> customers<br />
around the world.<br />
Panalpina works to help<br />
its customers get their<br />
goods to the market<br />
in the most efficient and<br />
cost-effective manner.<br />
Panalpina delivers solutions<br />
to reduce inventory<br />
levels and overall supply<br />
chain costs.<br />
Successful supply chain management<br />
Panalpina has focused its logistics growth in recent<br />
years on global customers who require high-value<br />
supply chain management. While maintaining a<br />
strict asset-free strategy, Panalpina provides warehousing,<br />
distribution and value added services<br />
such as order management, repackaging, kitting<br />
and reverse logistics in cooperation with partners.<br />
A large number of warehouses at key locations<br />
around the globe are operated on behalf of clients<br />
from the automotive, Hi-tech and retail and fashion<br />
industries. Panalpina delivers added value to the<br />
customer, and its employees are driven by a consequent<br />
“can do” attitude and a real passion <strong>for</strong><br />
solutions. Recent successes <strong>for</strong> Panalpina in the<br />
field of supply chain management include a lead<br />
logistics contract in Asia <strong>for</strong> a major Hi-tech company,<br />
and operation of a regional hub in Eastern<br />
Europe <strong>for</strong> a large customer.<br />
In response to customer demand, supply chain<br />
management has become the third pillar of<br />
Panalpina’s core business, alongside freight <strong>for</strong>warding.<br />
Building on proven expertise <strong>for</strong> larger<br />
groups, the company is constantly extending its<br />
logistics services. Best-in-class partnerships with<br />
specialist companies in strategic sectors and<br />
regions ensure a comprehensive range of supply<br />
chain services.<br />
Lead logistics provider<br />
As a lead logistics provider, Panalpina works closely<br />
with the customer to analyse and improve the supply<br />
chain. Existing logistics processes are reviewed,<br />
including the materials flow and stock levels. It is<br />
important to understand the customer’s needs<br />
absolutely. Panalpina selects, manages and takes<br />
responsibility <strong>for</strong> the carriers and logistics suppliers<br />
within the supply chain. Furthermore, Panalpina<br />
helps to identify the ideal warehousing and distribution<br />
facilities as part of<br />
the overall supply chain.<br />
As an asset-free company,<br />
Panalpina has the<br />
freedom to work with<br />
best-in-class partners and<br />
thus provide customers<br />
with the best possible<br />
solutions.<br />
Proven IT systems manage the flow<br />
Integration of the physical flow of goods with the<br />
electronic flow of in<strong>for</strong>mation is absolutely vital <strong>for</strong><br />
successful supply chain management. The wellproven<br />
Panlogic Application Suite includes the<br />
web-based Pantrace tracking and tracing system<br />
and the Intrac system <strong>for</strong> tracking, report and<br />
logistics management, as well as first-class order<br />
and materials management applications. Moreover,<br />
an event management application alerts customers<br />
to any differences between planned and<br />
actual transportation. The Suite is being extended<br />
with a new Warehouse Inventory System (WIS)<br />
and a Supply Chain Visibility (SCV) tool which provides<br />
full end-to-end in<strong>for</strong>mation, including external<br />
distribution centres.<br />
Panalpina Annual Report 2004 17
Key Industries<br />
18 Panalpina Annual Report 2004
Key Industries<br />
• Oil and Gas<br />
• Automotive<br />
• Hi-Tech<br />
• Retail and Fashion<br />
• Health Care<br />
• Industrial Projects<br />
Key Industries<br />
Panalpina Annual Report 2004 19
Key Industries<br />
20 Panalpina Annual Report 2004
Oil and Gas<br />
Fueling the world economy<br />
Panalpina as a global market leader serves the oil and gas<br />
industry everywhere in the world. The name Panalpina<br />
stands <strong>for</strong> high quality, safe and environmentally responsible<br />
logistics services with a clear customer focus.<br />
Panalpina’s customer base includes leading oil<br />
and gas producers, drilling companies, oilfield<br />
supply companies, construction firms and many<br />
others in the industry. With decades of experience<br />
in the oil and gas industry, Panalpina has the indepth<br />
specialist knowledge and a range of services<br />
precisely targeted to customers’ needs. It has<br />
a major presence in vital regions such as Europe,<br />
West Africa, North America,<br />
South East Asia, the<br />
Far East and Central<br />
Asia/CIS, and is expanding<br />
in emerging markets.<br />
The global Panalpina Oil<br />
and Gas division, with<br />
close to 1,000 dedicated<br />
employees enables the<br />
company to operate close to the customers and<br />
to respond quickly to new or changing needs. Producers<br />
and service providers continue to expand<br />
and open up new production locations, and, as a<br />
result, their requirements <strong>for</strong> top-class logistics<br />
services are also becoming more and more global.<br />
Successful acquisition<br />
The acquisition and successful integration of Scottish<br />
<strong>for</strong>warding company Grampian International<br />
Freight was a major development <strong>for</strong> Panalpina’s<br />
oil and gas business in 2004. The acquisition extended<br />
its presence in the UK-based oil and gas<br />
sectors and also opened up new growth opportunities<br />
in Europe, West Africa, Central Asia and North<br />
Africa. Grampian, with 150 skilled staff and turnover<br />
of CHF 61 million in 2003, continues to operate<br />
under its existing company name and brand.<br />
Improved services<br />
In 2004, Panalpina Oil and Gas replaced the <strong>for</strong>mer<br />
MS Merlin by taking the newly-built MS Merlin III<br />
under charter and thereby further improved quality<br />
and service standards in West Africa. The Coast<br />
Link Service, comprising the two shallow draft<br />
vessels Merlin II and Merlin III together with the fast<br />
cargo boat African Star, transports cargo to offshore<br />
rigs and is directly linked to Panalpina’s air<br />
and ocean freight network. Unique is Panalpina’s<br />
combined air/ocean service via the hub in Malabo.<br />
All three vessels are operated commercially under<br />
charter to Panalpina.<br />
The new oil and gas hub at Moerdijk in the Netherlands<br />
enables Panalpina to offer European customers<br />
services such as international road transports,<br />
expediting, inbound transport, warehousing<br />
and customs clearance. Panalpina also increased<br />
its strategic presence in Tunisia, Mauritania, Libya<br />
and Algeria.<br />
Significant new contracts<br />
Panalpina successfully grew its oil and gas business<br />
with a number of significant new contracts. The<br />
promising activities in Angola developed very satisfactorily<br />
as several contracts were gained from<br />
leading world producers. 2005 is expected to see<br />
equally successful developments in the region. In<br />
Nigeria, Panalpina continued to extend its already<br />
very strong position with additional new business.<br />
The Central Asia region continued to grow with<br />
major new contracts and more Panalpina direct<br />
services from Europe were started up. The developments<br />
in Russia were also very positive as new<br />
business was gained in several regions, including<br />
Sakhalin Island. Following the strategy of being<br />
where the customers need the best service,<br />
Panalpina launched its activities on Sakhalin at a<br />
very early stage and has gained considerable<br />
experience in finding efficient solutions <strong>for</strong> complex<br />
challenges. Demand <strong>for</strong> quality logistics in Russia<br />
is increasing, and Panalpina also grew strongly in<br />
the Americas, particularly in Mexico, Venezuela<br />
and Brazil. In Houston a new hub with warehousing<br />
capacity was opened. The Asia business also<br />
continued to increase.<br />
Key Industries<br />
Panalpina Annual Report 2004 21
Key Industries<br />
22 Panalpina Annual Report 2004<br />
Automotive<br />
Preferred partner <strong>for</strong> global players<br />
The international automotive industry is a truly globalized sector.<br />
Vehicles are no longer completely manufactured in one plant.<br />
Instead, components are rather sourced from around the world and<br />
shipped to a central location <strong>for</strong> the final assembly. Panalpina’s<br />
supply chain management skills and its international network are<br />
key elements that help to keep the production lines running.<br />
Not only are production methods changing, but<br />
markets are, too. Consumer demand fluctuates<br />
and purchasing power is growing in countries<br />
around the globe. In short, the automotive industry<br />
needs top logistics experts in order to design<br />
and market its products successfully.<br />
Panalpina has been at home in this complex and<br />
challenging market <strong>for</strong> many years and has established<br />
a customer base among manufacturers,<br />
tier-level suppliers, spare parts providers, and other<br />
sections of the industry.<br />
This means Panalpina<br />
really knows the market,<br />
and can react rapidly<br />
to new operating conditions.<br />
The services range<br />
from air and ocean<br />
freight <strong>for</strong>warding to complex<br />
logistics solutions.<br />
Panalpina picks up, transports and delivers goods<br />
just-in-time, or just-in-sequence, to production<br />
lines in many countries. Thanks to centralized capacity<br />
management and procurement both <strong>for</strong><br />
air and ocean freight, Panalpina is able to provide<br />
automotive customers with capacity whenever<br />
and wherever they need it. For example, Panalpina<br />
operates a regular freighter service between Sao<br />
Paulo and Luxembourg to give the Brazilian automotive<br />
industry sufficient capacity and better access<br />
to international markets. Furthermore, Panalpina<br />
provides customers with full supply chain visibility<br />
through its IT systems, and can pro-actively alert<br />
customers to any transportation changes that might<br />
affect their business.<br />
Industry competence and global coverage<br />
Panalpina is a preferred logistics partner <strong>for</strong> many<br />
automotive companies. It provides worldwide ocean<br />
freight transportation and air freight <strong>for</strong>warding in<br />
several large regions <strong>for</strong> one of Germany’s leading<br />
car manufacturers, and also operates a logistics<br />
terminal <strong>for</strong> the company in Singapore. Panalpina<br />
acts as the “logistics management company” <strong>for</strong><br />
air and ocean freight and some logistics activities<br />
<strong>for</strong> one of the world’s biggest automotive suppliers,<br />
a US-based group, on routes between North and<br />
South America, Europe and Asia. For another leading<br />
supplier with head office in Germany, <strong>for</strong> example,<br />
Panalpina is the “preferred global service<br />
provider” <strong>for</strong> air and ocean freight covering Germany,<br />
North America and parts of Asia. The total<br />
customer list, of course, is much longer. It could be<br />
continued, <strong>for</strong> example, with the business where<br />
Panalpina ships components <strong>for</strong> a major international<br />
automotive supplier from Asia, North America<br />
and Latin America to Europe.<br />
New contracts worldwide<br />
Panalpina successfully developed its position as a<br />
leading logistics provider <strong>for</strong> the global automotive<br />
industry in 2004. In the autumn, a major contract<br />
with a large Asian car manufacturer was signed to<br />
provide <strong>for</strong>warding services <strong>for</strong> its new manufacturing<br />
base in the southern USA. This contract covers<br />
all air and ocean freight <strong>for</strong>warding from both the<br />
USA and Asia. Components and other items are<br />
flown or shipped to the production site, stored in a<br />
nearby Panalpina-run warehouse and delivered<br />
on a just-in-time basis to the production line. Moreover,<br />
our contract to provide <strong>for</strong>warding services<br />
between North America, Latin America and Europe<br />
<strong>for</strong> one of the world’s largest automotive suppliers<br />
was further extended. Panalpina also increased<br />
business with a large German manufacturer and a<br />
leading German automotive supplier. Hybrid cars<br />
are a highly-promising future market.<br />
Automotive competence centre<br />
Panalpina will further develop its already very successful<br />
competence centre <strong>for</strong> the automotive<br />
industry during 2005. A network of industry experts<br />
based at six strategic centres in North America,<br />
Europe and Asia-Pacific is being established. These<br />
experts are important contacts and in<strong>for</strong>mation<br />
sources <strong>for</strong> key account managers and sales representatives.<br />
The competence centre team is also<br />
responsible <strong>for</strong> monitoring and analysing trends in<br />
the industry, pooling expertise and creating industry<br />
solutions <strong>for</strong> existing and potential customers.
Key Industries<br />
Panalpina Annual Report 2004 23
Key Industries<br />
24 Panalpina Annual Report 2004
Hi-Tech<br />
Ringing up successes in<br />
the Hi-tech sector<br />
Hi-tech industries such as consumer electronics and telecommunications<br />
are among the big winners of globalization and<br />
rising living standards around the world. Panalpina helps Hi-tech<br />
companies to improve their supply chain and thus to be able<br />
to market their products even more successfully.<br />
Demand <strong>for</strong> telecommunication networks and<br />
<strong>for</strong> products such as computers and accessories,<br />
mobile phones and other electronic devices<br />
is growing worldwide. At the same time, manufacturers<br />
are changing their sourcing operations to<br />
regions such as Asia. These decisive trends have<br />
a major impact on the flow of parts and finished<br />
goods.<br />
Hi-tech competence centre<br />
Panalpina not only profits from these developments<br />
but is a key element within the supply chains.<br />
Like with all other key industries, Panalpina also<br />
operales a dedicated Hi-Tech Competence Centre.<br />
It supports the key account managers <strong>for</strong> global<br />
customers and is responsible <strong>for</strong> drawing up industry<br />
solutions <strong>for</strong> the Hi-tech sector based on<br />
market and customer requirements.<br />
A highly successful<br />
example of a partnership<br />
between Panalpina and<br />
global Hi-tech company<br />
is the case of the Korean<br />
Panalpina organization.<br />
It transports PCs, mobile<br />
phones, home electronics<br />
equipment, domestic<br />
appliances and other consumer items <strong>for</strong> the<br />
manufacturer from Seoul to various European destinations.<br />
A dedicated Panalpina team has direct<br />
electronic links to the customer to organize transport,<br />
track shipments and plan future orders.<br />
New electronics and telecoms business<br />
In 2004, Panalpina gained significant additional<br />
business from existing customers in the computer<br />
industry. This included more traffic out of Europe,<br />
as well as new trans-Pacific and transatlantic volumes.<br />
A major project in 2004 was to provide <strong>for</strong>warding<br />
services to Nigeria <strong>for</strong> communications<br />
technology from a long-standing German customer.<br />
This industrial group is one of several suppliers<br />
of new fixed-line and mobile phone networks in<br />
Africa’s most populous country. Panalpina set<br />
up a special department in Europe <strong>for</strong> equipment<br />
deliveries to Nigeria, and <strong>for</strong>warded more than<br />
8,000 tonnes of air freight as well as ocean freight<br />
as part of the project.<br />
In early 2005, Panalpina rang up a major success<br />
in the telecommunications industry. One of the<br />
world’s leading mobile phone companies appointed<br />
the company as a Lead Logistics Provider and<br />
awarded significant traffic on trade lanes from Asia<br />
to Europe and North America, and from Brazil to<br />
North America. The telecoms sector offers highlyattractive<br />
growth prospects in many regions of the<br />
world.<br />
Top security <strong>for</strong> valuable cargo<br />
Panalpina is committed to the very highest levels<br />
of security <strong>for</strong> freight shipments, whether Hi-tech<br />
goods or other types of cargo. Security heads<br />
and coordinators at global, regional and local levels<br />
ensure that all staff are thoroughly screened<br />
and trained in-depth on the security standards and<br />
awareness program. Where appropriate, special<br />
security facilities <strong>for</strong> vulnerable goods are available.<br />
Panalpina also monitors the security standards<br />
of its subcontractors. Needless to say, Panalpina<br />
also operates according to the operating standards<br />
of the Hi-tech manufacturers organization<br />
TAPA (Technology Asset Protection Association)<br />
and has been certified by the US program C-TPAT<br />
(Customs-Trade Partnership Against Terrorism).<br />
The involvement in industry initiatives is also part<br />
of Panalpina’s commitment to improving security.<br />
Key Industries<br />
Panalpina Annual Report 2004 25
Key Industries<br />
26 Panalpina Annual Report 2004<br />
Retail and Fashion<br />
Tailor-made services<br />
<strong>for</strong> international retailers<br />
Considering the importance of the retail and fashion business,<br />
its future potential and following intensive discussions with<br />
customers, it was a logical step to put a strong focus on the<br />
retail and fashion markets.<br />
Key sectors with growth potential include textiles,<br />
quality and casual clothing, footwear,<br />
fashion jewelry and accessories. An industry competence<br />
centre has been set up in Zurich to provide<br />
overall strategic direction and support <strong>for</strong> key<br />
account managers.<br />
Panalpina already has a large retail and fashion customer<br />
base in many countries around the world.<br />
In particular, international air and ocean <strong>for</strong>warding<br />
services <strong>for</strong> large European retailers and fashion<br />
manufacturers have been provided <strong>for</strong> many years.<br />
These customers include leading brands. One of<br />
the world’s leading sports footwear companies, <strong>for</strong><br />
example, has entrusted Panalpina with significant<br />
volumes of boxed freight from Asia to parts of<br />
Europe. Some of the European customers export<br />
significant volumes to Asia, enabling Panalpina<br />
to balance traffic flows between the two continents.<br />
In spring 2004, <strong>for</strong> example, one of Italy’s most<br />
prestigious fashion companies relied on Panalpina’s<br />
logistics expertise <strong>for</strong> the opening of its new flagship<br />
store in Shanghai as well as <strong>for</strong> a special show<br />
in Hong Kong. The high-value haute couture items<br />
were successfully delivered just-in-time to the two<br />
events.<br />
Value added services<br />
The services <strong>for</strong> the retail and fashion industries<br />
range from traditional air and ocean freight<br />
<strong>for</strong>warding to logistics and value added services.<br />
Dedicated sales and operational teams are fully<br />
focused on customer needs. Due to the global importance<br />
of Asia as a textiles manufacturing<br />
base, Panalpina is able to consolidate shipments<br />
at a “buyers’ plat<strong>for</strong>m” and ship items from<br />
this hub to Europe or other continents. Included in<br />
the service package are time-definite transport<br />
solutions and distribution services. Furthermore,<br />
Panalpina provides seasonal storage capacity –<br />
a particularly important service <strong>for</strong> these highly<br />
seasonal industries.<br />
Panalpina also provides a range of value added<br />
services <strong>for</strong> customers in the retail and fashion<br />
sectors. For example, Panalpina offers “flying<br />
boutiques” in the <strong>for</strong>m of transport equipment <strong>for</strong><br />
hanging garments <strong>for</strong> smaller fashion companies<br />
without their own specialized containers. Once in<br />
Europe, the clothing items are unpacked and<br />
made ready <strong>for</strong> the market, <strong>for</strong> example by fitting<br />
labels or buttons. Other pre-retailing services<br />
include shipment control, re-conditioning and dispatching.<br />
Furthermore, vendor and order management,<br />
cross-docking, and door-to-store delivery<br />
are offered. Special services include store<br />
opening or trade show logistics, as well as reverse<br />
logistics. This is all backed up by tracking and<br />
tracing, and detailed reporting.<br />
Fit <strong>for</strong> the future<br />
Panalpina is technologically-equipped <strong>for</strong> current<br />
security requirements and future needs. The<br />
group has TAPA and C-TPAT certification, as well<br />
as GPS-controlled, hard-covered trucks in major<br />
locations. A RFID technique project to assess the<br />
per<strong>for</strong>mance and operational aspects of the new<br />
tags is being developed. In addition, Panalpina is<br />
closely monitoring the effects of the end of quotas<br />
on Chinese textile exports. A major shift in textile<br />
manufacturing from traditional locations around the<br />
world to China has been widely predicted.<br />
Panalpina is already well-prepared <strong>for</strong> this development<br />
thanks to its strong presence in the<br />
country.
Key Industries<br />
Panalpina Annual Report 2004 27
Key Industries<br />
28 Panalpina Annual Report 2004
Health Care<br />
Keeping the logistics chains healthy<br />
Due to its traditionally strong customer base in this field,<br />
Panalpina focuses on the health care sector as one of its core<br />
industries. The worldwide health care market is expanding<br />
strongly and Panalpina keeps the cargo flow running between<br />
producers and consumers.<br />
Leading pharmaceutical and biotechnology companies<br />
are extending their production and<br />
sales markets around the world. Further potential<br />
in this strategic key industry comes from the fast<br />
growing market of “generic” drugs, often produced<br />
in regions such as Eastern Europe, India or<br />
Latin America.<br />
For their worldwide logistics,<br />
major producers<br />
of health care products<br />
require experts who<br />
know just how to handle<br />
the sensitive and expensive<br />
products. Vaccines,<br />
medicines and other<br />
items frequently have to<br />
be transported at exact temperatures, need extracareful<br />
physical handling and also require special<br />
safety measures. At the same time, however, such<br />
shipments are often vitally urgent. They may have<br />
to be airfreighted as quickly as possible to large<br />
cities or even to minor destinations less accessible.<br />
Even if they are not particularly urgent, health<br />
care products are often shipped by air due to their<br />
sensitive nature and high value.<br />
Expansion in Asia<br />
Panalpina has been an expert in the field of health<br />
care logistics <strong>for</strong> many years. It has acted as the<br />
main logistics provider of a globally leading Swissbased<br />
producer <strong>for</strong> a long time, and has had a<br />
broad customer base among pharmaceutical companies<br />
in countries around the world. Panalpina<br />
has – as in the other key industry groups – established<br />
a health care competence centre in Zurich.<br />
Panalpina’s main areas of activity are in Europe,<br />
the USA and Asia. Further growth will be generated<br />
mainly in Asia. Panalpina there<strong>for</strong>e is constantly<br />
extending its logistics capabilities <strong>for</strong> inbound and<br />
intra-Asian transportation as well as <strong>for</strong> distribution<br />
to retailers.<br />
Keeping things cool<br />
Panalpina’s competitive advantages in the health<br />
care sector include the tight, self-controlled network,<br />
the availability of capacity at all times and<br />
the specialist equipment that is used. Goods such<br />
as vaccines have to be transported at constant<br />
temperatures. Panalpina uses specially-designed<br />
Envirotainers <strong>for</strong> this purpose. These temperaturecontrolled<br />
“cool boxes” are equipped with thermostats<br />
and dry ice so that the temperature can<br />
always be kept at just the right level between –20<br />
and +20 degrees Celsius. The vaccines are loaded<br />
into these containers at the customer’s premises<br />
and transported to the consignee without any interruption<br />
in the cool chain.<br />
Another innovative service that Panalpina provides<br />
<strong>for</strong> health care customers is its “e-hub” <strong>for</strong> electronic<br />
data transmission. Customers can transmit<br />
their orders electronically into the e-hub and receive<br />
order confirmation. Panalpina staff use the data<br />
to organize transportation, documentation and<br />
billing. The e-hub is linked to Panalpina’s tracking<br />
and reporting system.<br />
Key Industries<br />
Panalpina Annual Report 2004 29
Key Industries<br />
30 Panalpina Annual Report 2004<br />
Industrial Projects<br />
“Can’t do” doesn’t exist<br />
Providing transport services <strong>for</strong> big industrial projects requires<br />
special skills, high flexibility, total commitment and a true<br />
passion <strong>for</strong> solutions. All these requirements are provided by the<br />
185 staff of Panprojects, the specialist project division of the<br />
Panalpina Group.<br />
Due to the special needs of project work, the<br />
existing Panalpina project department is operated<br />
as a separate business unit with its head<br />
office in Bremen (Germany). It is based on a proven<br />
track record and the competence of the Panalpina<br />
project division. It uses the global Panalpina<br />
organization as its support base during project<br />
execution.<br />
Panprojects provides<br />
integrated logistics<br />
turnkey project <strong>for</strong>warding<br />
and management<br />
services on a global scale<br />
to engineering procurement<br />
and construction<br />
companies. In addition,<br />
Panprojects specializes<br />
in serving the mining industry on mining emplacements<br />
and extensions where the end user or the<br />
final client is part of the mining industry or a supplier<br />
to it. For the power & energy sector, Panprojects<br />
provides tailor-made transport solutions<br />
<strong>for</strong> the supply of large generating plants, turbines,<br />
hydro-power plants and wind parks. Moreover,<br />
these services are offered to miscellaneous manufacturers<br />
and suppliers of other industrial plants,<br />
heavy and over-dimensional equipment and modules.<br />
This includes a large range of clients such<br />
as manufacturers of railway rolling stock, construction<br />
companies, steel and paper mills.<br />
Strong energy sector<br />
Driven by the increasing demand <strong>for</strong> oil and gas in<br />
2004, Panprojects continued to benefit from the<br />
global investment in new projects by the oil and gas<br />
and petrochemical industries. The main focus was<br />
on several large projects in sectors such as liquid<br />
natural gas, petrochemicals, refinery and oil field<br />
development in the Middle East (Qatar, Iran, Oman,<br />
Saudi Arabia), China, Australia, Central Asia (Azerbaijan,<br />
Kazakhstan), Indonesia, Equatorial Guinea,<br />
Nigeria, Mexico and on Russia’s Sakhalin Island.<br />
On Sakhalin, Panalpina plays a pioneering role,<br />
being one of the first companies to offer its services<br />
and operate its own organization.<br />
Rising commodity prices have fueled a global boom<br />
in mining site developments, prompting Panprojects<br />
to develop tailor-made logistics products <strong>for</strong> the<br />
mining industry. Some major greenfield mining<br />
and expansion projects were won during the year<br />
in South and Central America (Chile, Venezuela,<br />
Guatemala, Mexico, Peru), Burkina Faso, Russia<br />
and Turkey.<br />
For the power and energy industry, Panalpina supplied<br />
logistics services to major projects in Canada,<br />
Mexico, Chile, China, the Dominican Republic,<br />
USA, Russia, Saudi Arabia, Romania, Turkmenistan<br />
and Tanzania.<br />
The global tonnage handled by Panprojects in<br />
2004 increased considerably compared to previous<br />
years, enabling the development of strategic<br />
partnerships with major break bulk ocean carriers.<br />
A large number of project-related air and ocean<br />
freight charter fixtures has further strengthened<br />
Panprojects’ position as a major freight purchaser<br />
and broadened our in-house expertise.
Key Industries<br />
Panalpina Annual Report 2004 31
In<strong>for</strong>mation Technology<br />
32 Panalpina Annual Report 2004<br />
In<strong>for</strong>mation<br />
Technology
In<strong>for</strong>mation Technology<br />
Managing the in<strong>for</strong>mation flows<br />
The smooth transportation of goods requires efficient in<strong>for</strong>mation<br />
flows. Operational excellence is ensured by secure systems,<br />
powerful software, reliable hardware and high data quality. Together,<br />
these make a significant contribution to high productivity, efficient<br />
use of resources and customer satisfaction.<br />
In 2004, Panalpina focused on three key aspects<br />
of in<strong>for</strong>mation technology: continued standardization<br />
of hardware and software, the outsourcing of<br />
certain programming stages and the consolidation<br />
of the Data Center. All of this had one objective:<br />
even better use of electronic tools by staff, and thus<br />
increased productivity, improved customer service<br />
and, not least, lower costs. In the consolidation of<br />
the Data Center the aim<br />
was to reduce the number<br />
of server locations<br />
and, thus, the number of<br />
interfaces. This also<br />
enables the IT specialists’<br />
knowledge to be<br />
more focused and better<br />
utilized. At the local<br />
offices, on the other hand, it is vital to give staff<br />
proper on-site software training so that they can<br />
put their electronic tools to optimal and efficient<br />
use.<br />
Generally, Panalpina is pursuing a similar strategy<br />
in the IT area as in its core operation: Only the<br />
best is good enough. This is why Panalpina works<br />
together with partners, selected according to<br />
the “best-in-class” policy, who put their respective<br />
core competences to service <strong>for</strong> Panalpina.<br />
Panalpina does not move the goods physically, but<br />
organizes and monitors the entire goods chain;<br />
and IT is not Panalpina’s core business but rather<br />
a production factor of international shipping<br />
<strong>for</strong> which it manages in<strong>for</strong>mation media and data<br />
streams. For this reason, the company is increasingly<br />
outsourcing programming and development<br />
tasks to subcontractors, including one partner in<br />
India. Panalpina’s primary aim in this is not to save<br />
on staffing costs, but rather to better employ the<br />
competences of its own experts. Panalpina’s own<br />
IT specialists initiate, control and coordinate all<br />
activities carried out by the partners under<br />
Panalpina’s management. This means that content<br />
management, decision competencies and<br />
control of data streams, data preparation and data<br />
quality are per<strong>for</strong>med in-house.<br />
Consistent separation of in-house and outsourced<br />
activities resulted in the analysis and optimization<br />
of all internal processes. <strong>Solutions</strong> to complex problems<br />
require specialist knowledge that cannot be<br />
provided by the conventional “Jack-of-all-trades”.<br />
This is why Panalpina’s IT division has clear structures<br />
with well-defined responsibilities and<br />
processes which enable it to offer the company<br />
powerful and cost-efficient solutions.<br />
Continuous standardization of the IT tools and<br />
processes is one of the strategic objectives. As a<br />
global company, Panalpina applies global standards<br />
wherever possible – the financial area being<br />
an example. Furthermore, new systems specially<br />
developed <strong>for</strong> our own requirements are being<br />
employed globally. This means that the entire<br />
Panalpina organization is using the same systems,<br />
which can be supported<br />
globally by our own<br />
people. Panalpina rules<br />
out “stand-alone” solutions<br />
so that it can offer<br />
its customers creative<br />
solutions that meet their<br />
own individual requirements.<br />
Panalpina Annual Report 2004 33
Human Resources<br />
Human<br />
Resources<br />
34 Panalpina Annual Report 2004
Human Resources<br />
Panalpina’s assets are its staff<br />
As the industry saying goes, “Logistics is a people business”.<br />
Nowhere is this truer than at Panalpina, with its 13,000 employees<br />
around the world.<br />
The company’s strategy is not to invest in fixed<br />
assets such as trucks, planes or ships but to<br />
be a lean and flexible global supplier of logistics<br />
services, contracting the capacity required by customers<br />
from a variety of transport carriers. In other<br />
words, Panalpina’s assets are its staff. For at<br />
Panalpina, “A <strong>Passion</strong> <strong>for</strong> <strong>Solutions</strong>” is not a mere<br />
slogan but the job commitment of all employees.<br />
It’s they who make the difference!<br />
The company’s success in the highly competitive<br />
freight transport and logistics markets is not only<br />
determined by its global strategy, range of products<br />
and services, IT systems and other “hard” factors.<br />
With the strategic focus on operational excellence<br />
and profitable growth, well-qualified, trained and<br />
experienced staff who are motivated to do the best<br />
job at all times are absolutely essential. Their relationships<br />
with customers, their ability to react<br />
fast with optimal solutions to changing operational<br />
circumstances and other “soft” factors are major<br />
drivers <strong>for</strong> the company’s successful development.<br />
As a leading global company in the growing logistics<br />
industry, Panalpina is an attractive employer.<br />
The company offers a dynamic environment and<br />
worldwide job opportunities with its 500 offices in<br />
80 countries. Responsible <strong>for</strong> overall personnel<br />
issues, implementation of corporate HR guidelines<br />
and various global training programs is the corporate<br />
Human Resources department in Basel. The<br />
head office team is supported by human resources<br />
managers at regional and area levels who are<br />
responsible <strong>for</strong> recruitment, training at a local level<br />
and everyday personnel tasks.<br />
Global guidelines <strong>for</strong> a global business<br />
Panalpina continued to successfully implement its<br />
global guidelines in its regions and local areas<br />
around the world in 2004, and will maintain this path<br />
in 2005. These guidelines set uni<strong>for</strong>m standards <strong>for</strong><br />
personnel-related procedures and issues. The aim<br />
is to ensure that all parts of the company are working<br />
to the same set of basic rules. Regional and<br />
area managers can, however, vary these rules where<br />
local circumstances require. The key objective is<br />
to ensure that the company’s corporate values are<br />
spread throughout the entire worldwide network.<br />
These are based on the company’s positive, “cando”<br />
mentality and its entrepreneurial approach.<br />
In addition, a new IT tool will be rolled out during<br />
2005 to further improve personnel-related data<br />
collection and monitoring of productivity and other<br />
key indicators.<br />
Training tomorrow’s managers<br />
With its “Panacademy” learning plat<strong>for</strong>m, Panalpina<br />
has developed a range of targeted courses <strong>for</strong><br />
in-house staff training. The global training program<br />
covers all aspects of the company’s activities,<br />
including operations, sales and marketing, and is<br />
designed to offer staff at all levels the opportunity<br />
<strong>for</strong> further professional development. Employees<br />
are selected <strong>for</strong> the Management Development<br />
Program on the basis of their annual per<strong>for</strong>mance<br />
assessment and review.<br />
The first stage of the management development<br />
program “Steering Success” trains some 400 employees<br />
a year in basic management skills such<br />
as manager roles, personnel management and communications.<br />
In 2004, Panalpina launched a new,<br />
two-year training program “Navigating Our Future”.<br />
Some 80 talented managers were selected to<br />
participate in a series of seminars on issues such<br />
as business strategy, processes and more complex<br />
management skills. This program is designed<br />
to groom participants <strong>for</strong> rapid promotion to<br />
higher-ranking jobs. For about 40 top managers,<br />
Panalpina runs a flexible Executive Program<br />
comprised of short, intensive modules focusing on<br />
specific issues.<br />
Furthermore, training courses on general topics<br />
take place regularly at a regional or area level.<br />
Panalpina Annual Report 2004 35
Social Responsibility<br />
36 Panalpina Annual Report 2004<br />
Social Responsibility
Social Responsibility<br />
Shouldering responsibility<br />
Panalpina is part of a global economic and social system.<br />
Its actions are guided not only by economic principles,<br />
but also to a significant extent by social and ecological convictions.<br />
In supporting the various groups with which it<br />
has contact, the company thus engages in a wide variety of<br />
activities – globally.<br />
Panalpina and its entire staff were horrified at<br />
the devastation wrought by the tsunami flood<br />
disaster in Southeast Asia at the end of December<br />
2004 and the immeasurable suffering in its aftermath.<br />
The shock was all the greater given the company’s<br />
manifold personal and business relations<br />
in the affected countries. Hence Panalpina initiated<br />
a spontaneous group-wide donation appeal and<br />
used the donations to support a sustainable project<br />
aimed at helping the flood victims to help<br />
themselves. Be<strong>for</strong>e the disaster struck, more than<br />
100,000 people living in the northern part of the<br />
Indonesian island of Sumatra earned their living in<br />
the fishing industry. Mainly small boats were used<br />
to fish the coastal waters. The tsunami destroyed<br />
or damaged a large part of the fleet together with<br />
the port and processing plant infrastructure. Moreover,<br />
the fish stocks moved to the open sea, i.e.<br />
to areas where fishing with the conventional boats<br />
is impossible. Panalpina there<strong>for</strong>e backed a project<br />
to help these fishermen regain the means to earn<br />
a living. The scheme is overseen by a local aid<br />
organization sponsored by the Indonesian government.<br />
It involves the construction of modern<br />
fishing boats that will allow deep-water fishing.<br />
The fishermen are also being trained in the use<br />
of modern technology. Panalpina has financed a<br />
modern ship, named the Panalpina <strong>Passion</strong>,<br />
that will provide some 10 families with their daily<br />
income.<br />
Right to Sight<br />
Sustainable local aid is also at the heart of the<br />
“Right to Sight” initiative. In this project, Panalpina<br />
supports a Swiss Red Cross (SRC) campaign<br />
against poverty-induced blindness in Ghana by<br />
providing additional funding <strong>for</strong> an eye health<br />
program. Working in tandem with the national<br />
authorities and Ghanaian Red Cross, the SRC has<br />
set up regional eye clinics with the capacity to<br />
treat 80,000 patients a year. Panalpina is fully<br />
committed to the scheme,<br />
which brings concrete,<br />
on-the-spot relief to<br />
those afflicted. Having<br />
operated in the region<br />
over many years, the<br />
company naturally takes<br />
its social responsibilities<br />
very seriously.<br />
ISO 14001<br />
As a logistics company, Panalpina is in favor of<br />
environmentally efficient <strong>for</strong>warding solutions and<br />
handling methods. All the more gratifying, then,<br />
was the news that Panalpina Sweden had been<br />
honored with the Environmental Award 2004 by its<br />
client Tetra Laval. This accolade was bestowed by<br />
the Swedish company in recognition of Panalpina’s<br />
commitment to environmental protection.<br />
Panalpina Annual Report 2004 37
Consolidated Financial Statements 2004<br />
38 Panalpina Annual Report 2004
Consolidated and Annual Financial<br />
Statements 2004<br />
Consolidated Financial Statements 2004<br />
Contents<br />
Consolidated Financial<br />
Statements 2004<br />
Interview with the CFO 40<br />
Consolidated<br />
Income Statement 42<br />
Consolidated Balance Sheet 43<br />
Consolidated Statement<br />
of Recognized Income and<br />
Expenses 44<br />
Consolidated Cash Flow<br />
Statement 45<br />
Notes to the Consolidated<br />
Financial Statements 46<br />
Principal Group companies<br />
and participations 70<br />
Report of the Group Auditors 73<br />
Key Figures<br />
5-year review in CHF 74<br />
Balance Sheet<br />
5-year review in CHF 76<br />
Key Figures<br />
3-year review in EUR 77<br />
Balance Sheet<br />
3-year review in EUR 79<br />
Annual Financial Statements 2004<br />
Panalpina World Transport<br />
(Holding) Ltd.<br />
Income Statement 81<br />
Balance Sheet<br />
as of December 31<br />
(be<strong>for</strong>e appropriation of profit) 82<br />
Notes 84<br />
Appropriation of Profits 86<br />
Report of the<br />
Statutory Auditors 87<br />
Panalpina Annual Report 2004 39
Consolidated Financial Statements 2004<br />
Forwarding revenue<br />
in CHF millions<br />
8,000<br />
7,000<br />
6,000<br />
5,000<br />
Gross profit<br />
in CHF millions<br />
1,600<br />
1,200<br />
800<br />
400<br />
1999<br />
2000<br />
2001<br />
2002<br />
2003<br />
2004<br />
1999<br />
2000<br />
2001<br />
2002<br />
2003<br />
2004<br />
40 Panalpina Annual Report 2004<br />
Interview with the CFO Roland Wider<br />
A milestone in the implementation<br />
of our strategy<br />
Panalpina has achieved most of its objectives and the growth<br />
strategy is clearly starting to pay off. Revenues increased<br />
by 13.6% whereas the operating result rose by 14.3%. With<br />
this, Panalpina has far outgrown the market.<br />
What is your assessment of business<br />
per<strong>for</strong>mance in 2004?<br />
For Panalpina, 2004 was a crucial year, a veritable<br />
milestone in the implementation of our strategy.<br />
2002 and 2003 saw us embark on the program of<br />
restructuring needed to gear up the Group to the<br />
new strategy. Even though this process still has some<br />
way to run, we have achieved most of our objectives<br />
and the growth strategy is clearly starting to<br />
pay off. With revenues up 13.6% – or even 16.3 %<br />
in local currency – our per<strong>for</strong>mance is well above<br />
par <strong>for</strong> the market.<br />
Given the continuing pressure on margins, which<br />
triggered a further slide in gross profit margins,<br />
the rise in gross profits was limited to 8.2%. The<br />
operating result (EBITA), by contrast, rose by a<br />
respectable 14.3%. All in all, we are satisfied with<br />
2004. Our approach has proven sound and we<br />
are on course <strong>for</strong> sustainable and profitable growth.<br />
What share of revenue growth is attributable<br />
to the acquisitions?<br />
Last year’s takeover of Scottish company Grampian<br />
and the integration of the business activities of<br />
IAF, our long-standing agent in Korea, accounted<br />
<strong>for</strong> less than 1% of our increase in revenues.<br />
Hence, the growth achieved was almost exclusively<br />
organic driven. In future, however, we<br />
shall increasingly look <strong>for</strong> bolt-on acquisitions as<br />
a means of fostering organic growth.<br />
Which targets have not yet been achieved?<br />
What areas are you not satisfied with?<br />
Unlike our operating result, our operating cash flow<br />
fell. It is, of course, our avowed aim to lift this<br />
figure too. The volatility in operating cash flow is<br />
traceable to the fluctuations in net current assets.<br />
Here, the fast and consistent invoicing of our<br />
services offers room <strong>for</strong> improvement. Appropriate<br />
steps have been taken.<br />
What prompted the adjustment of the 2002 and<br />
2003 Group financial statements?<br />
In view of the planned going public, we already<br />
adopted the IAS 8 (revised) and IAS 19 (amended),<br />
valid from 2005 onwards, <strong>for</strong> financial year 2004.<br />
To ensure comparability, the two previous years<br />
also needed to be restated. Financial years 2002 to<br />
2004 are now presented consistently.<br />
What do you regard as the principal challenges<br />
and risks?<br />
The main challenge is posed by the fact that a substantial<br />
portion of our activities is increasingly<br />
becoming a commodity business in which price<br />
plays a pivotal role. This also explains the continuing<br />
sector-wide pressure on margins. In this kind<br />
of scenario, additional growth is the sole means of<br />
offsetting lower margins. Besides, we need growth<br />
<strong>for</strong> greater economies of scale and to pave the way<br />
<strong>for</strong> further productivity gains.<br />
One risk that we treat with particular caution is that<br />
of currency fluctuations: while we consolidate in<br />
Swiss francs, dollars and euros each make up some<br />
40% of revenues. It is our general policy to eliminate<br />
currency risks by means of hedging. Our aim<br />
is merely to safeguard our operating result and<br />
we in no way endeavor to achieve currency gains<br />
through speculation. In this regard, we have clearcut<br />
policies <strong>for</strong> individual countries; the worldwide<br />
net exposure is centrally hedged in Basel.
“While the growth achieved in 2004 was almost<br />
exclusively organic driven, we shall increasingly look<br />
<strong>for</strong> bolt-on acquisitions in future.”<br />
Consolidated Financial Statements 2004<br />
Panalpina Annual Report 2004 41
Consolidated Financial Statements 2004<br />
42 Panalpina Annual Report 2004<br />
Consolidated Income Statement<br />
<strong>for</strong> the years ended December 31, 2004, 2003 and 2002<br />
in CHF thousands Notes 2004 2003 2002<br />
Invoiced <strong>for</strong>warding services 7,452,291 6,560,879 6,363,591<br />
Customs, duty and taxes (1,331,946) (1,198,509) (1,188,893)<br />
Net <strong>for</strong>warding revenue 6,120,345 5,362,370 5,174,698<br />
Forwarding services from third parties (4,779,294) (4,123,508) (3,926,480)<br />
Contribution margin (gross profit) 1,341,051 1,238,862 1,248,218<br />
Personnel expenses 3 (782,383) (734,763) (725,896)<br />
Other operating expenses 4 (349,596) (308,973) (315,366)<br />
Gains on sales of non-current assets 5 2,925 299 4,236<br />
Depreciation of property, plant and equipment 10 (37,592) (42,834) (46,722)<br />
Amortization of intangible assets 11 (15,755) (12,945) (12,785)<br />
Impairment of financial assets 11 (5,799) (1,576) 0<br />
Operating result (EBIT) 152,851 138,070 151,685<br />
Financial income 6 6,577 5,515 10,300<br />
Financial expenses 6 (16,090) (19,038) (12,428)<br />
Earnings be<strong>for</strong>e taxes and minority interests 143,338 124,547 149,557<br />
Taxes on income 7 (30,949) (26,438) (32,818)<br />
Earnings be<strong>for</strong>e minority interests 112,389 98,109 116,739<br />
Minority interests 18 (966) (391) (1,111)<br />
Consolidated net earnings 111,423 97,718 115,628
Consolidated Balance Sheet<br />
<strong>for</strong> the years ended December 31, 2004, 2003 and 2002<br />
Assets<br />
Consolidated Financial Statements 2004<br />
in CHF thousands Notes 2004 2003 2002<br />
Current assets<br />
Cash and cash equivalents 230,097 330,700 299,487<br />
Financial assets held <strong>for</strong> trading 16,469 1,699 1,658<br />
Trade receivables 8 906,409 767,188 729,443<br />
Work in progress 58,541 57,042 57,042<br />
Other receivables and other current assets 9 51,398 54,821 49,881<br />
Total current assets 1,262,914 1,211,450 1,137,511<br />
Non-current assets<br />
Property, plant and equipment 10 159,232 153,946 167,420<br />
Financial and other assets 11 40,372 48,847 48,326<br />
Intangible assets 11 91,300 53,060 59,232<br />
Deferred tax assets 14 20,471 19,465 18,566<br />
Total non-current assets 311,375 275,318 293,544<br />
Total assets 1,574,289 1,486,768 1,431,055<br />
Liabilities and shareholders’ equity<br />
in CHF thousands Notes 2004 2003 2002<br />
Current liabilities<br />
Trade payables 330,680 286,054 272,561<br />
Other payables and accruals 94,595 80,347 127,315<br />
Accrued cost of services 139,868 182,486 156,267<br />
Borrowings 15 36,324 32,020 35,610<br />
Other liabilities 12 61,221 43,983 40,317<br />
Current income tax liabilities 19,925 23,080 19,911<br />
Total current liabilities 682,613 647,970 651,981<br />
Non-current liabilities<br />
Borrowings 15 309 132 751<br />
Provisions 13 69,722 79,114 71,473<br />
Deferred tax liabilities 14 21,332 19,457 24,378<br />
Total non-current assets 91,363 98,703 96,602<br />
Total liabilities 773,975 746,673 748,583<br />
Minority interests 18 3,484 2,916 2,956<br />
Shareholders’ equity<br />
Share capital 16 50,000 50,000 50,000<br />
Translation and other reserves 17 (87,264) (66,940) (55,164)<br />
Retained earnings 17 834,094 754,119 684,680<br />
Total shareholders’ equity 796,830 737,179 679,516<br />
Total liabilities and shareholders’ equity 1,574,289 1,486,768 1,431,055<br />
Panalpina Annual Report 2004 43
Consolidated Financial Statements 2004<br />
44 Panalpina Annual Report 2004<br />
Consolidated Statement of<br />
Recognized Income and Expenses<br />
<strong>for</strong> the years ended December 31, 2004, 2003 and 2002<br />
in CHF thousands Notes 2004 2003 2002<br />
Net investment hedge<br />
Transferred to profit or loss <strong>for</strong> the period<br />
Amounts recognized in equity <strong>for</strong> pension plan<br />
0 0 2,166<br />
Actuarial gains/(losses) 20 (9,818) 7,604 (30,546)<br />
Effect of impact of limit in paragraph 58b 20 7,876 (4,955) 26,357<br />
Foreign currency impact 20 9 (55) 40<br />
Tax effect 14 484 (874) 1,046<br />
Exchange difference on translations of <strong>for</strong>eign operations (20,324) (11,776) (47,491)<br />
Net earnings recognized directly in equity (21,773) (10,056) (48,428)<br />
Consolidated net earnings 111,423 97,718 115,628<br />
Total recognized earnings <strong>for</strong> the year 89,650 87,662 67,200
Consolidated Cash Flow Statement<br />
<strong>for</strong> the years ended December 31, 2004, 2003 and 2002<br />
Consolidated Financial Statements 2004<br />
in CHF thousands Notes 2004 2003 2002<br />
Total cash flow from operating activities 22 97,645 142,383 124,335<br />
Interest received 5,727 5,021 4,899<br />
Interest paid (7,445) (7,445) (9,620)<br />
Taxes paid (36,995) (23,209) (34,688)<br />
Other liabilities utilized (11,446) (20,042) (10,240)<br />
Long-term provisions utilized (13,540) (7,087) (2,783)<br />
Net cash flow from operating activities 33,946 89,621 71,903<br />
Cash flow from investing activities<br />
Property, plant and equipment (38,324) (32,637) (45,580)<br />
Investments (incl. goodwill) in consolidated subsidiaries 23 (39,699) 0 (74)<br />
Investments held <strong>for</strong> trading (14,344) (96) (17,375)<br />
Other financial investments (7,053) (7,044) (4,232)<br />
Intangible assets (31,389) (6,581) (2,997)<br />
Total investments (130,809) (46,358) (70,258)<br />
Proceeds from sales of property, plant and equipment 9,175 1,334 12,379<br />
Proceeds from sales of investments 24 0 0 1,637<br />
Loan repayments 3,382 1,291 2,106<br />
Proceeds from sales of securities 0 71 10<br />
Repayment of other financial assets 5,658 1,511 239<br />
Sale of intangible assets 898 53 1,450<br />
Total cash flow from investing activities (111,696) (42,098) (52,437)<br />
Cash flow from financing activities<br />
Proceeds from (repayment of) short-term borrowings 5,654 (1,432) 16,637<br />
Proceeds from (repayment of) long-term borrowings (670) (129) 867<br />
Dividends paid (30,000) (30,000) (20,000)<br />
Dividends paid to minority interests (94) (128) (212)<br />
Total cash flow from financing activities (25,110) (31,689) (2,708)<br />
Effect of exchange rate changes on cash and cash equivalents 2,257 15,379 34,619<br />
Increase (decrease) in cash and cash equivalents (100,603) 31,213 51,377<br />
Cash and cash equivalents at the beginning of the year 330,700 299,487 248,110<br />
Cash and cash equivalents at the end of the year 230,097 330,700 299,487<br />
Panalpina Annual Report 2004 45
Consolidated Financial Statements 2004<br />
46 Panalpina Annual Report 2004<br />
Notes to the<br />
Consolidated Financial Statements<br />
1. Accounting policies used in the consolidation<br />
General<br />
Panalpina World Transport (Holding) Ltd. (the Company) with its subsidiaries (together the Group) is one of the world’s<br />
leading logistics and <strong>for</strong>warding companies specialized in international air and sea transports.<br />
The Company is a limited company registered and domiciled in Basel. The address registered is Viaduktstrasse 42,<br />
4002 Basel, Switzerland.<br />
The consolidated financial statements have been approved <strong>for</strong> issue by the Board of Directors on April 19, 2005.<br />
Basis of preparation<br />
The consolidated financial statements are prepared in accordance with historical cost convention except <strong>for</strong> the revaluation<br />
to market value of certain financial assets and liabilities and comply with the International Financial Reporting Standards<br />
(IFRS). The accounting policies applied in preparing the financial statements are described below.<br />
The preparation of the financial statements requires management to make assumptions and estimates about future developments<br />
that affect the financial situation and per<strong>for</strong>mance set out in the financial statements. The actual outcome may differ<br />
from the assumptions and estimates made.<br />
Early adoption of standards<br />
In 2004, the Group decided to adopt early IAS 8 (revised 2003) “Accounting Policies, Changes in Accounting Estimates and<br />
Errors” and IAS 19 (amended 2004) “Employee Benefits”. Consequently the 2003 and the 2002 comparatives have been<br />
amended correspondingly. All changes in the accounting policies have been made in accordance with the transition provision<br />
set out in the two revised standards.<br />
The adoption of IAS 8 (revised 2003) resulted in a change of accounting policy regarding the treatment of errors. In the<br />
past, errors prior to that date have been corrected in the income statement in the period the error has been discovered.<br />
In accordance with IAS 8 (revised 2003) the Group is correcting material prior period errors retrospectively by restating the<br />
comparative amounts <strong>for</strong> the prior periods presented in which the error occurred. If the error occurred be<strong>for</strong>e 2002, the<br />
opening balances of assets, liabilities and equity have been restated.<br />
As a result of periodical review the Group has discovered in 2003 and 2004 that in selected subsidiaries in the past some<br />
accruals have been overstated or understated due to incorrect calculation. In the financial statement 2003, the error<br />
discovered, was corrected in the income statement 2003. In accordance with IAS 8 (revised 2003) this error is corrected<br />
retrospectively. The error discovered in 2004 had no effect on the presented income statement. There<strong>for</strong>e only the opening<br />
balance of 2002 was restated. As a result balance sheet and income statement are affected as follows:<br />
in CHF thousands Notes 2002 2003<br />
Increase (decrease) in accrued cost of services (11,705) 4,735<br />
Increase (decrease) in deferred tax assets 14 1,383 1,383<br />
Increase (decrease) in deferred tax liabilities 14 6,354 0<br />
Increase (decrease) in equity 31/12/ net of tax 6,734 (3,352)<br />
(Increase) decrease in <strong>for</strong>warding expenses 7,033 (17,139)<br />
(Increase) decrease in income taxes 7 (2,718) 6,624<br />
Increase (decrease) in net consolidated earnings 4,315 (10,515)
Consolidated Financial Statements 2004<br />
In 2004 the Group discovered that in the past invoices have been erroneously overcharged. The amounts were corrected<br />
in the respective periods presented. Balance Sheet and Income Statement are affected as follows:<br />
in CHF thousands Notes 2002 2003<br />
Increase (decrease) in provisions 13 3,642 4,408<br />
Increase (decrease) in deferred tax assets 14 1,238 1,499<br />
Increase (decrease) in equity 31/12/ net of tax (2,404) (2,909)<br />
Increase (decrease) in <strong>for</strong>warding revenue (1,702) (1,261)<br />
(Increase) decrease in income taxes 7 579 429<br />
Increase (decrease) in net consolidated earnings (1,123) (832)<br />
The adoption of IAS 19 (amended 2004) results in a change of accounting policy <strong>for</strong> the recognition of all actuarial gains<br />
and losses. The Group decided to recognize all actuarial gains and losses <strong>for</strong> defined benefit plans in the periods in<br />
which they occur outside the Income Statement in the Statement of Recognized Income or Expenses. Balance Sheet<br />
and Income Statement are affected as follows:<br />
in CHF thousands Notes 2002 2003<br />
Increase (decrease) in pension plan assets 20 (33,491) (32,886)<br />
Increase (decrease) in provisions 13 3,683 349<br />
Increase (decrease) in deferred tax liabilities 14 (9,449) (8,241)<br />
Increase (decrease) in equity 31/12/ net of tax (27,725) (24,994)<br />
(Increase) decrease in personnel expenses 3 (380) 1,345<br />
(Increase) decrease in income taxes 7 95 (334)<br />
Increase (decrease) in net consolidated earnings (285) 1,011<br />
New accounting pronouncements – not yet adopted<br />
In December 2003, the International Accounting Standards (IAS) were amended when the IASB released revised IAS 32,<br />
Financial Instruments: Disclosure and Presentation and IAS 39, Financial Instruments: Recognition and Measurement.<br />
These standards replace IAS 32 (revised 2000), and supersede IAS 39 (revised 2000), and must be applied <strong>for</strong> annual<br />
periods beginning on or after January 1, 2005. In December 2003, as a part of the IASB’s project to improve international<br />
accounting standards, the IASB released revisions to the following standards that supersede the previously released<br />
versions of those standards: IAS 1, Presentation of Financial Statements; IAS 2, Inventories; IAS 10, Events after the<br />
Balance Sheet Date; IAS 16, Property, Plant and Equipment; IAS 17, Leases; IAS 21, The Effects of Changes in Foreign<br />
Exchange Rates; IAS 24, Related Party Disclosures; IAS 27, Consolidated and Separate Financial Statements; IAS 28,<br />
Investments in Associates; IAS 31, Interests in Joint Ventures; IAS 33, Earnings per Share and IAS 40, Investment<br />
Property. The revised standards must be applied <strong>for</strong> annual periods beginning on or after January 1, 2005. During 2004<br />
the following International Financial Reporting Standards (IFRS) were issued:<br />
IFRS 2, Share-Based Payments; IFRS 4, Insurance Contract; IFRS 5, Non-Current Assets Held <strong>for</strong> Sale and Discontinued<br />
Operations and IFRS 6, Exploration <strong>for</strong> and Evaluation of Mineral Resources.<br />
Under IFRS 3, with effect from January 1, 2005, goodwill originated from acquisition be<strong>for</strong>e March 31, 2004 is considered<br />
to have an indefinite life and is not amortized, but is subject to annual impairment testing. Goodwill of CHF 20.1 million<br />
recognized in the Group’s financial statement on the transaction occurred after March 31, 2004 is already subject to the<br />
new accounting policy and has not been amortized.<br />
The management has reviewed the new accounting pronouncement released in 2004. The adoption of the new pronouncements,<br />
except <strong>for</strong> the early adopted standards as described above, does not have any significant impact on the<br />
Group’s income statement and financial position.<br />
Panalpina Annual Report 2004 47
Consolidated Financial Statements 2004<br />
48 Panalpina Annual Report 2004<br />
Scope and method of consolidation<br />
The consolidated financial statements comprise the financial statements of all companies which are directly or indirectly<br />
controlled by Panalpina. Control is defined as the power to govern the financial and operating policies of an enterprise so as<br />
to obtain benefits from its activities.<br />
The purchase method of accounting is used <strong>for</strong> acquired businesses. Companies acquired or disposed of during the year are<br />
included in the consolidated financial statements from the date of acquisition or up to the date of disposal. The cost of an<br />
acquisition is measured as the fair value of the assets given and liabilities incurred at the date of exchange, plus costs directly<br />
attributable to the acquisition.<br />
Identifiable assets acquired and liabilities and contingent liabilities assumed in a business combination are measured initially<br />
at their fair value on the acquisition date, irrespective of the extent of any minority interest. The excess of the costs of<br />
acquisition over the Group’s share of the fair value of the acquired subsidiary’s identifiable net assets is recorded as goodwill.<br />
If the cost of acquisition is less than the Group’s share of the fair value of the net asset of the subsidiary acquired, the<br />
difference is recognized directly in the income statement.<br />
Intercompany transactions, debts and receivables as well as intercompany income and expenses have been eliminated.<br />
Investments in associated companies are those entities in which the Group is able to exercise a significant influence over the<br />
financial and operational policy, generally accompanying a shareholding of between 20% and 50% of the voting rights.<br />
Associates are accounted <strong>for</strong> using the equity method and initially recognized at cost.<br />
The majority of Group companies and equity investments are listed on page 70 ff.<br />
Minority interests<br />
The interests of minority shareholders in net assets and net income are disclosed as minority interests.<br />
Reclassification<br />
Certain prior-year balances have been reclassified to con<strong>for</strong>m to the current year’s presentation.<br />
In 2004, Management decided to disclose work in progress and accrued cost of services separately from trade payables.<br />
Management believes that a gross disclosure of work in progress and accrued cost of services is a fair presentation of the<br />
Group’s activities.<br />
Revenue recognition<br />
Net <strong>for</strong>warding revenue includes services <strong>for</strong> <strong>for</strong>warding invoiced to third parties less charges <strong>for</strong> customs, duty and taxes.<br />
Net <strong>for</strong>warding revenue is recognized at the time the services are per<strong>for</strong>med and invoiced. Logistics projects and other services<br />
with a longer period of delivery are recognized in the accounting period in which the service is rendered, by reference<br />
to completion of the specific transaction assessed on the basis of the actual service provided as a proportion of the total<br />
services to be provided.<br />
Contribution margin (gross profit) includes net <strong>for</strong>warding revenue from services rendered less related expenses <strong>for</strong> services<br />
provided by third parties net of customs, duty and taxes.<br />
Other revenues, e.g. dividends, interest, licenses etc., are accrued as they arise. For the financial statements they are<br />
recorded in the appropriate period, to the extent that a legal right to receive the payment was established.<br />
Financial risk management<br />
The Group is aware that in conducting the core business different financial risks may impact the financial per<strong>for</strong>mance.<br />
There<strong>for</strong>e, financial risk management is considered an integral part of managing the business. The Group’s activities<br />
expose it primarily to the following financial risk factors: <strong>for</strong>eign exchange, interest rates, credit, settlement and liquidity.<br />
The Group attempts to minimize potential adverse effects on the financial per<strong>for</strong>mance.<br />
The Board defines financial policies and related risk management objectives. A Risk Committee under the direct supervision<br />
of the Chief Executive Officer meets on a regular basis and is responsible <strong>for</strong> establishing financial strategies, which are<br />
executed by Corporate Treasury.<br />
There is a clear separation of duties between Front, Middle and Back Office. The Middle Office is independently in charge<br />
of monitoring compliance to the strategies with reference to the approved Risk Committee decisions. Operational risk and<br />
independent per<strong>for</strong>mance calculation are also under Middle Office supervision.<br />
Clear Treasury Management guidelines define approved financial transactions and products, counterparty limits, minimum<br />
creditworthiness and transaction limits.<br />
In line with the above-mentioned policy the Group only enters into derivatives transactions that are directly linked to underlying<br />
recognized and anticipated exposures arising from operating and/or financial assets or liabilities.
Financial risk factors<br />
Consolidated Financial Statements 2004<br />
Foreign exchange risk<br />
The Group operates internationally and is exposed to <strong>for</strong>eign exchange risk arising from various currency exposures,<br />
primarily with respect to the US dollar. Foreign exchange risk arises from future commercial transactions, recognized<br />
assets and liabilities and net investments in <strong>for</strong>eign operations.<br />
To manage <strong>for</strong>eign exchange risks arising from future commercial transactions or recognized assets and liabilities,<br />
entities in the Group use <strong>for</strong>ward contracts, transacted generally with Group Treasury. Foreign exchange risk arises when<br />
future commercial transactions or recognized assets and liabilities are denominated in a currency that is not the Group<br />
entity’s measurement currency. Group Treasury is responsible <strong>for</strong> managing the net position using external derivatives<br />
contracts.<br />
Interest rate risk<br />
The absence of significant interest-bearing liabilities in general and their short-term nature limit exposure to interest<br />
rate risk. The Group has a clear funding policy that <strong>for</strong>bids affiliates from borrowing in <strong>for</strong>eign currency and has a clear<br />
preference <strong>for</strong> intercompany financing. Affiliates are also required to repatriate their excess cash. Liquidity is mainly<br />
managed at the corporate level by using money market products. Derivative instruments are used to manage duration of<br />
financial instruments in a prudent way.<br />
Credit risk<br />
Credit risk stems from counterparty’s failure to meet its obligation. The Group is exposed to credit risk on financial<br />
instruments, mainly its liquid assets, derivative assets and trade receivables. Credit risk is managed in accordance with<br />
clear and well-acknowledged guidelines.<br />
Liquid assets are invested with highly rated borrowers and there is no exposure of credit risk.<br />
Trade receivables are strictly monitored and clear guidelines are established in order to set credit limits, approval procedures,<br />
and procedures to monitor overdue items. Concentration of credit risk in trade receivables is not material.<br />
Settlement risk<br />
This risk is managed by monitoring counterparty activity, settlement limits and by fixing clear limits.<br />
Liquidity risk<br />
The Group holds highly liquid securities. Liquid assets and marketable securities usually have a short-term horizon<br />
in order to match any funding need.<br />
Critical accounting estimates and judgments<br />
Estimates and judgments are continually evaluated and are based on historical experience and other factors, including<br />
expectations of future events that are believed to be reasonable under the circumstances.<br />
The Group makes estimates and assumptions concerning the future. The resulting accounting estimates will, by definition,<br />
seldom equal the related actual results. The estimations and assumptions that have a significant risk of causing a<br />
material adjustment to the carrying amount of assets and liabilities within the next financial year are discussed below.<br />
Impairment of tangible and intangible assets<br />
Long-lived assets are regularly reviewed <strong>for</strong> impairment, including intangibles and goodwill, whenever events or changes<br />
in circumstance indicate that the balance sheet-carrying amount of the asset may not be recoverable. In order to<br />
assess if there is any impairment, estimates are made of the future cash flows expected to result from the use of the<br />
asset or cash-generating unit and its eventual disposal and of the fair value of the asset or cash-generating unit.<br />
Litigation provisions<br />
A number of subsidiaries are subject to litigation arising out of the normal conduct of their businesses, as a result of<br />
which claims could be raised against them that might not be covered by existing provisions or by insurance.<br />
The Group believes that the outcomes of such actions, if any, would not be material to the Group’s financial condition,<br />
but could be material to future results of operations in a given period.<br />
Income taxes<br />
The Group is subject to income taxes in numerous jurisdictions. Significant judgment is required in determining the<br />
worldwide provision <strong>for</strong> income taxes. There are many transactions and calculations <strong>for</strong> which the ultimate tax determination<br />
is uncertain during the ordinary course of business.<br />
Accounting <strong>for</strong> derivative financial instruments and hedging activities<br />
Derivative financial instruments are used to hedge <strong>for</strong>eign currency and interest rate risk. All derivatives are initially<br />
recognized at fair value on the date a derivative contract is entered into and are subsequently remeasured at fair value.<br />
The method of recognizing the resulting gain or loss depends on whether the derivative qualifies as a hedging instrument,<br />
and if so, the nature of the item being hedged.<br />
Panalpina Annual Report 2004 49
Consolidated Financial Statements 2004<br />
50 Panalpina Annual Report 2004<br />
To qualify <strong>for</strong> hedge accounting, the hedging relationship must meet several strict conditions on documentation, probability of<br />
occurrence, hedge effectiveness and reliability of measurement. If these conditions are not met, then the financial instrument<br />
does not qualify <strong>for</strong> hedge accounting. In this case the hedging instrument and the hedged item are valued independently of<br />
one another. The derivative hedging instrument is reported at fair value with the changes in fair value included in income<br />
(expenses).<br />
For qualifying fair value hedges, the derivative financial instruments are carried at fair value and gains or losses are recognized<br />
in profit or loss. Additionally, the fair value gain or loss on the hedged item attributable to the hedged risk is recognized<br />
in profit or loss.<br />
Normally, the Group consciously decides not to designate derivative instruments <strong>for</strong> hedge accounting according to IAS 39<br />
(although they all are hedging instruments from an economical point of view). Otherwise, the Group can designate individual<br />
derivatives as either:<br />
• a hedge of the exposure to changes in fair value of a recognized asset or liability (fair value hedge)<br />
• a hedge of the exposure to variability in cash flows associated with a recognized asset or liability or a highly probable<br />
<strong>for</strong>ecast transaction (cash flow hedges) or<br />
•a hedge of net investments in a <strong>for</strong>eign operation.<br />
For qualifying cash flow hedges, the derivative hedging instrument is recorded at fair value. The portion of any change in fair<br />
value that is an effective hedge is included in equity, and any remaining ineffective portion is reported in income (expense).<br />
If a hedged <strong>for</strong>ecast transaction results in the recognition of a non-financial asset or liability, the cumulative change in fair value<br />
of the hedging instrument that has been recorded in equity is included in the initial carrying value of that asset or liability at<br />
the time it is recognized. For all other qualifying cash flow hedges, the cumulative changes in fair value of the hedging instrument<br />
that have been recorded in equity are included in income (expense) at the time when the <strong>for</strong>ecasted transaction affects<br />
net income.<br />
For qualifying hedges of net investments in <strong>for</strong>eign operations, the hedging instruments are accounted similar to cash flow<br />
hedges. The <strong>for</strong>eign exchange portion of any change in fair value that is an effective hedge is included in equity as translation<br />
reserve. Any remaining ineffective portion is recorded in income (expense). If the hedged subsidiary is disposed of, then<br />
the cumulative amounts that have been recorded in equity are included in income (expense) at the time of the disposal.<br />
Foreign currency translation<br />
Presentation and measurement currency<br />
The consolidated financial statements of the Group are presented in Swiss francs. The financial statements of each<br />
of the Group’s entities are measured using the currency of the primary economic environment in which the entity operates,<br />
which is generally the local currency (measurement currency).<br />
Translation of Group companies<br />
Expenses and revenue of the consolidated companies are translated at the average exchange rates prevailing during the<br />
year. All assets and liabilities are translated at year-end exchange rates. The resulting translation differences are recognized<br />
in shareholders’ equity. In addition the Group recognizes in equity exchange differences on a monetary item that in substance<br />
<strong>for</strong>ms part of net investments in a subsidiary (quasi-equity loans). These exchange differences are taken to income<br />
statement on the sale of a subsidiary or repayment of an intercompany quasi-equity loan.<br />
Foreign currency transactions<br />
Transactions in a <strong>for</strong>eign currency other than the measurement currency of an entity are translated into the measurement<br />
currency using the exchange rates prevailing at the dates of the transactions. Foreign exchange gains and losses resulting<br />
from the settlement of such transactions and from the translation at closing exchange rates of monetary assets and liabilities<br />
are recognized in the income statement (or – in very limited circumstances – in equity when the <strong>for</strong>eign currency transaction<br />
is designated as a cash flow hedge or a net investment hedge).<br />
Translation differences on non-monetary items, such as equities classified as available-<strong>for</strong>-sale financial assets, are included<br />
in the other reserves as equity.<br />
The most important exchange rates used in the reported financial statements are:<br />
2004 2003 2002<br />
Balance Income Balance Income Balance Income<br />
Sheet Statement Sheet Statement Sheet Statement<br />
EUR 1.5427 1.5438 EUR 1.5590 1.5161 EUR 1.4542 1.4680<br />
USD 1.1322 1.2445 USD 1.2368 1.3416 USD 1.3881 1.5587<br />
GBP 2.1804 2.2776 GBP 2.2056 2.2002 GBP 2.2276 2.3429
Cash and cash equivalents<br />
Consolidated Financial Statements 2004<br />
Cash and cash equivalents included in the balance sheet and cash flow statement represents cash, bank and postal<br />
cheques, bills of exchange, bank current account balances and time deposits as well as highly liquid money market<br />
paper with an original maturity period of less than three months. Bank current account liabilities are included under<br />
short-term borrowings.<br />
Trade receivables<br />
Accounts receivable from third parties represent invoiced amounts less valuation adjustments <strong>for</strong> impairments. Impairment<br />
adjustments are established based upon the difference between the receivable and the estimated net collectible<br />
amount discounted to present value at the balance sheet date.<br />
Work in progress<br />
Work in progress represents the gross amount due from customers <strong>for</strong> <strong>for</strong>warding services in progress <strong>for</strong> which costs<br />
incurred exceed progress billings. For logistics projects and other services with a longer period of delivery recognized<br />
profits are included.<br />
Property, plant and equipment<br />
Property, plant and equipment have been valued at the cost of acquisition and are depreciated on a straight-line basis to<br />
the income statement over the following estimated useful lives:<br />
Land is not depreciated –<br />
Warehouse and office buildings 25–40<br />
Warehouse and transportation equipment 3–10<br />
Office furnishings and equipment 5–10<br />
EDP hardware 3<br />
Trucks, trailers and special vehicles 3–10<br />
Automobiles 3–5<br />
Assets acquired under financial leases are initially recognized at fair value or present value of minimum lease payments if<br />
lower and are depreciated over shorter of useful life and the lease term.<br />
Subsequent costs are included in the asset’s carrying amount or recognized as a separate asset, as appropriate, only<br />
when it is probable that future economic benefits associated with the item in excess of the originally assessed standard<br />
of per<strong>for</strong>mance will flow to the Group and the cost of the item can be measured reliably. All costs <strong>for</strong> repair and maintenance<br />
are charged to the income statement during the period in which they are incurred.<br />
Gains and losses on disposals are determined by comparing proceed with carrying amount. These are included in the<br />
income statement.<br />
Leases<br />
Financial leasing agreements are recorded at the date of the agreement. Lease payments are divided into an amortization<br />
of a finance lease liability and an interest element. The interest element is charged to the income statement using the<br />
effective interest rate method.<br />
Leases of assets under which all the risks and benefits of ownership are substantially retained by the lessor are classified<br />
as operating leases. Payments made under operating leases are charged to the income statement on a straight-line<br />
basis over the period of the lease.<br />
Investments<br />
The Group classifies its financial investments into the following categories according to IAS 39:<br />
• Held-<strong>for</strong>-trading<br />
• Originated loans and receivables<br />
• Available-<strong>for</strong>-sale<br />
The classification depends on the nature of the asset and the purpose of the transaction. The Group does not classify<br />
any financial instruments as “held-to-maturity”.<br />
Years<br />
Panalpina Annual Report 2004 51
Consolidated Financial Statements 2004<br />
52 Panalpina Annual Report 2004<br />
Held-<strong>for</strong>-trading<br />
A financial asset is classified as held-<strong>for</strong>-trading if acquired principally <strong>for</strong> the purpose of generating a profit from short-term<br />
fluctuations in price. The Group’s investments in marketable securities are classified as held-<strong>for</strong>-trading. Such investments<br />
are included in current assets in the balance sheet. Marketable securities comprise only exchange-traded and readily realizable<br />
investments.<br />
Derivative financial instruments are generally categorized as held-<strong>for</strong>-trading unless they are designated and qualifying as<br />
hedging instruments (the treatment of derivative financial instruments is outlined in the section “Financial risk management”).<br />
Receivables<br />
Receivables originated by the Group are financial assets that are created by providing money or services directly to the debtor.<br />
Such receivables are not quoted and not originated with the intent to be sold immediately or in the near term. Receivables<br />
are presented in current assets <strong>for</strong> maturities up to twelve months, while other receivables are presented in non-current assets.<br />
Loans and receivables are included in the following line items of the balance sheet:<br />
• Trade receivables (the treatment of the trade receivables is outlined in more details in the “Trade receivables” section)<br />
• Other receivables and other current assets include<br />
– Short-term active loans<br />
– Other receivables<br />
• Financial and other assets<br />
– Receivables<br />
Available-<strong>for</strong>-sale<br />
All non-derivative financial assets, which are not categorized as held-<strong>for</strong>-trading or as originated loans and receivables,<br />
are classified as available-<strong>for</strong>-sale. Available-<strong>for</strong>-sale financial assets, which include equity securities, are presented as<br />
non-current assets, unless they are expected to be sold within twelve months after the balance sheet date.<br />
Recognition and measurement<br />
Purchases and sales of investments are recognized on settlement date. Investments are initially recognized at fair value of<br />
consideration given plus transaction costs.<br />
Held-<strong>for</strong>-trading investments are subsequently carried at fair value, with all changes in fair value recorded as financial income<br />
(expenses) in the period in which they arise. Originated loans and receivables are subsequently carried at amortized cost<br />
using the effective interest rate method. Available-<strong>for</strong>-sale investments are subsequently carried at fair value, with changes in<br />
fair value recorded in equity (except <strong>for</strong> currency revaluation gains/losses on monetary available-<strong>for</strong>-sale financial assets,<br />
which are included in profit or loss according to IAS 21). When available-<strong>for</strong>-sale investments are sold, impaired or otherwise<br />
disposed of, the cumulative gains and losses previously recognized in equity are included in financial income (expenses) <strong>for</strong><br />
the current period.<br />
Fair values<br />
The fair value of investments is based on quoted bid prices <strong>for</strong> exchange traded instruments. For unlisted securities or<br />
over-the-counter transactions, the Group determines the fair value using appropriate valuation techniques (such as net present<br />
value or option pricing models). Those equity investments <strong>for</strong> which fair values cannot be measured reliably are recognized<br />
at cost less impairment. The Group’s impairment policy is outlined in greater detail in the “Impairment of assets” section.<br />
Intangible assets<br />
Acquired intangible assets such as brands, trademarks and software licenses are shown at historical cost less accumulated<br />
amortization and impairment losses if any. Customer lists and customer relations acquired in a business combination after<br />
March 31, 2004 are separately identified and recognized at fair value at the date of acquisition. The mentioned intangible assets<br />
have a definite useful life and are amortized. Amortization is calculated using the straight-line method. Software licenses are<br />
amortized over 3–5 years, all other intangible assets over a maximum of 15 years.<br />
Goodwill represents the excess of the cost of an acquisition over the fair value of the Group’s share of the net identifiable assets<br />
of the acquired subsidiary at the date of acquisition. Acquisitions prior to March 31, 2004 were accounted in accordance with<br />
IAS 22 and goodwill was amortized over its useful life (maximum 10 years). The remaining useful life is reviewed periodically.<br />
Acquisitions since April 1, 2004 are accounted in accordance with IFRS 3 and goodwill is no longer amortized but instead is<br />
assessed annually <strong>for</strong> impairment. The unamortized goodwill is taken into account in calculating the gain or loss on disposal<br />
of an investment.<br />
Costs in connection with internally developed software are recognized as an expense as incurred. Computer software developed<br />
internally is capitalized if the development costs can be measured reliably and if the software product is of long-term<br />
use <strong>for</strong> the organization. Capitalized software development costs recognized as assets are amortized over their estimated<br />
useful life (not exceeding three years). Costs <strong>for</strong> maintaining and modifying existing programs are charged to the income<br />
statement.
Impairment of assets<br />
Consolidated Financial Statements 2004<br />
Tangible assets and identifiable intangibles assets are reviewed <strong>for</strong> impairment whenever events or changes in circumstances<br />
indicate that the carrying amount of the asset may not be recoverable. Goodwill acquired since March 31, 2004<br />
is reviewed <strong>for</strong> impairment annually. When events or changes in circumstances indicate the value may not be fully<br />
recoverable, the Group estimates its value in use based on the future cash flows. If the carrying amount of the asset<br />
exceeds the higher of its value in use or its fair value less cost to sell, the Group recognizes an impairment loss.<br />
For purposes of assessing impairment, assets are grouped at the lowest levels <strong>for</strong> which there are separately identifiable<br />
cash flows (cash-generating units).<br />
Borrowings<br />
Borrowings are recognized initially as proceeds received, net of transaction costs incurred. Borrowings are subsequently<br />
measured at amortized cost and the difference between the proceeds (net of transaction costs) and the redemption<br />
value amortized over the lifetime of the borrowings using the effective interest rate method.<br />
Provisions<br />
The Group establishes provisions if it has a current legal or constructive obligation as a result of past events requiring<br />
a settlement with third parties and if the amount of the obligation can be reliably estimated.<br />
Provisions are established specifically <strong>for</strong>:<br />
• Employees’ pension fund balances, and<br />
• Claims from freight <strong>for</strong>warding<br />
Current and deferred income taxes<br />
Current income taxes are accrued <strong>for</strong> the taxable income of the current financial year.<br />
Deferred taxes arise from temporary differences between the tax bases of assets and liabilities and their carrying values<br />
<strong>for</strong> financial reporting. The calculation is made using the balance sheet liability method applying currently enacted tax<br />
rates expected to apply when the temporary difference reverse. The tax effects of loss carry <strong>for</strong>wards and deductible<br />
temporary differences are capitalized only if it is probable that they can be set off against future taxable profits or taxable<br />
temporary differences. The Group’s deferred tax assets and deferred tax liabilities are disclosed separately under noncurrent<br />
assets and non-current liabilities respectively. Changes in deferred tax liabilities and assets are reported in the<br />
income statement. An exception is deferred tax on transactions that are recorded directly in shareholders’ equity. Such<br />
deferred taxes are also recorded in shareholders’ equity.<br />
Provisions <strong>for</strong> withholding tax, which would arise on dividend distributions to the parent companies, are made only if the<br />
parent company intends to declare a dividend. As a rule subsidiaries’ profits are considered permanently reinvested.<br />
Employee benefits<br />
Short-term benefits, such as salaries and wages, contributions to compulsory social security schemes, vacation accruals<br />
and bonuses, are accrued periodically and charged to the income statement when the employee provides related services.<br />
In order to provide long-term employee benefits, such as pensions, the Group operates legally separate pension funds<br />
providing benefits according to defined benefit or defined contribution plans. The plan assets funding the benefits<br />
are predominantly managed and invested outside the Group in accordance with legal requirements. Where necessary<br />
provisions <strong>for</strong> the unfunded portion of pension benefits including termination gratuities are recorded in the individual<br />
subsidiaries’ balance sheets. The pension funds are usually financed by contributions from employees and subsidiaries.<br />
A review of subsidiaries’ pension plans in Germany, Taiwan and Switzerland has shown that they are defined benefit<br />
schemes. They are assessed using the projected unit credit method. Under this method the cost of providing pensions is<br />
charged to the income statement to spread the regular cost over the service period of employees. The pension obligation<br />
<strong>for</strong> past employee service is measured as the present value of the estimated future cash outflows using appropriate<br />
discount rates. The past post-employment benefits obligations are reviewed annually by independent actuaries. All actuarial<br />
gains and losses are recognized in the periods in which they occur outside the income statement in the statement<br />
of recognized income and expenses.<br />
Other long-term employee benefits exist in <strong>for</strong>m of jubilee gifts, long service benefits and health costs. The provisions<br />
necessary to provide the benefits are determined and recorded actuarially (cf. projected unit credit method) with actuarial<br />
gains and losses and past service costs, if any, recognized immediately in the income statement.<br />
Panalpina Annual Report 2004 53
Consolidated Financial Statements 2004<br />
54 Panalpina Annual Report 2004<br />
2. Segmental reporting<br />
Reporting by geographical segments<br />
Europe/Africa/Middle East/CIS North America<br />
in CHF millions 2004 2003 2002 2004 2003 2002<br />
External invoiced <strong>for</strong>warding services 3,512 3,056 2,965 1,316 1,213 1,140<br />
Intersegment invoiced <strong>for</strong>warding servcies 2,062 1,822 1,592 274 364 309<br />
Net <strong>for</strong>warding revenue 5,574 4,878 4,557 1,590 1,577 1,449<br />
Forwarding services from third parties (4,784) (4,156) (3,843) (1,346) (1,344) (1,195)<br />
Segment contribution margin 790 722 714 244 233 254<br />
Other segment expenses (723) (633) (617) (238) (240) (253)<br />
Segment operating result (EBIT) 67 89 97 6 (7) 1<br />
Financial result<br />
Earnings be<strong>for</strong>e taxes<br />
Taxes on income<br />
Earnings be<strong>for</strong>e minority interests<br />
Minority interests<br />
Consolidated net earnings<br />
Additional in<strong>for</strong>mation<br />
Segment assets 953 984 924 300 227 231<br />
Segment liabilities 465 482 464 104 83 94<br />
Capital expenditure 60 27 38 6 5 6<br />
Depreciation of property, plant and equipment 24 28 29 6 7 9<br />
Amortization of intangible assets 10 12 12 2 1 1<br />
Impairment of financial assets 6 2 0 0 0 0<br />
The Group organizes its business primarily by regions. For strategic and organizational reasons, Panalpina decided in 2003 to<br />
separate the America Region into North and South America Region. The Africa Region, Middle East and CIS (Commonwealth<br />
of Independent States) was <strong>for</strong> organizational reasons integrated into the Europe Region to <strong>for</strong>m a single EMEA Region.<br />
Segment in<strong>for</strong>mation is prepared on the basis of the location of the assets. Usually the location of the customers generally<br />
does not differ from the location of the assets in the particular region. Intersegmental services are charged at market rates.<br />
Segment expenses are shown after elimination of intersegmental transactions.<br />
Reporting by business segments<br />
Air Sea<br />
in CHF millions 2004 2003 2002 2004 2003 2002<br />
Revenue 3,086 2,720 2,573 2,102 1,885 1,833<br />
Total assets 643 547 517 427 375 345<br />
Capital expenditure 47 13 14 21 9 10<br />
The Group’s business can be divided into three divisions: Air, Sea and Supply Chain Management. The assets allocated to<br />
the divisions primarily comprise trade receivables, work in progress, accruals and tangible fixed assets. Cash, financial<br />
investments and assets related to the central management functions are not allocated.
Consolidated Financial Statements 2004<br />
Central and South America Asia/Pacific Eliminations Total<br />
2004 2003 2002 2004 2003 2002 2004 2003 2002 2004 2003 2002<br />
608 521 533 684 573 536 6,120 5,363 5,174<br />
119 106 113 480 450 371 (2,935) (2,742) (2,385) 0 0 0<br />
727 627 646 1,164 1,023 907 (2,935) (2,742) (2,385) 6,120 5,363 5,174<br />
(616) (526) (527) (968) (840) (746) 2,935 2,742 2,385 (4,779) (4,124) (3,926)<br />
111 101 119 196 183 161 0 0 0 1,341 1,239 1,248<br />
(96) (110) (117) (131) (118) (109) (1,188) (1,101) (1,096)<br />
15 (9) 2 65 65 52 153 138 152<br />
(10) (14) (2)<br />
143 124 150<br />
(31) (26) (33)<br />
112 98 117<br />
(1) 0 (1)<br />
111 98 116<br />
109 95 100 163 124 122 1,525 1,430 1,377<br />
32 19 17 95 89 93 696 673 668<br />
2 4 3 18 3 6 86 39 53<br />
4 4 5 4 4 4 38 43 47<br />
1 0 0 3 0 0 16 13 13<br />
0 0 0 0 0 0 6 2 0<br />
Supply Chain Management Unallocated Total<br />
2004 2003 2002 2004 2003 2002 2004 2003 2002<br />
932 758 768 0 0 0 6,120 5,363 5,174<br />
190 180 163 314 385 406 1,574 1,487 1,431<br />
7 9 10 4 8 19 86 39 53<br />
Panalpina Annual Report 2004 55
Consolidated Financial Statements 2004<br />
56 Panalpina Annual Report 2004<br />
3. Personnel expenses<br />
in CHF thousands 2004 2003 2002<br />
Salaries and wages 612,025 573,533 566,745<br />
Cost of defined contribution plans 37,352 37,057 37,655<br />
Cost of defined benefit plans 7,047 9,092 8,324<br />
Other social security costs 66,635 59,672 60,046<br />
Miscellaneous 59,324 55,409 53,126<br />
Total personnel expenses 782,383 734,763 725,896<br />
The number of employees increased during the current year by 880 to 13,224 (2003: 12,344; 2002: 12,463).<br />
4. Other operating expenses<br />
in CHF thousands 2004 2003 2002<br />
Administrative expenses 26,813 22,572 23,480<br />
Communication expenses 66,925 61,991 63,246<br />
Rent and utilities expenses 142,005 130,382 127,579<br />
Travel and promotion expenses 54,513 45,977 46,110<br />
Insurance expenses and claims 21,327 20,631 30,668<br />
Bad debt and collection expenses 11,630 6,336 5,049<br />
Other operating expenses 26,383 21,084 19,234<br />
Total operating expenses 349,596 308,973 315,366<br />
5. Gain on sales of non-current assets<br />
in CHF thousands 2004 2003 2002<br />
On sales of investments 0 0 (97)<br />
On sales of property, plant and equipment 2,925 299 4,333<br />
Total net gain on sale of non-current assets 2,925 299 4,236<br />
In the current year the net gain from the sale of assets results essentially from the sale of operational property in the USA<br />
(in 2002 the net gain from the sale of assets results essentially from the sale of operational property in Switzerland).<br />
6. Net financial result<br />
in CHF thousands 2004 2003 2002<br />
Interest income 5,858 4,236 8,812<br />
Other financial income 719 1,279 1,488<br />
Financial income 6,577 5,515 10,300<br />
Interest expenses (9,978) (8,050) (8,586)<br />
Exchange differences (1,539) (6,657) 326<br />
Bank charges (3,440) (3,200) (3,157)<br />
Other financial expenses (1,133) (1,131) (1,011)<br />
Financial expense (16,090) (19,038) (12,428)<br />
Net financial result (9,513) (13,523) (2,128)
7. Taxes on income<br />
Consolidated Financial Statements 2004<br />
in CHF thousands 2004 2003 2002<br />
Current income taxes 31,680 33,159 27,942<br />
Deferred income taxes (731) (6,721) 4,876<br />
Total taxes on income 30,949 26,438 32,818<br />
The following table reconciles expected and actually disclosed tax expenses. The expected tax expenses are<br />
determined by multiplying the result be<strong>for</strong>e income taxes and the tax rate applicable in Switzerland.<br />
in CHF thousands 2004 2003 2002<br />
Earnings be<strong>for</strong>e taxes 143,338 124,547 149,557<br />
Tax at the applicable tax rate of 25% (2003: 25%; 2002: 25%) 35,834 31,137 37,389<br />
Effect of differing national tax rates (7,574) (12,532) (7,646)<br />
Utilization of non-capitalized tax loss carry<strong>for</strong>wards (220) (865) (1,730)<br />
Capitalization of deferred tax assets from previous periods 0 0 (1,410)<br />
Not recognized loss carry<strong>for</strong>wards 2,353 1,383 1,249<br />
Effect of changes in the tax rate on temporary differences (400) 616 (161)<br />
Withholding tax on dividends received 1,008 1,200 369<br />
Expenses not deductible <strong>for</strong> tax purposes and non-taxable income (1,389) 3,081 4,377<br />
Miscellaneous 1,337 2,418 381<br />
Actual tax charge 30,949 26,438 32,818<br />
Expenses not deductible <strong>for</strong> tax purposes were incurred primarily in Italy, France, Germany, UK and Brazil<br />
(2003: in Germany, Italy and France; 2002: in Germany, Italy and Brazil). The heading “Miscellaneous” includes mainly<br />
other income taxes such as IRAP in Italy and CIDE in Brazil.<br />
8. Trade receivables<br />
in CHF thousands 2004 2003 2002<br />
Commercial clients 903,406 767,596 729,250<br />
Agents 37,841 31,849 34,912<br />
Total trade receivables (gross) 941,247 799,445 764,162<br />
Impairment of receivables (34,838) (32,257) (34,719)<br />
Total trade receivables (net) 906,409 767,188 729,443<br />
9. Other receivables and other current assets<br />
in CHF thousands 2004 2003 2002<br />
Office supplies 2,012 4,507 936<br />
Taxes (VAT, withholding tax) 21,385 20,568 19,998<br />
Accrued income 5,980 3,914 4,835<br />
Accrued interest income 531 754 697<br />
Personnel advances 423 455 0<br />
Prepaid rent expenses 3,750 3,166 3,028<br />
Others 17,317 21,457 20,387<br />
Total trade receivables (net) 51,398 54,821 49,881<br />
Panalpina Annual Report 2004 57
Consolidated Financial Statements 2004<br />
58 Panalpina Annual Report 2004<br />
10. Property, plant and equipment<br />
Land Machinery Vehicles Construc- Total Total Total<br />
and and tion in 2004 2003 2002<br />
in CHF thousands buildings equipment progress<br />
Acquisition costs<br />
Balance on January 1 160,189 219,925 29,718 99 409,931 404,735 428,383<br />
Translation differences (5,792) (8,528) (1,533) (47) (15,900) (8,908) (40,442)<br />
Change in the scope of consolidation 6,958 1,156 6,420 570 15,104 0 0<br />
Additions 5,500 25,138 5,617 2,069 38,324 32,637 45,580<br />
Disposals (7,927) (16,099) (4,078) 0 (28,104) (18,418) (28,735)<br />
Reclassifications 2,149 394 (68) (2,363) 112 (115) (51)<br />
Balance on December 31 161,077 221,986 36,076 328 419,467 409,931 404,735<br />
Accumulated depreciation<br />
Balance on January 1 62,169 170,097 23,719 0 255,985 237,315 236,512<br />
Translation differences (3,352) (7,581) (437) 0 (11,370) (6,800) (25,182)<br />
Additions 8,047 26,693 2,852 0 37,592 42,834 46,722<br />
Disposals (5,045) (13,782) (3,027) 0 (21,854) (17,383) (20,687)<br />
Reclassifications (157) 107 (68) 0 (118) 19 (50)<br />
Balance on December 31 61,662 175,534 23,039 0 260,235 255,985 237,315<br />
Net book value on January 1 98,020 49,828 5,999 99 153,946 167,420 191,871<br />
Net book value on December 31<br />
Of which net book value of assets<br />
99,415 46,452 13,037 328 159,232 153,946 167,420<br />
acquired under finance leases 98 0 0 0 98 850 1,542<br />
11. Financial and other intangible assets<br />
Financial and other assets Intangible assets<br />
Available- Receiv- Pension Goodwill Other Total Total Total<br />
<strong>for</strong>-sale ables plan intangible 2004 2003 2002<br />
in CHF thousands investments assets assets<br />
Acquisition costs<br />
Balance on December 31 26,327 12,777 11,560 79,600 33,151 163,415 157,594 178,717<br />
IAS 19 restatements on opening balance (27,665)<br />
Balance on January 1 26,327 12,777 11,560 79,600 33,151 163,415 157,594 151,052<br />
Translation differences (50) (256) 0 (708) (912) (1,926) (926) (2,939)<br />
Change in the scope of consolidation 0 0 0 12,812 10,424 23,236 0 0<br />
Additions 5 6,511 0 7,275 24,986 38,777 18,428 21,397<br />
Disposals (61) (8,828) 0 0 (764) (9,653) (11,796) (11,967)<br />
Reclassifications 0 0 0 1,562 (159) 1,403 115 51<br />
Balance on December 31 26,221 10,204 11,560 100,541 66,726 215,252 163,415 157,594<br />
Accumulated depreciation or<br />
impairment losses<br />
Balance on January 1 1,736 81 0 34,658 25,033 61,508 50,035 40,247<br />
Translation differences (1) (2) 0 164 (834) (673) (1,563) (1,389)<br />
Additions 5,799 0 0 8,751 7,004 21,554 14,521 12,785<br />
Disposals 0 0 0 0 (442) (442) (1,466) (1,657)<br />
Reclassifications 0 0 0 1,562 71 1,633 (19) 50<br />
Balance on December 31 7,534 79 0 45,135 30,832 83,580 61,508 50,036<br />
Net book value on January 1 24,591 12,696 11,560 44,942 8,118 101,907 107,559 138,470<br />
Net book value on December 31 18,687 10,125 11,560 55,406 35,894 131,672 101,907 107,558
Consolidated Financial Statements 2004<br />
Available-<strong>for</strong>-sale investments are disclosed only <strong>for</strong> equity investments <strong>for</strong> which no active market with publicly quoted<br />
market values exists. There<strong>for</strong>e it has been impossible to determine the market value of these equity investments and the<br />
investments are carried at historical cost less identified impairment.<br />
In 2004, impairment charges of CHF 5.8 million were recorded to net available-<strong>for</strong>-sale investments relating to the<br />
valuation of the equity investment GF-X.<br />
Receivables includes third-party loans of CHF 2.2 million (2003: CHF 5.4 million; 2002: CHF 3.7 million) and mainly rental<br />
deposits of CHF 7.9 million (2003: CHF 3.2 million; 2002: CHF 5.0 million).<br />
Impairment test <strong>for</strong> goodwill<br />
Goodwill is allocated to the Group’s cash-generating units (CGUs) identified to country of operation. The goodwill in<br />
connection with the Grampian acquisition has been tested <strong>for</strong> impairment.<br />
The recoverable amount of a CGU is determined based on value-in-use calculations. These calculations use cash flow<br />
projections based on financial budgets approved by management covering a five-year period. Cash flows beyond<br />
the five-year period are extrapolated using the estimated growth. As a result of the test, no goodwill impairment charge<br />
was recognized in 2004.<br />
The following key assumptions have been made <strong>for</strong> the goodwill impairment test of Grampian:<br />
• Yearly growth of <strong>for</strong>warding revenue 5%<br />
• EBIT margin amounting to 6.9%<br />
• Working capital as a percentage of <strong>for</strong>warding revenues 5%<br />
• Growth rate in capital expenditure and depreciation 10%<br />
• Discount rate used 10%<br />
• Tax rate used 35%<br />
The net book value of other intangible assets comprises:<br />
• Software in the amount of CHF 15.2 million (2003: CHF 6.7 million; 2002: CHF 3.9 million)<br />
• Other intangible assets CHF 19.3 million (mainly acquired brands and customer relations)<br />
12. Other liabilities<br />
Outstanding Claims Employee Total Total Total<br />
vacation benefits 2004 2003 2002<br />
in CHF thousands entitlement<br />
Other liabilities<br />
Balance on January 1 20,595 3,953 19,435 43,983 40,317 31,807<br />
Translation differences (542) 0 (447) (989) 370 (2,111)<br />
Change in scope of consolidation 141 0 14 155 0 0<br />
Additional accruals 3,488 10,060 16,351 29,899 26,821 22,452<br />
Reversals of other liabilities 0 0 (8,284) (8,284) (3,483) (1,591)<br />
Charged in income statement 3,087 10,060 7,634 20,781 23,708 18,750<br />
Amount paid (2,306) 0 (9,142) (11,448) (20,042) (10,240)<br />
Transfers 0 7,905 0 7,905 0 0<br />
Balance on December 31 21,376 21,918 17,927 61,221 43,983 40,317<br />
Employee benefits include payroll, bonuses, social security and payroll taxes.<br />
Panalpina Annual Report 2004 59
Consolidated Financial Statements 2004<br />
60 Panalpina Annual Report 2004<br />
13. Provisions<br />
Long-term provisions<br />
Employee Claims and Total Total Total<br />
benefits other 2004 2003 2002<br />
provisions<br />
Balance on December 31 48,710 30,404 79,114 71,473 60,276<br />
IAS 8 and 19 restatements on opening balance 7,107<br />
Balance on January 1 48,710 30,404 79,114 71,473 67,383<br />
Translation differences (727) (467) (1,194) 1,298 (2,551)<br />
Addition 5,668 21,147 26,815 19,455 17,404<br />
Reversal of unused amount (254) (9,280) (9,534) (6,025) (7,980)<br />
Charged in income statement 4,687 11,400 16,087 14,728 6,873<br />
Utilized during the year (1,864) (15,710) (17,574) (7,087) (2,783)<br />
Transfers 0 (7,905) (7,905) 0 0<br />
Balance on December 31 51,533 18,189 69,722 79,114 71,473<br />
Employee benefits provisions include the current portion of net liabilities relating to defined benefit plans of CHF 28.6 million<br />
(2003: CHF 24.2 million; 2002: CHF 21.3 million).<br />
The balance <strong>for</strong> claims represents a provision <strong>for</strong> certain claims brought <strong>for</strong>ward against the Group by customers and<br />
<strong>for</strong>warding agents. The balance as at December 31 is expected to be utilized within the next 2–3 years.<br />
Long-term claims include an additional provision <strong>for</strong> probable potential future payments in connection with transport<br />
damages.<br />
Management determined the provision based on past per<strong>for</strong>mance and the anticipated funds needed <strong>for</strong> future settlement of<br />
claims <strong>for</strong> services delivered in the past, which have yet to be reported.<br />
14. Deferred taxes<br />
Deferred taxes are related to the following balance sheet items:<br />
Deferred tax assets Deferred tax liabilities<br />
in CHF thousands 2004 2003 2002 2004 2003 2002<br />
Receivables 4,085 4,263 4,510 (972) (1,557) (1,186)<br />
Fixed assets 3,837 2,780 2,653 (13,250) (11,576) (10,724)<br />
Provisions 5,903 6,600 7,736 (5,983) (1,499) (6,692)<br />
Other balance sheet captions 10,936 6,063 6,163 (7,100) (6,038) (9,729)<br />
Deductible loss carry<strong>for</strong>wards 1,683 972 1,457 0 0 0<br />
Total 26,444 20,678 22,519 (27,305) (20,670) (28,331)<br />
Net deferred tax assets (liabilities) (861) 8 (5,812)
Consolidated Financial Statements 2004<br />
In this summary, deferred tax assets and liabilities are shown gross by balance sheet captions. For balance sheet disclosure<br />
purposes the liabilities and assets are reported net by each subsidiary, resulting in the following balance sheet<br />
presentation:<br />
in CHF thousands 2004 2003 2002<br />
Deferred tax assets 20,471 19,465 18,566<br />
Deferred tax liabilities (21,332) (19,457) (24,378)<br />
Net deferred tax assets (liabilities) (861) 8 (5,812)<br />
The gross movement on the deferred income tax account is as follows:<br />
in CHF thousands 2004 2003 2002<br />
Balance on December 31 8 (5,812) (6,573)<br />
Restatements on opening balance 0 0 6,754<br />
Balance on January 1 8 (5,812) 181<br />
Translation differences (955) (25) (2,161)<br />
Change in the scope of consolidation (256) 0 0<br />
Income statement charge (142) 6,719 (4,877)<br />
Tax charged to equity due to IAS 19 (amended 2004) 484 (874) 1,045<br />
Balance on December 31 (861) 8 (5,812)<br />
During the year being reported deferred tax assets were not established on taxable temporary differences amounting net<br />
(i.e. after setting off deferred tax assets against tax liabilities <strong>for</strong> companies with a net tax asset) to CHF 114,000<br />
because it is not probable that they can be set off against future profits.<br />
Year of expiry of unrecognized tax<br />
loss carry-<strong>for</strong>wards (in CHF thousands) 2004 2003 2002<br />
2004 0 314 0<br />
2005 495 1,687 711<br />
2006 1,060 4,421 280<br />
2007 3,172 719 916<br />
2008 137 21 0<br />
2009 1,854 0 0<br />
Later 11,803 9,052 5,166<br />
Total unrecognized tax loss carry-<strong>for</strong>wards 18,521 16,214 7,073<br />
The unrecognized tax loss carry<strong>for</strong>wards increased in UK, Turkey, Brazil and Malaysia. The tax loss carry<strong>for</strong>wards<br />
expired in Ecuador, Azerbaijan, Panama and Australia.<br />
At December 31, 2004 un-remitted earnings of CHF 277.8 million (2003: CHF 274.2 million; 2002: 275.1 million) have been<br />
retained by subsidiary companies <strong>for</strong> reinvestment. No provision is made <strong>for</strong> income taxes that would be payable<br />
upon the distribution of such earnings. If the earnings were remitted, an income tax charge could result based on the tax<br />
statutes currently in effect.<br />
Panalpina Annual Report 2004 61
Consolidated Financial Statements 2004<br />
62 Panalpina Annual Report 2004<br />
15. Borrowings<br />
Short-term borrowings (in CHF thousands) 2004 2003 2002<br />
Bank borrowings 11,237 19,180 15,368<br />
Cheques and bills in transit 21,139 10,984 16,863<br />
Finance lease liabilities 141 873 981<br />
Other loans 3,807 983 2,398<br />
Total short-term borrowings 36,324 32,020 35,610<br />
Long-term borrowings (in CHF thousands) 2004 2003 2002<br />
Finance lease liabilities 155 113 297<br />
Other 154 19 454<br />
Total long-term borrowings 309 132 751<br />
The weighted average interest rate of bank borrowings and other financing liabilities is 3.45% (2003: 3.6%; 2002: 4.71%).<br />
The carrying amounts of short-term bank borrowings approximate their fair value.<br />
Maturity of long-term financial debts (excluding lease liabilities) 2004 2003 2002<br />
2004 0 0 454<br />
2005 0 19 0<br />
2006 112 0 0<br />
2007 42 0 0<br />
2008 0 0 0<br />
Later 0 0 0<br />
Total 154 19 454<br />
The carrying amounts of the Group’s borrowings are denominated in the following currencies:<br />
2004 2003 2002<br />
USD 15,796 2,169 8,765<br />
EUR 4,248 6,407 11,785<br />
XAF 4,001 3,972 5,507<br />
CAD 3,646 2,963 10<br />
NGN 3,641 4,685 4,601<br />
TWD 2,044 2,296 1,607<br />
GBP 1,206 3,618 327<br />
INR 778 538 68<br />
MYR 367 2,034 1,066<br />
HUF 0 1,010 145<br />
SGD 408 874 986<br />
Others 498 1,587 1,494<br />
Total 36,633 32,153 36,361<br />
16. Share capital<br />
On December 31, 2004, the share capital amounted to CHF 50 million, and comprised 50,000 registered shares with a nominal<br />
value of CHF 1,000 each. The Ernst Göhner Foundation, Zug, is the sole shareholder, holding 100% of shares.<br />
The amount available <strong>for</strong> dividend distribution is based on the available distributable retained earnings of Panalpina World<br />
Transport (Holding) Ltd., determined in accordance with the legal provisions of the Swiss Code of Obligations. In 2004 the<br />
dividend paid was CHF 30 million (2003: CHF 30 million; 2002: CHF 20 million).
17. Change in translation and other reserves and retained earnings<br />
The movements in translation and other reserves and retained earnings recognized in shareholders’ equity<br />
are as follows:<br />
Consolidated Financial Statements 2004<br />
Translation Retained<br />
in CHF thousands differences earnings<br />
Balance on December 31, 2001 (7,580) 615,518<br />
Restatement IAS 8<br />
– Over- or understated accruals (net of tax) (106) 2,677<br />
– Overcharged invoices (net of tax) 13 (1,705)<br />
Restatement IAS 19 (net of tax) (24,336)<br />
Restated balance on January 1, 2002 (7,673) 592,154<br />
Consolidated net income 115,629<br />
Dividends paid (20,000)<br />
Settlement of group loans, as per IAS 39, transfer to profit or loss statement 2,166<br />
Actuarial gains/losses IAS 19 (net of tax) (3,103)<br />
Valuation of group loans, as per IAS 21 (9,570)<br />
Translation differences (40,087)<br />
Balance on December 31, 2002 (55,164) 684,680<br />
Consolidated net income 97,719<br />
Dividends paid (30,000)<br />
Actuarial gains/losses IAS 19 (net of tax) 1,720<br />
Valuation of group loans, as per IAS 21 (17,495)<br />
Translation differences 5,719<br />
Balance on December 31, 2003 (66,940) 754,119<br />
Consolidated net income 111,424<br />
Dividends paid (30,000)<br />
Actuarial gains/losses IAS 19 (net of tax) (1,449)<br />
Valuation of group loans, as per IAS 21 (27,306)<br />
Translation differences 6,982<br />
Balance on December 31, 2004 (87,264) 834,094<br />
18. Minority interests<br />
in CHF thousands 2004 2003 2002<br />
Balance on January 1 (net) 2,916 2,956 2,620<br />
Translation differences (304) (303) (563)<br />
Interest in profit 966 391 1,111<br />
Dividends paid (94) (128) (212)<br />
Total net minority interests 3,484 2,916 2,956<br />
Panalpina Annual Report 2004 63
Consolidated Financial Statements 2004<br />
64 Panalpina Annual Report 2004<br />
19. Derivative financial instruments<br />
The year-end contract value is calculated on the total volume of individual contracts using the value at year-end. The positive<br />
replacement value represents the theoretical profit if the open currency contracts had been closed out as of December 31.<br />
Correspondingly, the negative replacement value represents the theoretical loss on closing the currency transactions open as<br />
of December 31.The change in the fair value has been recognized in the income statement because the instruments did not<br />
fulfill the conditions <strong>for</strong> hedge accounting.<br />
Positive replacement Negative replacement<br />
Contract value value value<br />
in CHF thousands 2004 2003 2002 2004 2003 2002 2004 2003 2002<br />
Foreign exchange contracts 705,553 405,810 441,450 8,543 9,730 21,537 (2,329) (603) (7,549)<br />
Forward trading hedges 568,695 405,810 441,450 8,291 9,730 21,537 (2,288) (603) (7,549)<br />
Foreign exchange options 136,858 0 0 252 0 0 (41) 0 0<br />
Positive replacement Negative replacement<br />
Contract value value value<br />
in CHF thousands 2004 2003 2002 2004 2003 2002 2004 2003 2002<br />
Terms of the <strong>for</strong>ward<br />
<strong>for</strong>eign exchange contracts 705,553 405,810 441,450 8,543 9,730 21,537 (2,329) (603) (7,549)<br />
0– 3 months 694,406 405,810 404,807 8,543 9,730 19,614 (1,032) (603) (7,549)<br />
4–12 months 11,147 0 36,643 0 0 1,923 (1,297) 0 0<br />
13–18 months 0 0 0 0 0 0 0 0 0<br />
Derivative financial instruments are spread over the following currencies:<br />
Forward <strong>for</strong>eign exchange contracts<br />
in CHF thousands 2004 2003 2002<br />
USD 490,113 279,742 347,440<br />
EUR 120,130 54,850 60,584<br />
CAD 7,257 5,424 1,654<br />
GBP 13,658 5,042 0<br />
HKD 29,927 22,407 15,242<br />
SGD 10,830 8,325 1,051<br />
AUD 6,984 9,244 8,801<br />
JPY 8,075 7,927 3,817<br />
SEK 5,212 3,865 0<br />
NZD 2,775 3,110 2,549<br />
Other 10,592 5,874 312<br />
Total 705,553 405,810 441,450
20. Employee benefit obligations<br />
Consolidated Financial Statements 2004<br />
The Group has numerous pension funds. Retirement benefits vary from plan to plan reflecting applicable local practices<br />
and legal requirements. Defined benefit pension plans are predominantly in Switzerland and Germany. The cost of the<br />
defined contribution plans is charged to personnel expenses. For defined benefit plans the plans domiciled in Switzerland<br />
have an excess of assets over liabilities. Capitalized is the portion of the surplus which Management estimates will<br />
generate an economic benefit to the Group in the <strong>for</strong>m of future contribution reductions.<br />
in CHF thousands 2004 2003 2002<br />
Fair value of plan assets 237,033 226,302 205,822<br />
Defined benefit obligation (DBO) funded (218,804) (200,190) (184,815)<br />
(Deficit)/surplus 18,229 26,112 21,007<br />
Unrecognized surplus due to paragraph 58b (11,216) (19,092) (14,137)<br />
Defined benefit obligation (DBO) unfunded (24,032) (22,599) (21,432)<br />
(Liability) asset recognized in balance sheet (17,019) (15,579) (14,562)<br />
The following amounts were recorded in the income statement<br />
relating to defined benefit plans:<br />
Calculation of pension cost <strong>for</strong> year ending<br />
Current service cost (17,900) (16,514) (13,681)<br />
Interest cost (8,310) (7,809) (7,638)<br />
Expected return on assets 10,070 9,192 10,358<br />
Member contributions 6,043 5,279 2,170<br />
Settlements/curtailments 3,050 760 467<br />
Net periodic pensions (cost) credit (7,047) (9,092) (8,324)<br />
Actual return of plan assets 10,944 19,552 (29,366)<br />
Changes in defined benefit obligation (DBO)<br />
DBO beginning of year (222,789) (206,247) (202,950)<br />
Current service cost (17,900) (16,514) (13,681)<br />
Interest cost (8,310) (7,809) (7,638)<br />
Actuarial gains/(losses) recognized in equity (10,692) (2,756) 9,178<br />
Benefit paid 14,744 11,861 8,018<br />
Liabilities extinguished on settlement 2,222 0 0<br />
Currency impact (111) (1,324) 826<br />
DBO end of year (242,836) (222,789) (206,247)<br />
The movements recorded in the balance sheet are:<br />
Changes in fair value of plan asset<br />
Fair value beginning of year 226,302 205,822 237,054<br />
Employer contributions 7,680 6,800 3,611<br />
Member contributions 6,043 5,279 2,170<br />
Expected return on assets 10,070 9,192 10,358<br />
Actuarial gains/(losses) recognized in equity 874 10,360 (39,724)<br />
Benefit paid (13,916) (11,101) (7,551)<br />
Currency impact (20) (50) (96)<br />
Fair value end of year of plan asset 237,033 226,302 205,822<br />
Panalpina Annual Report 2004 65
Consolidated Financial Statements 2004<br />
66 Panalpina Annual Report 2004<br />
in CHF thousands 2004 2003 2002<br />
Analysis of amounts recognized in equity<br />
Recognized equity on January 1 74,268 76,862 72,713<br />
Actuarial gains (losses) fair value (874) (10,360) 39,724<br />
Actuarial gains (losses) DBO 10,692 2,756 (9,178)<br />
Effect of impact of limit in para 58b (7,876) 4,955 (26,357)<br />
Currency impact (9) 55 (40)<br />
Recognized equity on December 31 76,201 74,268 76,862<br />
Amounts <strong>for</strong> the current and previous periods<br />
DBO 222,789 206,247 202,950<br />
Plan assets 226,302 205,822 237,054<br />
(Deficit)/surplus (3,513) 425 (34,104)<br />
Experienced gains (losses) on plan liability (13,316) (2,756) 9,178<br />
Experienced gains (losses) on plan assets 874 10,360 (39,724)<br />
Major categories of plan assets are as follows:<br />
Cash and cash equivalents 7,901 13,543 14,795<br />
Equity investments 79,610 93,189 79,685<br />
Bonds 121,232 93,795 89,520<br />
Investment funds 21,262 15,891 14,644<br />
Insurance contracts 7,028 9,884 7,178<br />
The following weighted parameters have been chosen as the actual basis:<br />
Discount rate 3.80% 3.80% 3.80%<br />
Expected return on pension plan assets 4.50% 4.50% 4.50%<br />
Salary increase 1.50% 2.00% 2.00%<br />
Rate in pension increase 1.00% 2.00% 2.00%<br />
The overall expected return of plan assets is based on country specific long-term market expectations at the beginning of<br />
the period.<br />
21. Related parties<br />
Members of the Board of Directors and senior management and members of their family are defined as persons related to<br />
the Group. In the normal course of business the following remuneration was paid:<br />
2004 2003 2002<br />
in CHF Persons in CHF Persons in CHF Persons<br />
thousands thousands thousands<br />
Remuneration of members of the Board<br />
of Directors and of senior management 6,799 14 5,892 14 5,027 12<br />
There were no contributions or donations to members of their families.<br />
Shareholders, pension funds, associated companies and all subsidiaries are defined as parties related to the Group. Apart<br />
from the transactions with related parties mentioned here and in note 16, there are no other significant transactions requiring<br />
disclosure.
22. Cash flow statement<br />
Consolidated Financial Statements 2004<br />
Cash flow from operating activities (in CHF thousands) 2004 2003 2002<br />
Consolidated net income be<strong>for</strong>e taxes 143,338 124,547 149,558<br />
Depreciation of property, plant and equipment 37,592 42,834 46,722<br />
Impairment of financial investments 5,799 0 4<br />
Amortization of intangible assets 15,755 12,945 12,781<br />
(Decrease) increase in long-term provisions 13,601 10,983 13,146<br />
Loss/(gain) on sales of fixed assets (2,925) (299) (4,332)<br />
Loss/(gain) on sales of investments 0 0 97<br />
Decrease (increase) in excess assets of pension funds (280) 123 2,628<br />
Interest income (5,857) (4,236) (8,811)<br />
Interest expense 5,225 8,050 8,584<br />
Cash flow be<strong>for</strong>e interest and taxes 212,248 194,947 220,377<br />
Decrease/(increase) receivables and other current assets (196,819) 4,506 (59,307)<br />
(Decrease)/increase payables, accruals and deferred income 60,601 (80,409) (57,596)<br />
(Decrease)/increase other liabilities 21,615 23,338 20,861<br />
Total cash flow from operating activities 97,645 142,382 124,335<br />
23. Business combination<br />
On April 1, 2004, Panalpina acquired 100% of the share capital of the Grampian Group, which offers global air and sea<br />
freight <strong>for</strong>warding services as well as European road transport <strong>for</strong> the oil and gas industry. The acquired business<br />
contributed revenue of CHF 55.3 million and net profit of CHF 3.6 million to the Group <strong>for</strong> the period from April 1 to<br />
December 31, 2004. If the acquisition had occurred on January 1, 2004, Group gross revenue would have been<br />
CHF 7.5 billion, and net income would have been CHF 111.5 million.<br />
Details of net assets acquired and goodwill are as follows:<br />
in CHF thousands 2004<br />
Purchase consideration:<br />
– Cash paid 42,282<br />
– Direct costs relating to the acquisition 211<br />
Total purchase consideration 42,494<br />
Fair value of net assets acquired (29,682)<br />
Goodwill 12,812<br />
The goodwill is attributable to the high profitability of the acquired business and the synergies expected to arise after the<br />
Group’s acquisition.<br />
Panalpina Annual Report 2004 67
Consolidated Financial Statements 2004<br />
68 Panalpina Annual Report 2004<br />
The assets and liabilities arising from the acquisition are as follows:<br />
Acquiree’s Revaluation due Fair<br />
carrying to purchase value<br />
in CHF thousands amount accounting<br />
Cash and cash equivalents 2,795 0 2,795<br />
Property, plant and equipment 15,104 0 15,104<br />
Intangible assets 35 10,389 10,424<br />
Receivables 14,565 (336) 14,230<br />
Payables (11,247) (136) (11,383)<br />
Borrowings (1,231) 0 (1,231)<br />
Deferred tax liabilities (394) 138 (256)<br />
Net assets 19,627 10,055 29,682<br />
Less acquired liquidity (2,795)<br />
Goodwill 12,812<br />
Total cash flow from acquisition of businesses 39,699<br />
In addition the Group increased its investment in Nigeria in 2004 from 61.0% to 69.0% by acquiring further voting shares.<br />
There were no acquisitions in the years ended December 31, 2003 and 2002.<br />
24. Disinvestments<br />
Neither in 2004, 2003, nor in 2002 were significant subsidiaries sold.<br />
25. Additional in<strong>for</strong>mation<br />
Contractual commitments on non-cancellable operating lease contracts<br />
in CHF thousands 2004 2003 2002<br />
2004 0 50,338 41,644<br />
2005 86,251 41,020 33,636<br />
2006 49,114 33,617 27,132<br />
2007 39,013 26,984 24,772<br />
2008 32,854 23,956 0<br />
2009 28,973 67,322 64,684<br />
Later 65,695 – –<br />
Total residual commitments 301,900 243,237 191,868
Consolidated Financial Statements 2004<br />
Included in the residual lease commitments is an operating lease contract <strong>for</strong> an aircraft (total CHF 25.6 million), leased<br />
by Panalpina Airfreight Management AG. The contract with a yearly notice period expires in August 2005.<br />
Obligations under finance lease contracts<br />
in CHF thousands 2004 2003 2002<br />
2004 0 900 204<br />
2005 147 58 58<br />
2006 149 29 36<br />
2007 0 0 0<br />
2008 0 0 0<br />
Later 0 0 0<br />
Total residual commitments 296 987 298<br />
Pledged assets<br />
The value of pledged assets amounts to CHF 15,000 (prior year CHF 704,000).<br />
Pending legal claims<br />
Various subsidiaries are involved in legal disputes in the ordinary course of business as defendants in legal disputes,<br />
as a result of which obligations could arise. It is possible that their satisfaction may not, or only partially, be covered by<br />
insurance.<br />
Group management is, however, of the opinion that no consequences can arise from these pending legal claims which<br />
could significantly affect the Group’s financial position. If the result of the legal proceedings can be reasonably estimated,<br />
the corresponding provisions are created.<br />
Subsequent events<br />
Since the balance sheet date no events have become known <strong>for</strong> which a disclosure is required.<br />
Panalpina Annual Report 2004 69
Consolidated Financial Statements 2004<br />
70 Panalpina Annual Report 2004<br />
26. Principal Group companies and participations<br />
Nominal Equity Method<br />
capital interest Invest- of con-<br />
Company Registered Currency in 1,000 in % ment solidation<br />
Europe<br />
Panalpina World Transport (Holding) Ltd. Basel CHF 50,000 100 1 C<br />
Panalpina Management AG Basel CHF 2,500 100 1 C<br />
Panalpina Finance Limited Jersey CHF 10,000 100 1 C<br />
Panalpina AG Basel CHF 600 100 1 C<br />
ASB Air Sea Broker AG Basel CHF 3,000 100 1 C<br />
Pantainer AG Basel CHF 100 100 1 C<br />
Panalpina Insurance Broker AG Basel CHF 100 100 1 C<br />
Hausmann Transport AG Reinach CHF 100 100 1 C<br />
Panalpina Airfreight Management AG Basel CHF 2,700 100 1 C<br />
Jacky Maeder AG Basel CHF 2,000 100 1 C<br />
Panalpina Welttransport (Deutschland) GmbH Mörfelden EUR 10,226 100 1 C<br />
Panalpina Welttransport GmbH Bremen EUR 153 100 1 C<br />
Panalpina Welttransport GmbH Düsseldorf EUR 154 100 1 C<br />
Panalpina Welttransport GmbH Hamburg EUR 153 100 1 C<br />
Panalpina Welttransport GmbH Kehl EUR 153 100 1 C<br />
Panalpina Welttransport GmbH Mörfelden EUR 153 100 1 C<br />
Panalpina Welttransport GmbH Nürnberg EUR 3,937 100 1 C<br />
Panalpina Welttransport GmbH Stuttgart EUR 153 100 1 C<br />
Panalpina Ocean Freight Management GmbH Hamburg EUR 150 100 1 C<br />
Panalpina Welttransport GmbH Vienna EUR 36 100 1 C<br />
Panalpina Welttransport GmbH Höchst EUR 36 100 1 C<br />
Panalpina France Transports Internationaux S.A.S. Paris-Roissy EUR 4,500 100 1 C<br />
Panalpina Trasporti Mondiali S.p.A. Milan EUR 2,000 100 1 C<br />
Panalpina Transportes Mundiales S.A. Madrid EUR 451 100 1 C<br />
Panalpina Transportes Mundials Lda. Lisbon EUR 50 100 1 C<br />
Panalpina World Transport Ltd. London GBP 500 100 1 C<br />
Panalpina World Transport (Ireland) Ltd. Dublin EUR 25 100 1 C<br />
Grampian International Freight Ltd. Aberdeen GBP 97 100 1 C<br />
Panalpina World Transport N.V. Antwerp EUR 124 100 1 C<br />
Panalpina Luxembourg S.A. Luxembourg EUR 31 100 1 C<br />
Panalpina World Transport B.V. Amsterdam EUR 91 100 1 C<br />
Grampian International Freight B.V. Beverwijk EUR 18 100 1 C<br />
Panalpina Czech Sro. Prague CZK 1,000 100 1 C<br />
Panalpina Magyarorszag Kft. Budapest HUF 3,000 100 1 C<br />
Panalpina AB Gothenburg SEK 1,000 100 1 C<br />
Panalpina World Transport Nakliyat Ltd. Srk. Istanbul TRL 70,000,000 100 1 C<br />
Panalpina World Transport ZAO Moscow RUB 2,100,176 100 1 C<br />
Panalpina World Transport Ltd. Kiev USD 220 100 1 C<br />
Luxair S.A. Luxembourg EUR 13,744 12 4 N<br />
C = fully consolidated<br />
N = not consolidated<br />
1 = capital participation 91–100%<br />
2 = capital participation 50–90%<br />
3 = controlling influence over management<br />
4 = capital participation less than 50%
Consolidated Financial Statements 2004<br />
Nominal Equity Method<br />
capital interest Invest- of con-<br />
Company Registered Currency in 1,000 in % ment solidation<br />
North, Central and South America<br />
Panalpina Inc. Miami USD 4,000 100 1 C<br />
Hensel, Bruckmann & Lorbacher, Inc. Farmingdale N.Y. USD 50 100 1 C<br />
Panalpina Inc. Toronto CAD 100 100 1 C<br />
Panalpina Transportes Mundiales, S.A. de C.V. Mexico City MXN 8,900 100 1 C<br />
Panalpina S.A. Panama City USD 1,250 100 1 C<br />
Almacenadora Mercantil S.A. Panama City USD 25 100 1 C<br />
Panalpina S.A. de C.V. San Salvador SVC 100 100 1 C<br />
Panalpina Transportes Mundiales S.A. San José CRC 2,500 100 1 C<br />
Panalpina Uruguay Transportes Mundiales S.A. Montevideo UYU 4,500 100 1 C<br />
Panalpina S.A. Santa Fé de Bogotá COP 7,450,838 100 1 C<br />
DAPSA Depositos Aduaneros Panalpina S.A. Santa Fé de Bogotá COP 2,815,208 100 1 C<br />
Panalpina C.A. Caracas VEB 180,000 100 1 C<br />
Inversiones Ortac C.A. Caracas VEB 6,000 100 1 C<br />
Panalpina Ecuador S.A. Quito ECS 20,000 100 1 C<br />
Panalpina Aduanas S.A. Lima PEN 333 100 1 C<br />
Panalpina Transportes Mundiales S.A. Lima PEN 1,460 100 1 C<br />
Panalpina Ltda. São Paulo BRL 1,277 100 1 C<br />
Panalpina Chile Transportes Mundiales Ltda. Santiago USD 102 100 1 C<br />
Panalpina Transportes Mundiales S.A. Buenos Aires ARS 20 100 1 C<br />
Panalpina Transportes Mundiales S.A. de C.V. Santo Domingo USD 1 100 1 C<br />
Panalpina Reinsurance Ltd. Hamilton CHF 2,000 100 1 C<br />
Asia and Australia<br />
Panalpina World Transport (Singapore) Pte. Ltd. Singapore SGD 2,500 100 1 C<br />
PT Panalpina Nusajaya Transport Jakarta IDR 1,500,000 100 1 C<br />
Panalpina China Limited Hong Kong HKD 1,000 100 1 C<br />
Panalpina World Transport (PRC) Ltd. Shanghai CNY 5,000 100 1 C<br />
Panalpina Asia-Pacific Services Ltd. Hong Kong HKD 500 100 1 C<br />
Panalpina Taiwan Ltd. Taipei TWD 15,500 100 1 C<br />
Panalpina IAF (Korea) Ltd. Seoul KRW 500,000 100 1 C<br />
Panalpina World Transport (Thailand) Limited Bangkok THB 14,000 49 3 C<br />
Panalpina Macao Limited Macao HKD 1,000 100 1 C<br />
Panalpina Transport (Malaysia) Sdn. Bhd. Kuala Lumpur MYR 4,215 100 1 C<br />
Panalpina World Transport (Japan) Ltd. Tokyo JPY 50,000 100 1 C<br />
Panalpina World Transport (India) Pvt. Ltd. Delhi INR 1,667 100 1 C<br />
Panindia Cargo Private Ltd., Dehli Delhi INR 100 100 1 C<br />
Panalpina World Transport (Philippines) Inc. Manila PHP 10,000 100 1 C<br />
Panalpina World Transport (Pty) Limited Sydney AUD 2,500 100 1 C<br />
Panalpina Kazakhstan LLP Almaty USD 1 100 1 C<br />
Panalpina Annual Report 2004 71
Consolidated Financial Statements 2004<br />
72 Panalpina Annual Report 2004<br />
26. Principal Group companies and participations<br />
Nominal Equity Method<br />
capital interest Invest- of con-<br />
Company Registered Currency in 1,000 in % ment solidation<br />
Africa and Middle East<br />
Panalpina Gulf LLC Dubai AED 1,000 49 3 C<br />
Panalpina (Bahrain) WLL Manama BHD 10 100 1 C<br />
Panalpina Central Asia EC Manama USD 300 100 1 C<br />
Panalpina Georgia LLC Tbilisi USD 5 100 1 C<br />
Panalpina Azerbaijan LLC Baku USD 1 100 1 C<br />
Panalpina Turkmenistan LLC Turkmenbashi USD 60 100 1 C<br />
Qatar Shipping Company (Panalpina Qatar) WLL Doha QAR 200 49 3 C<br />
Panalpina Transports Mondiaux Cameroon S.A.R.L. Douala XAF 150,000 90 1 C<br />
Panalpina World Transport Ltd. (Equitorial Guinea) Malabo XAF 10,000 100 1 C<br />
Panalpina Transports Mondiaux Congo SARL Pointe Noire XAF 70,000 80 1 C<br />
Panalpina Transports Mondiaux Gabon S.A. Port-Gentil XAF 50,000 90 1 C<br />
Panalpina World Transport (Nigeria) Limited Apapa NGN 100,000 69 2 C<br />
Panalpina (Ghana) Limited<br />
Panalpina Transportes Mundiais Navegaçao<br />
Accra GHC 100,000 100 1 C<br />
e Transitos, S.A.R.L. Luanda AON 18,000,000 80 1 C<br />
C = fully consolidated<br />
N = not consolidated<br />
1 = capital participation 91–100%<br />
2 = capital participation 50–90%<br />
3 = controlling influence over management<br />
4 = capital participation less than 50%
Report of the Group Auditors<br />
Report of the Group auditors to the General Meeting of<br />
Panalpina World Transport (Holding) Ltd., Basel<br />
Consolidated Financial Statements 2004<br />
As auditors of the Group, we have audited the consolidated financial statements (income statement, statement of<br />
recognized income and expenses, balance sheet, statement of cash flows and notes /pages 42 to 72) of Panalpina<br />
World Transport (Holding) Ltd. <strong>for</strong> the years ended December 31, 2004, 2003 and 2002.<br />
These consolidated financial statements are the responsibility of the board of directors. Our responsibility is to express<br />
an opinion on these consolidated financial statements based on our audit. We confirm that we meet the legal requirements<br />
concerning professional qualification and independence.<br />
Our audit was conducted in accordance with auditing standards promulgated by the Swiss profession and with the International<br />
Standards on Auditing, which require that an audit be planned and per<strong>for</strong>med to obtain reasonable assurance<br />
about whether the consolidated financial statements are free from material misstatement. We have examined on a test<br />
basis evidence supporting the amounts and disclosures in the consolidated financial statements. We have also assessed<br />
the accounting principles used, significant estimates made and the overall consolidated financial statement presentation.<br />
We believe that our audit provides a reasonable basis <strong>for</strong> our opinion.<br />
In our opinion, the consolidated financial statements present fairly, in all material respects, the financial position, the<br />
results of operations and the cash flows in accordance with the International Financial Reporting Standards (IFRS) and<br />
comply with Swiss law.<br />
We recommend that the consolidated financial statements submitted to you be approved.<br />
PricewaterhouseCoopers AG<br />
A. Baur Th. Brüderlin<br />
Basel, April 19, 2005<br />
Panalpina Annual Report 2004 73
Consolidated Financial Statements 2004<br />
74 Panalpina Annual Report 2004<br />
Key Figures in CHF<br />
5-year review<br />
in CHF millions 2004 2003 2002 2001 2000<br />
Invoiced <strong>for</strong>warding services 7,452 6,561 6,364 6,717 6,879<br />
Change in % 13.59 3.10 (5.26) (2.35) 26.43<br />
Net <strong>for</strong>warding revenue 6,120 5,362 5,175 5,386 5,373<br />
Change in % 14.14 3.63 (3.92) 0.24 27.75<br />
Gross profit (contribution margin) 1,341 1,239 1,248 1,280 1,188<br />
Change in % 8.25 (0.75) (2.48) 7.74 23.49<br />
in % of net revenue 21.91 23.10 24.12 23.77 22.11<br />
Consolidated net earnings 111.4 97.7 115.6 111.7 92.7<br />
Change in % 14.03 (15.49) 3.52 20.50 26.47<br />
in % of gross profit 8.31 7.89 9.26 8.73 7.80<br />
EBITDA 212.0 195.4 211.2 223.9 185.0<br />
Change in % 8.48 (7.47) (5.68) 21.03 22.35<br />
in % of gross profit 15.81 15.77 16.92 17.49 15.57<br />
EBITA 174.4 152.6 164.5 213.2 180.8<br />
Change in % 14.30 (7.22) (22.86) 17.92 22.35<br />
in % of gross profit 13.01 12.32 13.18 16.66 15.22<br />
EBIT 152.9 138.1 151.7 155.8 133.2<br />
Change in % 10.71 (8.98) (2.64) 16.97 24.84<br />
in % of gross profit 11.40 11.14 12.15 12.17 11.21<br />
Cash flow be<strong>for</strong>e interest and taxes 212.2 194.9 220.4 215.9 187.6<br />
Change in % 8.87 (11.54) 2.07 15.09 61.45<br />
in % of gross profit 15.83 15.74 17.66 16.87 15.79<br />
Net cash flow from operating activities 33.9 89.6 71.9 326.7 54.1<br />
Change in % (62.12) 24.64 (77.99) 503.88 (25.17)<br />
in % of gross profit 2.53 7.23 5.76 25.52 4.55<br />
Free cash flow (77.7) 47.5 19.5 195.8 11.0<br />
Change in % (263.61) 144.13 (90.06) 1,680.00 (83.82)<br />
in % of gross profit (5.80) 3.84 1.56 15.30 0.93<br />
Net working capital 370.1 263.1 220.0 175.2 318.1<br />
Change in % 40.65 19.59 25.57 (44.92) 44.92
Consolidated Financial Statements 2004<br />
in CHF millions 2004 2003 2002 2001 2000<br />
Capital expenditure on fixed assets 89.9 51.1 67.0 127.0 57.9<br />
Change in % 76.08 (23.76) (47.26) 119.34 (33.60)<br />
in % of gross profit 6.70 4.12 5.37 9.92 4.87<br />
Net capital expenditure on fixed assets 74.5 39.7 48.6 114.2 50.3<br />
Change in % 87.54 (18.34) (57.43) 127.04 12.53<br />
in % of gross profit 5.55 3.20 3.90 8.92 4.23<br />
Depreciations 59.1 57.4 59.5 68.2 51.8<br />
Change in % 3.12 (3.62) (12.75) 31.66 16.40<br />
in % of gross profit 4.41 4.63 4.77 5.33 4.36<br />
Personnel expenses 782.4 734.8 725.9 744.2 700.6<br />
Personnel<br />
Number of employees at year-end (World) 13,224 12,344 12,463 12,042 11,586<br />
Number of employees at year-end (Switzerland) 669 755 813 927 869<br />
Yearly average (World) 12,784 12,404 12,253 11,814 11,301<br />
Productivity ratios (CHF)<br />
Net sales per average employee 478,750 432,327 422,338 455,900 475,466<br />
Gross profit per average employee 104,901 99,880 101,875 108,346 105,128<br />
Personnel expenses per average employee 61,200 59,238 59,245 62,993 61,997<br />
Personnel expenses in % of gross profit 58.34 59.31 58.15 58.14 58.97<br />
Leverage (liabilities/equity) 0.97 1.01 1.10 1.13 1.39<br />
Net interest bearing liabilities (231) (311) (282) (232) (64)<br />
Gross gearing (interest bearing liabilities/equity) 0.02 0.03 0.03 0.03 0.18<br />
Net gearing (net interest bearing liabilities/equity) (0.28) (0.41) (0.40) (0.35) (0.11)<br />
ROCE (EBIT/capital employed) in % 23.67 26.03 27.76 26.31 23.42<br />
Current cash debt coverage ratio<br />
(Net operating cash flow/average current liability) 0.05 0.14 0.11 0.50 0.08<br />
Cash debt coverage ratio<br />
(Net operating cash flow/average total liability) 0.04 0.12 0.10 0.43 0.07<br />
Return on equity in % 14.5 13.8 17.3 18.3 17.6<br />
Change in % 5.30 (20.21) (5.58) 4.00 7.16<br />
Panalpina Annual Report 2004 75
Consolidated Financial Statements 2004<br />
76 Panalpina Annual Report 2004<br />
Balance Sheet in CHF<br />
5-year review<br />
in CHF millions 2004 2003 2002 2001 2000<br />
Assets 1,574 1,487 1,431 1,404 1,365<br />
Change in % 5.89 3.89 1.93 2.86 6.89<br />
Current assets 1,263 1,211 1,138 1,055 1,065<br />
Change in % 4.25 6.50 7.82 (0.94) 9.56<br />
Liquid funds 247 332 301 250 165<br />
Change in % (25.82) 10.38 20.46 51.52 (17.91)<br />
Receivables and other current assets 1,016 879 836 805 900<br />
Change in % 15.62 5.10 3.90 (10.56) 16.71<br />
Fixed assets 311 275 293 349 300<br />
Change in % 13.10 (5.89) (16.18) 16.33 (1.32)<br />
Tangible assets 159 154 167 192 197<br />
Change in % 3.43 (8.05) (12.80) (2.54) (3.90)<br />
Financial assets 61 68 66 86 85<br />
Change in % (10.93) 3.67 (23.38) 1.18 14.86<br />
Intangible assets 91 53 59 71 18<br />
Change in % 72.07 (10.42) (16.57) 294.44 (28.00)<br />
Liabilities and shareholders’ equity 1,574 1,487 1,431 1,404 1,365<br />
Change in % 5.89 3.89 1.93 2.86 6.89<br />
Liabilities 774 747 749 743 783<br />
Change in % 3.66 (0.26) 0.75 (5.11) 1.03<br />
Payables. accruals and deferred income 646 616 616 571 529<br />
Change in % 4.93 (0.07) 7.95 7.94 5.17<br />
Borrowings 37 32 36 28 113<br />
Change in % 13.94 (11.58) 29.86 (75.22) (23.65)<br />
Provisions 91 99 96 144 141<br />
Change in % (7.63) 2.84 (33.44) 2.13 13.71<br />
Minorities 3 3 3 3 20<br />
Equity 797 737 680 658 562<br />
Change in % 8.09 8.49 3.27 17.08 14.46<br />
Share capital 50 50 50 50 50<br />
Change in % 0.00 0.00 0.00 0.00 0.00<br />
Translation differences (87) (67) (55) 0 0<br />
Change in % 30.36 21.35 0.00 0.00 0.00<br />
Retained earnings 834 754 685 608 512<br />
Change in % 10.61 10.14 12.61 18.75 16.10
Key Figures in EUR<br />
3-year review<br />
Consolidated Financial Statements 2004<br />
in EUR millions 2004 2003 2002<br />
Invoiced <strong>for</strong>warding services 4,827 4,327 4,218<br />
Change in % 9.67 2.60<br />
Net <strong>for</strong>warding revenue 3,964 3,537 3,430<br />
Change in % 9.79 3.12<br />
Gross profit (contribution margin) 869 817 827<br />
Change in % 4.75 (1.23)<br />
in % of net revenue 21.91 23.10 24.12<br />
Consolidated net earnings 72.2 64.5 76.6<br />
Change in % 1.27 (15.90)<br />
in % of gross profit 8.31 7.89 9.26<br />
EBITDA 137.3 128.9 140.0<br />
Change in % (2.02) (7.92)<br />
in % of gross profit 15.81 15.77 16.92<br />
EBITA 113.0 100.6 109.0<br />
Change in % 12.24 (7.68)<br />
in % of gross profit 13.01 12.32 13.18<br />
EBIT 99.0 91.1 100.5<br />
Change in % 8.72 (9.42)<br />
in % of gross profit 11.40 11.14 12.15<br />
Cash flow be<strong>for</strong>e interest and taxes 137.5 128.6 146.1<br />
Change in % 6.92 (11.97)<br />
in % of gross profit 15.83 15.74 17.66<br />
Net cash flow from operating activities 22.0 59.1 47.7<br />
Change in % (62.80) 24.03<br />
in % of gross profit 2.53 7.23 5.76<br />
Free cash flow (50.4) 31.3 12.9<br />
Change in % (260.67) 142.94<br />
in % of gross profit (5.80) 3.84 1.56<br />
Net working capital 239.9 168.8 148.4<br />
Change in % 42.14 13.70<br />
Panalpina Annual Report 2004 77
Consolidated Financial Statements 2004<br />
78 Panalpina Annual Report 2004<br />
in EUR millions 2004 2003 2002<br />
Capital expenditure on fixed assets 58.3 32.8 45.2<br />
Change in % 77.93 (27.51)<br />
in % of gross profit 6.71 4.01 5.46<br />
Net capital expenditure on fixed assets 48.3 25.5 32.8<br />
Change in % 89.51 (22.37)<br />
in % of gross profit 5.56 3.12 3.96<br />
Depreciations 38.3 37.8 39.4<br />
Change in % 1.27 (4.09)<br />
in % of gross profit 4.41 4.63 4.77<br />
Personnel expenses 506.8 484.6 481.1<br />
Personnel<br />
Number of employees at year-end (World) 13,224 12,344 12,463<br />
Number of employees at year-end (Switzerland) 669 755 813<br />
Yearly average (World) 12,784 12,404 12,253<br />
Productivity ratios<br />
Net sales per average employee 310,110 285,157 279,935<br />
Gross profit per average employee 67,949 65,880 67,525<br />
Personnel expenses per average employee 39,642 39,073 39,269<br />
Personnel cost in % of gross profit 58.34 59.31 58.15<br />
Leverage (liabilities/equity) 0.97 1.01 1.10<br />
Net interest bearing liabilities (150) (200) (190)<br />
Gross gearing (interest bearing liabilities/equity) 0.02 0.03 0.03<br />
Net gearing (net interest bearing liabilities/equity) (0.29) (0.42) (0.42)<br />
ROCE (EBIT/capital employed) in % 23.67 26.03 27.76<br />
Current cash debt coverage ratio<br />
(net operating cash flow/average current liability) 0.05 0.14<br />
Cash debt coverage ratio<br />
(net operating cash flow/average total liability) 0.04 0.12<br />
Return on equity in % 14.6 13.8 17.1<br />
Change in % 5.47 (19.18) 11.59
Balance Sheet in EUR<br />
3-year review<br />
Consolidated Financial Statements 2004<br />
in EUR millions 2004 2003 2002<br />
Assets 1,020 954 965<br />
Change in % 7.00 (1.16) 1.86<br />
Current assets 819 777 767<br />
Change in % 5.35 1.25 7.82<br />
Liquid funds 160 213 203<br />
Change in % (25.04) 4.94 20.46<br />
Receivables and other current assets 659 564 564<br />
Change in % 16.84 (0.07) 3.90<br />
Fixed assets 202 177 197<br />
Change in % 14.29 (10.52) (16.18)<br />
Tangible assets 103 99 113<br />
Change in % 4.52 (12.58) (12.80)<br />
Financial assets 39 44 44<br />
Change in % (9.99) (1.43) (23.38)<br />
Intangible assets 59 34 40<br />
Change in % 73.88 (14.83) (16.57)<br />
Liabilities and shareholders’ equity 1,020 954 965<br />
Change in % 6.88 (1.16) 2.66<br />
Liabilities 502 479 505<br />
Change in % 4.75 (5.17) 0.75<br />
Payables, accruals and deferred income 419 395 416<br />
Change in % 6.03 (4.99) 7.95<br />
Borrowings 24 21 25<br />
Change in % 15.14 (15.93) 29.86<br />
Provisions 59 63 65<br />
Change in % (6.65) (2.23) (33.44)<br />
Minorities 2 2 2<br />
Equity 516 473 458<br />
Change in % 8.98 3.27 4.87<br />
Share capital 34 34 34<br />
Change in % 0.00 0.00 0.00<br />
Translation differences (59) (58) (30)<br />
Change in % 0.64 96.70 0.00<br />
Retained earnings 540 497 454<br />
Change in % 8.62 9.60 12.61<br />
Panalpina Annual Report 2004 79
Annual Financial Statements 2004<br />
Panalpina World Transport (Holding) Ltd.<br />
80 Panalpina Annual Report 2004
Income Statement<br />
Annual Financial Statements 2004<br />
in CHF thousands 2004 2003<br />
Income<br />
Income from participations 124,312 122,717<br />
Financial income 18,023 16,316<br />
Rental income 350 350<br />
Other income 47 50<br />
Total income 142,732 139,433<br />
Expense<br />
Personnel expenses 753 780<br />
Other administrative expenses 6,831 2,895<br />
Financial expenses 31,110 16,429<br />
Depreciation and valuation adjustments 10,558 149<br />
Total expenses 49,252 20,253<br />
Taxes 1,000 1,200<br />
Profit <strong>for</strong> the year 92,480 117,980<br />
Presentation of the income statement was changed in 2004. The prior financial year was adjusted <strong>for</strong> comparative<br />
purposes.<br />
Panalpina Annual Report 2004 81
Annual Financial Statements 2004<br />
82 Panalpina Annual Report 2004<br />
Balance Sheet<br />
as of December 31 (be<strong>for</strong>e profit appropriation)<br />
Assets<br />
in CHF thousands 2004 2003<br />
Current assets<br />
Cash 42,869 89,041<br />
Receivables 242 311<br />
– from Group companies 0 0<br />
– from third parties 242 311<br />
Financial receivables from Group companies 201,792 121,857<br />
Time deposits 15,000 10,031<br />
Prepaid expenses and deferred charges 10,564 15,786<br />
Total current assets 270,467 237,026<br />
Long-term assets<br />
Buildings and real estate p.m. p.m.<br />
Participations 118,568 118,568<br />
Loans to Group companies 199,916 135,853<br />
Total long-term assets 318,484 254,421<br />
Total assets 588,951 491,447
Liabilities<br />
Annual Financial Statements 2004<br />
in CHF thousands 2004 2003<br />
Short-term liabilities<br />
Banks 0 0<br />
Payables 1,000 2,570<br />
– due to group companies 952 2,435<br />
– due to third parties 48 135<br />
Financial liabilities to Group companies 83,055 58,126<br />
Accrued expenses 3,373 2,594<br />
Total short-term liabilities 87,428 63,290<br />
Long-term liabilities<br />
Provisions 39,916 29,030<br />
Total long-term liabilities 39,916 29,030<br />
Total liabilities 127,344 92,320<br />
Shareholders’ equity<br />
Share capital 50,000 50,000<br />
General legal reserve 10,000 10,000<br />
Special reserve 297,850 207,850<br />
Retained earnings 103,757 131,277<br />
– brought <strong>for</strong>ward 11,277 13,297<br />
– profit <strong>for</strong> the year 92,480 117,980<br />
Total shareholders’ equity 461,607 399,127<br />
Total liabilities 588,951 491,447<br />
Panalpina Annual Report 2004 83
Annual Financial Statements 2004<br />
84 Panalpina Annual Report 2004<br />
Notes<br />
General<br />
The Group’s consolidated financial statements must be considered <strong>for</strong> a proper financial and economic assessment of the<br />
company. The financial statements of the parent company, Panalpina World Transport (Holding) Ltd., are included in this<br />
part of the annual report as supplementary in<strong>for</strong>mation to the consolidated financial statements and were prepared in accordance<br />
with the accounting principles prescribed by Swiss company law.<br />
Financial receivables from group companies<br />
Financial receivables increased by CHF 79.9 million compared with the prior year. The increase is largely contributable to the<br />
granting of new short-term loans to Panalpina Airfreight Management Ltd. aggregating CHF 40.4 million, to Panalpina USA<br />
aggregating CHF 18.5 million and to Panalpina Singapore aggregating CHF 11.1 million, which primarily serve as working<br />
capital financing <strong>for</strong> these companies. It was possible to reduce or repay several local bank loans as a result.<br />
Participations<br />
The increase in the year under review amounted to CHF 7.4 million, which is comprised of acquisitions. As a commercial<br />
precaution, value adjustments were made amounting to CHF 7.4 million.<br />
Time deposits<br />
Investments were made in time deposits during the year under review, which amounted to CHF 15.0 million at year-end.<br />
The maturity of these instruments varies between three months and one year.<br />
Loans to Group companies<br />
Loans increased by CHF 64.1 million in the year under review. This increase primarily comprises the granting of new<br />
long-term loans to Panalpina England aggregating CHF 38.1 million and to Panalpina USA aggregating CHF 23.9 million.<br />
Provisions<br />
These include provisions relating exclusively to <strong>for</strong>eign exchange risks.<br />
Financial liabilities to group companies<br />
The increase in financial liabilities is mainly a result of the granting of a new loan by Panalpina Management Ltd.<br />
Shareholders’ equity<br />
The fully-paid share capital on December 31, 2004 amounted to CHF 50 million, consisting of 50,000 registered shares with<br />
a nominal value of CHF 1,000 each.<br />
Financial income<br />
The increase in the reporting year is predominantly attributable to increased earnings from supplemental loans granted as<br />
well as to higher bank interest payments.<br />
Financial expense<br />
The increase in financial expenses is predominantly due to greatly increased loss coverage of subsidiaries as well as to<br />
higher external interest payments.<br />
Depreciation and valuation adjustments<br />
In the year under review, value adjustments totaling CHF 10.6 million were made to the debit of the Income Statement.<br />
This refers to value reduction making use of the Swiss Code of Obligation, primarily <strong>for</strong> loans to and participations in our<br />
subsidiaries in Latin America and other emerging nations.
Annual Financial Statements 2004<br />
in CHF thousands 2004 2003<br />
Guarantees in favor of third parties<br />
Guarantees and indemnity liabilities,<br />
Code of Obligations, article 663b 109,947 118,263<br />
In addition, Panalpina World Transport (Holding) Ltd, Basel, has issued letters<br />
of com<strong>for</strong>t in favor of various banks concerning liabilities due from subsidiaries<br />
amounting to CHF 36.0 million (prior year: CHF 42.6 million).<br />
Fire insurance value of buildings and real estate 1,546 1,494<br />
Shareholders<br />
Ernst Göhner Foundation, Zug 100% 100%<br />
Panalpina Annual Report 2004 85
Annual Financial Statements 2004<br />
86 Panalpina Annual Report 2004<br />
Appropriation of Profit<br />
The Board of Directors recommends the following appropriation of available earnings of CHF 103,757,000<br />
at the Annual General Meeting:<br />
in CHF thousands 2004<br />
80% dividend on share capital of CHF 50 million 40,000<br />
One-time anniversary dividend 20,000<br />
Transfer to special reserve 30,000<br />
To be carried <strong>for</strong>ward 13,757<br />
Total 103,757
Report of the Statutory Auditors<br />
To the General Meeting of<br />
Panalpina World Transport (Holding) Ltd., Basel<br />
Annual Financial Statements 2004<br />
As statutory auditors, we have audited the accounting records and the financial statements (income statement, balance<br />
sheet and notes/pages 81 to 86) of Panalpina World Transport (Holding) Ltd. <strong>for</strong> the year ended December 31.<br />
These financial statements are the responsibility of the board of directors. Our responsibility is to express an opinion on<br />
these financial statements based on our audit. We confirm that we meet the legal requirements concerning professional<br />
qualification and independence.<br />
Our audit was conducted in accordance with auditing standards promulgated by the Swiss profession, which require<br />
that an audit be planned and per<strong>for</strong>med to obtain reasonable assurance about whether the financial statements are free<br />
from material misstatement. We have examined on a test basis evidence supporting the amounts and disclosures in<br />
the financial statements. We have also assessed the accounting principles used, significant estimates made and the<br />
overall financial statement presentation. We believe that our audit provides a reasonable basis <strong>for</strong> our opinion.<br />
In our opinion, the accounting records and financial statements and the proposed appropriation of available earnings<br />
comply with Swiss law and the company’s articles of incorporation.<br />
We recommend that the financial statements submitted to you be approved.<br />
PricewaterhouseCoopers AG<br />
A. Baur Th. Brüderlin<br />
Basel, April 19, 2005<br />
Panalpina Annual Report 2004 87
88 Panalpina Annual Report 2004<br />
Main offices worldwide<br />
Algeria<br />
Hassi Messaoud<br />
Angola<br />
Cabinda, Lobito, Luanda, Soyo<br />
Argentina<br />
Buenos Aires<br />
Australia<br />
Brisbane, Melbourne, Sydney<br />
Austria<br />
Graz, Hoechst, Innsbruck, Linz,<br />
Vienna<br />
Azerbaijan<br />
Baku<br />
Bahrain<br />
Manama<br />
Bangladesh<br />
Chittagong, Dhaka<br />
Belgium<br />
Antwerp, Brussels, Liège,<br />
Voeren-Fouron<br />
Brazil<br />
Belo Horizonte, Campinas,<br />
Curitiba, Guarulhos, Joinville,<br />
Macaé, Manaus, Porto Alegre,<br />
Rio de Janeiro, Santos, São<br />
Paulo, Viracopos<br />
Cameroon<br />
Douala<br />
Canada<br />
Calgary, Edmonton, Fort Erie,<br />
Kitchener, Montreal, Ottawa,<br />
Quebec, Toronto, Vancouver,<br />
Windsor, Winnipeg<br />
Chile<br />
Iquique, Santiago, Valparaíso<br />
China<br />
Beijing, Chengdu, Dalian,<br />
Fuzhou, Guangzhou, Haikou,<br />
Hangzhou, Hong Kong, Macau,<br />
Nanjing, Ningbo, Qingdao,<br />
Shanghai, Shenyang, Shenzhen,<br />
Suzhou, Tianjin, Urumqi, Wuxi,<br />
Xiamen, Xi’an, Zhuhai<br />
Colombia<br />
Barranquilla, Bogotá, Buenaventura,<br />
Cali, Cartagena,<br />
Medellín, Pereira<br />
Congo<br />
Pointe-Noire<br />
Costa Rica<br />
San José<br />
Czech Republic<br />
Prague<br />
Denmark<br />
Copenhagen<br />
Dominican Republic<br />
Santo Domingo<br />
Ecuador<br />
Guayaquil, Quito<br />
Egypt<br />
Cairo<br />
El Salvador<br />
San Salvador<br />
Equatorial Guinea<br />
Malabo<br />
Finland<br />
Helsinki<br />
France<br />
Lille, Lyon, Marseille, Nantes,<br />
Paris, Strasbourg<br />
Gabon<br />
Libreville, Port Gentil<br />
Georgia<br />
Poti, Tbilisi<br />
Germany<br />
Bad Waldsee, Berlin, Bremen,<br />
Dortmund, Dusseldorf,<br />
Frankfurt, Hamburg, Hanover,<br />
Kassel, Kehl, Leipzig,<br />
Ludwigshafen, Munich,<br />
Muenster/Osnabrueck,<br />
Nuremberg, Stuttgart<br />
Ghana<br />
Accra, Takoradi, Tema<br />
Hungary<br />
Budapest<br />
India<br />
Ahmedabad, Bangalore,<br />
Chennai, Cochin, Coimbatore,<br />
Hyderabad, Kolkata, Mumbai,<br />
New Delhi, Pune, Tirupur<br />
Indonesia<br />
Jakarta, Semarang, Surabaya<br />
Ireland<br />
Dublin, Shannon<br />
Italy<br />
Bergamo, Biella, Bologna,<br />
Como, Florence, Genoa,<br />
Milan, Monteprandone, Rome,<br />
Turin, Vicenza<br />
Japan<br />
Fukuoka, Nagoya, Osaka,<br />
Sapporo, Tokyo<br />
Kazakhstan<br />
Aktobe, Almaty, Aqtau, Atyrau<br />
Korea<br />
Busan, Daegu, Iksan, Incheon,<br />
Seoul
Luxembourg<br />
Luxembourg<br />
Malaysia<br />
Johor Bahru, Kuala Lumpur,<br />
Penang<br />
Mexico<br />
Cancún, Guadalajara,<br />
México City, Monterrey, Tijuana<br />
Morocco<br />
Casablanca<br />
Netherlands<br />
Amsterdam, Eindhoven,<br />
Maastricht, Moerdijk, Rotterdam<br />
New Zealand<br />
Auckland<br />
Nigeria<br />
Abuja, Apapa (Lagos), Kaduna,<br />
Kano, Port Harcourt, Warri<br />
Panamá<br />
Colón, Panamá,Tocumen<br />
Peru<br />
Callao, Lima<br />
Philippines<br />
Cebu, Manila<br />
Portugal<br />
Lisbon, Porto<br />
Puerto Rico<br />
San José<br />
Qatar<br />
Doha<br />
Russia<br />
Moscow, Nakhodka,<br />
Noyabrsk, St. Petersburg,<br />
Usinsk,Yekaterinburg,<br />
Yuzhno-Sakhalinsk<br />
Saudi Arabia<br />
Al Khobar, Jeddah, Riyadh<br />
Singapore<br />
Singapore<br />
South Africa<br />
Cape Town, Durban, East<br />
London, Johannesburg,<br />
Port Elizabeth<br />
Spain<br />
Barcelona, Bilbao, Madrid,<br />
Valencia<br />
Sri Lanka<br />
Colombo<br />
Sweden<br />
Gothenburg, Stockholm<br />
Switzerland<br />
Basel, Berne, Geneva, Lugano,<br />
St. Gall, Zurich<br />
Taiwan<br />
Hsin-Chu, Kaohsiung,<br />
Taichung, Taipei<br />
Thailand<br />
Bangkok, Laem Chabang<br />
Turkey<br />
Ankara, Istanbul, Izmir<br />
Turkmenistan<br />
Ashgabad, Turkmenbashi<br />
Ukraine<br />
Borispol, Kiev<br />
United Arab Emirates (UAE)<br />
Dubai, Sharjah<br />
United Kingdom (UK)<br />
Aberdeen, Birmingham,<br />
Glasgow, Great Yarmouth,<br />
London, Manchester,<br />
Prestwick<br />
Main offices worldwide<br />
United States of America (USA)<br />
Anchorage, Atlanta, Austin,<br />
Baltimore, Boston, Bradley/<br />
Hart<strong>for</strong>d, Charleston, Charlotte,<br />
Chicago, Cincinnati, Cleveland,<br />
Columbus, Dallas, Denver,<br />
Detroit, El Paso, Foster City,<br />
Greenville, Houston, Huntsville,<br />
Indianapolis, Laredo, Los<br />
Angeles, Memphis, Miami,<br />
Milwaukee, Minneapolis, Montgomery,<br />
Morristown, Nashville,<br />
New Orleans, New York,<br />
Norfolk, Orlando, Philadelphia,<br />
Phoenix, Portland, Raleigh/<br />
Durham, San Diego, San<br />
Francisco, Seattle, St. Louis,<br />
Tulsa, Washington DC<br />
Uruguay<br />
Montevideo<br />
Venezuela<br />
Caracas, Maiquetía/La Guaria,<br />
Maracaibo, Puerta Ordaz,<br />
Puerto Cabello, Puerto La Cruz,<br />
San Antonio del Táchira,<br />
Valencia<br />
Vietnam<br />
Hanoi, Ho Chi Minh City<br />
Panalpina Annual Report 2004 89
90 Panalpina Annual Report 2004
Publishing<br />
details<br />
Panalpina World Transport<br />
(Holding) Ltd.<br />
Viaduktstrasse 42<br />
P.O. Box<br />
CH-4002 Basel<br />
Switzerland<br />
Phone +41 61 226 11 11<br />
Fax +41 61 226 11 01<br />
info@panalpina.com<br />
www.panalpina.com<br />
The Panalpina Annual Report<br />
is published in German and<br />
English.<br />
For additional copies please refer<br />
to the above address or send us<br />
an e-mail.<br />
An electronic version can be<br />
downloaded at:<br />
www.panalpina.com<br />
Editor<br />
Panalpina World Transport<br />
(Holding) Ltd.<br />
Corporate Communications<br />
Concept/Design<br />
Wirz Corporate AG, Zurich<br />
Lithography<br />
Lithoteam, Allschwil/Basel<br />
Printed by<br />
Basler Druck+Verlag AG, bdv,<br />
Basel<br />
Picture credits<br />
Panalpina, getty images (p.27),<br />
imagepoint (p.27),<br />
zefa (p.1, 10/11, 16, 18/19, 21, 22,<br />
23, 24, 25, 27, 28, 29, 32, 33, 36,<br />
38/39, 92)<br />
Panalpina Annual Report 2004 91
Panalpina World Transport<br />
(Holding) Ltd.<br />
Viaduktstrasse 42<br />
P.O. Box<br />
CH-4002 Basel<br />
Phone +41 61 226 11 11<br />
Fax +41 61 226 11 01<br />
info@panalpina.com<br />
www.panalpina.com
![Eigenes Luftfrachtnetzwerk [pdf | 244 KB] - Panalpina](https://img.yumpu.com/23347328/1/184x260/eigenes-luftfrachtnetzwerk-pdf-244-kb-panalpina.jpg?quality=85)
![Übersicht Panalpina [pdf | 240 KB]](https://img.yumpu.com/22547731/1/184x260/ubersicht-panalpina-pdf-240-kb.jpg?quality=85)
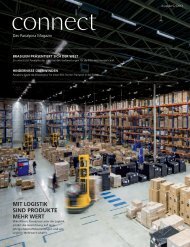
![Seefracht [pdf | 181 KB] - Panalpina](https://img.yumpu.com/22234724/1/184x260/seefracht-pdf-181-kb-panalpina.jpg?quality=85)


![Annual Report 2012 [pdf | 1 MB] - Panalpina](https://img.yumpu.com/15342099/1/184x260/annual-report-2012-pdf-1-mb-panalpina.jpg?quality=85)