Semi-Supervised Classification via Local Spline Regression
Semi-Supervised Classification via Local Spline Regression
Semi-Supervised Classification via Local Spline Regression

You also want an ePaper? Increase the reach of your titles
YUMPU automatically turns print PDFs into web optimized ePapers that Google loves.
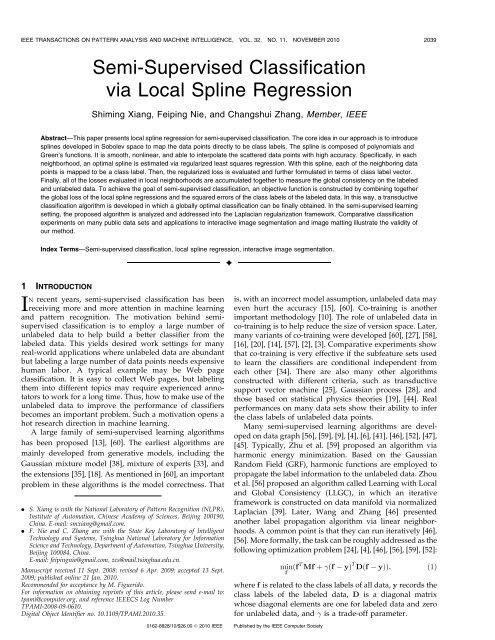
IEEE TRANSACTIONS ON PATTERN ANALYSIS AND MACHINE INTELLIGENCE, VOL. 32, NO. 11, NOVEMBER 2010 2039<br />
<strong>Semi</strong>-<strong>Supervised</strong> <strong>Classification</strong><br />
<strong>via</strong> <strong>Local</strong> <strong>Spline</strong> <strong>Regression</strong><br />
Shiming Xiang, Feiping Nie, and Changshui Zhang, Member, IEEE<br />
Abstract—This paper presents local spline regression for semi-supervised classification. The core idea in our approach is to introduce<br />
splines developed in Sobolev space to map the data points directly to be class labels. The spline is composed of polynomials and<br />
Green’s functions. It is smooth, nonlinear, and able to interpolate the scattered data points with high accuracy. Specifically, in each<br />
neighborhood, an optimal spline is estimated <strong>via</strong> regularized least squares regression. With this spline, each of the neighboring data<br />
points is mapped to be a class label. Then, the regularized loss is evaluated and further formulated in terms of class label vector.<br />
Finally, all of the losses evaluated in local neighborhoods are accumulated together to measure the global consistency on the labeled<br />
and unlabeled data. To achieve the goal of semi-supervised classification, an objective function is constructed by combining together<br />
the global loss of the local spline regressions and the squared errors of the class labels of the labeled data. In this way, a transductive<br />
classification algorithm is developed in which a globally optimal classification can be finally obtained. In the semi-supervised learning<br />
setting, the proposed algorithm is analyzed and addressed into the Laplacian regularization framework. Comparative classification<br />
experiments on many public data sets and applications to interactive image segmentation and image matting illustrate the validity of<br />
our method.<br />
Index Terms—<strong>Semi</strong>-supervised classification, local spline regression, interactive image segmentation.<br />
Ç<br />
1 INTRODUCTION<br />
IN recent years, semi-supervised classification has been<br />
receiving more and more attention in machine learning<br />
and pattern recognition. The motivation behind semisupervised<br />
classification is to employ a large number of<br />
unlabeled data to help build a better classifier from the<br />
labeled data. This yields desired work settings for many<br />
real-world applications where unlabeled data are abundant<br />
but labeling a large number of data points needs expensive<br />
human labor. A typical example may be Web page<br />
classification. It is easy to collect Web pages, but labeling<br />
them into different topics may require experienced annotators<br />
to work for a long time. Thus, how to make use of the<br />
unlabeled data to improve the performance of classifiers<br />
becomes an important problem. Such a motivation opens a<br />
hot research direction in machine learning.<br />
A large family of semi-supervised learning algorithms<br />
has been proposed [13], [60]. The earliest algorithms are<br />
mainly developed from generative models, including the<br />
Gaussian mixture model [38], mixture of experts [33], and<br />
the extensions [35], [18]. As mentioned in [60], an important<br />
problem in these algorithms is the model correctness. That<br />
. S. Xiang is with the National Laboratory of Pattern Recognition (NLPR),<br />
Institute of Automation, Chinese Academy of Sciences, Beijing 100190,<br />
China. E-mail: smxiang@gmail.com.<br />
. F. Nie and C. Zhang are with the State Key Laboratory of Intelligent<br />
Technology and Systems, Tsinghua National Laboratory for Information<br />
Science and Technology, Department of Automation, Tsinghua University,<br />
Beijing 100084, China.<br />
E-mail: feipingnie@gmail.com, zcs@mail.tsinghua.edu.cn.<br />
Manuscript received 11 Sept. 2008; revised 6 Apr. 2009; accepted 13 Sept.<br />
2009; published online 21 Jan. 2010.<br />
Recommended for acceptance by M. Figuerido.<br />
For information on obtaining reprints of this article, please send e-mail to:<br />
tpami@computer.org, and reference IEEECS Log Number<br />
TPAMI-2008-09-0610.<br />
Digital Object Identifier no. 10.1109/TPAMI.2010.35.<br />
is, with an incorrect model assumption, unlabeled data may<br />
even hurt the accuracy [15], [60]. Co-training is another<br />
important methodology [10]. The role of unlabeled data in<br />
co-training is to help reduce the size of version space. Later,<br />
many variants of co-training were developed [60], [27], [58],<br />
[16], [20], [14], [57], [2], [3]. Comparative experiments show<br />
that co-training is very effective if the subfeature sets used<br />
to learn the classifiers are conditional independent from<br />
each other [34]. There are also many other algorithms<br />
constructed with different criteria, such as transductive<br />
support vector machine [25], Gaussian process [28], and<br />
those based on statistical physics theories [19], [44]. Real<br />
performances on many data sets show their ability to infer<br />
the class labels of unlabeled data points.<br />
Many semi-supervised learning algorithms are developed<br />
on data graph [56], [59], [9], [4], [6], [41], [46], [52], [47],<br />
[45]. Typically, Zhu et al. [59] proposed an algorithm <strong>via</strong><br />
harmonic energy minimization. Based on the Gaussian<br />
Random Field (GRF), harmonic functions are employed to<br />
propagate the label information to the unlabeled data. Zhou<br />
et al. [56] proposed an algorithm called Learning with <strong>Local</strong><br />
and Global Consistency (LLGC), in which an iterative<br />
framework is constructed on data manifold <strong>via</strong> normalized<br />
Laplacian [39]. Later, Wang and Zhang [46] presented<br />
another label propagation algorithm <strong>via</strong> linear neighborhoods.<br />
A common point is that they can run iteratively [46],<br />
[56]. More formally, the task can be roughly addressed as the<br />
following optimization problem [24], [4], [46], [56], [59], [52]:<br />
minðf T Mf þ ðf yÞ T Dðf yÞÞ; ð1Þ<br />
f<br />
where f is related to the class labels of all data, y records the<br />
class labels of the labeled data, D is a diagonal matrix<br />
whose diagonal elements are one for labeled data and zero<br />
for unlabeled data, and is a trade-off parameter.<br />
0162-8828/10/$26.00 ß 2010 IEEE Published by the IEEE Computer Society
2040 IEEE TRANSACTIONS ON PATTERN ANALYSIS AND MACHINE INTELLIGENCE, VOL. 32, NO. 11, NOVEMBER 2010<br />
Fig. 1. <strong>Classification</strong> of two half moons using the method in [56]. (a) The 160 data points with three labeled data points in each half moon. (b) The<br />
classification results with ¼ 0:013. (c) The classification results with ¼ 0:021. In experiments, the parameter in (6) in [56] is fixed to be 0.99, and<br />
the size of neighborhood for each data point is set to be 7.<br />
A key task in (1) is to construct matrix M from data<br />
graph. To this end, a basic assumption behind this is the<br />
clustering assumption, which states that the data points<br />
forming the same structure (manifold) are likely to have the<br />
same label. Thus, modeling the neighboring data points will<br />
play fundamental roles in exploring the data structures [6],<br />
[56], [7], [51], [50], [52], [23], [55], [37]. Accordingly, many<br />
local evaluations are introduced, typically including data<br />
affinity between neighbors [56], locally linear representation<br />
[37], [46], [52], and locally nonlinear representation with<br />
kernels [6], [51]. In spite of the great successes in semisupervised<br />
learning, there still exist some issues to be<br />
further addressed:<br />
1. A commonly used affinity measure between two data<br />
points x i and x j is the Gaussian function [56], [59]:<br />
w ij ¼ expð kx i x j k 2 =ð2 2 ÞÞ: ð2Þ<br />
In (2), we face supplying a well-tuned to obtain<br />
satisfactory results. A problem is that a small change<br />
of may generate different classification results. Fig. 1<br />
shows an example where LLGC [56] is implemented.<br />
Only 139/160 correct classification rate is obtained<br />
with ¼ 0:013, while 100 percent correct recognition<br />
rate is achieved with ¼ 0:021. Such a problem may<br />
also occur in regression frameworks constructed with<br />
Gaussian functions [6]:<br />
f i ¼ X j<br />
j Kðx i ; x j Þ;<br />
ð3Þ<br />
the ability to accurately capture the local geometry.<br />
In addition, if the size of the neighborhoods is<br />
supplied inappropriately, linear representations may<br />
introduce model errors. Fig. 2 shows a data point<br />
and its 14 neighbors, whose coordinates and true<br />
class labels are listed in the first and second column<br />
in Table 1. The linear transformation can be used to<br />
map them to be class labels:<br />
f ¼ W T x þ b:<br />
In (4), the optimal W 2 IR 2 and b 2 IR can be estimated<br />
under the least squares framework, based on the 15 data<br />
points and their class labels. The optimal transformation<br />
can be used in turn to map them. The results are listed in<br />
the third column in Table 1. As can be seen, most of them<br />
are far away from their true values. Similarly, we can also<br />
model them with (3). The fourth column in Table 1 reports<br />
the results obtained <strong>via</strong> (3) with ¼ 0:65. The average of the<br />
squared errors indicates that the nonlinear model is more<br />
accurate than the linear model.<br />
In this paper, we hope to construct the model with<br />
powerful nonlinear description as well as ease in usage. To<br />
this end, we use splines developed in Sobolev space [1] to<br />
replace the commonly used linear and kernel functions, and<br />
develop a semi-supervised classification algorithm <strong>via</strong><br />
spline regression on local neighborhoods. This spline is a<br />
TABLE 1<br />
Coordinates, True Class Labels, and the Mapped Results<br />
ð4Þ<br />
where f i is the class label of x i and Kðx i ; x j Þ¼<br />
expð kx i x j k 2 =ð2 2 ÞÞ.<br />
2. Although locally linear representations have no such<br />
parameters to be well tuned to data, they may lack<br />
Fig. 2. A data point (solid triangle) and its 14 neighbors (solid squares).<br />
This data set is just the same as that used in Fig. 1. The coordinates of<br />
these 15 data points are listed in Table 1.<br />
The first and second column list the 15 neighboring data points in Fig. 2<br />
and their true labels. From the third to the fifth column are the mapped<br />
results with (4), (3), and (7) (see Section 2.1), respectively. The last row<br />
reports the averages of the squared errors.
XIANG ET AL.: SEMI-SUPERVISED CLASSIFICATION VIA LOCAL SPLINE REGRESSION 2041<br />
combination of polynomials and Green’s functions which is<br />
popularly used to interpolate scattered data in geometrical<br />
design [11]. Recently, we also used this spline in nonlinear<br />
dimensionality reduction [53]. Practice also shows that it<br />
can effectively handle high-dimensional data [53], [43]. This<br />
spline is smooth, nonlinear, and able to interpolate the<br />
scattered data points with high accuracy. This is desired for<br />
obtaining accurate local evaluations. For the above 15 data<br />
points in Table 1, for example, with this spline, the average<br />
of the squared errors is only about 3:7 10 28 (see the last<br />
column in Table 1).<br />
After the regularized objective function is minimized, the<br />
regularized loss is evaluated and then formulated in terms<br />
of class label vector. Matrix M is finally constructed by<br />
summing the local losses estimated from all of the<br />
neighborhoods. We prove that M is a Laplacian matrix.<br />
Thus, our method can be addressed into the Laplacian<br />
regularization framework [5], [56]. This illustrates its<br />
connections to the existing methods. Meanwhile, the main<br />
algorithm can be easily implemented. Comparative classification<br />
experiments on many public data sets and applications<br />
to interactive natural image segmentation and image<br />
matting illustrate the validity of our proposed method.<br />
The remainder of this paper is organized as follows:<br />
Section 2 constructs the spline and evaluates the regularized<br />
loss. The algorithm is given in Section 3. Section 4<br />
reports the experimental results. Applications in interactive<br />
natural image segmentation and image matting are given in<br />
Section 5, followed by the conclusions in Section 6.<br />
2 CLASS LABEL REGRESSIONS ON<br />
NEIGHBORHOODS<br />
Our problem can be formulated as follows: Given n data<br />
points X¼fx 1 ; x 2 ; ...; x l ; x lþ1 ; ...; x n g2IR m and the class<br />
labels of the first l data points in ff i g l i¼1<br />
, the task is to infer<br />
the class labels ff i g n i¼lþ1 of the remaining n l unlabeled<br />
data points in fx i g n i¼lþ1 .<br />
To construct matrix M in (1), splines developed in<br />
Sobolev space [1] will be used to map the neighboring data<br />
points and the regularized loss will be evaluated. Matrix M<br />
will finally be constructed by summing together the local<br />
losses estimated from all of the neighborhoods.<br />
Sobolev space is composed of integrable functions with<br />
weak derivatives. In contrast to Hilbert space, it is capable<br />
of supplying functions with more general forms. The<br />
motivations for our use of the spline developed in Sobolev<br />
space are summarized as follows: 1) This spline is smooth,<br />
nonlinear, and able to interpolate the scattered data points<br />
with arbitrarily controllable accuracy. 2) With this spline,<br />
the regularized loss can be formulated in terms of class label<br />
vector. Although the class labels are currently unknown,<br />
this formulation gives us a way to develop an objective<br />
function from which the class labels are finally solved.<br />
2.1 <strong>Spline</strong> <strong>Regression</strong><br />
For the moment, we consider the two-class case. In this case,<br />
the class label f i of x i will belong to the two-value label set<br />
L¼fþ1; 1g.<br />
For each data point x i 2X, its k nearest neighbors in X<br />
can be determined <strong>via</strong> euclidean distance metric. Denote<br />
these k neighbors including x i itself by N i ¼fx ij g k j¼1 , where<br />
subscript i j stands for an index, namely, i j 2f1; 2; ...;ng,<br />
and i 1 ¼ i. Now the task is to find a function g i :IR m ! IR<br />
such that it can directly map each source data point x ij 2<br />
IR m to be a class label<br />
f ij ¼ g i ðx ij Þ; j ¼ 1; 2; ...;k: ð5Þ<br />
For the above regression task, we can consider the<br />
following general objective function with data fitting and<br />
function smoothness:<br />
Jðg i Þ¼ Xk<br />
j¼1<br />
f ij g i x ij<br />
2<br />
þ Sðgi Þ; ð6Þ<br />
where Sðg i Þ is a penalty functional and is a trade-off<br />
parameter..<br />
With different hypothesis spaces, minimizing Jðg i Þ in (6)<br />
will generate g i with different forms. Actually, if the linear<br />
space is considered, we can get linear transformations as<br />
formulated in (4). If the general reproducing kernel Hilbert<br />
space is considered, we can obtain nonlinear function<br />
mappings. One common form of such mappings is a<br />
combination of Gaussian functions as formulated in (3).<br />
Here, we consider finding the continuous function in<br />
Sobolev space [1]. Accordingly, the penalty functional<br />
Sðg i Þ is then defined as a semi-norm [17], [42]. With this<br />
form, research work [17] shows that the minimizer g i in (6)<br />
will be given by<br />
g i ðxÞ ¼ Xd<br />
j¼1<br />
i;j p j ðxÞþ Xk<br />
j¼1<br />
i;j i;j ðxÞ;<br />
where i;j ðxÞ is a Green’s function [17], namely, i;j ðxÞ ¼<br />
ðkx x ij kÞ 2s m logðkx x ij kÞ, if m is even; i;j ðxÞ ¼<br />
ðkx x ij kÞ 2s m , otherwise. Here, kkdenotes the euclidean<br />
distance, and s is the order of the partial derivatives in the<br />
semi-norm [42].<br />
In (7), d ¼ Cmþs<br />
s 1 and fp jðxÞg d j¼1<br />
are a set of primitive<br />
polynomials which can span the polynomial space with<br />
degree less than s. In the case of s ¼ 2 (linear polynomial<br />
space) and m ¼ 3, for example, denoting x ¼½x 1 ;x 2 ;x 3 Š T 2<br />
IR 3 , then we have four primitive polynomials: a constant<br />
term p 1 ðxÞ ¼1, and three monomials p 2 ðxÞ ¼x 1 , p 3 ðxÞ ¼x 2 ,<br />
and p 4 ðxÞ ¼x 3 . In this case, the spline is a C 1 -smoothness<br />
function ð2s m ¼ 1Þ.<br />
Substituting the k data points in N i into (7) will yield<br />
k equations. However, there are, in total, k þ d coefficients<br />
to be solved. To this end, we introduce d new equations,<br />
according to the definition of conditionally positive semidefiniteness<br />
of functions [54], [49]. For k data points in N i ,<br />
we obtain<br />
<br />
e T<br />
<br />
P i ¼ 0;<br />
ð8Þ<br />
i<br />
where e is a k-dimensional vector with all 1s, namely, e ¼<br />
½1; 1; ...; 1Š T 2 IR k (corresponding to the constant primitive<br />
polynomial “1” in fp j ðxÞg d j¼1 ), P i 2 IR ðd 1Þk collects the<br />
values of the d 1 nonconstant primitive polynomials in<br />
fp j ðxÞg d j¼1 with the k data points in N i as inputs, and i<br />
collects the coefficients in (7), namely, i ¼½ i;1 ; i;2 ; ...;<br />
i;k Š T 2 IR k .<br />
ð7Þ
2042 IEEE TRANSACTIONS ON PATTERN ANALYSIS AND MACHINE INTELLIGENCE, VOL. 32, NO. 11, NOVEMBER 2010<br />
Now considering the regularization parameter , and<br />
combining together the k equations derived from (7), we have<br />
0<br />
10<br />
K i þ I e P T i<br />
@ e T 0 0 A<br />
1 0 1<br />
i F i<br />
@ i;0<br />
A ¼ @ 0 A; ð9Þ<br />
P i 0 0 i 0<br />
where K i is a k k symmetrical matrix with the rth row<br />
and cth column element K r;c ¼ i;c ðx ir Þ, F i ¼½f i1<br />
;f i2<br />
; ...;<br />
f ik<br />
Š T 2 IR k collects the class labels of the k data points in N i ,<br />
I is a k k identity matrix, i ¼½ i;1 ; i;2 ; ...; i;k Š T 2 IR k ,<br />
i;0 2 IR, and i ¼½ i;1 ; i;2 ; ...; i;d 1 Š T 2 IR d 1 .<br />
Note that the regularization parameter is added to<br />
balance between the smoothness of the spline and the<br />
accuracy near the k scattered data points. That is, a larger <br />
will result in that the spline is more smooth (flat), but the<br />
interpolation errors will be increased. On the contrary, a<br />
smaller will decrease the smoothness of the spline, but the<br />
interpolation accuracy near the scattered data points will be<br />
improved. In computation, a small can be employed to<br />
achieve the goal of balance.<br />
In Table 1, the last column values are obtained <strong>via</strong> (7) with<br />
linear polynomials. When solving (9), is set to be 0.001. The<br />
average of the squared errors listed in the last row in Table 1<br />
indicates that spline can yield more accurate results.<br />
Finally, we point out that, if we do not consider the second<br />
part of the Green’s functions in (7), g i ðxÞ will turn out to be<br />
the commonly used polynomial function in statistical<br />
analysis. Accordingly, the regression task can be addressed<br />
in a penalty-free polynomial space. In general, polynomial<br />
regressions can generate satisfactory results, especially when<br />
we are given sufficient observation data. However, a main<br />
drawback of polynomial regression is that the primitive<br />
polynomials are nonlocal. In other words, the regression<br />
value of a data point is dependent not only on itself but also<br />
on those data points far from it. As a result, although the<br />
global error can be reduced to some degree, the regression<br />
values at some data points may be far from the true values. In<br />
Table 1, for example, the average of the squared errors under<br />
the linear polynomial is only about 0.075, while at the first<br />
data point, the bias is greater than 0.5. In contrast, although<br />
the spline in (7) includes the polynomial function, it shows<br />
the property of locality. Actually, with this spline, the data<br />
points are first globally mapped with the polynomial<br />
function, and then they are locally warped with the radial<br />
basis functions (namely, the Green’s functions) defined at the<br />
scattered data points. As a result, better local fitting near the<br />
scattered data points can be achieved.<br />
2.2 The Regularized Loss<br />
Note that currently we can not solve (9) since the class label<br />
vector F i ¼½f i1<br />
;f i2<br />
; ...;f ik<br />
Š T 2 IR k are actually unknown.<br />
Alternatively, we analyze the regularized loss. Previous<br />
research shows that for k scattered data points, the<br />
regularized loss minimization Jðg i ðxÞÞ in (6) can be<br />
approximately evaluated as follows [42]:<br />
Jðg i Þ Xk<br />
j¼1<br />
f ij g i x ij<br />
2<br />
þ <br />
T<br />
i K i i ; ð10Þ<br />
where the rth row and cth column element of K i<br />
calculated as K r;c ¼ i;c ðx ir Þ.<br />
is<br />
As can be seen from (9), for a small , the conditions in<br />
(5) can be approximately satisfied. This means that the first<br />
term in (10) can be evaluated as zero. Then, we have<br />
Jðg i Þ T i K i i .<br />
Theorem 1. For a small , the regularized loss minimization can<br />
be evaluated in terms of class label vector:<br />
Jðg i ÞF T i M iF i ;<br />
ð11Þ<br />
where M i is the upper left k k submatrix of the inverse<br />
matrix of the coefficient matrix in (9).<br />
Proof. Based on (9), we have ðK i þ IÞ i þ e i;0 þ P T i i ¼<br />
F i , e T i ¼ 0, and P i i ¼ 0. Note that M i is the upper left<br />
k k submatrix of the inverse matrix of the coefficient<br />
matrix in (9). Then, solving (9) can generate i ¼ M i F i .<br />
Now it follows that T i ðK i þ IÞ i þ T i e i;0 þ T i PT i i ¼<br />
T i F i ) T i ðK i þ IÞ i ¼ F T i M iF i . The last equality<br />
holds since M i is a symmetrical matrix. Thus, for a small<br />
, we have Jðg i Þ T i K i i T i K i i þ 2 T i i ¼<br />
F T i M iF i .<br />
tu<br />
The formulation in (11) indicates that we can evaluate the<br />
regularized loss minimization in a compact way. More<br />
importantly, this provides us a way to develop the learning<br />
model from which the class labels are inferred. Furthermore,<br />
for M i , we have the following theorem:<br />
Theorem 2. M i is a Laplacian matrix.<br />
Proof. We need to prove two points. One is that M i is<br />
positive semidefinite and the other is that the sum of<br />
elements in each row of M i equals to zero.<br />
Following Theorem 1, it is easy to justify that, for any<br />
vector z 2 IR k , there exists a vector 2 IR k such that<br />
T ðK i þ IÞ ¼ z T M i z. In addition, should also satisfy<br />
the conditions in (8). Note that the Green’s function is a<br />
conditionally positive semidefinite function [49]. In addition,<br />
the conditions in (8) are actually the conditions which<br />
stipulate that the solution to should be located in the null<br />
space of P i . Based on the conditionally positive semidefiniteness<br />
for such , it holds that T K i 0. Note that is a<br />
positive number, thus z T M i z 0. This indicates that M i is<br />
positive semidefinite.<br />
For the second point, we only need to prove M i e ¼ 0.<br />
Here, e ¼½1; 1; ...; 1Š T 2 IR k . Actually, replacing F i in (9)<br />
by e, we can obtain a vector 2 IR k . Following the proof<br />
in Theorem 1 for this , it also holds that e T M i e ¼ T e.<br />
In addition, from (9), we have T e ¼ e T ¼ 0. Thus,<br />
e T M i e ¼ 0.<br />
According to matrix theory [21], for semidefinite<br />
matrix M i , there exists a matrix Q such that Q T Q ¼ M i .<br />
Then, e T M i e ¼ 0 ) e T Q T Qe ¼ 0 ) Qe ¼ 0 ) Q T Qe ¼<br />
0 ) M i e ¼ 0. Thus, we finish the proof. tu<br />
The fact that M i is a Laplacian matrix will give us a way<br />
to address our algorithm into the general Laplacian<br />
regularization framework.<br />
Finally, we point out that, in view of the data graph, the<br />
construction of M i can actually allow negative edges in<br />
graph. The negative edges are generated since the spline<br />
regression is intrinsically a discriminative learning approach.
XIANG ET AL.: SEMI-SUPERVISED CLASSIFICATION VIA LOCAL SPLINE REGRESSION 2043<br />
That is, all of the neighboring data points are employed<br />
together to learn a function through which their class labels<br />
are predicted. As a result, the constructed graph explores the<br />
relations between all of the neighboring data points and thus<br />
shows local discriminating power. In contrast, LLGC [56] is<br />
developed on traditional graph Laplacian. That is, each pair<br />
of data points are independently assigned an edge weight. In<br />
this way, the constructed graph always has nonnegative<br />
edges. However, independently assigning edge weights may<br />
be inadequate to natural images where strong structural<br />
dependencies exist in local patches. With such weighted<br />
graphs, unsatisfactory segmentations may be generated.<br />
Such a drawback could be avoided to some degree <strong>via</strong> spline<br />
regressions (see Figs. 7 and 8).<br />
3 ALGORITHM<br />
In this section, we introduce the construction of matrix M<br />
and present the transductive classification algorithm.<br />
3.1 Constructing Matrix M<br />
Section 2 introduced the spline and evaluates the regularized<br />
loss in each neighborhood N i , which is formulated in<br />
(11). Now it is natural to add together the losses estimated<br />
on all of the n neighborhoods fN i g n i¼1 . Minimizing this total<br />
loss will achieve global consistency on the labeled and<br />
unlabeled data. Now we have<br />
EðfÞ Xn<br />
i¼1<br />
F T i M iF i ;<br />
ð12Þ<br />
where f ¼½f 1 ;f 2 ; ...;f n Š T 2 IR n is the vector of class labels.<br />
Note that F i ¼½f i1 ;f i2 ; ...;f ik Š T 2 IR k is just a subvector<br />
of the label vector f. Thus, there exists a row selection<br />
matrix S i 2 IR kn such that F i ¼ S i f. The rth row and<br />
cth column element s i ðr; cÞ of S i can be defined as follows:<br />
<br />
s i ðr; cÞ ¼ 1; if c ¼ i r<br />
ð13Þ<br />
0; otherwise:<br />
In computation, we can ignore the coefficient in (12).<br />
Then, it follows that<br />
EðfÞ / Xn<br />
i¼1<br />
F T i M iF i ¼ f T Mf;<br />
ð14Þ<br />
where M ¼ P n<br />
i¼1 ST i M iS i .<br />
Note that each M i in (14) is a k k matrix. Since some<br />
neighborhoods may intersect with each other, M will<br />
contain at most nk 2 nonzero elements. In the case of<br />
k n, M is highly sparse. Thus, it is possible for us to treat<br />
very large-scale data sets on PCs.<br />
3.2 Solving Class Labels<br />
After matrix M is constructed, we can minimize the<br />
objective function in (1) to obtain the class labels of the<br />
unlabeled data points. As mentioned previously, matrix<br />
D 2 IR nn in (1) is a diagonal matrix whose diagonal<br />
elements are one for labeled data points and zero for<br />
unlabeled data points, is positive parameter, and y 2 IR n<br />
is known. Denote y ¼½y 1 ;y 2 ; ...;y n Š T , then<br />
8<br />
< 1; if x i is labeled as positive<br />
y i ¼ 1; if x i is labeled as negative<br />
:<br />
0; otherwise:<br />
ð15Þ<br />
With the above constructions of D and y, we see that the<br />
second term in (1) associates to the sum of the squared errors<br />
P<br />
of the l labeled data points, namely, ðf yÞ T Dðf yÞ ¼<br />
l<br />
i¼1 ðf i y i Þ 2 . Based on (14), the objective function in (1) can<br />
be rewritten as follows:<br />
GðfÞ ¼f T Mf þ Xl<br />
i¼1<br />
ðf i y i Þ 2 : ð16Þ<br />
According to (14), the first term is just the sum of the<br />
regularized losses on all of the neighborhoods, which<br />
means that the predicted class labels should not change<br />
too much between neighboring data points. The second<br />
term is related to class label fitting, which means that the<br />
predicted class labels of the labeled data points should not<br />
change too much from the given class labels. The trade-off<br />
between these two terms is controlled by parameter . It can<br />
be easily justified that the labeled values will be exactly<br />
satisfied when equals to positive infinity.<br />
Now, based on (1), we can get the globally optimal<br />
solution to f as follows:<br />
f ¼ðM þ DÞ 1 Dy:<br />
ð17Þ<br />
After the class label vector f is solved from (17), each<br />
data point x i can be classified as “þ1” if f i 0; “ 1”<br />
otherwise.<br />
It is easy to extend the above computation to multiclass<br />
classification problems. Suppose, we are given c classes.<br />
Differently from two-class problems, here we use a class<br />
label matrix F ¼½f 1 ; f 2 ; ...; f c Š2IR nc to replace the label<br />
vector f in (1). Accordingly, the problem can be reformulated<br />
as follows:<br />
min<br />
F2IR trðFT MF þ ðF YÞ T DðF YÞÞ; ð18Þ<br />
nc<br />
where tr is the trace operator of matrix and Y is an n c<br />
matrix which records the information of the labeled data<br />
points. The element of Y is defined as follows [56]:<br />
<br />
y ij ¼ 1; if x i is labeled as class j<br />
ð19Þ<br />
0; otherwise:<br />
Note that the steps of constructing M in (18) are similar to<br />
those described for two-class problems. We explain this point<br />
as follows: In multiclass cases, in each neighborhood N i , the<br />
k-dimensional label vector F i in (11) will be replaced by a<br />
k c class label matrix. This means that, in each neighborhood,<br />
the spline in (7) will be employed c times and, in<br />
total, c splines will be constructed to interpolate, respectively,<br />
the c column vectors. Accordingly, we can get c<br />
losses, each of which can be written in the same form as<br />
that in (11). Then, we can sum these c losses together. With<br />
trace operator of matrix and using the row selection matrix<br />
S i , this sum can finally be formulated as trðF T S T i M iFS i Þ.<br />
Here, M i equals that in (11). Finally, similarly to (14), we<br />
can get EðFÞ / P n<br />
i¼1 trðFT S T i M iFS i Þ¼ trðF T MFÞ. Thus,<br />
we see M in (18) is identical to that in (14).<br />
Now, solving Problem (18), we can get the globally<br />
optimal solution to F as follows:
2044 IEEE TRANSACTIONS ON PATTERN ANALYSIS AND MACHINE INTELLIGENCE, VOL. 32, NO. 11, NOVEMBER 2010<br />
TABLE 2<br />
Algorithm Description<br />
TABLE 3<br />
A Brief Description of the Data Sets<br />
F ¼ðM þ DÞ 1 DY:<br />
ð20Þ<br />
After the class label matrix F is solved, x i is finally<br />
classified into class f i ¼ arg max 1jc F ij .<br />
Note that, in (17) and (20), directly calculating the inverse<br />
matrix of ðM þ DÞ may be very expensive, especially<br />
when the number of the data points n is very large.<br />
However, ðM þ DÞ is a sparse matrix, especially in the<br />
case of k n. Thus, we can employ the existing sparse<br />
algorithms to solve the linear equations.<br />
The algorithm steps are given in Table 2. Note that, for<br />
high-dimensional data, constructing a smooth spline may<br />
need a huge number of primitive polynomials. As a result,<br />
the size of the coefficient matrix in (9) will become very<br />
large. Solving the equations could be uneconomical or even<br />
impossible. In practice, an alternative way is to only keep<br />
the linear polynomial. Research work shows such a<br />
compromise can also generate satisfactory results in<br />
regression analysis [43]. In our transductive learning<br />
setting, only k neighboring data points are considered to<br />
construct matrix M i . In particular, k is usually very small.<br />
Thus, we can use principal component analysis [26] to<br />
project these data points into a subspace. In experiments in<br />
this paper, the dimensionality of the subspace is fixed to be<br />
three. The k projected points will finally be employed to<br />
calculate M i . This will speed up the computation as well as<br />
guarantee the smoothness of the splines.<br />
3.3 Algorithm Analysis<br />
To illustrate the property of our algorithm, we give the<br />
following theorem:<br />
Theorem 3. M in (14) is a Laplacian matrix.<br />
Proof. Note that S i is a row selection matrix. Thus, in (14), to<br />
add S T i M iS i is just to add the elements of M i to the<br />
corresponding elements of M. Due to the fact that M i is a<br />
Laplacian matrix, then S T i M iS i is also a Laplacian matrix.<br />
Note that the sum of n Laplacian matrices is also a<br />
Laplacian matrix. Thus, we prove this theorem. tu<br />
Theorem 3 indicates that our algorithm will share the same<br />
properties of Laplacian regularization framework [5]. Under<br />
this framework, we can explain the algorithm in view of data<br />
manifold. Since M is a Laplacian matrix, it can be viewed as a<br />
Laplacian-Beltrami operator on data manifold, which treats f<br />
(here discretized as a vector) as a function on this manifold<br />
such that the global geometry of data is exploited from<br />
neighborhoods. As a result, the term f T Mf measures the<br />
smoothness of the class labels. Thus, the validity of the<br />
developed algorithm is theoretically guaranteed.<br />
4 EXPERIMENTAL RESULTS<br />
4.1 Data Sets<br />
Image data sets. USPS and Digital1. The data points in USPS<br />
are generated from the USPS benchmark. 1 The data points in<br />
Digital1 are transformed from the image of the digit “1”. 2 No<br />
explicit structures are hidden in the USPS data set. In contrast,<br />
the data points in Digital1 show strong manifold structure.<br />
Text data set. News20. Here, we conduct text classification<br />
experiments on the 20-newsgroups data set. 3 The<br />
articles including autos, motorcycles, baseball, and hockey<br />
are chosen from the version 20-news-18828. The articles were<br />
preprocessed with the same procedure as that used in [56].<br />
UCI data sets. Breast, Diabetes, Iris, Ionosphere, Vehicle<br />
and Vote. These are taken from the UCI machine learning<br />
repository, 4 which is commonly used to test semi-supervised<br />
classification algorithms.<br />
Table 3 describes these data sets. For the first three highdimensional<br />
data sets, principal component analysis [26] is<br />
used to project them, respectively, into 30-dimensional<br />
subspace. Then all of the semi-supervised algorithms for<br />
comparisons will be run on the same data.<br />
4.2 Algorithms and Parameter Settings<br />
We will compare our algorithm, <strong>Local</strong> <strong>Spline</strong> <strong>Regression</strong><br />
(LSR), with several typical semi-supervised classification<br />
algorithms, including GRF [59], LLGC [56], <strong>Local</strong> Learning<br />
Regularization (LL-Reg) [52], and Laplacian Regularized<br />
Least Squares (LapRLS) [6]. In experiments, the algorithm<br />
of <strong>Local</strong>ly Linear Embedding Regularizer (LLE-Reg) [52] is<br />
also compared. To be clear, here we briefly explain LLE-Reg<br />
and LL-Reg. Given data point x i and its neighborhood<br />
1. Available at http://www.kernel-machines.org/data.<br />
2. Available at http://www.kyb.tuebingen.mpg.de/ssl-book/<br />
benchmarks.html.<br />
3. Available at http://people.csail.mit.edu/jrennie/20Newsgroups/.<br />
4. Available at http://www.ics.uci.edu/mlearn/MLRepository.html.
XIANG ET AL.: SEMI-SUPERVISED CLASSIFICATION VIA LOCAL SPLINE REGRESSION 2045<br />
N i ¼fx ij g k j¼1 with x i ¼ x i1 , LLE-Reg uses the class labels of<br />
k 1 data points in fx ij g k j¼2 to linearly reconstruct the class<br />
label of x i , while LL-Reg employs a linear transformation to<br />
map x i directly to be a class label (for more details see<br />
Appendix A). Thus, we see both LLE-Reg and LL-Reg use<br />
linear models to handle the neighboring data points. In<br />
contrast, LSR uses nonlinear function (spline) to map them.<br />
Our algorithm has three parameters: the number of<br />
nearest neighbors k, the regularization parameter in (20),<br />
and the regularization parameter in (9). Formally, LLE-Reg<br />
and LL-Reg also have three such parameters. Differently,<br />
parameter in LLE-Reg and LL-Reg corresponds to that<br />
used to regularize the locally linear representation [37], [52].<br />
Note that, in this work, both LLE-Reg and LL-Reg are<br />
implemented under Problem (1).<br />
GRF has two parameters: k and the parameter in (2).<br />
Besides, LLGC has a normalized regularization parameter<br />
2ð0; 1Þ [56]. In experiments, it is fixed to be 0.99.<br />
LapRLS has more parameters. In contrast to Problem (1),<br />
the objective function in LapRLS includes an additional<br />
kernel term related to all of the labeled data points. Besides<br />
k and the Gaussian kernel parameter , LapRLS has two<br />
global trade-off parameters A and I (see (4) in [6]). In<br />
experiments, we fix A and I both to be 0.001. 5<br />
Totally 20 trials are run for each group of ðk; ; Þ. In each<br />
trail, 10 percent of the data points are randomly selected,<br />
which are treated as labeled data points. The number of<br />
labeled dada points is listed in Table 3. The final recognition<br />
rate is calculated as the average on these 20 trials.<br />
Note that there is a common parameter in GRF, LLGC,<br />
and LapRLS. Experiments show that directly setting it to be a<br />
fixed number is infeasible. This indicates that it should be<br />
changed from data set to data set. To determine a parameter <br />
from the data set, we first calculate the median value of the<br />
distances between all of the n data points, and denote it by d m .<br />
Based on this value, we construct a candidate set f10 6 d m ;<br />
10 4 d m ; 10 2 d m ;d m ; 10d m ; 10 2 d m g from which a is selected.<br />
The cross validation approach is employed to achieve this<br />
goal. To this end, the labeled data points are divided into a<br />
few subsets. Specifically, for the labeled data points in the<br />
USPS, Digital1, News20, Breast, Diabetes, and Vehicle data<br />
sets, they are divided into 10 subsets, respectively. Since the<br />
number of the labeled data points in Iris, Ionosphere, and<br />
Vote is very small, we only divide them into five subsets.<br />
When performing five-fold or 10-fold cross validation, we<br />
manually fix k ¼ 30 in GRF, LLGC, and LapRLS. The selected<br />
parameter will be finally used in experiments.<br />
4.3 Experimental Results<br />
Fig. 3 illustrates the experimental results with k ¼ 10;<br />
15; ...; 50. Figs. 3a to 3i show the results obtained from<br />
the nine data sets described in Table 3. In experiments, is<br />
fixed to be 10,000.0 and is fixed to be 0.0001. The results<br />
obtained with LL-Reg are not illustrated in Fig. 3. In our<br />
implementation, with the same parameter settings and data<br />
inputs, we obtain the same accuracy, respectively, with<br />
LL-Reg and LLE-Reg. This indicates that LL-Reg and<br />
5. Matlab code can be downloaded from http://manifold.cs.uchicago.<br />
edu/manifold_regularization/software.html.<br />
LLE-Reg could be equivalent to each other. 6 For this point,<br />
we give an explanation in Appendix A.<br />
As can be seen from Fig. 3, in most experiments our<br />
algorithm achieves higher correct recognition rates, especially<br />
when compared with LLE-Reg. Both LLE-Reg and our<br />
algorithm first derived the local evaluations from the same<br />
neighborhoods and all of these local evaluations are then<br />
accumulated together to construct the global objective<br />
function. Differently, LSR employs splines to directly map<br />
neighboring data points to be their class labels, while LLE-<br />
Reg linearly reconstructs the class labels. The spline is a<br />
smooth nonlinear function in Sobolev space. Compared<br />
with linear functions, splines show more adaptability to the<br />
scattered data points. In contrast, LSR achieves higher<br />
accuracy in most experiments compared with the classic<br />
semi-supervised algorithms of GRF and LLGC. In addition,<br />
the performance of our algorithm is also comparable to that<br />
of LapRLS, although its parameter has been tuned to data.<br />
Compared with the objective function in (1), where there<br />
are only two trade-off terms, the objective function in<br />
LapRLS is composed of more terms (see (4) in [6]). LapRLS<br />
shows satisfactory performance on real-world data sets. In<br />
experiments, LapRLS achieves the highest accuracy on<br />
Diabetes and Vote data sets. Specifically, on the Diabetes<br />
data set, the accuracy obtained with LapRLS is about<br />
1.9 percent higher than that with LSR, while on the Vote<br />
data set it is about 2.8 percent higher than that with LSR.<br />
Fig. 4 illustrates the fact that the change of may<br />
significantly change the recognition accuracy. In experiments,<br />
we fixed k ¼ 30 and ran GRF, LLGC, and LapRLS with<br />
¼ 10 6 d m ; 10 4 d m ; 10 2 d m ;d m ; 10d m , and 10 2 d m , respectively.<br />
Note that when is very near to zero, LapRLS may<br />
generate very low accuracy, as witnessed in the Digital1,<br />
Breast, Diabetes, Ionosphere, and Vote data sets in Fig. 4.<br />
Actually, in LapRLS, a small may lead the weight matrix of<br />
data to be zero. This will generate an ill-conditioned<br />
Laplacian matrix whose elements may become infinite. In<br />
this case, LapRLS (code) outputs zero as the result.<br />
In addition, the experimental results reported in Fig. 4<br />
also show that the classification accuracy obtained with<br />
GRF, LLGC, and LapRLS will decrease when is very large.<br />
Actually, in this case, the weights between neighbors will be<br />
close to one. Thus, the affinities between neighbors are not<br />
well captured.<br />
The parameter stability of and is also tested with<br />
experiments. Here, only LLE-Reg is compared since,<br />
formally, it also has these two parameters. Fig. 5 reports<br />
the results of the nine data sets, with different , by fixing<br />
k ¼ 25 and ¼ 0:0001. The horizontal axis of each subfigure<br />
in Fig. 5 stands for the exponent of . That is, the results are<br />
obtained with ¼ 10 2 ; 10 3 ; 10 4 ; 10 5 , and 10 6 , respectively. As<br />
mentioned previously, the labeled values will be exactly<br />
satisfied when in (1) equals to positive infinity. Accordingly,<br />
we test it with large numbers. Fig. 5 indicates that, in<br />
most experiments, LSR achieves higher accuracy.<br />
6. To avoid confusion, it should be emphasized here that the LLE-Reg<br />
used in [52] actually corresponds to the case of ¼ 0 in (25). In our<br />
experiments, we take the same both in LLE-Reg and LL-Reg. Thus, the<br />
equivalence between LLE-Reg and LL-Reg holds only in the case of >0.
2046 IEEE TRANSACTIONS ON PATTERN ANALYSIS AND MACHINE INTELLIGENCE, VOL. 32, NO. 11, NOVEMBER 2010<br />
Fig. 3. <strong>Classification</strong> results with different parameter k. (a) USPS, (b) Digital1, (c) News20, (d) Breast, (e) Diabetes, (f) Ionosphere, (g) Iris,<br />
(h) Vehicle, and (i) Vote.<br />
Fig. 4. <strong>Classification</strong> results with different parameter . The numbers in the horizontal axis are the indices of the values of . That is, the results are<br />
obtained with ¼ 10 6 d m ; 10 4 d m ; 10 2 d m ;d m ; 10d m , and 10 2 d m . (a) USPS, (b) Digital1, (c) News20, (d) Breast, (e) Diabetes, (f) Ionosphere, (g) Iris,<br />
(h) Vehicle, and (i) Vote.<br />
Fig. 6 reports the experimental results, with different .<br />
In experiments, we fix k to be 25 and to be 10,000. The<br />
horizontal axis of each subfigure in Fig. 6 stands for the<br />
exponent of . That is, the results are obtained with<br />
¼ 10 6 ; 10 5 ; 10 4 ; 10 3 , and 10 2 . Note that the role of <br />
is very different from that of . As mentioned in previous<br />
sections, a smaller indicates that the conditions in (5) will<br />
be better satisfied. Thus, we elect to test with small<br />
numbers. Fig. 6 indicates that, in most experiments, LSR<br />
achieves higher accuracy.<br />
Based on the above analyses on experimental results,<br />
here we summarize the performance of LSR as follows:<br />
First, the performance of LSR is comparable to those of GRF,<br />
LLGC, and LapRLS, although the parameter is tuned to
XIANG ET AL.: SEMI-SUPERVISED CLASSIFICATION VIA LOCAL SPLINE REGRESSION 2047<br />
Fig. 5. <strong>Classification</strong> results with different parameter . The numbers in the horizontal axis are the exponents of . That is, the results are obtained<br />
with ¼ 10 2 ; 10 3 ; 10 4 ; 10 5 , and 10 6 . (a) USPS, (b) Digital1, (c) News20, (d) Breast, (f) Diabetes, (g) Ionosphere, (h) Iris, (i) Vehicle, and (j) Vote.<br />
Fig. 6. <strong>Classification</strong> results with different parameter . The numbers in the horizontal axis are the exponents of . That is, the results are obtained<br />
with ¼ 10 6 ; 10 5 ; 10 4 ; 10 3 , and 10 2 . (a) USPS, (b) Digital1, (c) News20, (d) Breast, (e) Diabetes, (f) Ionosphere, (g) Iris, (h) Vehicle, and (i) Vote.<br />
data. Actually, LSR outperforms GRF, LLGC, and LapRLS<br />
in most data sets. Second, compared with locally linear<br />
methods, LSR employs smooth splines to capture the local<br />
information, which show more adaptability to the scattered<br />
neighboring data points. Finally, the experiment results<br />
illustrate that LSR is stable to the parameters k, , and (see<br />
Figs. 3, 5, and 6). This will facilitate real-world applications.<br />
4.4 Computational Complexity<br />
Now we analyze the computational complexity. RGF,<br />
LLGC, LLE-Reg, LL-Reg, LapRLS, and LSR include the<br />
calculations of identifying the neighbors and solving the<br />
final linear equations. The main differences lie in the ways<br />
of modeling the data.<br />
We want to identify the k nearest neighbors for each data<br />
point in X. The computational complexity is quadratic in<br />
the number of data points, namely, Oðn 2 Þ. Thus, a large part<br />
of the computation time will be taken in this step.<br />
Differently, given the k nearest neighbors and the data<br />
dimensionality m, the main computation in LSR is to<br />
construct matrix M i in (11). The computational complexity<br />
will be up to about Oððk þ d þ 1Þ 3 Þ, due to the calculation of<br />
the inverse matrix of the coefficient matrix in (9). In LLE-Reg,<br />
it will be about Oðnm 3 þ mk 2 Þ, and for LL-Reg, it is about<br />
Oðnm 3 þ mk 2 þ 2k 2 Þ. Thus, our algorithm is slower than the<br />
linear ones, especially when the size of the primitive<br />
polynomials d is very large. However, in implementation,<br />
since usually k is a small number, we can first use principal<br />
component analysis to locally reduce the dimensionality of<br />
the k neighboring data points. In contrast, GRF and LLGC<br />
will take less time to construct M since these two algorithms<br />
construct it directly <strong>via</strong> the similarity between pairs of<br />
neighboring data points. The computational complexity is<br />
about Oðnmk 2 ÞÞ. Besides the same computation as performed<br />
by LLGC, LapRLS has an additional task, namely,<br />
constructing the kernel matrix related to all of the l labeled<br />
data points. Thus, the computation complexity in model<br />
training is about Oðnmk 2 þ lmk 2 Þ. After the model is trained,<br />
LapRLS needs it to predict the n l unlabeled data points,<br />
and the complexity is about Oðlmðn lÞþlðn lÞÞ.<br />
5 APPLICATIONS TO INTERACTIVE IMAGE<br />
SEGMENTATION AND IMAGE MATTING<br />
Segmenting foreground objects from natural images is a<br />
fundamental task in image understanding. But it is a<br />
challenging problem. The difficulties lie in the high complexity<br />
in visual pattern modeling and the intrinsic ambiguity in
2048 IEEE TRANSACTIONS ON PATTERN ANALYSIS AND MACHINE INTELLIGENCE, VOL. 32, NO. 11, NOVEMBER 2010<br />
Fig. 7. Segmentation results of the images from Berkeley image database. The first and the second columns are the source images and the userspecified<br />
strokes about the foreground and background. From the third to the seventh columns are the results obtained by GC, GRF, LLGC, LLE-<br />
Reg, and LSR. The last column lists the ground truth for comparison.<br />
visual pattern grouping. To make the problems solvable, one<br />
method is to construct interactive frameworks, and allow the<br />
user to specify the foreground objects and the background.<br />
In view of machine learning, the user specifications about the<br />
image provide valuable supervised information to learn to<br />
group the visual patterns.<br />
Some interactive segmentation frameworks are developed<br />
[12], [8], [36], [31], among which one popular user-computer<br />
interaction style is to draw zigzag lines on the image to label<br />
the foreground and background regions. Then the task is to<br />
infer the class labels of those unlabeled pixels. Such a task can<br />
be addressed in the way of semi-supervised learning.<br />
5.1 Image Segmentation<br />
In this section, our task is to segment the foreground object<br />
from the background. In the semi-supervised classification<br />
setting, we assign class label “þ1” to each of the userspecified<br />
foreground pixels and “ 1” to each of the userspecified<br />
background pixels. Each pixel p is described as a<br />
three-dimensional vector, i.e., x p ¼½r; g; bŠ T , in which ðr; g; bÞ<br />
is the normalized color of pixel p. For each pixel p, those<br />
pixels in the 3 3 local window with p as the center are<br />
employed as its neighbors. In experiments, we fix to be<br />
10,000 and to be 0.0001. The parameter in GRF and<br />
LLGC is manually set to be 0.1. Here, we do not employ the<br />
median value of the distances between pixels since it may<br />
equal zero (due to the same color of many pixels in an<br />
image). The parameter in LLGC is also set to be 0.99. We<br />
will not conduct experiments with LapRLS since, in our<br />
implementation, we face a problem of “out of memory” in<br />
the Matlab work setting.<br />
For comparisons, the segmentation results with Graph<br />
Cut (GC) are also reported. Here the algorithm in [12] is<br />
implemented. 7 In experiments, the data likelihoods of<br />
R p (“bkg”) and R p (“obj”) in [12] are calculated by (2) in<br />
[31], where the K-means clustering algorithm is used to<br />
cluster, respectively, the user specified foreground and<br />
background pixels. When running the K-means clustering<br />
algorithm, the number of clusters is manually set to be 20.<br />
Fig. 7 illustrates the experimental results of 10 natural<br />
images in the Berkeley image database [32]. In Fig. 7, the<br />
second column shows the user-specified strokes about the<br />
foreground and background. From the third to the seventh<br />
columns are the results obtained by GC, GRF, LLGC, LLE-<br />
Reg, and our LSR. All of these segmentations are obtained<br />
with the same strokes as labeled in the second column. For<br />
comparisons, the last column lists the ground truth obtained<br />
by hand. Fig. 8 illustrates the results of 10 natural images in<br />
the Grabcut database [36]. As can be seen from Figs. 7 and 8,<br />
satisfactory segmentations are obtained with our algorithm.<br />
7. The source codes are downloaded from the author’s homepage and<br />
run here for image segmentation.
XIANG ET AL.: SEMI-SUPERVISED CLASSIFICATION VIA LOCAL SPLINE REGRESSION 2049<br />
Fig. 8. Segmentation results of the images from the Grabcut database. The first and the second columns are the source images and the userspecified<br />
strokes about the foreground and background. From the third to the seventh columns are the results obtained by GC, GRF, LLGC, LLE-<br />
Reg, and LSR. The last column lists the ground truth for comparison.<br />
Table 4 gives a quantitative comparison between the<br />
algorithms. The first column in Table 4 lists the indices of<br />
the images in Figs. 7 and 8. For examples, the first row in<br />
Table 4 corresponds to the first image in Fig. 7 and the<br />
11th row corresponds to the first image in Fig. 8. The<br />
number in Table 4 stands for the classification rate, which is<br />
calculated as the ratio (percent) of the number of correctly<br />
classified pixels to that of the total pixels in the image. Here,<br />
the correctly classified pixels are identified by taking the<br />
ground truth as a reference. As can be seen in Table 4, in<br />
most images our algorithm achieves higher accuracy.<br />
5.2 Image Matting<br />
The task in image segmentations is to assign each pixel to<br />
either the foreground or the background. Another task in<br />
image editing is the so-called image matting. In this work<br />
setting, an input image is assumed to be a composite of a<br />
foreground image and a background image. The task is to<br />
infer the foreground opacity from the image. In this way,<br />
we hope to generate soft edges between the background<br />
and the foreground objects.<br />
Some image matting algorithms have been developed.<br />
Typical algorithms include Poisson matting [40], random<br />
walks [22], iterative matting <strong>via</strong> Belief Propagation (BP)<br />
[48], Matting Laplacian (ML) [29], and the unsupervised<br />
spectral matting [30]. Here, we extend our algorithm for<br />
image matting. To this end, we no longer assign “ 1” to<br />
each of the user specified background pixels, but assign “0”<br />
to each of them. We also assign “þ1” to each of the userspecified<br />
foreground pixels. In this way, we hope to obtain<br />
a soft label to each pixel which is limited in ½0; 1Š. Finally,<br />
after the linear equations in (17) are solved, f is directly<br />
treated as the foreground opacity. That is, Step 2(c) of the<br />
algorithm in Table 2 will not be performed.<br />
We compared our algorithm with BP, ML, and LLE-Reg. 8<br />
To compare them with Poisson matting and random walks,<br />
one can refer to [29]. In addition, we will not report the<br />
results with GRF and LLGC as none of them generates<br />
8. We downloaded the software of BP and the codes of ML from the<br />
authors’ homepages. When running the software of BP, the user specified<br />
strokes about the foreground and background are supplied <strong>via</strong> the humancomputer<br />
interface with mouse, according to those used in ML, LLE-Reg,<br />
and LSR (see Figs. 9, 10, 11).
2050 IEEE TRANSACTIONS ON PATTERN ANALYSIS AND MACHINE INTELLIGENCE, VOL. 32, NO. 11, NOVEMBER 2010<br />
TABLE 4<br />
The <strong>Classification</strong> Rate (Percent) of the 20 Images in<br />
Figs. 7 and 8, Ordered with Indices in the First Column<br />
The first 10 rows correspond to the images in Fig. 7, and the last 10 rows<br />
correspond to the images in Fig. 8.<br />
correct results in our implementation. The same parameters<br />
used in Figs. 7 and 8 are employed here in experiments.<br />
Figs. 9, 10, and 11 report the experimental results (due to<br />
different sizes of images, here we report the results in three<br />
figures). The images are taken from [48]. In each panel in<br />
Figs. 9, 10, and 11, the first is the source image and the<br />
second is the user specified strokes about the foreground<br />
Fig. 10. Matting results (Group II). In each panel, the first and the second<br />
columns are the source image and the user-specified strokes about the<br />
foreground and background. From the third to the sixth columns are the<br />
results obtained by BP, ML LLE-Reg, and LSR.<br />
and background. From the third to the last are the results<br />
obtained by BP, ML, LLE-Reg, and our algorithm. As can be<br />
seen, satisfactory results are obtained with our algorithm.<br />
Note that BP also generates satisfactory results. In contrast,<br />
our algorithm explores more details of the foreground<br />
objects, as witnessed from the hair of the girls in Fig. 9 and<br />
Fig. 9. Matting results (Group I). In each panel, the first and the second<br />
columns are the source image and the user-specified strokes about the<br />
foreground and background. From the third to the sixth columns are the<br />
results obtained by BP, ML, LLE-Reg, and LSR.<br />
Fig. 11. Matting results (Group III). In each panel, the first and the<br />
second columns are the source image and the user-specified strokes<br />
about the foreground and background. From the third to the sixth<br />
columns are the results obtained by BP, ML, LLE-Reg, and LSR.
XIANG ET AL.: SEMI-SUPERVISED CLASSIFICATION VIA LOCAL SPLINE REGRESSION 2051<br />
the feathers of the peacock in Fig. 10. ML is a famous image<br />
matting approach. Experimental results show that the<br />
performance of our algorithm is comparable to that of<br />
ML. For example, in the third girl image in Fig. 9 and in the<br />
first image in Fig. 10, some of the pixels in the rectangle<br />
regions are over highly assigned as the foreground. This is<br />
attenuated to some degree in our algorithm.<br />
Finally, as a summary of this section, we point out that<br />
GRF, LLGC, LLE-Reg, and LSR are all developed to solve<br />
the problem of semi-supervised classification as formulated<br />
in (1). In contrast, they use different models to exploit the<br />
relations between neighboring data points. Specifically,<br />
both GRF and LLGC are developed <strong>via</strong> conventional graph<br />
construction, while LLE-Reg and LSR are developed <strong>via</strong><br />
local label inference. Furthermore, LLE-Reg is locally linear,<br />
and LSR is locally nonlinear. Comparative experiments<br />
show that LSR achieves better segmentations in most<br />
images (see Figs. 7, 8, 9, 10, and 11). This indicates that, in<br />
LSR, it is the proposed graph construction in itself that is<br />
superior to the conventional graph construction.<br />
Although our algorithm can generate satisfactory results,<br />
it needs more time to finish the calculation. For example, for<br />
images with 320 214 pixels, our algorithm takes about<br />
250 seconds on a PC with 2.4 Ghz CPU and 1 GB RAM,<br />
using Matlab 7.0, while GRF, LLGC, and LLE-Reg need<br />
about 200, 62, and 70 seconds, respectively. In contrast, ML<br />
takes about 163 seconds, while BP only needs about several<br />
seconds. One future work is to develop a fast version of our<br />
algorithm for image segmentation and image matting.<br />
6 CONCLUSION<br />
In this work, we have developed the semi-supervised<br />
classification algorithm with local spline regression. <strong>Spline</strong>s<br />
developed in Sobolev space are used to model each of the<br />
neighborhoods. Finally, we analyze the regularized loss on<br />
each neighborhood and formulate it in terms of class label<br />
vector of the neighboring data points. The losses on all of the<br />
neighborhoods are finally accumulated together. We addressed<br />
our algorithm into the Laplacian regularization<br />
framework, from which a globally optimal classification is<br />
obtained. Comparative classification experiments on many<br />
public data sets and applications to interactive natural image<br />
segmentation and image matting show the validity of our<br />
algorithm. In the future, we would like to research how to<br />
speed up the computation of our algorithm, especially when<br />
it is applied to image segmentation and image matting.<br />
APPENDIX A<br />
EQUIVALENCE BETWEEN LLE-REG AND LL-REG<br />
LL-Reg and LLE-Reg are initially developed with different<br />
motivations and formulations. Specifically, LL-Reg is<br />
developed on locally linear transformations, while LLE-<br />
Reg is developed on locally linear reconstructions. Here, we<br />
illustrate the fact that they are mathematically equivalent to<br />
each other.<br />
Suppose we are given x i and its k neighboring data<br />
points fx i g k i¼1 , including x i itself, with x i ¼ x i1 . In LLE-Reg,<br />
x i is linearly reconstructed with its k 1 neighbors, namely,<br />
x i Xk<br />
j¼2<br />
w j x ij ;<br />
ð21Þ<br />
where w j , j ¼ 2; 3; ...;k, are reconstruction weights and<br />
P k<br />
j¼2 w j ¼ 1. After the optimal weights are evaluated, the<br />
class label f i of x i is then predicted as<br />
f i ¼ Xk<br />
j¼2<br />
w j f ij :<br />
ð22Þ<br />
In LL-Reg, a linear transformation is introduced to<br />
directly map the data point to be a class label:<br />
f ¼ u T ðx x i Þþb; ð23Þ<br />
where u 2 IR m is a project vector and b 2 IR is a bias. Under<br />
the regularized least squares framework, the optimal u and<br />
b can be evaluated with k 1 data pairs fðx ij ;f ij Þg k j¼2 . Now<br />
it can be easily justified that if (23) is used to map x i , then<br />
f i ¼ b:<br />
ð24Þ<br />
To illustrate the equivalence between LLE-Reg and LL-<br />
Reg, we first give two lemmas. For the optimal weights in<br />
(21), we have the following lemma:<br />
Lemma 1. Let X ¼½x i2 x i ; ...; x ik x i Š2IR mðk 1Þ , w ¼<br />
½w 2 ;w 3 ; ...;w k Š T 2 IR k 1 , and e ¼½1; 1; ...; 1Š T 2 IR k 1 .<br />
Then [37],<br />
w ¼<br />
ðXT XÞ 1 e<br />
e T ðX T XÞ 1 e :<br />
Proof. Based on (21), it can be easily justified that the sum of<br />
squared distances from x i to its k 1 neighbors equals<br />
w T ðX T XÞw. Using the Lagrange multiplier method and<br />
considering the equality constraint P k<br />
j¼2 w j ¼ 1, we have<br />
the following Lagrange function:<br />
LðwÞ ¼ 1 2 wT ðX T XÞw ðw T e 1Þ;<br />
where is the Lagrange multiplier.<br />
Differentiating the objective function with respect to w<br />
and setting the derivative to be zero, we can obtain w ¼<br />
ðX T XÞ 1 e. Then, w T e ¼ 1 )ððX T XÞ 1 eÞ T e ¼ 1 )<br />
1<br />
¼ . Thus, w ¼ ðXT XÞ 1 e<br />
.<br />
tu<br />
e T ðX T XÞ 1 e e T ðX T XÞ 1 e<br />
In computation, X T X may be singular. To avoid<br />
singularity, a regularization term I 2 IR ðk 1Þðk 1Þ can be<br />
added to it. Then we have [37]<br />
w ¼<br />
ðI þ XT XÞ 1 e<br />
e T ðI þ X T XÞ 1 e :<br />
ð25Þ<br />
Now we consider LL-Reg [52]. We have the following<br />
lemma:<br />
Lemma 2. Let the bias b in (23) be the linear combination of the<br />
class labels, namely, b ¼ T f, then [52]<br />
T ¼ eT e T X T XðI þ X T XÞ 1<br />
ðk 1Þ e T X T XðI þ X T XÞ 1 e : ð26Þ<br />
Proof. Consider the following objective function [52]:<br />
Gðu;bÞ¼u T u þðX T u þ be fÞ T ðX T u þ be fÞ;
2052 IEEE TRANSACTIONS ON PATTERN ANALYSIS AND MACHINE INTELLIGENCE, VOL. 32, NO. 11, NOVEMBER 2010<br />
where f ¼½f i2 ; ...;f ik Š T 2 IR k 1 collects the class labels<br />
of the k 1 neighbors. Taking @Gðw;bÞ=@w ¼ 0 and<br />
after performing simple algebra operations, we can<br />
obtain u ¼ ðI þ XX T Þ 1 Xðf beÞ. Similarly, letting<br />
@Gðw;bÞ=@b ¼ 0, we can get b ¼ 1<br />
k 1 ðeT f e T X T uÞ.<br />
Substituting u to b, it follows that<br />
b ¼ eT e T X T ðI þ XX T Þ 1 X<br />
ðk 1Þ e T X T ðI þ XX T Þ 1 f: ð27Þ<br />
Xe<br />
Noting that X T ðI þ XX T Þ 1 X ¼ X T XðI þ X T XÞ 1 ,<br />
then (26) holds naturally.<br />
tu<br />
Theorem 4. It holds that ¼ w.<br />
Proof. Noting that e T e ¼ k 1, then it follows that<br />
T ¼ eT e T X T XðI þ X T XÞ 1<br />
ðk 1Þ e T X T XðI þ X T XÞ 1 e<br />
¼ eT ðI þ X T XÞðI þ X T XÞ 1 e T X T XðI þ X T XÞ 1<br />
e T e e T X T XðI þ X T XÞ 1 e<br />
¼ eT ðI þ X T XÞðI þ X T XÞ 1 e T X T XðI þ X T XÞ 1<br />
e T ðI þ X T XÞðI þ X T XÞ 1 e e T X T XðIþX T XÞ 1 e<br />
¼ eT ðI þ X T X X T XÞðI þ X T XÞ 1<br />
e T ðI þ X T X X T XÞðI þ X T XÞ 1 e<br />
¼ eT ðI þ X T XÞ 1<br />
e T ðI þ X T XÞ 1 e :<br />
Note that I þ X T X is symmetrical. Thus, its inverse<br />
matrix is also symmetrical. Based on (26), ¼ w holds<br />
naturally.<br />
tu<br />
This theorem indicates that in LL-Reg exactly equals w<br />
in LLE-Reg. As a result, in each neighborhood we can get<br />
the same errors about the class labels with LLE-Reg and LL-<br />
Reg. Then we can obtain the same global error if the errors<br />
evaluated in local neighborhoods are accumulated together.<br />
In terms of matrices, this global error can be formally<br />
formulated as f T Mf. In this way, a matrix M is constructed<br />
which is finally used to replace the matrix M in Problem (1).<br />
This explains why the same results with LLE-Reg and LL-<br />
Reg are obtained in the experiments.<br />
Finally, it should be emphasized that only in the case of<br />
“ >0” and given the same and k can we say LLE-Reg and<br />
LL-Reg are equivalent to each other. To avoid confusion, here<br />
we point out that the LLE-Reg used in [52] actually<br />
corresponds to the case of “ ¼ 0.” That is, no regularization<br />
term is employed when developing the original LLE-Reg in<br />
[52]. Thus, the experimental setting for LLE-Reg in [52]<br />
differs from that we used in this work.<br />
ACKNOWLEDGMENTS<br />
This work is supported by the Projects (Grant No. 60975037<br />
and 60721003) of the National Natural Science Foundation<br />
of China.<br />
REFERENCES<br />
[1] R.A. Adams, Sobolev Spaces. Academic Press, 1975.<br />
[2] R.K. Ando and T. Zhang, “Two-View Feature Generation Model<br />
for <strong>Semi</strong>supervised Learning,” Proc. Int’l Conf. Machine Learning,<br />
pp. 25-32, 2007.<br />
[3] M.F. Balcan, A. Blum, and K. Yang, “Co-Training and Expansion:<br />
Towards Bridging Theory and Practice,” Proc. Advances in Neural<br />
Information Processing Systems, pp. 89-96, 2004.<br />
[4] M. Belkin, I. Matveeva, and P. Niyogi, “Regularization and <strong>Semi</strong>-<br />
<strong>Supervised</strong> Learning on Large Graphs,” Proc. Int’l Conf. Learning<br />
Theory, pp. 624-638, 2004.<br />
[5] M. Belkin and P. Niyogi, “Laplacian Eigenmaps and Spectral<br />
Techniques for Embedding and Clustering,” Advances in Neural<br />
Information Processing Systems 14, pp. 585-591, MIT Press, 2002.<br />
[6] M. Belkin, P. Niyogi, and V. Sindhwani, “Manifold Regularization:<br />
A Geometric Framework for Learning from Labeled<br />
and Unlabeled Examples,” J. Machine Learning Research, vol. 7,<br />
pp. 2399-2434, 2006.<br />
[7] M. Belkin and P. Niyogi, “Laplacian Eigenmaps for Dimensionality<br />
Reduction and Data Representation,” Neural Computation.,<br />
vol. 15, no. 6, pp. 1373-1396, 2003.<br />
[8] A. Blake, C. Rother, M. Brown, P. Perez, and P. Torr, “Interactive<br />
Image Segmentation Using an Adaptive GMMRF Model,” Proc.<br />
European Conf. Computer Vision, pp. 428-441, 2004.<br />
[9] A. Blum and S. Chawla, “Learning from Labeled and Unlabeled<br />
Data Using Graph Mincuts,” Proc. Int’l Conf. Machine Learning,<br />
pp. 19-26, 2001.<br />
[10] A. Blum and T. Mitchell, “Combining Labeled and Unlabeled<br />
Data with Co-Training,” Proc. Ann. Conf. Computational Learning<br />
Theory, pp. 92-100, 1998.<br />
[11] F. Bookstein, “Principal Warps: Thin-Plate <strong>Spline</strong>s and the<br />
Decomposition of Deformations,” IEEE Trans. Pattern Analysis<br />
and Machine Learning, vol. 11, no. 6, pp. 567-585, June 1989.<br />
[12] Y.Y. Boykov and M.P. Jolly, “Interactive Graph Cuts for Optimal<br />
Boundary & Region Segmentation of Objects in n-d Images,” Proc.<br />
IEEE Int’l Conf. Computer Vision, pp. 105-112, 2001.<br />
[13] O. Chapelle, B. Schölkopf, and A. Zien, <strong>Semi</strong>-<strong>Supervised</strong> Learning.<br />
MIT Press, 2006.<br />
[14] N.V. Chawla and G. Karakoulas, “Learning from Labeled and<br />
Unlabeled Data: An Empirical Study across Techniques and<br />
Domains,” J. Artificial Intelligence Research, vol. 23, pp. 331-366,<br />
2005.<br />
[15] F.G. Cozman, I. Cohen, and M.C. Cirelo, “<strong>Semi</strong>-<strong>Supervised</strong><br />
Learning of Mixture Models,” Proc. Int’l Conf. Machine Learning,<br />
pp. 99-106, 2003.<br />
[16] S. Dasgupta, M.L. Littman, and D. McAllester, “Pac Generalization<br />
Bounds for Co-Training,” Advances in Neural Information<br />
Processing Systems 14, MIT Press, 2001.<br />
[17] J. Duchon, “<strong>Spline</strong>s Minimizing Rotation-Invariant <strong>Semi</strong>-Norms in<br />
Sobolev Spaces,” Constructive Theory of Functions of Several<br />
Variables, A. Dold and B. Eckmann, eds., pp. 85-100, Springer-<br />
Verlag, 1977.<br />
[18] A. Fujino, N. Ueda, and K. Saito, “A Hybrid Generative/<br />
Discriminative Approach <strong>Semi</strong>-<strong>Supervised</strong> Classifier Design,”<br />
Proc. Conf. Artificial Intelligence, pp. 764-769, 2005.<br />
[19] G. Getz, N. Shental, and E. Domany, “<strong>Semi</strong>-<strong>Supervised</strong><br />
Learning—A Statistical Physics Approach,” Proc. ICML Workshop<br />
Learning with Partially Classified Training Data, 2005.<br />
[20] S. Goldman and Y. Zhou, “Enhancing <strong>Supervised</strong> Learning with<br />
Unlabeled Data,” Proc. Int’l Conf. Machine Learning, pp. 327-334,<br />
2000.<br />
[21] G.H. Golub and C.F. van Loan, Matrix Computations, third ed. The<br />
Johns Hopkins Univ. Press, 1996.<br />
[22] L. Grady, T. Schiwietz, S. Aharon, and R. Westermann, “Random<br />
Walks for Interactive Alpha-Matting,” Proc. Fifth IASTED Int’l<br />
Conf. Visualization, Imaging and Image Processing, pp. 423-429, 2005.<br />
[23] X. He and P. Niyogi, “<strong>Local</strong>ity Preserving Projections,” Proc. Ann.<br />
Conf. Neural Information Processing Systems, 2003.<br />
[24] T. Joachims, “Transductive Learning <strong>via</strong> Spectral Graph<br />
Partitioning,” Proc. Int’l Conf. Machine Learning, pp. 290-297,<br />
2003.<br />
[25] T. Joachims, “Transductive Inference for Text <strong>Classification</strong><br />
Using Support Vector Machines,” Proc. Int’l Conf. Machine<br />
Learning, pp. 200-209, 1999.<br />
[26] I.T. Jolliffe, Principal Component Analysis, second ed. Springer,<br />
2002.<br />
[27] R. Jones, “Learning to Extract Entities from Labeled and<br />
Unlabeled Text,” Technical Report CMU-LTI-05-191, Carnegie<br />
Mellon Univ., 2005.<br />
[28] N.D. Lawrence and M.I. Jordan, “<strong>Semi</strong>-<strong>Supervised</strong> Learning <strong>via</strong><br />
Gaussian Processes,” Advances in Neural Information Processing<br />
Systems 14, pp. 753-760, MIT Press, 2004.
XIANG ET AL.: SEMI-SUPERVISED CLASSIFICATION VIA LOCAL SPLINE REGRESSION 2053<br />
[29] A. Levin, D. Lischinski, and Y. Weiss, “A Closed-Form Solution to<br />
Natural Image Matting,” IEEE Trans. Pattern Analysis and Machine<br />
Intelligence, vol. 30, no. 2, pp. 228-242, Feb. 2008.<br />
[30] A. Levin, A. Rav-Acha, and D. Lischinski, “Spectral Matting,”<br />
Proc. Int’l Conf. Computer Vision and Pattern Recognition, pp. 1-8,<br />
2007.<br />
[31] Y. Li, J. Sun, C. Tang, and H. Shum, “Lazy Snapping,” Proc. ACM<br />
SIGGRAPH, pp. 303-308, 2004.<br />
[32] D.R. Martin, C. Fowlkes, D. Tal, and J. Malik, “A Database of<br />
Human Segmented Natural Images and Its Application to<br />
Evaluating Segmentation Algorithms and Measuring Ecological<br />
Statistics,” Proc. IEEE Int’l Conf. Computer Vision, pp. 416-425, 2001.<br />
[33] D.J. Miller and H.S. Uyar, “A Mixture of Experts Classifier with<br />
Learning Based on Both Labelled and Unlabelled Data,” Advances<br />
in Neural Information Processing Systems 9, pp. 571-577, MIT Press,<br />
1996.<br />
[34] K. Nigam and R. Ghani, “Analyzing the Effectiveness and<br />
Applicability of Co-Training,” Proc. Int’l Conf. Information and<br />
Knowledge Management, pp. 86-93, 2000.<br />
[35] K. Nigam, A.K. McCallum, S. Thrun, and T.M. Mitchell, “Text<br />
<strong>Classification</strong> from Labeled and Unlabeled Documents Using<br />
EM,” Machine Learning, vol. 39, nos. 2/3, pp. 103-134, 2000.<br />
[36] C. Rother, V. Kolmogorov, and A. Blake, “Grabcut—Interactive<br />
Foreground Extraction Using Iterated Graph Cuts,” Proc. ACM<br />
SIGGRAPH, pp. 309-314, 2004.<br />
[37] L.K. Saul and S.T. Roweis, “Thinking Globally, Fit <strong>Local</strong>ly:<br />
Unsupervised Learning of Low Dimensional Manifolds,”<br />
J. Machine Learning Research, vol. 4, pp. 119-155, 2003.<br />
[38] B. Shahshahani and D. Landgrebe, “The Effect of Unlabeled<br />
Samples in Reducing the Small Sample Size Problem and<br />
Mitigating the Hughes Phenomenon,” IEEE Trans. Geoscience and<br />
Remote Sensing, vol. 32, no. 5, pp. 1087-1095, Sept. 1994.<br />
[39] J.B. Shi and J. Malik, “Normalized Cuts and Image Segmentation,”<br />
IEEE Trans. Pattern Analysis and Machine Intelligence, vol. 22, no. 8,<br />
pp. 888-905, Aug. 2000.<br />
[40] J. Sun, J. Jia, C.K. Tang, and H.-Y. Shum, “Poisson Matting,” ACM<br />
Trans. Graphics, vol. 23, no. 3, pp. 315-321, 2004.<br />
[41] M. Szummer and T. Jaakkola, “Partially Labeled <strong>Classification</strong><br />
with Markov Random Walks,” Advances in Neural Information<br />
Processing Systems 14, pp. 945-952, MIT Press, 2001.<br />
[42] G. Wahba, <strong>Spline</strong> Models for Observational Data. SIAM Press, 1990.<br />
[43] C. Walder and O. Chapelle, “Learning with Transformation<br />
Invariant Kernels,” Advances in Neural Information Processing<br />
Systems, pp. 1561-1568, MIT Press, 2007.<br />
[44] F. Wang, S.J. Wang, C.S. Zhang, and O. Winther, “<strong>Semi</strong>-<br />
<strong>Supervised</strong> Mean Fields,” Proc. Int’l Conf. Artificial Intelligence<br />
and Statistics, pp. 596-603, 2007.<br />
[45] F. Wang, T. Li, G. Wang, and C. Zhang, “<strong>Semi</strong>-<strong>Supervised</strong><br />
<strong>Classification</strong> Using <strong>Local</strong> and Global Regularization,” Proc. 23rd<br />
AAAI Conf. Artificial Intelligence, pp. 726-731, 2008.<br />
[46] F. Wang and C. Zhang, “Label Propagation through Linear<br />
Neighborhoods,” IEEE Trans. Knowledge and Data Eng., vol. 20,<br />
no. 1, pp. 55-67, Jan. 2008.<br />
[47] F. Wang and C. Zhang, “On Discriminative <strong>Semi</strong>-<strong>Supervised</strong><br />
<strong>Classification</strong>,” Proc. The 23rd AAAI Conf. Artificial Intelligence,<br />
pp. 720-725, 2008.<br />
[48] J. Wang and M.F. Cohen, “An Iterative Optimization Approach<br />
for Unified Image Segmentation and Matting,” Proc. Int’l Conf.<br />
Computer Vision, pp. 936-943, 2005.<br />
[49] H. Wendland, Scattered Data Approximation. Cambridge Univ.<br />
Press, 2005.<br />
[50] M. Wu, K. Yu, S. Yu, and B. Schölkopf, “<strong>Local</strong> Learning<br />
Projections,” Proc. Int’l Conf. Machine Learning, pp. 1039-1046, 2007.<br />
[51] M.R. Wu and B. Schölkopf, “A <strong>Local</strong> Learning Approach for<br />
Clustering,” Advances in Neural Information Processing Systems 19,<br />
pp. 1529-1536, MIT Press, 2007.<br />
[52] M.R. Wu and B. Schölkopf, “Transductive <strong>Classification</strong> <strong>via</strong> <strong>Local</strong><br />
Learning Regularization,” Proc. Int’l Conf. Artificial Intelligence and<br />
Statistics, pp. 628-635, 2007.<br />
[53] S.M. Xiang, F.P. Nie, C.S. Zhang, and C.X. Zhang, “<strong>Spline</strong><br />
Embedding for Nonlinear Dimensionality Reduction,” Proc.<br />
European Conf. Machine Learning, pp. 825-832, 2006.<br />
[54] J. Yoon, “Spectral Approximation Orders of Radial Basis<br />
Function Interpolation on the Sobolev Space,” SIAM J. Math.<br />
Analysis, vol. 33, no. 4, pp. 946-958, 2001.<br />
[55] Z. Zhang and H. Zha, “Principal Manifolds and Nonlinear<br />
Dimensionality Reduction <strong>via</strong> Tangent Space Alignment,” SIAM<br />
J. Scientific Computing, vol. 26, no. 1, pp. 313-338, 2004.<br />
[56] D. Zhou, O. Bousquet, T. Lal, J. Weston, and B. Schölkopf,<br />
“Learning with <strong>Local</strong> and Global Consistency,” Advances in Neural<br />
Information Processing Systems 16, pp. 321-328, MIT Press, 2003.<br />
[57] Z.H. Zhou and M. Li, “Tri-Training: Exploiting Unlabeled Data<br />
Using Three Classifiers,” IEEE Trans. Knowledge and Data Eng.,<br />
vol. 17, no. 11, pp. 1529-1541, Nov. 2005.<br />
[58] Z.H. Zhou, D.C. Zhan, and Q. Yang, “<strong>Semi</strong>-<strong>Supervised</strong> Learning<br />
with Very Few Labeled Training Examples,” Proc. Conf. Artificial<br />
Intelligence, pp. 675-680, 2007.<br />
[59] X.J. Zhu, Z. Ghahramani, and J. Lafferty, “<strong>Semi</strong>-<strong>Supervised</strong><br />
Learning Using Gaussian Fields and Harmonic Functions,” Proc.<br />
Int’l Conf. Machine Learning, pp. 912-919, 2003.<br />
[60] X.J. Zhu, “<strong>Semi</strong>-<strong>Supervised</strong> Learning Literature Survey,” Technical<br />
Report Computer Sciences TR 1530, Univ. of Wisconsin-<br />
Madison, 2007.<br />
Shiming Xiang received the BS degree in<br />
mathematics from Chongqing Normal University,<br />
China, in 1993, the MS degree from<br />
Chongqing University, China, in 1996, and the<br />
PhD degree from the Institute of Computing<br />
Technology, Chinese Academy of Sciences,<br />
China, in 2004. From 1996 to 2001, he was a<br />
lecturer with the Huazhong University of Science<br />
and Technology, Wuhan, China. He was a<br />
postdoctoral researcher with the Department of<br />
Automation, Tsinghua University, Beijing, China, until 2006. He is<br />
currently an an associate professor with the Institute of Automation,<br />
Chinese Academy of Sciences. His research interests include pattern<br />
recognition and machine learning.<br />
Feiping Nie received the BS degree in computer<br />
science from the North China University of<br />
Water Conservancy and Electric Power in 2000,<br />
the MS degree from Lanzhou University, China,<br />
in 2003, and the PhD degree from the Department<br />
of Automation, Tsinghua University, China,<br />
in 2009. His research interests include machine<br />
learning and its applications.<br />
Changshui Zhang received the BS degree in<br />
mathematics from Peking University, Beijing,<br />
China, in 1986, and the PhD degree from<br />
Tsinghua University, Beijing, in 1992. In 1992,<br />
he joined the Department of Automation at<br />
Tsinghua University, where he is currently a<br />
professor. His research interests include pattern<br />
recognition, machine learning, etc. He has<br />
authored more than 200 papers. He currently<br />
serves on the editorial board of Pattern Recognition.<br />
He is a member of the IEEE.<br />
. For more information on this or any other computing topic,<br />
please visit our Digital Library at www.computer.org/publications/dlib.