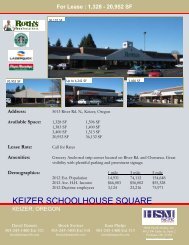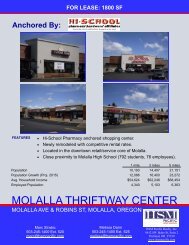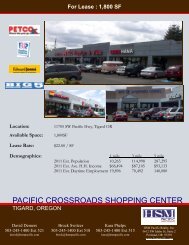
Keizer Station FCn.pub - HSM Pacific
Keizer Station FCn.pub - HSM Pacific
Keizer Station FCn.pub - HSM Pacific

Create successful ePaper yourself
Turn your PDF publications into a flip-book with our unique Google optimized e-Paper software.
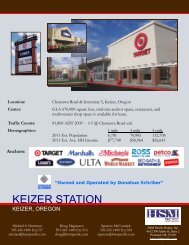
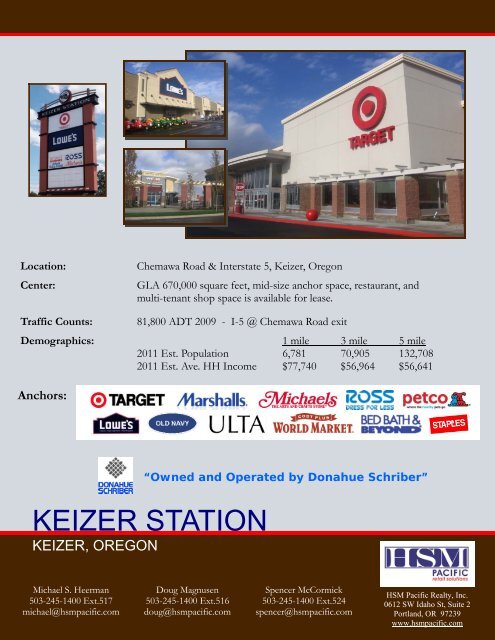
Location:<br />
Center:<br />
Chemawa Road & Interstate 5, <strong>Keizer</strong>, Oregon<br />
GLA 670,000 square feet, mid-size anchor space, restaurant, and<br />
multi-tenant shop space is available for lease.<br />
Traffic Counts:<br />
81,800 ADT 2009 - I-5 @ Chemawa Road exit<br />
Demographics: 1 mile 3 mile 5 mile<br />
2011 Est. Population 6,781 70,905 132,708<br />
2011 Est. Ave. HH Income $77,740 $56,964 $56,641<br />
Anchors:<br />
“Owned and Operated by Donahue Schriber”<br />
KEIZER STATION<br />
KEIZER, OREGON<br />
Michael S. Heerman<br />
503-245-1400 Ext.517<br />
michael@hsmpacific.com<br />
Doug Magnusen<br />
503-245-1400 Ext.516<br />
doug@hsmpacific.com<br />
Spencer McCormick<br />
503-245-1400 Ext.524<br />
spencer@hsmpacific.com<br />
The information contained herein was obtained from sources we deem reliable, however we do not guarantee its accuracy.<br />
<strong>HSM</strong> <strong>Pacific</strong> Realty, Inc.<br />
0612 SW Idaho St, Suite 2<br />
Portland, OR 97239<br />
www.hsmpacific.com
N<br />
SALEM / KEIZER, OREGON<br />
Retail Aerial
‐ 5,000 S.F.
<strong>Keizer</strong> <strong>Station</strong><br />
Trade Area Map
FULL PROFILE<br />
2000 - 2010 Census, 2011 Estimates with 2016 Projections<br />
Calculated using Proportional Block Groups<br />
Lat/Lon: 45.0054/-122.9967<br />
Chemawa Road & Interstate 5<br />
<strong>Keizer</strong>, OR<br />
1 Mile 3 Miles 5 Miles<br />
AGE<br />
HOUSEHOLDS POPULATION<br />
MARITAL STATUS<br />
INCOME<br />
& SEX<br />
2011 Estimated Population 6,781 70,905 132,708<br />
2016 Projected Population 6,900 73,096 136,803<br />
2010 Census Population 6,753 70,533 131,885<br />
2000 Census Population 6,362 62,953 118,389<br />
Historical Annual Growth 2000 to 2011 0.6% 1.1% 1.1%<br />
Projected Annual Growth 2011 to 2016 0.3% 0.6% 0.6%<br />
2011 Est. Households 2,408 25,392 47,835<br />
2016 Proj. Households 2,459 26,214 50,055<br />
2010 Census Households 2,401 25,378 47,352<br />
2000 Census Households 2,292 22,921 43,181<br />
Historical Annual Growth 2000 to 2011 0.2% 0.5% 0.5%<br />
Projected Annual Growth 2011 to 2016 0.4% 0.6% 0.9%<br />
2011 Est. Population 0 to 9 Years 16.0% 15.3% 15.0%<br />
2011 Est. Population 10 to 19 Years 14.7% 14.1% 14.1%<br />
2011 Est. Population 20 to 29 Years 13.8% 13.8% 13.8%<br />
2011 Est. Population 30 to 44 Years 18.6% 19.2% 18.7%<br />
2011 Est. Population 45 to 59 Years 18.7% 20.1% 20.2%<br />
2011 Est. Population 60 to 74 Years 12.0% 11.7% 12.0%<br />
2011 Est. Population 75 Years Plus 6.1% 5.9% 6.2%<br />
2011 Est. Median Age 33.4 34.2 34.6<br />
2011 Est. Male Population 52.7% 49.9% 50.6%<br />
2011 Est. Female Population 47.3% 50.1% 49.5%<br />
2011 Est. Never Married 23.1% 24.8% 26.0%<br />
2011 Est. Now Married 59.5% 52.2% 49.1%<br />
2011 Est. Separated or Divorced 12.8% 17.3% 18.4%<br />
2011 Est. Widowed 4.6% 5.8% 6.4%<br />
2011 Est. HH Income $200,000 or More 3.9% 1.8% 2.0%<br />
2011 Est. HH Income $150,000 to $199,999 3.2% 2.4% 2.2%<br />
2011 Est. HH Income $100,000 to $149,999 13.0% 9.0% 9.0%<br />
2011 Est. HH Income $75,000 to $99,999 20.1% 13.1% 11.8%<br />
2011 Est. HH Income $50,000 to $74,999 20.2% 18.8% 18.6%<br />
2011 Est. HH Income $35,000 to $49,999 14.1% 15.0% 15.5%<br />
2011 Est. HH Income $25,000 to $34,999 9.9% 12.8% 13.4%<br />
2011 Est. HH Income $15,000 to $24,999 8.9% 13.5% 13.6%<br />
2011 Est. HH Income $0 to $14,999 6.7% 13.7% 14.0%<br />
2011 Est. Average Household Income $77,740 $56,964 $56,641<br />
2011 Est. Median HH Income $58,833 $46,718 $45,751<br />
2011 Est. Per Capita Income $27,857 $20,741 $21,136<br />
This report was produced using data from private and government sources deemed to be reliable. The information herein is provided without representation or warranty.<br />
2011 Est. Number of Businesses 179 1,881 4,777<br />
2011 Est. Total Number of Employees 2,083 22,449 59,680<br />
©2012, Sites USA, Chandler, Arizona, 480-491-1112 page 1 of 3 Demographic Source: Applied Geographic Solutions 8/2011, TIGER Geography
FULL PROFILE<br />
2000 - 2010 Census, 2011 Estimates with 2016 Projections<br />
Calculated using Proportional Block Groups<br />
Lat/Lon: 45.0054/-122.9967<br />
Chemawa Road & Interstate 5<br />
<strong>Keizer</strong>, OR<br />
1 Mile 3 Miles 5 Miles<br />
HISPANIC RACE<br />
EDUCATION<br />
(Adults 25 or Older)<br />
HOME VALUES<br />
HOMES BUILT BY YEAR HOUSING<br />
2011 Est. White Population 81.8% 73.8% 74.2%<br />
2011 Est. Black Population 0.7% 1.0% 1.2%<br />
2011 Est. Asian & <strong>Pacific</strong> Islander 2.4% 3.3% 3.5%<br />
2011 Est. American Indian & Alaska Native 1.1% 1.5% 1.6%<br />
2011 Est. Other Races Population 14.0% 20.4% 19.5%<br />
2011 Est. Hispanic Population 1,367 21,981 39,559<br />
2011 Est. Hispanic Population Percent 20.2% 31.0% 29.8%<br />
2016 Proj. Hispanic Population Percent 24.4% 35.5% 34.1%<br />
2010 Hispanic Population Percent 19.2% 29.4% 28.6%<br />
2011 Est. Adult Population (25 Years or Older) 4,219 45,346 85,004<br />
2011 Est. Elementary (0 to 8) 4.8% 8.4% 8.6%<br />
2011 Est. Some High School (9 to 11) 10.2% 9.8% 9.7%<br />
2011 Est. High School Graduate (12) 22.0% 25.2% 26.7%<br />
2011 Est. Some College (13 to 16) 27.2% 26.6% 25.6%<br />
2011 Est. Associate Degree Only 7.0% 11.2% 10.3%<br />
2011 Est. Bachelor Degree Only 20.8% 12.7% 12.8%<br />
2011 Est. Graduate Degree 8.0% 6.1% 6.2%<br />
2011 Est. Total Housing Units 2,516 26,801 50,868<br />
2011 Est. Owner Occupied Percent 70.3% 51.7% 52.2%<br />
2011 Est. Renter Occupied Percent 25.4% 43.0% 41.9%<br />
2011 Est. Vacant Housing Percent 4.3% 5.3% 6.0%<br />
2000 Homes Built 1999 to 2000 2.7% 3.1% 2.5%<br />
2000 Homes Built 1995 to 1998 11.6% 15.8% 12.9%<br />
2000 Homes Built 1990 to 1994 10.3% 12.2% 10.3%<br />
2000 Homes Built 1980 to 1989 13.1% 10.6% 10.8%<br />
2000 Homes Built 1970 to 1979 39.7% 27.2% 24.9%<br />
2000 Homes Built 1960 to 1969 13.7% 14.5% 12.9%<br />
2000 Homes Built 1950 to 1959 3.8% 9.3% 10.6%<br />
2000 Homes Built Before 1949 4.9% 7.2% 15.0%<br />
2000 Home Value $1,000,000 or More - 0.1% 0.1%<br />
2000 Home Value $500,000 to $999,999 0.1% 0.4% 0.4%<br />
2000 Home Value $400,000 to $499,999 - 0.3% 0.3%<br />
2000 Home Value $300,000 to $399,999 0.7% 0.9% 0.9%<br />
2000 Home Value $200,000 to $299,999 3.0% 7.6% 7.0%<br />
2000 Home Value $150,000 to $199,999 21.7% 18.8% 17.3%<br />
2000 Home Value $100,000 to $149,999 67.2% 55.5% 52.2%<br />
2000 Home Value $50,000 to $99,999 7.3% 15.8% 21.1%<br />
2000 Home Value $25,000 to $49,999 - 0.3% 0.6%<br />
2000 Home Value $0 to $24,999 - 0.3% 0.2%<br />
2000 Median Home Value $134,570 $132,036 $128,029<br />
2000 Median Rent $562 $494 $479<br />
This report was produced using data from private and government sources deemed to be reliable. The information herein is provided without representation or warranty.<br />
©2012, Sites USA, Chandler, Arizona, 480-491-1112 page 2 of 3 Demographic Source: Applied Geographic Solutions 8/2011, TIGER Geography
FULL PROFILE<br />
2000 - 2010 Census, 2011 Estimates with 2016 Projections<br />
Calculated using Proportional Block Groups<br />
Lat/Lon: 45.0054/-122.9967<br />
Chemawa Road & Interstate 5<br />
<strong>Keizer</strong>, OR<br />
LABOR FORCE<br />
OCCUPATION<br />
TRANSPORTATION<br />
TO WORK<br />
TRAVEL TIME<br />
CONSUMER EXPENDITURE<br />
1 Mile 3 Miles 5 Miles<br />
2011 Est. Labor: Population Age 16+ 5,101 53,926 101,396<br />
2011 Est. Civilian Employed 60.9% 58.1% 56.1%<br />
2011 Est. Civilian Unemployed 8.4% 9.7% 9.5%<br />
2011 Est. in Armed Forces 1.1% 0.3% 0.2%<br />
2011 Est. not in Labor Force 29.7% 32.0% 34.3%<br />
2011 Labor Force: Males 52.4% 49.4% 50.2%<br />
2011 Labor Force: Females 47.6% 50.6% 49.8%<br />
2000 Occupation: Population Age 16+ 3,020 28,514 52,773<br />
2000 Mgmt, Business, & Financial Operations 16.4% 12.2% 11.7%<br />
2000 Professional & Related 18.2% 15.5% 16.0%<br />
2000 Service 17.1% 17.4% 17.4%<br />
2000 Sales and Office 26.6% 26.3% 26.5%<br />
2000 Farming, Fishing, and Forestry 1.0% 3.5% 3.6%<br />
2000 Construction, Extraction, & Maintenance 9.3% 10.0% 9.6%<br />
2000 Production, Transport, & Material Moving 11.5% 15.2% 15.1%<br />
2000 Percent White Collar Workers 61.2% 53.9% 54.2%<br />
2000 Percent Blue Collar Workers 38.8% 46.1% 45.8%<br />
2000 Drive to Work Alone 78.9% 73.9% 71.7%<br />
2000 Drive to Work in Carpool 14.8% 17.1% 17.2%<br />
2000 Travel to Work by Public Transportation 1.8% 2.3% 2.7%<br />
2000 Drive to Work on Motorcycle - 0.2% 0.1%<br />
2000 Walk or Bicycle to Work 0.7% 2.2% 3.7%<br />
2000 Other Means 0.7% 0.7% 0.9%<br />
2000 Work at Home 3.1% 3.6% 3.7%<br />
2000 Travel to Work in 14 Minutes or Less 30.2% 29.7% 33.4%<br />
2000 Travel to Work in 15 to 29 Minutes 46.8% 42.5% 40.4%<br />
2000 Travel to Work in 30 to 59 Minutes<br />
2000 Travel to Work in 60 Minutes or More 6.2% 7.3% 7.2%<br />
2000 Average Travel Time to Work 21.8 22.3 21.7<br />
2011 Est. Total Household Expenditure $142 M $1.21 B $2.25 B<br />
2011 Est. Apparel $6.77 M $57.7 M $108 M<br />
2011 Est. Contributions & Gifts $9.00 M $73.2 M $138 M<br />
2011 Est. Education & Reading $3.81 M $31.5 M $59.1 M<br />
2011 Est. Entertainment $7.96 M $66.9 M $125 M<br />
2011 Est. Food, Beverages & Tobacco $22.5 M $196 M $366 M<br />
2011 Est. Furnishings & Equipment $6.36 M $52.2 M $97.2 M<br />
2011 Est. Health Care & Insurance $10.1 M $87.6 M $164 M<br />
2011 Est. Household Operations & Shelter & Utilities $42.2 M $360 M $673 M<br />
2011 Est. Miscellaneous Expenses $2.36 M $20.3 M $38.1 M<br />
2011 Est. Personal Care $2.06 M $17.6 M $32.9 M<br />
2011 Est. Transportation $28.8 M $244 M $454 M<br />
This report was produced using data from private and government sources deemed to be reliable. The information herein is provided without representation or warranty.<br />
©2012, Sites USA, Chandler, Arizona, 480-491-1112 page 3 of 3 Demographic Source: Applied Geographic Solutions 8/2011, TIGER Geography