Lower Washita - Water Resources Board - State of Oklahoma
Lower Washita - Water Resources Board - State of Oklahoma
Lower Washita - Water Resources Board - State of Oklahoma

Create successful ePaper yourself
Turn your PDF publications into a flip-book with our unique Google optimized e-Paper software.
The objective <strong>of</strong> the <strong>Oklahoma</strong> Comprehensive <strong>Water</strong> Plan is to ensure a dependable water supply<br />
for all <strong>Oklahoma</strong>ns through integrated and coordinated water resources planning by providing the<br />
information necessary for water providers, policy-makers, and end users to make informed decisions<br />
concerning the use and management <strong>of</strong> <strong>Oklahoma</strong>’s water resources.<br />
This study, managed and executed by the <strong>Oklahoma</strong> <strong>Water</strong> <strong>Resources</strong> <strong>Board</strong> under its authority to<br />
update the <strong>Oklahoma</strong> Comprehensive <strong>Water</strong> Plan, was funded jointly through monies generously<br />
provided by the <strong>Oklahoma</strong> <strong>State</strong> Legislature and the federal government through cooperative<br />
agreements with the U.S. Army Corps <strong>of</strong> Engineers and Bureau <strong>of</strong> Reclamation.<br />
The online version <strong>of</strong> this 2012 OCWP <strong>Water</strong>shed Planning Region Report (Version 1.1) includes figures that have been<br />
updated since distribution <strong>of</strong> the original printed version. Revisions herein primarily pertain to the seasonality (i.e., the<br />
percent <strong>of</strong> total annual demand distributed by month) <strong>of</strong> Crop Irrigation demand. While the annual water demand remains<br />
unchanged, the timing and magnitude <strong>of</strong> projected gaps and depletions have been modified in some basins. The online<br />
version may also include other additional or updated data and information since the original version was printed.<br />
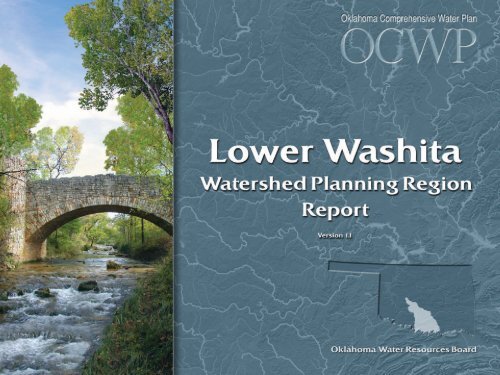
Cover photo: Travertine Creek in Flower Park, Chickasaw National Recreation Area
<strong>Oklahoma</strong> Comprehensive <strong>Water</strong> Plan<br />
<strong>Lower</strong> <strong>Washita</strong> <strong>Water</strong>shed<br />
Planning Region<br />
1
Contents<br />
Introduction ...................................................................... 1<br />
Regional Overview ........................................................ 1<br />
<strong>Lower</strong> <strong>Washita</strong> Regional Summary ........................................... 2<br />
Synopsis ..................................................................... 2<br />
<strong>Water</strong> <strong>Resources</strong> & Limitations ........................................... 2<br />
<strong>Water</strong> Supply Options ..................................................... 4<br />
<strong>Water</strong> Supply .................................................................... 6<br />
Physical <strong>Water</strong> Availability ............................................... 6<br />
Surface <strong>Water</strong> <strong>Resources</strong>. ............................................. 6<br />
Groundwater <strong>Resources</strong> .............................................. 9<br />
Permit Availability ........................................................ 11<br />
<strong>Water</strong> Quality. ............................................................ 12<br />
<strong>Water</strong> Demand ................................................................ 20<br />
Public <strong>Water</strong> Providers ....................................................... 22<br />
<strong>Water</strong> Supply Options . . . . . . . . . . . . . . . . . . . . . . . . . . . . . . . . . . . . . . . . . . . . . . . . . . . . . . . . .36<br />
Limitations Analysis...................................................... 36<br />
Primary Options.......................................................... 36<br />
Demand Management............................................... 36<br />
Out-<strong>of</strong>-Basin Supplies ............................................... 36<br />
Reservoir Use......................................................... 36<br />
Increasing Reliance on Surface <strong>Water</strong> ............................ 37<br />
Increasing Reliance on Groundwater.............................. 37<br />
Expanded Options ....................................................... 37<br />
Expanded Conservation Measures ................................ 37<br />
Artificial Aquifer Recharge .......................................... 37<br />
Marginal Quality <strong>Water</strong> Sources................................... 37<br />
Potential Reservoir Development.................................. 37<br />
Basin Summaries and Data & Analysis ..................................... 41<br />
Basin 14 ................................................................... 41<br />
Basin 15 ................................................................... 51<br />
Basin 16 ................................................................... 61<br />
Basin 21 ................................................................... 71<br />
Basin 22 ................................................................... 81<br />
Basin 23 ................................................................... 91<br />
Glossary . . . . . . . . . . . . . . . . . . . . . . . . . . . . . . . . . . . . . . . . . . . . . . . . . . . . . . . . . . . . . . . . . . . . . . . 100<br />
Sources ....................................................................... 106<br />
<strong>State</strong>wide OCWP <strong>Water</strong>shed Planning Region<br />
and Basin Delineation
Introduction<br />
The <strong>Oklahoma</strong> Comprehensive <strong>Water</strong> Plan<br />
(OCWP) was originally developed in 1980 and<br />
last updated in 1995. With the specific objective<br />
<strong>of</strong> establishing a reliable supply <strong>of</strong> water for<br />
state users throughout at least the next 50<br />
years, the current update represents the most<br />
ambitious and intensive water planning effort<br />
ever undertaken by the state. The 2012 OCWP<br />
Update is guided by two ultimate goals:<br />
1. Provide safe and dependable water supply<br />
for all <strong>Oklahoma</strong>ns while improving the<br />
economy and protecting the environment.<br />
2. Provide information so that water<br />
providers, policy makers, and water users<br />
can make informed decisions concerning<br />
the use and management <strong>of</strong> <strong>Oklahoma</strong>’s<br />
water resources.<br />
In accordance with the goals, the 2012 OCWP<br />
Update has been developed under an innovative<br />
parallel-path approach: inclusive and dynamic<br />
public participation to build sound water policy<br />
complemented by detailed technical evaluations.<br />
Also unique to this update are studies<br />
conducted according to specific geographic<br />
boundaries (watersheds) rather than political<br />
boundaries (counties). This new strategy<br />
involved dividing the state into 82 surface<br />
water basins for water supply availability<br />
analysis (see the OCWP Physical <strong>Water</strong> Supply<br />
Availability Report). Existing watershed<br />
boundaries were revised to include a United<br />
<strong>State</strong>s Geological Survey (USGS) stream<br />
The primary factors in the determination<br />
<strong>of</strong> reliable future water supplies are<br />
physical supplies, water rights, water<br />
quality, and infrastructure. Gaps and<br />
depletions occur when demand exceeds<br />
supply, and can be attributed to physical<br />
supply, water rights, infrastructure, or<br />
water quality constraints.<br />
gage at or near the basin outlet (downstream<br />
boundary), where practical. To facilitate<br />
consideration <strong>of</strong> regional supply challenges and<br />
potential solutions, basins were aggregated into<br />
13 distinct <strong>Water</strong>shed Planning Regions.<br />
This <strong>Water</strong>shed Planning Region report, one <strong>of</strong><br />
13 such documents prepared for the 2012 OCWP<br />
Update, presents elements <strong>of</strong> technical studies<br />
pertinent to the <strong>Lower</strong> <strong>Washita</strong> Region. Each<br />
regional report presents information from<br />
both a regional and multiple basin perspective,<br />
including water supply/demand analysis<br />
results, forecasted water supply shortages,<br />
potential supply solutions and alternatives, and<br />
supporting technical information.<br />
As a key foundation <strong>of</strong> OCWP technical<br />
work, a computer-based analysis tool,<br />
“<strong>Oklahoma</strong> H2O,” was created to<br />
compare projected demands with physical<br />
supplies for each basin to identify areas<br />
<strong>of</strong> potential water shortages.<br />
Integral to the development <strong>of</strong> these reports<br />
was the <strong>Oklahoma</strong> H2O tool, a sophisticated<br />
database and geographic information system<br />
(GIS) based analysis tool created to compare<br />
projected water demand to physical supplies<br />
in each <strong>of</strong> the 82 OCWP basins statewide.<br />
Recognizing that water planning is not a static<br />
process but rather a dynamic one, this versatile<br />
tool can be updated over time as new supply<br />
and demand data become available, and can be<br />
used to evaluate a variety <strong>of</strong> “what-if” scenarios<br />
at the basin level, such as a change in supply<br />
sources, demand, new reservoirs, and various<br />
other policy management scenarios.<br />
Primary inputs to the model include demand<br />
projections for each decade through 2060,<br />
founded on widely-accepted methods and<br />
peer review <strong>of</strong> inputs and results by state and<br />
federal agency staff, industry representatives,<br />
Regional Overview<br />
The <strong>Lower</strong> <strong>Washita</strong> <strong>Water</strong>shed Planning Region includes six basins (numbered 14-16<br />
and 21-23 for reference). The region is in the Central Lowland physiography province<br />
and encompasses 6,192 square miles in southern <strong>Oklahoma</strong>, spanning all <strong>of</strong> Carter,<br />
Love, and Marshall Counties and parts <strong>of</strong> Canadian, Caddo, Comanche, Grady,<br />
McClain, Garvin, Pontotoc, Stephens, Murray, Johnston, Jefferson, and Bryan Counties.<br />
The region’s terrain varies from lush pasture in the river bottoms to the rugged foothills<br />
<strong>of</strong> the Arbuckle Mountains. The region’s climate is mild with annual mean temperatures<br />
varying from 61°F to 64°F. Annual evaporation within the region ranges from 63 inches<br />
per year in the west to 55 inches per year in the east. Annual average precipitation<br />
ranges from 27 inches in the west to 43 inches in the east.<br />
The largest cities in the region include Ardmore (2010 population 24,283), Chickasha<br />
(16,036), Anadarko (6,762), and Pauls Valley (6,187). The greatest demand is from the<br />
Municipal and Industrial and Crop Irrigation water use sectors.<br />
By 2060, this region is projected to have a total demand <strong>of</strong> 117,200 acre-feet per year<br />
(AFY), an increase <strong>of</strong> approximately 37,000 AFY (46%) from 2010.<br />
and stakeholder groups for each demand<br />
sector. Surface water supply data for each <strong>of</strong><br />
the 82 basins is based on 58 years <strong>of</strong> publiclyavailable<br />
daily streamflow gage data collected<br />
by the USGS. Groundwater resources were<br />
characterized using previously-developed<br />
assessments <strong>of</strong> groundwater aquifer storage and<br />
recharge rates.<br />
Additional and supporting information<br />
gathered during development <strong>of</strong> the 2012 OCWP<br />
Update is provided in the OCWP Executive Report<br />
and various OCWP supplemental reports.<br />
Assessments <strong>of</strong> statewide physical water<br />
availability and potential shortages are further<br />
documented in the OCWP Physical <strong>Water</strong> Supply<br />
Availability Report. <strong>State</strong>wide water demand<br />
projection methods and results are detailed<br />
in the OCWP <strong>Water</strong> Demand Forecast Report.<br />
Permitting availability was evaluated based<br />
on the OWRB’s administrative protocol and<br />
documented in the OCWP <strong>Water</strong> Supply Permit<br />
Availability Report. All supporting documentation<br />
can be found on the OWRB’s website.<br />
<strong>Oklahoma</strong> Comprehensive <strong>Water</strong> Plan<br />
<strong>Lower</strong> <strong>Washita</strong> Regional Report 1
<strong>Lower</strong> <strong>Washita</strong> Regional Summary<br />
Synopsis<br />
• The <strong>Lower</strong> <strong>Washita</strong> <strong>Water</strong>shed Planning Region relies primarily on surface water<br />
supplies (including reservoirs) and bedrock groundwater.<br />
• It is anticipated that water users in the region will continue to rely on these sources to<br />
meet future demand.<br />
• By 2020, surface water supplies may be insufficient at times to meet demand in<br />
basins without major reservoirs (Basins 15, 16, 22, and 23).<br />
• By 2020, groundwater storage depletions may occur in all basins and eventually lead<br />
to higher pumping costs, the need for deeper wells, and potential changes to well<br />
yields or water quality.<br />
• To reduce the risk <strong>of</strong> adverse impacts on water supplies, it is recommended that gaps<br />
and storage depletions be decreased where economically feasible.<br />
• Additional conservation could reduce surface water gaps and groundwater<br />
storage depletions.<br />
• Surface water alternatives, such as the use <strong>of</strong> bedrock groundwater supplies<br />
and/or developing new reservoirs, could mitigate gaps without major impacts to<br />
groundwater storage.<br />
• One basin (Basin 22) in the region has been identified as a “hot spot,” an area where<br />
more pronounced water supply availability issues are forecasted. (See “Regional and<br />
<strong>State</strong>wide Opportunities and Solutions,” 2012 OCWP Executive Report.)<br />
<strong>Lower</strong> <strong>Washita</strong> Region Demand Summary<br />
Current <strong>Water</strong> Demand: 80,440 acre-feet/year (4% <strong>of</strong> state total)<br />
Largest Demand Sector: Municipal & Industrial (39% <strong>of</strong> regional total)<br />
Current Supply Sources: 49% SW 12% Alluvial GW 39% Bedrock GW<br />
Projected Demand (2060): 117,230 acre-feet/year<br />
Growth (2010-2060): 36,790 acre-feet/year (46%)<br />
Current and Projected Regional <strong>Water</strong> Demand<br />
The <strong>Lower</strong> <strong>Washita</strong> Region accounts for<br />
about 4% <strong>of</strong> the state’s total water demand.<br />
The largest demand sectors are Municipal<br />
and Industrial (39% <strong>of</strong> the region’s overall<br />
demand) and Crop Irrigation (36%).<br />
<strong>Water</strong> <strong>Resources</strong> &<br />
Limitations<br />
Surface <strong>Water</strong><br />
Surface water supplies, including reservoirs,<br />
are used to meet 49% <strong>of</strong> the <strong>Lower</strong> <strong>Washita</strong><br />
Region’s demand. Surface water supply<br />
shortages are expected at times in Basins<br />
15, 16, 22, and 23 by 2020. There is a low to<br />
moderate probability <strong>of</strong> shortages occurring<br />
in at least one month <strong>of</strong> the year by 2060,<br />
except in Basin 22 where the probability<br />
<strong>of</strong> shortages is much higher. There are four<br />
major rivers in the region: the Red River,<br />
the <strong>Washita</strong> River, Mud Creek, and Walnut<br />
Bayou. The Red River is not considered as<br />
a water supply source for this study due to<br />
water quality constraints. Historically, the<br />
<strong>Washita</strong> River has had substantial flows in<br />
the spring. However, periods <strong>of</strong> low flow can<br />
occur in any month <strong>of</strong> the year, particularly in<br />
the summer and fall, due to seasonal and longterm<br />
trends in precipitation. Lake Texoma,<br />
constructed by the U.S. Army Corps <strong>of</strong><br />
Engineers, and Lake <strong>of</strong> the Arbuckles, a Bureau<br />
<strong>of</strong> Reclamation project, are the two major<br />
federal lakes in the region. Other large lakes<br />
have been built on tributaries in the <strong>Lower</strong><br />
<strong>Washita</strong> Region to provide public water<br />
supply, flood control, and recreation. Large<br />
reservoirs in the region include: Murray (<strong>State</strong><br />
<strong>of</strong> <strong>Oklahoma</strong>); Healdton (City <strong>of</strong> Healdton);<br />
Humphreys, Clear Creek, Fuqua, and Duncan<br />
(City <strong>of</strong> Duncan); Wiley Post Memorial (City<br />
<strong>of</strong> Maysville); Chickasha (City <strong>of</strong> Chickasha);<br />
and Pauls Valley and RC Longmire (City <strong>of</strong><br />
Pauls Valley). Many other small lakes are<br />
located in the region and provide water for<br />
various purposes. All basins in the region,<br />
except Basin 16, are expected to have available<br />
surface water for new permitting to meet local<br />
demand through 2060. With the exception<br />
<strong>of</strong> the Red River, surface water quality in the<br />
region is considered generally fair relative<br />
to other regions in the state. However,<br />
several creeks in the region are impaired for<br />
Agricultural use due to high levels <strong>of</strong> chloride,<br />
sulfate and total dissolved solids (TDS).<br />
Alluvial Groundwater<br />
Alluvial groundwater is used to meet 12% <strong>of</strong><br />
the demand in the region. The majority <strong>of</strong><br />
currently permitted alluvial groundwater<br />
rights in the region are from the <strong>Washita</strong><br />
River major alluvial aquifer. About one third <strong>of</strong><br />
current alluvial groundwater withdrawals are<br />
from the Crop Irrigation demand sector, about<br />
29% are from the Municipal and Industrial<br />
demand sector, and about 26% are from the<br />
2 <strong>Lower</strong> <strong>Washita</strong> Regional Report <strong>Oklahoma</strong> Comprehensive <strong>Water</strong> Plan
Self-Supplied Residential demand sector. If<br />
alluvial groundwater continues to supply<br />
a similar portion <strong>of</strong> demand in the future,<br />
storage depletions may occur in all basins in<br />
the region by 2020 except Basin 23. The largest<br />
storage depletions are projected to occur in<br />
the summer. The availability <strong>of</strong> permits is<br />
not expected to constrain the use <strong>of</strong> alluvial<br />
groundwater supplies to meet local demand<br />
through 2060.<br />
Bedrock Groundwater<br />
Bedrock groundwater is used to meet 39% <strong>of</strong><br />
the demand in the region. Currently permitted<br />
and projected withdrawals are primarily<br />
from the Rush Springs major aquifer and<br />
the Antlers major aquifer. There are also<br />
substantial permits in the Arbuckle-Simpson<br />
major aquifer and in multiple minor aquifers.<br />
The Rush Springs aquifer has more than 10<br />
million acre-feet (AF) <strong>of</strong> groundwater storage<br />
in the region. The Antlers aquifer has about<br />
10.8 million AF <strong>of</strong> groundwater storage in<br />
the region. The Arbuckle-Simpson aquifer<br />
has about 5.7 million AF <strong>of</strong> groundwater<br />
storage in the region. The recharge to the<br />
major aquifers is expected to be sufficient to<br />
meet all <strong>of</strong> the region’s bedrock groundwater<br />
demand through 2060, except in Basins 15, 22,<br />
and 23, where bedrock groundwater storage<br />
depletions may occur by 2020. The availability<br />
<strong>of</strong> permits is not expected to constrain the<br />
use <strong>of</strong> bedrock groundwater supplies to meet<br />
local demand through 2060. Results <strong>of</strong> the<br />
Arbuckle-Simpson Hydrology Study indicate that in<br />
order to comply with 2003 Senate Bill 288, the<br />
equal proportionate share will be significantly<br />
lower than the current 2 AFY/acre allocation<br />
for temporary permits. There are no significant<br />
groundwater quality issues in the basin.<br />
However, localized areas with high levels <strong>of</strong><br />
nitrate and fluoride have been found in the<br />
overall Rush Springs aquifer and may occur in<br />
Basins 14 and 16.<br />
<strong>Water</strong> Supply Limitations<br />
<strong>Lower</strong> <strong>Washita</strong> Region<br />
<strong>Water</strong> Supply Limitations<br />
Surface water limitations are determined based<br />
on physical availability, water supply availability<br />
for new permits, and water quality. Groundwater<br />
limitations are determined based on the total size<br />
and rate <strong>of</strong> storage depletions in major aquifers.<br />
Groundwater permits are not expected to constrain<br />
the use <strong>of</strong> groundwater through 2060; insufficient<br />
statewide groundwater quality data are available<br />
to compare basins based on groundwater quality.<br />
Basins with the most significant water supply<br />
challenges statewide are indicated by a red box.<br />
The remaining basins with surface water gaps or<br />
groundwater storage depletions were considered to<br />
have potential limitations (yellow). Basins without<br />
gaps and storage depletions are considered to have<br />
minimal limitations (green). Detailed explanations<br />
<strong>of</strong> each basin’s supplies are provided in individual<br />
basin summaries and supporting data and analysis.<br />
<strong>Oklahoma</strong> Comprehensive <strong>Water</strong> Plan<br />
<strong>Lower</strong> <strong>Washita</strong> Regional Report 3
<strong>Water</strong> Supply Options<br />
To quantify physical surface water gaps and<br />
groundwater storage depletions through<br />
2060, use <strong>of</strong> local supplies was assumed to<br />
continue in the current (2010) proportions.<br />
Surface water supplies, reservoirs, and<br />
bedrock groundwater supplies are expected<br />
to continue to supply the majority <strong>of</strong> demand<br />
in the <strong>Lower</strong> <strong>Washita</strong> Region. Surface water<br />
users may have physical surface water supply<br />
shortages (gaps) in the future, except in<br />
Basins 14 and 21. Alluvial groundwater storage<br />
depletions <strong>of</strong> major and minor aquifers are also<br />
projected in the future and may occur in all<br />
basins in the region except Basin 23 by 2020.<br />
Bedrock groundwater depletions are expected<br />
by 2020 in Basins 15, 22, and 23. Additional<br />
long-term water supplies should be considered<br />
for surface water users and groundwater users.<br />
<strong>Water</strong> conservation could aid in reducing<br />
projected gaps and groundwater storage<br />
depletions or delaying the need for additional<br />
infrastructure. Moderately expanded<br />
conservation activities could reduce gaps<br />
and storage depletions throughout the<br />
region. Future reductions could occur from<br />
substantially expanded conservation activities.<br />
These measures would require a shift from<br />
crops with high water demand (e.g., corn for<br />
grain and forage crops) to low water demand<br />
crops such as sorghum for grain or wheat for<br />
grain, along with increased efficiency and<br />
increased public water supplier conservation.<br />
Due to the generally low frequency <strong>of</strong><br />
shortages in most <strong>of</strong> the basins, temporary<br />
drought management measures may be an<br />
effective water supply option.<br />
concerns severely constrain its use. These<br />
water sources could serve as in-basin storage<br />
or out-<strong>of</strong>-basin supplies to provide additional<br />
supplies to mitigate the<br />
region’s surface water gaps and<br />
groundwater storage depletions.<br />
However, depending on the<br />
distance from these reservoirs<br />
to demand points in each basin<br />
and the basins’ substantial<br />
groundwater supplies, this water<br />
supply option may not be costeffective<br />
for many users.<br />
The projected growth in surface<br />
water could instead be supplied<br />
in part by increased use <strong>of</strong> major<br />
alluvial and bedrock groundwater,<br />
which would result in minimal or no<br />
increases in projected groundwater<br />
storage depletions. However, these<br />
aquifers only underlie about 40% <strong>of</strong> the<br />
region, and pending changes to the equal<br />
proportionate share <strong>of</strong> the Arbuckle-<br />
Simpson may be significantly lower than<br />
the current 2 AFY/acre allocation for<br />
temporary permits.<br />
<strong>Water</strong> Supply Option Effectiveness<br />
<strong>Lower</strong> <strong>Washita</strong> Region<br />
New reservoirs and expanded use <strong>of</strong> existing<br />
reservoirs could enhance the dependability<br />
<strong>of</strong> surface water supplies and eliminate gaps<br />
throughout the region. The OCWP Reservoir<br />
Viability Study evaluated the potential for<br />
reservoirs throughout the state. Twelve<br />
potentially viable sites were identified in the<br />
<strong>Lower</strong> <strong>Washita</strong> Region. Lake Texoma, in Basin<br />
21, has substantial unpermitted yield to meet<br />
the needs <strong>of</strong> new users, but water quality<br />
This evaluation was based upon results <strong>of</strong> physical water supply availability analysis, existing<br />
infrastructure, and other basin-specific factors.<br />
4 <strong>Lower</strong> <strong>Washita</strong> Regional Report <strong>Oklahoma</strong> Comprehensive <strong>Water</strong> Plan
<strong>Oklahoma</strong> Comprehensive <strong>Water</strong> Plan<br />
<strong>Lower</strong> <strong>Washita</strong> Regional Report 5
<strong>Water</strong> Supply<br />
Physical <strong>Water</strong> Availability<br />
Surface <strong>Water</strong> <strong>Resources</strong><br />
Surface water has historically been about<br />
half <strong>of</strong> the supply used to meet demand in the<br />
<strong>Lower</strong> <strong>Washita</strong> Region. The region’s major<br />
rivers include the Red River, the <strong>Washita</strong><br />
River, Mud Creek and Walnut Bayou. Many<br />
streams in this region experience a wide range<br />
<strong>of</strong> flows, including both periodic low-flow<br />
conditions and flooding events.<br />
<strong>Water</strong> in the Red River mainstem (southern<br />
border <strong>of</strong> the <strong>Lower</strong> <strong>Washita</strong> Region),<br />
which maintains substantial flows, is highly<br />
mineralized above Lake Texoma, primarily<br />
due to high concentrations <strong>of</strong> chlorides from<br />
natural sources upstream. Without extensive<br />
water treatment or management techniques,<br />
the high chloride content <strong>of</strong> the Red River<br />
renders water generally unsuitable for most<br />
consumptive uses. For this reason, the Red<br />
River was not considered as a feasible source<br />
<strong>of</strong> supply in these analyses. As treatment<br />
technology evolves over time, treatment<br />
costs will likely decrease, and this source<br />
may become more attractive relative to other<br />
local and regional source options. Also, full<br />
implementation <strong>of</strong> the Corps <strong>of</strong> Engineers’ Red<br />
River Chloride Control Project could reduce<br />
naturally occurring chloride levels in the Red<br />
River and its tributaries, thereby making it a<br />
more feasible source <strong>of</strong> future water supply.<br />
The mainstem <strong>of</strong> the <strong>Washita</strong> River is located<br />
in the north and west areas <strong>of</strong> the region,<br />
flowing south before joining the Red River in<br />
Lake Texoma. About 530 miles <strong>of</strong> the <strong>Washita</strong><br />
River mainstem are located in <strong>Oklahoma</strong> with<br />
240 miles in the <strong>Lower</strong> <strong>Washita</strong> Region. The<br />
<strong>Washita</strong> is also highly mineralized, although<br />
tributary streams improve overall quality in<br />
the lower reaches. Major tributaries in the<br />
<strong>Lower</strong> <strong>Washita</strong> Region include Caddo Creek<br />
(45 miles). The <strong>Washita</strong> River and tributaries<br />
are located in Basins 14, 15, 16, and 21.<br />
Mud Creek originates in Basin 23, where it<br />
flows 75 miles in a southeasterly direction<br />
before joining the Red River. Walnut Bayou<br />
heads in Basin 22 and flows 32 miles south to<br />
its confluence with the Red River.<br />
As important sources <strong>of</strong> surface water<br />
in <strong>Oklahoma</strong>, reservoirs and lakes<br />
help provide dependable water supply<br />
storage, especially when streams and<br />
rivers experience periods <strong>of</strong> low seasonal<br />
flow or drought.<br />
Existing reservoirs in the region increase the<br />
dependability <strong>of</strong> surface water supply for<br />
many public water systems and other users.<br />
Reservoirs in the region with the largest water<br />
supply yields are federal projects and include<br />
Lake Texoma (Denison Dam) and Lake <strong>of</strong> the<br />
Arbuckles. Another major lake in the region is<br />
Murray owned by the state <strong>of</strong> <strong>Oklahoma</strong> and<br />
operated primarily for recreation purposes.<br />
Lake Texoma, a Corps <strong>of</strong> Engineer Project,<br />
was constructed on the main stem <strong>of</strong> the<br />
Red River in 1944 for the purposes <strong>of</strong> flood<br />
control, water supply, recreation, navigation,<br />
and hydropower purposes, as well as for<br />
regulation <strong>of</strong> the Red River. The lake is subject<br />
to the provisions <strong>of</strong> the Red River Compact,<br />
which equally allocates Texoma water supply<br />
storage and yield to Texas and <strong>Oklahoma</strong>.<br />
Each state is allotted a dependable water<br />
Reservoir Name<br />
Primary<br />
Basin<br />
Number Reservoir Owner/ Operator Year Built Purposes 1<br />
Reservoirs<br />
<strong>Lower</strong> <strong>Washita</strong> Region<br />
Normal Pool<br />
Storage<br />
<strong>Water</strong> Supply Irrigation <strong>Water</strong> Quality<br />
Storage Yield Storage Yield Storage Yield<br />
Permitted<br />
Withdrawals<br />
Remaining <strong>Water</strong><br />
Supply Yield to<br />
be Permitted<br />
AF AF AFY AF AFY AF AFY AFY AFY<br />
Arbuckle 14 Bureau <strong>of</strong> Reclamation 1967 WS, FC, FW, R 72,400 62,600 24,000 0 0 0 0 24,000 0<br />
Chickasha 16 City <strong>of</strong> Chickasha 1958 WS, R 41,080 --- --- 0 0 0 0 5,200 ---<br />
Clear Creek 14 City <strong>of</strong> Duncan 1948 WS, R 7,710 --- --- 0 0 0 0 2,262 ---<br />
Duncan 14 City <strong>of</strong> Duncan 1937 WS, R 7,200 --- --- 0 0 0 0 738 ---<br />
Fuqua 14 City <strong>of</strong> Duncan 1962 WS. FC, R 21,100 21,100 3,427 0 0 0 0 1,245 2,182<br />
Healdton 22 City <strong>of</strong> Healdton 1979 WS, FC, R 3,766 --- 413 0 0 0 0 1,473 0<br />
Humphreys 14 City <strong>of</strong> Duncan 1958 WS, FC, R 14,041 --- 3,226 0 0 0 0 5,408 0<br />
Murray 21 <strong>State</strong> <strong>of</strong> <strong>Oklahoma</strong> 1938 R 153,250 111,921 1,008 0 0 0 0 12,860 0<br />
Pauls Valley 14 City <strong>of</strong> Pauls Valley 1954 WS, R 8,730 --- --- --- --- --- --- 1,993 ---<br />
RC Longmire 14 City <strong>of</strong> Pauls Valley 1989 WS, FC, R N/A 13,162 3,360 0 0 0 0 3,361 0<br />
Taylor 14 City <strong>of</strong> Marlow, Leased 1960 WS, FC, R 1,877 --- --- --- --- 0 0 1,877 ---<br />
Texoma 21 USACE 1944 FC, WS, HP, LF, R 2,643,000 150,000 168,000 0 0 0 0 5,730 162,271<br />
Wiley Post Memorial 15 City <strong>of</strong> Maysville 1971 WS, FC, R 2,082 0 538 0 0 0 0 700 0<br />
No known information is annotated as “---”<br />
1 The “Purposes” represent the use(s), as authorized by the funding entity or dam owner(s), for the reservoir storage when constructed.<br />
WS=<strong>Water</strong> Supply, R=Recreation, HP=Hydroelectric Power, IR=Irrigation, WQ=<strong>Water</strong> Quality, FW=Fish & Wildlife, FC=Flood Control, LF=Low Flow Regulation, N=Navigation, C=Conservation, CW=Cooling <strong>Water</strong><br />
6 <strong>Lower</strong> <strong>Washita</strong> Regional Report <strong>Oklahoma</strong> Comprehensive <strong>Water</strong> Plan
supply yield <strong>of</strong> 168,000 AFY. Unfortunately,<br />
the water is <strong>of</strong> very poor quality and is not<br />
suitable for most municipal and industrial<br />
uses without extensive treatment or blending.<br />
Of <strong>Oklahoma</strong>’s equal share <strong>of</strong> water, only<br />
5,730 AFY has been authorized for use by<br />
stream water rights (over 98% <strong>of</strong> that for<br />
irrigation purposes). More than 160,000 AFY<br />
<strong>of</strong> unpermitted yield is available for beneficial<br />
use in <strong>Oklahoma</strong>.<br />
Surface <strong>Water</strong> <strong>Resources</strong><br />
<strong>Lower</strong> <strong>Washita</strong> Region<br />
The Lake <strong>of</strong> the Arbuckles was constructed<br />
by the Bureau <strong>of</strong> Reclamation in 1967 on<br />
Rock Creek, a tributary <strong>of</strong> the <strong>Washita</strong> River.<br />
The lake was built for the purposes <strong>of</strong> water<br />
supply, flood control, recreation, and fish<br />
and wildlife mitigation and contains 62,600<br />
acre-feet <strong>of</strong> conservation storage yielding<br />
24,000 AFY. The entire yield is allocated to the<br />
Arbuckle Master Conservancy District which<br />
provides water to the cities <strong>of</strong> Ardmore, Davis,<br />
Sulphur, Wynnewood, and Dougherty.<br />
Lake Murray is a state-owned project that<br />
was constructed on Hickory Creek in 1937 for<br />
recreation purposes and is one <strong>of</strong> southern<br />
<strong>Oklahoma</strong>’s largest tourist attractions.<br />
Located in Basin 21, the lake has 153,250<br />
AF <strong>of</strong> conservation storage <strong>of</strong> which none<br />
is allocated to water supply, though several<br />
permits have been issued for recreation, fish<br />
and wildlife purposes.<br />
Smaller water supply and recreation lakes<br />
include Healdton Lake in Basin 22, operated<br />
by the City <strong>of</strong> Healdton; Humphreys, Clear<br />
Creek, Duncan, and Fuqua in Basin 14,<br />
owned by the City <strong>of</strong> Duncan; Wiley Post<br />
Memorial in Basin 15, operated by the City <strong>of</strong><br />
Maysville; Pauls Valley and RC Longmire in<br />
Basin 14, owned by the City <strong>of</strong> Pauls Valley;<br />
and Chickasha in Basin 16, owned by the City<br />
<strong>of</strong> Chickasha. There are many other small<br />
Natural <strong>Resources</strong> Conservation Service<br />
(NRCS), municipal and privately owned lakes<br />
in the region that provide water for public<br />
water supply, agricultural water supply, flood<br />
control and recreation.<br />
<strong>Oklahoma</strong> Comprehensive <strong>Water</strong> Plan<br />
Reservoirs may serve multiple purposes, such as water supply, irrigation, recreation, hydropower generation, and<br />
flood control. Reservoirs designed for multiple purposes typically possess a specific volume <strong>of</strong> water storage assigned<br />
for each purpose.<br />
<strong>Lower</strong> <strong>Washita</strong> Regional Report 7
<strong>Water</strong> Supply Availability Analysis<br />
For OCWP physical water supply availability analysis, water supplies were divided into three<br />
categories: surface water, alluvial aquifers, and bedrock aquifers. Physically available surface water<br />
refers to water currently in streams, rivers, lakes, and reservoirs.<br />
The range <strong>of</strong> historical surface water availability, including droughts, is well-represented in the<br />
<strong>Oklahoma</strong> H2O tool by 58 years <strong>of</strong> monthly streamflow data (1950 to 2007) recorded by the U.S.<br />
Geological Survey (USGS). Therefore, measured streamflow, which reflects current natural and<br />
human created conditions (run<strong>of</strong>f, diversions and use <strong>of</strong> water, and impoundments and reservoirs),<br />
is used to represent the physical water that may be available to meet projected demand.<br />
The estimated average and minimum annual streamflow in 2060 were determined based on<br />
historic surface water flow measurements and projected baseline 2060 demand (see <strong>Water</strong><br />
Demand section). The amount <strong>of</strong> streamflow in 2060 may vary from basin-level values, due<br />
to local variations in demands and local availability <strong>of</strong> supply sources. The estimated surface<br />
water supplies include changes in historical streamflow due to increased upstream demand,<br />
return flows, and increases in out-<strong>of</strong>-basin supplies from existing infrastructure. Permitting, water<br />
quality, infrastructure, non-consumptive demand, and potential climate change implications are<br />
considered in separate OCWP analyses. Past reservoir operations are reflected and accounted for<br />
in the measured historical streamflow downstream <strong>of</strong> a reservoir. For this analysis, streamflow was<br />
adjusted to reflect interstate compact provisions in accordance with existing administrative protocol.<br />
The amount <strong>of</strong> water a reservoir can provide from storage is referred to as its yield. The yield<br />
is considered the maximum amount <strong>of</strong> water a reservoir can dependably supply during critical<br />
drought periods. The unused yield <strong>of</strong> existing reservoirs was considered for this analysis. Future<br />
potential reservoir storage was considered as a water supply option.<br />
Groundwater supplies are quantified by the amount <strong>of</strong> water that an aquifer holds (“stored” water)<br />
and the rate <strong>of</strong> aquifer recharge. In <strong>Oklahoma</strong>, recharge to aquifers is generally from precipitation<br />
that falls on the aquifer and percolates to the water table. In some cases, where the altitude <strong>of</strong><br />
the water table is below the altitude <strong>of</strong> the stream-water surface, surface water can seep into the<br />
aquifer.<br />
For this analysis, alluvial aquifers are defined as aquifers comprised <strong>of</strong> river alluvium and terrace<br />
deposits, occurring along rivers and streams and consisting <strong>of</strong> unconsolidated deposits <strong>of</strong> sand, silt,<br />
and clay. Alluvial aquifers are generally thinner (less than 200 feet thick) than bedrock aquifers,<br />
feature shallow water tables, and are exposed at the land surface, where precipitation can readily<br />
percolate to the water table. Alluvial aquifers are considered to be more hydrologically connected<br />
with streams than are bedrock aquifers and are therefore treated separately.<br />
Bedrock aquifers consist <strong>of</strong> consolidated (solid) or partially consolidated rocks, such as sandstone,<br />
limestone, dolomite, and gypsum. Most bedrock aquifers in <strong>Oklahoma</strong> are exposed at land surface<br />
either entirely or in part. Recharge from precipitation is limited in areas where bedrock aquifers are<br />
not exposed.<br />
For both alluvial and bedrock aquifers, this analysis was used to predict potential groundwater<br />
depletions based on the difference between the groundwater demand and recharge rate.<br />
While potential storage depletions do not affect the permit availability <strong>of</strong> water, it is important to<br />
understand the extent <strong>of</strong> these depletions.<br />
More information is available in the OCWP Physical <strong>Water</strong> Supply Availability Report on the<br />
OWRB website.<br />
Streamflow Statistic<br />
Surface <strong>Water</strong> Flows (1950-2007)<br />
<strong>Lower</strong> <strong>Washita</strong> Region<br />
Surface water sources supply about half <strong>of</strong> the demand in the <strong>Lower</strong> <strong>Washita</strong> Region.<br />
While the region’s average physical surface water supply exceeds projected surface<br />
water demand, gaps can occur due to seasonal, long-term hydrologic (drought),<br />
or localized variability in surface water flows. Several large reservoirs have been<br />
constructed to reduce the impacts <strong>of</strong> drier periods on surface water users.<br />
Estimated Annual Streamflow in 2060<br />
<strong>Lower</strong> <strong>Washita</strong> Region<br />
Basins<br />
14 15 16 21 22 23<br />
Average Annual Flow 1,253,200 628,300 466,900 2,054,800 42,300 143,300<br />
Minimum Annual Flow 224,000 113,400 72,700 372,800 0 1,200<br />
Annual streamflow in 2060 was estimated using historical gaged flow and projections <strong>of</strong> increased surface water use<br />
from 2010 to 2060.<br />
AFY<br />
8 <strong>Lower</strong> <strong>Washita</strong> Regional Report <strong>Oklahoma</strong> Comprehensive <strong>Water</strong> Plan
Groundwater <strong>Resources</strong><br />
Three major bedrock aquifers, the Antlers,<br />
Arbuckle-Simpson, and Rush Springs,<br />
underlie the <strong>Lower</strong> <strong>Washita</strong> <strong>Water</strong>shed<br />
Planning Region. The Antlers is found in<br />
the southeastern portion <strong>of</strong> the region, the<br />
Arbuckle-Simpson in the central-eastern area<br />
<strong>of</strong> the region, and the Rush Springs along the<br />
northern edge. Four major alluvial aquifers<br />
are located in the region: the Canadian River,<br />
<strong>Washita</strong> River, Gerty Sand, and Red River.<br />
Withdrawing groundwater in quantities<br />
exceeding the amount <strong>of</strong> recharge to the<br />
aquifer may result in aquifer depletion<br />
and reduced storage. Therefore, both<br />
storage and recharge were considered in<br />
determining groundwater availability.<br />
The Antlers aquifer is comprised <strong>of</strong> poorly<br />
cemented sandstone with some layers <strong>of</strong> sandy<br />
shale, silt, and clay. The depth to the top <strong>of</strong><br />
Areas without delineated aquifers may have<br />
groundwater present. However, specific<br />
quantities, yields, and water quality in these<br />
areas are currently unknown.<br />
the sandstone formation from the land surface<br />
varies from several feet to 1,000 feet and the<br />
saturated thickness ranges from less than 5<br />
feet in the north to about 1,000 feet near the<br />
Red River. Large-capacity wells tapping the<br />
Antlers aquifer commonly yield 100 to 500<br />
gallons per minute (gpm). <strong>Water</strong> quality is<br />
generally good with water becoming slightly<br />
saline (dissolved solids greater than 1,000<br />
mg/L) in the southern portions <strong>of</strong> the aquifer.<br />
The Antlers bedrock aquifer underlies portions<br />
<strong>of</strong> Basins 21 and 22.<br />
The Arbuckle-Simpson aquifer consists <strong>of</strong><br />
several formations; about two-thirds <strong>of</strong> the<br />
aquifer consists <strong>of</strong> limestone and dolomite<br />
with sandstone and shale present in some<br />
areas. The saturated thickness is estimated<br />
to be from 2,000 to 3,500 feet. Common well<br />
yields vary from 25 to 600 gpm, depending<br />
on location in the aquifer, with deeper wells<br />
yielding more than 1,000 gpm in some areas.<br />
The aquifer is the source <strong>of</strong> many springs,<br />
including those at Chickasaw National<br />
Recreation Area, and contributes flow<br />
to several spring-fed streams, including<br />
Pennington, Travertine, and Honey Creeks.<br />
<strong>Water</strong> quality is good with dissolved solids<br />
generally less than 500 mg/L. The aquifer<br />
underlies portions <strong>of</strong> Basins 14 and 21.<br />
The Rush Springs aquifer is a fine-grained sandstone<br />
aquifer with some shale, dolomite, and gypsum.<br />
Thickness <strong>of</strong> the aquifer ranges from 200 to 300 feet.<br />
Wells commonly yield 25 to 400 gpm. The water<br />
tends to be very hard, requiring water s<strong>of</strong>tening to<br />
address aesthetic issues for public water supply use.<br />
In some areas nitrate and sulfate concentrations<br />
exceed drinking water standards, limiting its use for<br />
drinking water. This aquifer underlies portions <strong>of</strong><br />
Basins 14, 15, and 16.<br />
Permits to withdraw groundwater from<br />
aquifers (groundwater basins) where the<br />
maximum annual yield has not been set are<br />
“temporary” permits that allocate 2 AFY/<br />
acre. The temporary permit allocation is not<br />
based on storage, discharge or recharge<br />
amounts, but on a legislative (statute)<br />
estimate <strong>of</strong> maximum needs <strong>of</strong> most<br />
landowners to ensure sufficient availability <strong>of</strong><br />
groundwater in advance <strong>of</strong> completed and<br />
approved aquifer studies. As a result, the<br />
estimated amount <strong>of</strong> Groundwater Available<br />
for New Permits may exceed the estimated<br />
aquifer storage amount. For aquifers<br />
(groundwater basins) where the maximum<br />
annual yield has been determined (with<br />
initial storage volumes estimated), updated<br />
estimates <strong>of</strong> amounts in storage were<br />
calculated based on actual reported use <strong>of</strong><br />
groundwater instead <strong>of</strong> simulated usage<br />
from all lands.<br />
Groundwater <strong>Resources</strong><br />
<strong>Lower</strong> <strong>Washita</strong> Region<br />
Aquifer<br />
Portion <strong>of</strong> Region<br />
Overlaying Aquifer<br />
Recharge<br />
Rate<br />
Current<br />
Groundwater<br />
Rights<br />
Aquifer Storage<br />
in Region<br />
Equal Proportionate<br />
Share<br />
Groundwater<br />
Available for<br />
New Permits<br />
Name Type Class 1 Percent Inch/Yr AFY AF AFY/Acre AFY<br />
Antlers Bedrock Major 19% 0.3-1.7 44,100 10,894,000 2.1 1,461,100<br />
Arbuckle-Simpson Bedrock Major 5% 5.58 21,400 5,756,000 temporary 2 384,000<br />
Canadian River Alluvial Major
The Canadian River aquifer consists <strong>of</strong> clay<br />
and silt downgrading to fine- to coarsegrained<br />
sand with lenses <strong>of</strong> basal gravel.<br />
Formation thickness ranges from 20 to 40 feet<br />
in the alluvium with a maximum <strong>of</strong> 50 feet in<br />
the terrace deposits. Yields in the alluvium<br />
range between 100 and 400 gpm and between<br />
50 and 100 gpm in the terrace. The water is<br />
a very hard calcium bicarbonate type with<br />
TDS concentrations <strong>of</strong> approximately 1,000<br />
mg/L. However, the water is generally suitable<br />
for most municipal and industrial uses. The<br />
aquifer underlies a small portion <strong>of</strong> Basin 15.<br />
The Gerty Sand alluvial aquifer consists <strong>of</strong><br />
gravel, sand, silt, clay, and volcanic ash. The<br />
saturated thickness varies from 5 to 75 feet,<br />
averaging 28 feet. Depth to water ranges from<br />
10 to 110 feet. Typical well yields vary from<br />
100 to 450 gpm with some wells yielding as<br />
much as 850 gpm. <strong>Water</strong> quality is fair to good<br />
and moderately hard with TDS values usually<br />
less than 1,000 mg/L. This aquifer underlies<br />
portions <strong>of</strong> Basin 14.<br />
The <strong>Washita</strong> River alluvial aquifer consists <strong>of</strong><br />
silt and clays downgrading into fine to coarse<br />
sand. Wells in this aquifer yield from 200 to<br />
500 gpm, while formation deposits average<br />
70 feet in thickness. The water is hard to very<br />
hard and generally <strong>of</strong> a calcium magnesium<br />
bicarbonate type. TDS values are usually<br />
less than 1,000 mg/L. This aquifer underlies<br />
portions <strong>of</strong> Basins 14, 15, and 16.<br />
The Red River alluvial aquifer, underlying<br />
southern portions <strong>of</strong> basins 21, 22, and<br />
23, consists <strong>of</strong> clay, sandy clay, sand, and<br />
gravel. Located in Jefferson, Love, and Bryan<br />
Counties, the aquifer supplies water for<br />
Municipal and Industrial, Crop Irrigation,<br />
and domestic purposes. The average saturated<br />
thickness is estimated to be around 20-30 feet;<br />
however, little data are available concerning<br />
the aquifer and its potential as a major source<br />
<strong>of</strong> groundwater.<br />
delineated minor alluvial<br />
aquifers. Minor Minor<br />
bedrock aquifers may have<br />
a significant amount <strong>of</strong><br />
water in storage and high<br />
recharge rates, but generally<br />
low yields <strong>of</strong> less than 50<br />
gpm per well. Groundwater<br />
from minor aquifers is an<br />
important source <strong>of</strong> water<br />
for domestic and stock<br />
water use for individuals in<br />
outlying areas not served<br />
by rural water systems, but<br />
may have insufficient yields<br />
for large-volume users.<br />
Groundwater <strong>Resources</strong><br />
<strong>Lower</strong> <strong>Washita</strong> Region<br />
Minor bedrock aquifers in the region<br />
include the El Reno, Marietta, Texoma, and<br />
Woodbine bedrock aquifers; there are no<br />
The major bedrock aquifers in the <strong>Lower</strong> <strong>Washita</strong> Region are the Antlers, Arbuckle-Simpson, and Rush<br />
Springs. Major alluvial aquifers in the region are the Canadian River, Gerty Sand, Red River, and <strong>Washita</strong><br />
River. Major bedrock aquifers are defined as those that have an average water well yield <strong>of</strong> at least 50<br />
gpm; major alluvial aquifers are those that yield, on average, at least 150 gpm.<br />
10 <strong>Lower</strong> <strong>Washita</strong> Regional Report <strong>Oklahoma</strong> Comprehensive <strong>Water</strong> Plan
Permit Availability<br />
For OCWP water availability analysis, “permit<br />
availability” pertains to the amount <strong>of</strong> water<br />
that could be made available for withdrawals<br />
under permits issued in accordance with<br />
<strong>Oklahoma</strong> water law.<br />
If water authorized by a stream water<br />
right is not put to beneficial use within<br />
the specified time, the OWRB may<br />
reduce or cancel the unused amount and<br />
return the water to the public domain for<br />
appropriation to others.<br />
Projections indicate that there will be surface<br />
water available for new permits through 2060<br />
in all basins, except Basin 16, in the <strong>Lower</strong><br />
<strong>Washita</strong> Region. For groundwater, equal<br />
proportionate shares in the <strong>Lower</strong> <strong>Washita</strong><br />
Region range from 0.65 acre-foot per year<br />
(AFY) per acre to 2.1 AFY per acre. Results<br />
<strong>of</strong> the Arbuckle-Simpson Hydrology Study<br />
indicate that in order to comply with 2003<br />
Senate Bill 288, the equal proportionate share<br />
will be significantly lower than the current 2<br />
AFY/acre allocation for temporary permits.<br />
Surface <strong>Water</strong> Permit Availability<br />
<strong>Oklahoma</strong> stream water laws are based on riparian and prior<br />
appropriation doctrines. Riparian rights to a reasonable use <strong>of</strong><br />
water, in addition to domestic use, are not subject to permitting or<br />
oversight by the OWRB. An appropriative right to stream water is<br />
based on the prior appropriation doctrine, which is <strong>of</strong>ten described<br />
as “first in time, first in right.” If a water shortage occurs, the<br />
diverter with the older appropriative water right will have first right<br />
among other appropriative right holders to divert the available<br />
water up to the authorized amount.<br />
To determine surface water permit availability in each OCWP<br />
planning basin in 2060, the analysis utilized OWRB protocol to<br />
estimate the average annual streamflow at the basin’s outlet point,<br />
accounting for both existing and anticipated water uses upstream<br />
and downstream, including legal obligations, such as those<br />
associated with domestic use and interstate compact requirements.<br />
Surface <strong>Water</strong> Permit Availability<br />
<strong>Lower</strong> <strong>Washita</strong> Region<br />
Groundwater Permit Availability<br />
Groundwater available for permits in <strong>Oklahoma</strong> is generally<br />
based on the amount <strong>of</strong> land owned or leased that overlies a<br />
specific aquifer. For unstudied aquifers, temporary permits are<br />
granted allocating 2 AFY/acre. For studied aquifers, an “equal<br />
proportionate share” (EPS) is established based on the maximum<br />
annual yield <strong>of</strong> water in the aquifer, which is then allocated to each<br />
acre <strong>of</strong> land overlying the groundwater basin. Once an EPS has<br />
been established, temporary permits are then converted to regular<br />
permits and all new permits are based on the EPS.<br />
For OCWP analysis, the geographical area overlying all aquifers in<br />
each basin was determined and the respective EPS or temporary<br />
permit allocations were applied. Total current and anticipated<br />
future permit needs were then calculated to project remaining<br />
groundwater permit availability.<br />
Groundwater Permit Availability<br />
<strong>Lower</strong> <strong>Washita</strong> Region<br />
Projections indicate that there will be surface water available for<br />
new permits through 2060 in all basins in the <strong>Lower</strong> <strong>Washita</strong><br />
Region except Basin 16.<br />
Projections indicate that there will be groundwater available for new<br />
permits through 2060 in all basins in the <strong>Lower</strong> <strong>Washita</strong> Region.<br />
<strong>Oklahoma</strong> Comprehensive <strong>Water</strong> Plan<br />
<strong>Lower</strong> <strong>Washita</strong> Regional Report 11
<strong>Water</strong> Quality<br />
<strong>Water</strong> quality <strong>of</strong> the <strong>Lower</strong> <strong>Washita</strong><br />
<strong>Water</strong>shed Planning Region is defined by<br />
numerous water supply reservoirs and the<br />
middle Red River watershed, including the<br />
<strong>Washita</strong> River and Mud Creek. The area<br />
is dominated by the Cross Timbers (CT)<br />
ecoregion but has peripheral influences from<br />
the Central Great Plains (CGP).<br />
The sub-ecoregions <strong>of</strong> the Cross Timbers run<br />
throughout much <strong>of</strong> the planning region. While<br />
the Northwestern Cross Timbers co-dominates in<br />
the north along with the Central Great Plains, an<br />
assortment <strong>of</strong> various sub-ecoregions are intermixed<br />
in the south. To the west and south are<br />
the Western and Eastern Cross Timbers; along<br />
the east central edge, but disconnected, lies the<br />
Northern Cross Timbers. Except for vegetation<br />
density, growing season, and floristic differences,<br />
these areas are similar. They are comprised <strong>of</strong><br />
rolling hills, Cuestas, and ridges with dense oak<br />
savanna interspersed with prairie, rangeland<br />
and cropland. The Eastern and Western Cross<br />
Timbers are mostly underlain by sandstone, shale,<br />
and clay, while limestone becomes prevalent in<br />
both the Northern and Eastern Cross Timbers.<br />
Streams are morphologically diverse. While many<br />
are shallow with sandy soils, others have gravel/<br />
cobble bottoms with deep pools and riffles. While<br />
native habitat impacts ecological diversity, it<br />
is affected mostly by habitat degradation and<br />
sedimentation. Representative waterbodies in<br />
the Eastern Cross Timbers include the <strong>Lower</strong><br />
<strong>Washita</strong> River and Hickory Creek as well as<br />
Murray, Texoma and Carter Lakes. In the Western<br />
Cross Timbers, Walnut Bayou and Healdton<br />
Lake Trophic Status<br />
A lake’s trophic state, essentially a measure <strong>of</strong> its<br />
biological productivity, is a major determinant <strong>of</strong><br />
water quality.<br />
Oligotrophic: Low primary productivity and/or low<br />
nutrient levels.<br />
Mesotrophic: Moderate primary productivity with<br />
moderate nutrient levels.<br />
Eutrophic: High primary productivity and nutrient rich.<br />
Hypereutrophic: Excessive primary productivity<br />
and excessive nutrients.<br />
Lake are more typical, and in the Northern Cross<br />
Timbers, representative waters would be Chigley<br />
and Kickapoo Sandy Creeks, R.C.<br />
Longmire and Arbuckle Lakes. Stream<br />
salinity is variable. On Hickory and<br />
the Sandy Creeks, salinity is moderate<br />
with mean conductivity from 510 μS/<br />
cm (Hickory) to near 620 μS/cm on<br />
Kickapoo Sandy Creek. On Walnut<br />
Bayou and along the <strong>Washita</strong> River,<br />
conductivity means are high, from 915-1175<br />
μS/cm. Lake conductivity is moderate,<br />
ranging from 200-400 μS/cm. However, Lake<br />
Texoma varies from 900 μS/cm (<strong>Washita</strong> arm)<br />
to greater than 3,500 μS/cm (Red River arm).<br />
Stream nutrient concentrations are low in the<br />
Eastern and Western Cross Timbers with mean<br />
total phosphorus (TP) from 0.04-0.06 ppm and<br />
mean total nitrogen (TN) from 0.35-0.40 ppm.<br />
On the Sandy Creeks, nutrient values are higher<br />
with TP <strong>of</strong> 0.07-0.13 ppm and TN <strong>of</strong> 0.55-1.15<br />
ppm. The <strong>Washita</strong> River is hyper-eutrophic<br />
with mean TP <strong>of</strong> 0.40 ppm and TN <strong>of</strong> 1.73 ppm.<br />
All lakes are phosphorus limited and vary from<br />
oligotrophic (Carter and Murray) to mesotrophic<br />
(Healdton) to eutrophic (Arbuckle, Longmire, and<br />
Texoma). Texoma is hyper-eutrophic on the upper<br />
Red River arm. <strong>Water</strong> clarity is highly variable,<br />
ranging from nearly excellent to very poor. In<br />
the Eastern and Western Cross Timbers, both<br />
Walnut Bayou and Hickory Creek have turbidity<br />
means <strong>of</strong> 14 NTU, while turbidity varies from 42<br />
on Chigley Sandy to 66 NTU on Kickapoo Sandy.<br />
Mean turbidity on the <strong>Washita</strong> River is 172 NTU.<br />
Likewise, lake clarity is excellent on Arbuckle,<br />
Carter, and Murray (mean Secchi depth = 120-<br />
180cm) but poor on Healdton (Secchi = 34 cm).<br />
On Texoma, the <strong>Washita</strong> arm and main lake have<br />
excellent clarity (114-143 cm) but is average to<br />
good along the upper (36 cm) and <strong>Lower</strong> (82 cm)<br />
Red River arms.<br />
Adjacent to and interspersed among the<br />
previous ecoregions lay the Arbuckle<br />
Mountains and Uplift with significant relief,<br />
ledges, and ravines along the mountains giving<br />
way to rolling hills and plains along the uplift.<br />
The area is underlain by limestone, dolomite,<br />
sandstone, and shale with significant granite<br />
outcroppings. Oak savanna and grasslands<br />
Ecoregions<br />
<strong>Lower</strong> <strong>Washita</strong> Region<br />
The <strong>Lower</strong> <strong>Washita</strong> Planning Region is a transitional area with significant contributions<br />
from the Cross Timbers and Central Great Plains. <strong>Water</strong> quality is highly influenced by<br />
both geology and land use practices and ranges from poor to excellent depending on<br />
drainage and location.<br />
12 <strong>Lower</strong> <strong>Washita</strong> Regional Report <strong>Oklahoma</strong> Comprehensive <strong>Water</strong> Plan
dominate the plains and hills while much <strong>of</strong><br />
the uplands are dominated by post-blackjack<br />
oak, winged-elm stands and prairie. Streams<br />
are mostly formed <strong>of</strong> gravel/cobble/<br />
bedrock and are typically clear.<br />
Gradients are high to moderate.<br />
Ecological diversity - as represented<br />
by Pennington, Mill, and Oil Creeks<br />
as well as Jean Neustadt and Ardmore<br />
City Lakes - is higher than anywhere in<br />
the Cross Timbers but may be affected<br />
by habitat degradation. Stream salinity is<br />
moderate, increasing from east (Pennington<br />
= 410 μS/cm) to west (Oil = 550 μS/cm), and<br />
lake conductivity ranges from 220-360 μS/<br />
cm. Stream nutrient concentrations also vary<br />
east to west. Pennington mean TP and TN<br />
equal 0.05 and 0.33 ppm. Mean TP and TN<br />
values are 0.10 and 0.80 ppm on Oil Creek.<br />
Both Jean Neustadt and Ardmore City Lakes<br />
are phosphorus limited and eutrophic. Stream<br />
clarity is excellent on both Pennington and Oil<br />
Creeks (6-7 NTU) and good on Mill (26 NTU).<br />
Lake clarity ranges from good on Neustadt (76<br />
cm) to excellent on Ardmore City (106 cm).<br />
The northern area <strong>of</strong> the region is codominated<br />
by the Northwestern Cross<br />
Timbers, Prairie Tablelands, and Cross<br />
Timbers Transition <strong>of</strong> the Central Great<br />
Plains. The Transition area consists <strong>of</strong> a hybrid<br />
mix <strong>of</strong> rough plains and oak/elm forests that<br />
dominate much <strong>of</strong> the ecoregion, while the<br />
Cross Timbers have much more extended<br />
stands <strong>of</strong> oak/elm forests and more relief<br />
including broad canyons. Sandstone underlies<br />
much <strong>of</strong> the area. The Prairie Tablelands are<br />
nearly flat with some relief and also underlain<br />
by sandstone and siltstone. Cropland is more<br />
prevalent in the transition and tablelands<br />
with rangeland and cropland along the Cross<br />
Timbers. Streams in this area are mostly<br />
sandy bottom with low to nearly moderate<br />
gradients. In the tablelands, streams are<br />
mostly shallow, low gradient, and choked<br />
by silt; gravel substrates exist in areas with<br />
relief. Ecological diversity is lower than in<br />
most parts <strong>of</strong> the Cross Timbers but higher<br />
than in much <strong>of</strong> the Central Great Plains.<br />
Diversity is impacted by habitat degradation,<br />
<strong>Oklahoma</strong> Comprehensive <strong>Water</strong> Plan<br />
<strong>Water</strong> Quality Standards Implementation<br />
<strong>Lower</strong> <strong>Washita</strong> Region<br />
The <strong>Oklahoma</strong> Department <strong>of</strong> Environmental Quality has completed TMDL studies on Oil<br />
Creek, Chigley Sandy Creek, Sand Creek, Roaring Creek, Laflin Creek, and Bitter Creek.<br />
Several other TMDL studies are underway or scheduled.<br />
<strong>Water</strong> Quality Standards and<br />
Implementation<br />
The <strong>Oklahoma</strong> <strong>Water</strong> Quality Standards<br />
(OWQS) are the cornerstone <strong>of</strong> the state’s<br />
water quality management programs. The<br />
OWQS are a set <strong>of</strong> rules promulgated under<br />
the federal Clean <strong>Water</strong> Act and state statutes,<br />
designed to maintain and protect the quality<br />
<strong>of</strong> the state’s waters. The OWQS designate<br />
beneficial uses for streams, lakes, other bodies<br />
<strong>of</strong> surface water, and groundwater that has a<br />
mean concentration <strong>of</strong> Total Dissolved Solids<br />
(TDS) <strong>of</strong> 10,000 milligrams per liter or less.<br />
Beneficial uses are the activities for which a<br />
waterbody can be used based on physical,<br />
chemical, and biological characteristics as<br />
well as geographic setting, scenic quality,<br />
and economic considerations. Beneficial<br />
uses include categories such as Fish and<br />
Wildlife Propagation, Public and Private <strong>Water</strong><br />
Supply, Primary (or Secondary) Body Contact<br />
Recreation, Agriculture, and Aesthetics.<br />
The OWQS also contain standards for<br />
maintaining and protecting these uses.<br />
The purpose <strong>of</strong> the OWQS is to promote<br />
and protect as many beneficial uses as are<br />
attainable and to assure that degradation <strong>of</strong><br />
existing quality <strong>of</strong> waters <strong>of</strong> the state does not<br />
occur.<br />
The OWQS are applicable to all activities<br />
which may affect the water quality <strong>of</strong> waters<br />
<strong>of</strong> the state, and are to be utilized by all state<br />
environmental agencies in implementing<br />
their programs to protect water quality. Some<br />
examples <strong>of</strong> these implementation programs<br />
are permits for point source (e.g. municipal<br />
and industrial) discharges into waters <strong>of</strong> the<br />
state; authorizations for waste disposal from<br />
concentrated animal feeding operations;<br />
regulation <strong>of</strong> run<strong>of</strong>f from nonpoint sources;<br />
and corrective actions to clean up polluted<br />
waters.<br />
More information about OWQS and the latest<br />
revisions can be found on the OWRB website.<br />
<strong>Lower</strong> <strong>Washita</strong> Regional Report 13
<strong>Water</strong> Quality Impairments<br />
A waterbody is considered to be impaired<br />
when its quality does not meet the<br />
standards prescribed for its beneficial<br />
uses. For example, impairment <strong>of</strong> the<br />
Public and Private <strong>Water</strong> Supply beneficial<br />
use means the use <strong>of</strong> the waterbody<br />
as a drinking water supply is hindered.<br />
Impairment <strong>of</strong> the Agricultural use means<br />
the use <strong>of</strong> the waterbody for livestock<br />
watering, irrigation or other agricultural<br />
uses is hindered. Impairments can exist<br />
for other uses such as Fish and Wildlife<br />
Propagation or Recreation.<br />
The Beneficial Use Monitoring Program<br />
(BUMP), established in 1998 to<br />
document and quantify impairments <strong>of</strong><br />
assigned beneficial uses <strong>of</strong> the state’s<br />
lakes and streams, provides information<br />
for supporting and updating the<br />
OWQS and prioritizing pollution control<br />
programs. A set <strong>of</strong> rules known as “use<br />
support assessment protocols” is also<br />
used to determine whether beneficial uses<br />
<strong>of</strong> waterbodies are being supported.<br />
In an individual waterbody, after<br />
impairments have been identified, a Total<br />
Maximum Daily Load (TMDL) study is<br />
conducted to establish the sources <strong>of</strong><br />
impairments—whether from point sources<br />
(discharges) or non-point sources (run<strong>of</strong>f).<br />
The study will then determine the amount<br />
<strong>of</strong> reduction necessary to meet the<br />
applicable water quality standards in that<br />
waterbody and allocate loads among the<br />
various contributors <strong>of</strong> pollution.<br />
For more detailed review <strong>of</strong> the state’s<br />
water quality conditions, see the most<br />
recent versions <strong>of</strong> the OWRB’s BUMP<br />
Report, and the <strong>Oklahoma</strong> Integrated<br />
<strong>Water</strong> Quality Assessment Report, a<br />
comprehensive assessment <strong>of</strong> water<br />
quality in <strong>Oklahoma</strong>’s streams and lakes<br />
required by the federal Clean <strong>Water</strong> Act<br />
and developed by the ODEQ.<br />
channelization, and sedimentation. The<br />
Northwestern Timbers are best represented<br />
by Wildhorse Creek and several lakes,<br />
including Taylor (Marlow), Fuqua,<br />
Clear Creek, Duncan, Humphreys,<br />
and Louis Burtschi. The <strong>Washita</strong><br />
River near Anadarko and Pauls Valley,<br />
as well as Ionine (tablelands) and Finn<br />
(transition) Creeks, exemplify the plains<br />
ecoregions. Lake Chickasha is a good<br />
example <strong>of</strong> the tablelands, whereas Pauls<br />
Valley and Wiley Post are example lakes<br />
for the Cross Timbers Transition. Stream<br />
salinity is high throughout all three regions<br />
with conductivity means ranging from<br />
near 700 μS/cm on Finn Creek to greater<br />
than 2,000 μS/cm on Ionine Creek. Means<br />
on Wildhorse Creek and the <strong>Washita</strong> River<br />
range from 1,100-1,685 μS/cm. Lake salinity is<br />
highly variable. In the lower Cross Timbers,<br />
lake salinity is moderate, varying from less<br />
than 250 to greater than 600 μS/cm; in the<br />
transition area, Wiley Post and Pauls Valley<br />
are lower, ranging from just over 200 to nearly<br />
360 μS/cm. However, salinity is much higher<br />
in the northern portions with Burtschi greater<br />
than 1,100 and Chickasha greater than 2,000<br />
μS/cm. The <strong>Washita</strong> River throughout is<br />
hyper-eutrophic with TP means from 0.36-0.58<br />
ppm and TN means from 1.62-1.86. In other<br />
areas, TP and TN vary from 0.09 and 0.49 ppm<br />
on Wildhorse Creek to a TP <strong>of</strong> 0.23 ppm on<br />
Finn Creek and a TN <strong>of</strong> 0.83 on Ionine Creek.<br />
Lakes are phosphorus limited with varying<br />
levels <strong>of</strong> cultural eutrophication. While<br />
nearly all lakes are eutrophic, Pauls Valley<br />
has remained mesotrophic while Burtschi,<br />
Chickasha, and Taylor have progressed to<br />
hyper-eutrophic. Clarity is average to nearly<br />
poor on most creeks with both Finn and Ionine<br />
turbidity less than 50 NTU. However, with<br />
turbidity means from 76 to 214, the <strong>Washita</strong><br />
has poor to very poor clarity. Lake clarity is<br />
poor (Wiley Post = 16 cm) to good (Burtschi =<br />
72 cm) with all other lakes fair to average.<br />
The Broken Red Plains intersect the planning<br />
region along the southwestern corner.<br />
Although more irregular than most <strong>of</strong> the<br />
Central Great Plains, it has much less relief<br />
<strong>Water</strong> Quality Impairments<br />
<strong>Lower</strong> <strong>Washita</strong> Region<br />
Regional water quality impairments based on the 2008 <strong>Oklahoma</strong> Integrated <strong>Water</strong> Quality<br />
Assessment Report. Surface waters in this region are impacted by excessive levels <strong>of</strong> turbidity.<br />
14 <strong>Lower</strong> <strong>Washita</strong> Regional Report <strong>Oklahoma</strong> Comprehensive <strong>Water</strong> Plan
than surrounding ecoregions <strong>of</strong> the CT or<br />
CGP. Soils are characteristically sandy and<br />
the area is grassland dominated with low<br />
density scrub forests. Land uses include<br />
cropland/rangeland. Creeks are mostly sand/<br />
silt with low gradients and little diversity,<br />
which is affected by habitat degradation,<br />
channelization, and sedimentation. The Red<br />
River and Mud Creek, as well as Comanche<br />
Lake, exemplify the area. Stream salinity is<br />
high. Mud Creek mean conductivity is nearly<br />
800 μS/cm but the Red is nearly 5,000 μS/cm<br />
with significant upstream effects. Comanche<br />
remains moderate, ranging from 260-345 μS/<br />
cm. Streams are hyper-eutrophic with TP<br />
means <strong>of</strong> 0.40-0.45 ppm and TN ranging from<br />
1.25-1.86 ppm. Comanche Lake is phosphorus<br />
limited and hyper-eutrophic. Stream clarity<br />
is poor with turbidity means <strong>of</strong> 118-127 NTU;<br />
lake clarity is good at 82 cm.<br />
Surface <strong>Water</strong>s<br />
with Designated Beneficial Use<br />
for Public/Private <strong>Water</strong> Supply<br />
<strong>Lower</strong> <strong>Washita</strong> Region<br />
Surface <strong>Water</strong>s<br />
with Designated Beneficial Use<br />
for Agriculture<br />
<strong>Lower</strong> <strong>Washita</strong> Region<br />
The <strong>Lower</strong> <strong>Washita</strong> region is underlain by<br />
several alluvial and bedrock aquifers. Although<br />
a statewide groundwater water quality program<br />
does not exist in <strong>Oklahoma</strong>, various aquifer studies<br />
have been completed and data are available from<br />
various sources. Alluvial aquifers include the<br />
Canadian, Red, and <strong>Washita</strong> River alluvium and<br />
terrace. In most alluvial aquifers in the region,<br />
water quality is good and, except for hardness<br />
and localized nitrate problems, the water is<br />
appropriate for domestic, irrigation, industrial and<br />
municipal use. Thick deposits <strong>of</strong> salt and gypsum<br />
occur in many Permian-age formations creating<br />
high chloride and sulfate concentrations, which<br />
can migrate into portions <strong>of</strong> alluvial aquifers. The<br />
Canadian River alluvium is predominantly <strong>of</strong> a<br />
calcium magnesium bicarbonate type and variable<br />
in dissolved solids content, while the Red River<br />
alluvium typically has much higher concentrations<br />
<strong>of</strong> dissolved solids. They are generally suitable for<br />
most purposes. However, the alluvium and terrace<br />
aquifers are highly vulnerable to contamination<br />
from surface activities due to their high porosities<br />
and permeabilities and shallow water tables.<br />
Major bedrock aquifers in the region include the<br />
Antlers, Rush Springs Sandstone, and Arbuckle-<br />
Simpson. The Rush Springs Sandstone extends into<br />
the northwestern portion <strong>of</strong> the region. Although<br />
comparatively hard, most <strong>of</strong> its water is suitable for<br />
domestic, municipal, irrigation and industrial use<br />
with total dissolved solids (TDS) values generally<br />
less than 500 ppm. However, sulfate and nitrate<br />
concentrations exceed drinking water standards<br />
in some areas. The Antlers Sandstone formation<br />
underlies the southeastern part <strong>of</strong> the region and<br />
water quality is generally good with dissolved solids<br />
between 200 and 1,000 mg/L. <strong>Water</strong> is slightly<br />
saline in the south with dissolved solids greater<br />
than 1,000 ppm. It is suitable for most uses but the<br />
ODEQ has identified several monitoring wells in this<br />
aquifer with elevated nitrate levels and some wells<br />
show consistently low pH values. The Arbuckle-<br />
Simpson aquifer underlies part <strong>of</strong> the region’s<br />
eastern area; water is generally hard and <strong>of</strong> a calcium<br />
bicarbonate or calcium magnesium bicarbonate<br />
type. Pennington, Mill, and Oil Creeks, as well<br />
as Honey and Travertine Creeks, originate from<br />
headwater springs in the Arbuckle-Simpson. Most<br />
<strong>of</strong> the water in the aquifer is suitable for all regulated<br />
uses, including public drinking water supplies.<br />
Dissolved solids concentrations are low, with a<br />
median concentration <strong>of</strong> 347 mg/L. Some wells and<br />
springs on the edge <strong>of</strong> the aquifer have chloride<br />
and dissolved solids concentrations that exceed<br />
secondary drinking water standards.<br />
<strong>Oklahoma</strong> Comprehensive <strong>Water</strong> Plan<br />
<strong>Lower</strong> <strong>Washita</strong> Regional Report 15
Surface <strong>Water</strong> Protection<br />
The <strong>Oklahoma</strong> <strong>Water</strong> Quality Standards<br />
(OWQS) provide protection for surface<br />
waters in many ways.<br />
Appendix B Areas are designated in the<br />
OWQS as containing waters <strong>of</strong> recreational<br />
and/or ecological significance. Discharges to<br />
waterbodies may be limited in these areas.<br />
Source <strong>Water</strong> Protection Areas are derived<br />
from the state’s Source <strong>Water</strong> Protection<br />
Program, which analyzes existing and potential<br />
threats to the quality <strong>of</strong> public drinking water in<br />
<strong>Oklahoma</strong>.<br />
The High Quality <strong>Water</strong>s designation in the<br />
OWQS refers to waters that exhibit water<br />
quality exceeding levels necessary to support<br />
the propagation <strong>of</strong> fishes, shellfishes, wildlife,<br />
and recreation in and on the water. This<br />
designation prohibits any new point source<br />
discharges or additional load or increased<br />
concentration <strong>of</strong> specified pollutants.<br />
The Sensitive <strong>Water</strong> Supplies (SWS)<br />
designation applies to public and private<br />
water supplies possessing conditions making<br />
them more susceptible to pollution events,<br />
thus requiring additional protection. This<br />
designation restricts point source discharges<br />
in the watershed and institutes a 10 µg/L<br />
(micrograms per liter) chlorophyll-a criterion to<br />
protect against taste and odor problems and<br />
reduce water treatment costs.<br />
Outstanding Resource <strong>Water</strong>s are those<br />
constituting outstanding resources or <strong>of</strong><br />
exceptional recreational and/or ecological<br />
significance. This designation prohibits any new<br />
point source discharges or additional load or<br />
increased concentration <strong>of</strong> specified pollutants.<br />
<strong>Water</strong>s designated as Scenic Rivers in<br />
Appendix A <strong>of</strong> the OWQS are protected<br />
through restrictions on point source discharges<br />
in the watershed. A 0.037 mg/L total<br />
phosphorus criterion is applied to all Scenic<br />
Rivers in <strong>Oklahoma</strong>.<br />
Nutrient-Limited <strong>Water</strong>sheds are those<br />
containing a waterbody with a designated<br />
beneficial use that is adversely affected by<br />
excess nutrients.<br />
Surface <strong>Water</strong> Protection Areas<br />
<strong>Lower</strong> <strong>Washita</strong> Region<br />
Because Wiley Post Memorial Lake, R. C. Longmire Lake, Healdton City Lake, Carter Lake, Madill City Lake, and Elmore City Lake<br />
are public water supply reservoirs and have relatively small watersheds, they could potentially benefit from SWS designations. This<br />
designation could provide protection from new or increased loading from point sources in the watersheds. This additional protection<br />
would also provide limits for algae (chlorophyll a) that can cause taste and odor problems and increased treatment costs.<br />
16 <strong>Lower</strong> <strong>Washita</strong> Regional Report <strong>Oklahoma</strong> Comprehensive <strong>Water</strong> Plan
Groundwater Protection Areas<br />
<strong>Lower</strong> <strong>Washita</strong> Region<br />
Groundwater Protection<br />
The <strong>Oklahoma</strong> <strong>Water</strong> Quality Standards (OWQS) sets<br />
the criteria for protection <strong>of</strong> groundwater quality as<br />
follows: “If the concentration found in the test sample<br />
exceeds [detection limit], or if other substances in<br />
the groundwater are found in concentrations greater<br />
than those found in background conditions, that<br />
groundwater shall be deemed to be polluted and<br />
corrective action may be required.”<br />
Wellhead Protection Areas are established by the<br />
<strong>Oklahoma</strong> Department <strong>of</strong> Environmental Quality (ODEQ)<br />
to improve drinking water quality through the protection<br />
<strong>of</strong> groundwater supplies. The primary goal is to minimize<br />
the risk <strong>of</strong> pollution by limiting potential pollution-related<br />
activities on land around public water supplies.<br />
Oil and Gas Production Special Requirement Areas,<br />
enacted to protect groundwater and/or surface water,<br />
can consist <strong>of</strong> specially lined drilling mud pits (to prevent<br />
leaks and spills) or tanks whose contents are removed<br />
upon completion <strong>of</strong> drilling activities; well set-back<br />
distances from streams and lakes; restrictions on fluids<br />
and chemicals; or other related protective measures.<br />
Nutrient-Vulnerable Groundwater is a designation given<br />
to certain hydrogeologic basins that are designated by<br />
the OWRB as having high or very high vulnerability to<br />
contamination from surface sources <strong>of</strong> pollution. This<br />
designation can impact land application <strong>of</strong> manure for<br />
regulated agriculture facilities.<br />
Class 1 Special Source Groundwaters are those<br />
<strong>of</strong> exceptional quality and particularly vulnerable to<br />
contamination. This classification includes groundwaters<br />
located underneath watersheds <strong>of</strong> Scenic Rivers, within<br />
OWQS Appendix B areas, or underneath wellhead or<br />
source water protection areas.<br />
Appendix H Limited Areas <strong>of</strong> Groundwater are localized<br />
areas where quality is unsuitable for default beneficial<br />
uses due to natural conditions or irreversible humaninduced<br />
pollution.<br />
Various types <strong>of</strong> protection are in place to prevent degradation <strong>of</strong> groundwater and levels <strong>of</strong> vulnerability. The Gerty<br />
and Arbuckle-Simpson aquifers have been identified by the OWRB as highly vulnerable, while the Red River and<br />
<strong>Washita</strong> River alluvial aquifers have been identified as very highly vulnerable. The eastern portion <strong>of</strong> the Arbuckle-<br />
Simpson aquifer has been designated as a sole source aquifer by the U.S. Environmental Protection Agency.<br />
<strong>Oklahoma</strong> Comprehensive <strong>Water</strong> Plan<br />
NOTE: The <strong>State</strong> <strong>of</strong> <strong>Oklahoma</strong> has conducted a<br />
successful surface water quality monitoring program<br />
for more than fifteen years. A new comprehensive<br />
groundwater quality monitoring program is in the<br />
implementation phase and will soon provide a<br />
comparable long-term groundwater resource data set.<br />
<strong>Lower</strong> <strong>Washita</strong> Regional Report 17
<strong>Water</strong> Quality Trends Study<br />
As part <strong>of</strong> the 2012 OCWP Update, OWRB monitoring staff compiled more than ten years<br />
<strong>of</strong> Beneficial Use Monitoring Program (BUMP) data and other resources to initiate an<br />
ongoing statewide comprehensive analysis <strong>of</strong> surface water quality trends.<br />
Reservoir Trends: <strong>Water</strong> quality trends for reservoirs were analyzed for<br />
chlorophyll-a, conductivity, total nitrogen, total phosphorus, and turbidity at sixtyfive<br />
reservoirs across the state. Data sets were <strong>of</strong> various lengths, depending<br />
on the station’s period <strong>of</strong> record. The direction and magnitude <strong>of</strong> trends varies<br />
throughout the state and within regions. However, when considered statewide,<br />
the final trend analysis revealed several notable details.<br />
• Chlorophyll-a and nutrient concentrations continue to increase at a number<br />
<strong>of</strong> lakes. The proportions <strong>of</strong> lakes exhibiting a significant upward trend were<br />
42% for chlorophyll-a, 45% for total nitrogen, and 12% for total phosphorus.<br />
• Likewise, conductivity and turbidity have trended upward over time. Nearly<br />
28% <strong>of</strong> lakes show a significant upward trend in turbidity, while nearly 45%<br />
demonstrate a significant upward trend for conductivity.<br />
Stream Trends: <strong>Water</strong> quality trends for streams were analyzed for conductivity,<br />
total nitrogen, total phosphorus, and turbidity at sixty river stations across the<br />
state. Data sets were <strong>of</strong> various lengths, depending on the station’s period <strong>of</strong><br />
record, but generally, data were divided into historical and recent datasets and<br />
analyzed separately and as a whole. The direction and magnitude <strong>of</strong> trends varies<br />
throughout the state and within regions. However, when considered statewide, the<br />
final trend analysis revealed several notable details.<br />
• Total nitrogen and phosphorus are very different when comparing period <strong>of</strong><br />
record to more recent data. When considering the entire period <strong>of</strong> record,<br />
approximately 80% <strong>of</strong> stations showed a downward trend in nutrients. However,<br />
if only the most recent data (approximately 10 years) are considered, the<br />
percentage <strong>of</strong> stations with a downward trend decreases to 13% for nitrogen<br />
and 30% for phosphorus. The drop is accounted for in stations with either<br />
significant upward trends or no detectable trend.<br />
• Likewise, general turbidity trends have changed over time. Over the entire period<br />
<strong>of</strong> record, approximately 60% <strong>of</strong> stations demonstrated a significant upward<br />
trend. However, more recently, that proportion has dropped to less than 10%.<br />
• Similarly, general conductivity trends have changed over time, albeit less<br />
dramatically. Over the entire period <strong>of</strong> record, approximately 45% <strong>of</strong> stations<br />
demonstrated a significant upward trend. However, more recently, that<br />
proportion has dropped to less than 30%.<br />
Typical Impact <strong>of</strong> Trends Study Parameters<br />
Chlorophyll-a is a measure <strong>of</strong> algae growth. When algae growth increases, there is an<br />
increased likelihood <strong>of</strong> taste and odor problems in drinking water as well as aesthetic<br />
issues.<br />
Conductivity is a measure <strong>of</strong> the ability <strong>of</strong> water to pass electrical current. In water,<br />
conductivity is affected by the presence <strong>of</strong> inorganic dissolved solids, such as chloride,<br />
nitrate, sulfate, and phosphate anions (ions that carry a negative charge) or sodium,<br />
magnesium, calcium, iron, and aluminum cations (ions that carry a positive charge).<br />
Conductivity in streams and rivers is heavily dependent upon regional geology and<br />
discharges. High specific conductance indicates high concentrations <strong>of</strong> dissolved solids,<br />
which can affect the suitability <strong>of</strong> water for domestic, industrial, agricultural, and other<br />
uses. At higher conductivity levels, drinking water may have an unpleasant taste or odor or<br />
may even cause gastrointestinal distress. High concentration may also cause deterioration<br />
<strong>of</strong> plumbing fixtures and appliances. Relatively expensive water treatment processes,<br />
such as reverse osmosis, are required to remove excessive dissolved solids from water.<br />
Concerning agriculture, most crops cannot survive if the salinity <strong>of</strong> the water is too high.<br />
Total Nitrogen is a measure <strong>of</strong> all dissolved and suspended nitrogen in a water sample.<br />
It includes kjeldahl nitrogen (ammonia + organic), nitrate, and nitrite nitrogen. It is<br />
naturally abundant in the environment and is a key element necessary for growth <strong>of</strong><br />
plants and animals. Excess nitrogen from polluting sources can lead to significant water<br />
quality problems, including harmful algal blooms, hypoxia, and declines in wildlife and<br />
habitat.<br />
Total Phosphorus is one <strong>of</strong> the key elements necessary for growth <strong>of</strong> plants and animals.<br />
Excess phosphorus leads to significant water quality problems, including harmful algal<br />
blooms, hypoxia, and declines in wildlife and habitat. Increases in total phosphorus can<br />
lead to excessive growth <strong>of</strong> algae, which can increase taste and odor problems in drinking<br />
water as well as increased costs for treatment.<br />
Turbidity refers to the clarity <strong>of</strong> water. The greater the amount <strong>of</strong> total suspended<br />
solids (TSS) in the water, the murkier it appears and the higher the measured turbidity.<br />
Increases in turbidity can increase treatment costs and have negative effects on aquatic<br />
communities by reducing light penetration.<br />
18 <strong>Lower</strong> <strong>Washita</strong> Regional Report <strong>Oklahoma</strong> Comprehensive <strong>Water</strong> Plan
Reservoir <strong>Water</strong> Quality Trends<br />
<strong>Lower</strong> <strong>Washita</strong> Region<br />
Arbuckle Lake Lake Chickasha Lake Fuqua Lake Murray Pauls Valley Lake Lake Texoma<br />
Parameter<br />
(1996-2009) (1994-2007) (1994-2007) (1995-2009) (1995-2008) (1998-2009)<br />
Chlorophyll-a (mg/m3) NT NT NT NT<br />
Conductivity (us/cm)<br />
NT<br />
Total Nitrogen (mg/L) NT NT NT<br />
Total Phosphorus (mg/L) NT NT NT NT NT<br />
Turbidity (NTU) NT NT NT<br />
Increasing Trend Decreasing Trend NT = No significant trend detected<br />
Trend magnitude and statistical confidence levels vary for each site. Site-specific information can be obtained from the OWRB <strong>Water</strong> Quality Division.<br />
Notable concerns for reservoir water quality include the following:<br />
• Significant upward trend for conductivity on numerous reservoirs.<br />
• Significant upward trend for total nitrogen on Arbuckle and Chickasha reservoirs.<br />
• Significant upward trend for turbidity on Arbuckle and Texoma reservoirs.<br />
Stream <strong>Water</strong> Quality Trends<br />
<strong>Lower</strong> <strong>Washita</strong> Region<br />
Parameter<br />
Mud Creek near Courtney Red River near Terral, OK <strong>Washita</strong> River near Anadarko <strong>Washita</strong> River near Durwood <strong>Washita</strong> River near Pauls Valley<br />
All Data Trend<br />
(1975-1993,<br />
1998-2009)1<br />
Recent Trend<br />
(1998-2009)<br />
All Data Trend<br />
(1967-1995,<br />
1998-2009)1<br />
Recent Trend<br />
(1998-2009)<br />
All Data Trend<br />
(1964-1993,<br />
1999-2009)1<br />
Recent Trend<br />
(1999-2009)<br />
All Data Trend<br />
(1946-1995,<br />
1996-2009)1<br />
Recent Trend<br />
(1996-2009)<br />
All Data Trend<br />
(1998-2009)1<br />
Conductivity (us/cm) NT NT NT NT<br />
Total Nitrogen (mg/L) NT NT<br />
Total Phosphorus (mg/L) NT NT NT NT NT NT<br />
Turbidity (NTU) NT NT<br />
Recent Trend<br />
(1998-2009)<br />
Increasing Trend Decreasing Trend NT = No significant trend detected<br />
Trend magnitude and statistical confidence levels vary for each site. Site-specific information can be obtained from the OWRB <strong>Water</strong> Quality Division.<br />
1 Date ranges for analyzed data represent the earliest site visit date and may not be representative <strong>of</strong> all parameters.<br />
Notable concerns for stream water quality include the following:<br />
• Significant upward trend for total nitrogen and phosphorus on the <strong>Washita</strong> River.<br />
• Significant upward trend for period <strong>of</strong> record turbidity throughout region.<br />
<strong>Oklahoma</strong> Comprehensive <strong>Water</strong> Plan<br />
<strong>Lower</strong> <strong>Washita</strong> Regional Report 19
<strong>Water</strong> Demand<br />
<strong>Water</strong> needs in the <strong>Lower</strong> <strong>Washita</strong> Region<br />
account for about 4% <strong>of</strong> the total statewide<br />
demand. Regional demand will increase by<br />
46% (36,790 AFY) from 2010 to 2060. The<br />
majority <strong>of</strong> the demand and growth in demand<br />
over this period will be in the Crop Irrigation<br />
and Municipal and Industrial sectors.<br />
Municipal and Industrial (M&I) demand is<br />
projected to account for approximately 42%<br />
<strong>of</strong> the region’s 2060 demand. Currently, 62%<br />
<strong>of</strong> the demand from this sector is supplied by<br />
surface water, 9% by alluvial groundwater, and<br />
29% by bedrock groundwater.<br />
Crop Irrigation demand is expected to account<br />
for 36% <strong>of</strong> the 2060 demand. Currently, 36%<br />
<strong>of</strong> the demand from this sector is supplied by<br />
surface water, 11% by alluvial groundwater,<br />
and 53% by bedrock groundwater.<br />
Predominant irrigated crops in the <strong>Lower</strong><br />
<strong>Washita</strong> Region include pasture grasses,<br />
wheat, and peanuts.<br />
Oil and Gas demand is projected to account<br />
for approximately 9% <strong>of</strong> the 2060 demand.<br />
Currently, 84% <strong>of</strong> the demand from this sector<br />
is supplied by surface water, 3% by alluvial<br />
groundwater, and 13% by bedrock groundwater.<br />
The demand forecast developed in accordance<br />
with the O&G work group estimates that<br />
2050 and 2060 demands in seven counties<br />
will drop below the 2010 demand level (due<br />
to Woodford Shale being played out). As a<br />
conservative approach, this assumption is not<br />
explicitly carried over into the Gap Analysis.<br />
Instead, where applicable, basin demands<br />
(in the <strong>Lower</strong> <strong>Washita</strong> Region, Basin 22) are<br />
assumed to never fall below the 2010 base year<br />
demand levels. This is reflected in the Region<br />
and Basin Total Demand by Sector tables.<br />
Livestock demand is projected to account for<br />
8% <strong>of</strong> the 2060 demand. Currently, 35% <strong>of</strong> the<br />
demand from this sector is supplied by surface<br />
water, 12% by alluvial groundwater, and<br />
53% by bedrock groundwater.<br />
Livestock use in the region is<br />
predominantly cattle for cow-calf<br />
production, followed distantly by<br />
chickens and sheep.<br />
Self-Supplied Residential demand is<br />
projected to account for 4% <strong>of</strong> the 2060<br />
demand. Currently, 77% <strong>of</strong> the demand<br />
from this sector is supplied by alluvial<br />
groundwater and 23% by bedrock groundwater.<br />
Self-Supplied Industrial demand is projected to<br />
account for 2% <strong>of</strong> the 2060 demand. Currently,<br />
80% <strong>of</strong> the demand from this sector is supplied<br />
by surface water, 2% by alluvial groundwater,<br />
and 18% by bedrock groundwater.<br />
There is no Thermoelectric Power demand in<br />
the region.<br />
Municipal and Industrial is expected to<br />
remain the largest demand sector in the<br />
region, accounting for 42% <strong>of</strong> the total<br />
regional demand in 2060.<br />
Total 2060 <strong>Water</strong> Demand by Sector and Basin<br />
(Percent <strong>of</strong> Total Basin Demand)<br />
<strong>Lower</strong> <strong>Washita</strong> Region<br />
20 <strong>Lower</strong> <strong>Washita</strong> Regional Report <strong>Oklahoma</strong> Comprehensive <strong>Water</strong> Plan
Total <strong>Water</strong> Demand<br />
by Sector<br />
<strong>Lower</strong> <strong>Washita</strong> Region<br />
Supply Sources Used to Meet<br />
Current Demand (2010)<br />
<strong>Lower</strong> <strong>Washita</strong> Region<br />
<strong>Water</strong> Demand<br />
<strong>Water</strong> demand refers to the amount <strong>of</strong> water required to meet the needs <strong>of</strong> people,<br />
communities, industry, agriculture, and other users. Growth in water demand frequently<br />
corresponds to growth in population, agriculture, industry, or related economic activity.<br />
Demands have been projected from 2010 to 2060 in ten-year increments for seven distinct<br />
consumptive water demand sectors.<br />
<strong>Water</strong> Demand Sectors<br />
n Thermoelectric Power: Thermoelectric power producing plants, using both self-supplied water and<br />
municipal-supplied water, are included in the thermoelectric power sector.<br />
n Self-Supplied Residential: Households on private wells that are not connected to a public water supply<br />
system are included in the SSR sector.<br />
n Self-Supplied Industrial: Demands from large industries that do not directly depend upon a public<br />
water supply system are included in the SSI sector. <strong>Water</strong> use data and employment counts were<br />
included in this sector, when available.<br />
n Oil and Gas: Oil and gas drilling and exploration activities, excluding water used at oil and gas<br />
refineries (typically categorized as Self-Supplied Industrial users), are included in the oil and gas sector.<br />
The <strong>Lower</strong> <strong>Washita</strong> accounts for about 4% <strong>of</strong> the total statewide demand. Regional<br />
demand will increase by 46% (36,790 AFY) from 2010 to 2060. The majority <strong>of</strong> the<br />
demand and growth in demand over this period will be in the Municipal and Industrial and<br />
Crop Irrigation sectors.<br />
Planning<br />
Horizon<br />
Crop<br />
Irrigation<br />
Livestock<br />
<strong>Oklahoma</strong> Comprehensive <strong>Water</strong> Plan<br />
Total <strong>Water</strong> Demand by Sector<br />
<strong>Lower</strong> <strong>Washita</strong> Region<br />
Municipal<br />
&<br />
Industrial<br />
Oil &<br />
Gas 1<br />
Self-<br />
Supplied<br />
Industrial<br />
AFY<br />
Self-<br />
Supplied<br />
Residential<br />
Thermoelectric<br />
Power<br />
2010 29,100 8,320 31,770 5,970 2,000 3,270 0 80,440<br />
2020 31,680 8,480 38,390 10,450 2,000 3,510 0 94,510<br />
2030 34,250 8,630 40,940 9,610 2,010 3,680 0 99,130<br />
2040 36,830 8,790 43,470 9,840 2,030 3,850 0 104,800<br />
2050 38,810 8,940 46,190 10,330 2,060 4,020 0 110,360<br />
2060 41,990 9,100 49,010 10,810 2,120 4,210 0 117,230<br />
1 The demand forecast developed in accordance with the O&G work group estimates that 2050 and 2060 demands in seven<br />
counties will drop below the 2010 demand level (due to Woodford Shale being played out). As a conservative approach, this<br />
assumption is not explicitly carried over into the Gap Analysis. Instead, where applicable, basin demands (in the <strong>Lower</strong> <strong>Washita</strong><br />
Region, Basin 22) are assumed to never fall below the 2010 base year demand levels. This is reflected in the Region and Basin<br />
Total Demand by Sector tables.<br />
Total<br />
n Municipal and Industrial: These demands represent water that is provided by public water systems to<br />
homes, businesses, and industries throughout <strong>Oklahoma</strong>, excluding water supplied to thermoelectric<br />
power plants.<br />
n Livestock: Livestock demands were evaluated by livestock group (beef, poultry, etc.) based on the<br />
2007 Agriculture Census.<br />
n Crop Irrigation: <strong>Water</strong> demands for crop irrigation were estimated using the 2007 Agriculture Census<br />
data for irrigated acres by crop type and county. Crop irrigation requirements were obtained primarily<br />
from the Natural Resource Conservation Service Irrigation Guide Reports.<br />
OCWP demands were not projected for non-consumptive or instream water uses, such as<br />
hydroelectric power generation, fish and wildlife, recreation, and instream flow maintenance.<br />
Projections, which were augmented through user/stakeholder input, are based on standard<br />
methods using data specific to each sector and OCWP planning basin.<br />
Projections were initially developed for each county in the state, then allocated to each <strong>of</strong> the<br />
82 basins. To provide regional context, demands were aggregated by <strong>Water</strong>shed Planning<br />
Region. <strong>Water</strong> shortages were calculated at the basin level to more accurately determine<br />
areas where shortages may occur. Therefore, gaps, depletions, and options are presented<br />
in detail in the Basin Summaries and subsequent sections. Future demand projections were<br />
developed independent <strong>of</strong> available supply, water quality, or infrastructure considerations.<br />
The impacts <strong>of</strong> climate change, increased water use efficiency, conservation, and nonconsumptive<br />
uses, such as hydropower, are presented in supplemental OCWP reports.<br />
Present and future demands were applied to supply source categories to facilitate an<br />
evaluation <strong>of</strong> potential surface water gaps and alluvial and bedrock aquifer storage<br />
depletions at the basin level. For this baseline analysis, the proportion <strong>of</strong> each supply source<br />
used to meet future demands for each sector was held constant at the proportion established<br />
through current, active water use permit allocations. For example, if the crop irrigation sector<br />
in a basin currently uses 80% bedrock groundwater, then 80% <strong>of</strong> the projected future crop<br />
irrigation demand is assumed to use bedrock groundwater. Existing out-<strong>of</strong>-basin supplies are<br />
represented as surface water supplies in the receiving basin.<br />
<strong>Lower</strong> <strong>Washita</strong> Regional Report 21
Public <strong>Water</strong> Providers<br />
There are more than 1,600 <strong>Oklahoma</strong> water<br />
systems permitted or regulated by the<br />
<strong>Oklahoma</strong> Department <strong>of</strong> Environmental<br />
Quality (ODEQ); 785 systems were analyzed<br />
in detail for the 2012 OCWP Update. The<br />
public systems selected for inclusion, which<br />
collectively supply approximately 94 percent<br />
<strong>of</strong> the state’s current population, consist<br />
<strong>of</strong> municipal or community water systems<br />
and rural water districts that were readily<br />
identifiable as non-pr<strong>of</strong>it, local governmental<br />
entities. This and other information provided<br />
in the OCWP will support provider-level<br />
planning by providing insight into future<br />
supply and infrastructure needs.<br />
The <strong>Lower</strong> <strong>Washita</strong> <strong>Water</strong>shed Planning<br />
Region includes 66 <strong>of</strong> the 785 public supply<br />
systems analyzed for the 2012 OCWP Update.<br />
The Public <strong>Water</strong> Providers map indicates the<br />
approximate service areas <strong>of</strong> these systems.<br />
(The map may not accurately represent<br />
existing service areas or legal boundaries. In<br />
addition, water systems <strong>of</strong>ten serve multiple<br />
counties and can extend into multiple<br />
planning basins and regions.)<br />
lost either during<br />
water production or<br />
distribution to residential<br />
homes and businesses.<br />
Retail demands do not<br />
include wholesaled water.<br />
OCWP provider demand<br />
forecasts are not intended to<br />
supersede water demand forecasts<br />
developed by individual providers.<br />
OCWP analyses were made using<br />
a consistent methodology based<br />
on accepted data available on a<br />
statewide basis. Where available,<br />
provider-generated forecasts were<br />
also reviewed as part <strong>of</strong> this effort.<br />
Public <strong>Water</strong> Providers<br />
<strong>Lower</strong> <strong>Washita</strong> Region<br />
In terms <strong>of</strong> population served (excluding<br />
provider-to-provider sales), the five largest<br />
systems in the region, in decreasing order, are<br />
City <strong>of</strong> Ardmore, City <strong>of</strong> Chickasha, Marshall<br />
County <strong>Water</strong> Corp., Southern <strong>Oklahoma</strong><br />
<strong>Water</strong> Corp., and Bryan County RWS &<br />
SWMD #2. Together, these five systems serve<br />
over 40 percent <strong>of</strong> the combined OCWP public<br />
water providers’ population in the region.<br />
Demands upon public water systems, which<br />
comprise the majority <strong>of</strong> the OCWP’s<br />
Municipal and Industrial (M&I) water<br />
demand sector, were analyzed at both the<br />
basin and provider level. Retail demand<br />
projections detailed in the Public <strong>Water</strong><br />
Provider Demand Forecast table were<br />
developed for each <strong>of</strong> the OCWP providers<br />
in the region. These projections include<br />
estimated system losses, defined as water<br />
22 <strong>Lower</strong> <strong>Washita</strong> Regional Report <strong>Oklahoma</strong> Comprehensive <strong>Water</strong> Plan
Population and Demand<br />
Projection Data<br />
Provider level population and demand<br />
projection data, developed specifically<br />
for OCWP analyses, focus on retail<br />
customers for whom the system provides<br />
direct service. These estimates were<br />
generated from <strong>Oklahoma</strong> Department<br />
<strong>of</strong> Commerce population projections. In<br />
addition, the 2008 OCWP Provider Survey<br />
contributed critical information on water<br />
production and population served that<br />
was used to calculate per capita water<br />
use. Population for 2010 was estimated<br />
and may not reflect actual 2010 Census<br />
values. Exceptions to this methodology<br />
are noted.<br />
Provider SDWIS ID 1 County<br />
Public <strong>Water</strong> Providers/Retail Population Served (1 <strong>of</strong> 2)<br />
<strong>Lower</strong> <strong>Washita</strong> Region<br />
Retail Per<br />
Capita<br />
(GPD) 2<br />
Population Served<br />
2010 2020 2030 2040 2050 2060<br />
ALEX OK2002603 Grady 126 646 694 732 770 808 837<br />
ANADARKO WTP OK1010806 Caddo 143 6,867 7,150 7,383 7,605 7,827 8,030<br />
ARBUCKLE MCD (Wholesaler Only) None Murray 0 0 0 0 0 0 0<br />
ARDMORE OK1010814 Carter 304 25,011 26,483 27,904 29,275 30,757 32,340<br />
BINGER PWA OK2000803 Caddo 88 714 744 773 793 823 843<br />
BRYAN CO RWS & SWMD #2 OK1010604 Bryan 82 7,760 8,559 9,378 10,197 11,016 11,856<br />
BUCKHORN RWD OK3005002 Murray 185 925 1,004 1,099 1,187 1,286 1,386<br />
BYARS OK2004709 McClain 71 291 343 387 431 484 528<br />
CADDO CO RWD #1 (LOOKEBA) OK2000802 Caddo 189 200 215 215 215 231 231<br />
CEMENT OK3000806 Caddo 135 536 556 576 596 615 625<br />
CHICKASHA OK1010821 Grady 171 16,100 17,314 18,312 19,206 20,099 21,031<br />
CORNISH OK3003404 Jefferson 151 172 172 172 172 182 182<br />
CYRIL OK3000805 Caddo 116 1,180 1,229 1,269 1,309 1,348 1,378<br />
DAVIS OK1010822 Murray 302 3,283 3,571 3,905 4,216 4,573 4,930<br />
DOUGHERTY OK1010824 Murray 174 230 258 278 297 325 354<br />
ELMORE CITY OK2002521 Garvin 93 756 776 796 806 826 846<br />
ELMORE CITY RW CORP OK3002505 Garvin 116 925 949 974 986 1,010 1,035<br />
GARVIN CO RWD #6 (WELLS) OK2002511 Garvin 14 2,762 2,833 2,884 2,934 2,994 3,054<br />
GARVIN CO RWD #1 OK2002516 Garvin 67 1,406 1,443 1,468 1,494 1,524 1,555<br />
GARVIN CO RWD #2 OK2002514 Garvin 85 1,699 1,743 1,774 1,805 1,842 1,879<br />
GARVIN CO RWD #4 OK3002503 Garvin 94 1,215 1,247 1,269 1,291 1,317 1,344<br />
GARVIN CO RWD #6 (SW PURCHASE) OK3002515 Garvin 16 2,762 2,833 2,884 2,934 2,994 3,054<br />
GRACEMONT PWA OK2000811 Caddo 115 340 360 370 380 390 400<br />
GRADY CO RWD #1 OK2002604 Grady 60 307 329 348 365 382 399<br />
GRADY CO RWD #2 OK2002605 Grady 79 465 499 527 553 579 605<br />
GRADY CO RWD #3 OK2002607 Grady 112 82 88 93 97 102 106<br />
GRADY CO RWD #6 OK3002603 Grady 79 3,402 3,647 3,856 4,044 4,232 4,427<br />
GRADY CO RWD #7 (NINNEKAH) OK2002633 Grady 109 2,901 3,110 3,288 3,449 3,608 3,775<br />
HEALDTON OK1011102 Carter 127 2,904 3,085 3,246 3,407 3,577 3,758<br />
JOHNSTON CO RWD #3 OK2003511 Johnston 122 2,657 2,979 3,321 3,662 4,032 4,421<br />
KINGSTON PWA OK2004501 Marshall 89 1,490 1,834 2,185 2,546 2,922 3,324<br />
LEON RWD #1 (LOVE CO) OK2004302 Love 120 111 131 151 172 192 212<br />
LINDSAY PWA OK2002501 Garvin 121 3,012 3,085 3,146 3,198 3,270 3,332<br />
LONE GROVE OK2001007 Carter 90 3,914 4,150 4,369 4,581 4,817 5,061<br />
<strong>Oklahoma</strong> Comprehensive <strong>Water</strong> Plan<br />
<strong>Lower</strong> <strong>Washita</strong> Regional Report 23
Public <strong>Water</strong> Providers/Retail Population Served (2 <strong>of</strong> 2)<br />
<strong>Lower</strong> <strong>Washita</strong> Region<br />
Provider SDWIS ID 1 County<br />
Retail Per<br />
Capita<br />
(GPD) 2<br />
Population Served<br />
2010 2020 2030 2040 2050 2060<br />
MADILL OK1010820 Marshall 176 3,656 4,501 5,363 6,249 7,178 8,149<br />
MANNSVILLE PWA OK2003505 Johnston 100 1,246 1,399 1,553 1,706 1,879 2,070<br />
MARIETTA PWA OK2004301 Love 92 2,578 7,480 7,896 8,339 8,808 9,269<br />
MARLOW PWA OK2006907 Stephens 149 4,800 4,863 4,905 4,958 5,042 5,137<br />
MARSHALL CO WATER CORP OK1010848 Marshall 90 14,878 18,313 21,838 25,455 29,239 33,191<br />
MAYSVILLE OK1010807 Garvin 125 1,326 1,356 1,376 1,396 1,426 1,456<br />
MCCLAIN CO RWD #8 OK2004711 McClain 91 2,412 2,816 3,190 3,563 3,952 4,349<br />
MILL CREEK OK2003501 Johnston 103 361 399 447 495 542 599<br />
MURRAY CO RWD #1 OK2005012 Murray 114 4,521 4,909 5,372 5,801 6,289 6,778<br />
NORGE WATER COMPANY OK3002601 Grady 112 954 954 1,060 1,060 1,165 1,165<br />
OAKLAND OK3004513 Marshall 106 605 746 893 1,041 1,196 1,358<br />
OAKVIEW WATER CORP OK2004506 Marshall 106 992 1,221 1,456 1,697 1,949 2,213<br />
PAOLI OK2002502 Garvin 76 663 673 683 693 713 723<br />
PAULS VALLEY OK1010808 Garvin 211 6,173 6,330 6,447 6,554 6,691 6,828<br />
RATLIFF CITY OK3001004 Carter 153 137 137 147 156 166 166<br />
RAVIA OK2003504 Johnston 100 476 532 588 653 709 784<br />
RINGLING OK2003404 Jefferson 100 1,200 1,222 1,233 1,255 1,287 1,320<br />
RUSH SPRINGS OK2002609 Grady 129 1,278 1,371 1,446 1,521 1,586 1,660<br />
SOUTHERN OKLA WATER CORP OK1010830 Carter 105 13,691 14,497 15,278 16,023 16,841 17,709<br />
STEPHENS CO RW & SD #1 OK2006906 Stephens 135 900 911 919 930 945 963<br />
STEPHENS CO RWD #4 (LOCO) OK2006904 Stephens 113 215 215 215 215 215 229<br />
STEPHENS CO RWD #5 OK2006969 Stephens 138 3,635 3,678 3,712 3,755 3,815 3,888<br />
SULPHUR OK2005001 Murray 167 5,135 5,586 6,105 6,586 7,144 7,703<br />
TERRAL OK2003405 Jefferson 91 386 396 396 407 417 428<br />
THACKERVILLE OK2004303 Love 177 1,053 5,121 5,194 5,267 5,349 5,431<br />
TISHOMINGO WTP OK1010815 Johnston 96 3,220 3,607 4,022 4,437 4,880 5,351<br />
VERDEN OK4002619 Grady 89 676 724 762 800 838 876<br />
WAYNE OK2004702 McClain 140 789 919 1,040 1,160 1,290 1,420<br />
WEST DAVIS RWD OK3005004 Murray 158 917 998 1,091 1,178 1,278 1,377<br />
WESTERN CARTER CO WATER CORP OK2001003 Carter 125 1,414 1,497 1,578 1,655 1,739 1,829<br />
WILSON MUNICIPAL AUTHORITY OK2001001 Carter 91 1,713 1,806 1,910 2,004 2,107 2,211<br />
WYNNEWOOD WATER & LIGHT OK1010812 Garvin 180 2,379 2,439 2,488 2,528 2,588 2,638<br />
1 SDWIS - Safe Drinking <strong>Water</strong> Information System<br />
2 RED ENTRY indicates data were taken from 2007 OWRB <strong>Water</strong> Rights Database. GPD=gallons per day.<br />
24 <strong>Lower</strong> <strong>Washita</strong> Regional Report <strong>Oklahoma</strong> Comprehensive <strong>Water</strong> Plan
Provider SDWIS ID 1 County<br />
Public <strong>Water</strong> Provider Demand Forecast (1 <strong>of</strong> 2)<br />
<strong>Lower</strong> <strong>Washita</strong> Region<br />
Demand<br />
2010 2020 2030 2040 2050 2060<br />
ALEX OK2002603 Grady 91 98 103 109 114 118<br />
ANADARKO WTP OK1010806 Caddo 1,099 1,145 1,182 1,218 1,253 1,286<br />
ARBUCKLE MCD (Wholesaler Only) None Murray 0 0 0 0 0 0<br />
ARDMORE OK1010814 Carter 8,521 9,023 9,507 9,974 10,479 11,018<br />
BINGER PWA OK2000803 Caddo 70 73 76 78 81 83<br />
BRYAN CO RWS & SWMD #2 OK1010604 Bryan 710 783 858 933 1,008 1,085<br />
BUCKHORN RWD OK3005002 Murray 192 209 228 246 267 288<br />
BYARS OK2004709 McClain 23 27 31 35 39 42<br />
CADDO CO RWD #1 (LOOKEBA) OK2000802 Caddo 42 46 46 46 49 49<br />
CEMENT OK3000806 Caddo 81 84 87 90 93 95<br />
CHICKASHA OK1010821 Grady 3,094 3,316 3,508 3,679 3,850 4,028<br />
CORNISH OK3003404 Jefferson 29 29 29 29 31 31<br />
CYRIL OK3000805 Caddo 153 159 164 169 175 178<br />
DAVIS OK1010822 Murray 1,109 1,206 1,319 1,424 1,545 1,665<br />
DOUGHERTY OK1010824 Murray 45 50 54 58 63 69<br />
ELMORE CITY OK2002521 Garvin 78 80 83 84 86 88<br />
ELMORE CITY RW CORP OK3002505 Garvin 120 123 127 128 131 134<br />
GARVIN CO RWD #6 (WELLS) OK2002511 Garvin 43 44 45 46 47 48<br />
GARVIN CO RWD #1 OK2002516 Garvin 106 108 110 112 115 117<br />
GARVIN CO RWD #2 OK2002514 Garvin 162 166 169 172 176 179<br />
GARVIN CO RWD #4 OK3002503 Garvin 128 132 134 136 139 142<br />
GARVIN CO RWD #6 (SW PURCHASE) OK3002515 Garvin 49 51 52 53 54 55<br />
GRACEMONT PWA OK2000811 Caddo 44 47 48 49 50 52<br />
GRADY CO RWD #1 OK2002604 Grady 21 22 23 25 26 27<br />
GRADY CO RWD #2 OK2002605 Grady 41 44 47 49 51 54<br />
GRADY CO RWD #3 OK2002607 Grady 10 11 12 12 13 13<br />
GRADY CO RWD #6 OK3002603 Grady 301 323 341 358 375 392<br />
GRADY CO RWD #7 (NINNEKAH) OK2002633 Grady 355 381 402 422 442 462<br />
HEALDTON OK1011102 Carter 413 439 461 484 509 534<br />
JOHNSTON CO RWD #3 OK2003511 Johnston 363 407 454 500 551 604<br />
KINGSTON PWA OK2004501 Marshall 149 183 218 254 292 332<br />
LEON RWD #1 (LOVE CO) OK2004302 Love 15 18 20 23 26 29<br />
LINDSAY PWA OK2002501 Garvin 409 419 428 435 444 453<br />
AFY<br />
Projections <strong>of</strong> Retail <strong>Water</strong> Demand<br />
Each public water supply system has a “retail” demand,<br />
defined as the amount <strong>of</strong> water used by residential and<br />
non-residential customers within that provider’s service<br />
area. Public-supplied residential demand includes water<br />
provided to households for domestic uses both inside<br />
and outside the home. Non-residential demand includes<br />
customer uses at <strong>of</strong>fice buildings, shopping centers,<br />
industrial parks, schools, churches, hotels, and related<br />
locations served by a public water supply system. Retail<br />
demand doesn’t include wholesale water to other providers.<br />
Municipal and Industrial (M&I) demand is driven by<br />
projected population growth and specific customer<br />
characteristics. Demand forecasts for each public system<br />
are estimated from average water use (in gallons per<br />
capita per day) multiplied by projected population.<br />
<strong>Oklahoma</strong> Department <strong>of</strong> Commerce 2002 population<br />
projections (unpublished special tabulation for the OWRB)<br />
were calibrated to 2007 Census estimates and used to<br />
establish population growth rates for cities, towns, and<br />
rural areas through 2060. Population growth rates were<br />
applied to 2007 population-served values for each provider<br />
to project future years’ service area (retail) populations.<br />
The main source <strong>of</strong> data for per capita water use for each<br />
provider was the 2008 OCWP Provider Survey conducted<br />
by the OWRB in cooperation with the <strong>Oklahoma</strong> Rural<br />
<strong>Water</strong> Association and <strong>Oklahoma</strong> Municipal League. For<br />
each responding provider, data from the survey included<br />
population served, annual average daily demand, total<br />
water produced, wholesale purchases and sales between<br />
providers, and estimated system losses.<br />
For missing or incomplete data, the weighted average<br />
per capita demand was used for the provider’s county. In<br />
some cases, provider survey data were supplemented with<br />
data from the OWRB water rights database. Per capita<br />
supplier demands can vary over time due to precipitation<br />
and service area characteristics, such as commercial and<br />
industrial activity, tourism, or conservation measures.<br />
For the baseline demand projections described here,<br />
the per capita demand was held constant through each<br />
<strong>of</strong> the future planning year scenarios. OCWP estimates<br />
<strong>of</strong> potential reductions in demand from conservation<br />
measures are analyzed on a basin and regional level, but<br />
not for individual provider systems.<br />
<strong>Oklahoma</strong> Comprehensive <strong>Water</strong> Plan<br />
<strong>Lower</strong> <strong>Washita</strong> Regional Report 25
Provider SDWIS ID 1 County<br />
Public <strong>Water</strong> Provider Demand Forecast (2 <strong>of</strong> 2)<br />
<strong>Lower</strong> <strong>Washita</strong> Region<br />
Demand<br />
2010 2020 2030 2040 2050 2060<br />
LONE GROVE OK2001007 Carter 394 418 440 461 485 510<br />
MADILL OK1010820 Marshall 721 887 1,057 1,232 1,415 1,606<br />
MANNSVILLE PWA OK2003505 Johnston 140 157 174 191 210 232<br />
MARIETTA PWA OK2004301 Love 266 771 814 860 908 955<br />
MARLOW PWA OK2006907 Stephens 801 811 818 827 841 857<br />
MARSHALL CO WATER CORP OK1010848 Marshall 1,500 1,847 2,202 2,567 2,948 3,347<br />
MAYSVILLE OK1010807 Garvin 186 190 193 195 200 204<br />
MCCLAIN CO RWD #8 OK2004711 McClain 247 288 326 365 405 445<br />
MILL CREEK OK2003501 Johnston 42 46 52 57 63 69<br />
MURRAY CO RWD #1 OK2005012 Murray 576 625 684 738 801 863<br />
NORGE WATER COMPANY OK3002601 Grady 120 120 133 133 147 147<br />
OAKLAND OK3004513 Marshall 72 88 106 123 142 161<br />
OAKVIEW WATER CORP OK2004506 Marshall 117 144 172 201 231 262<br />
PAOLI OK2002502 Garvin 57 57 58 59 61 62<br />
PAULS VALLEY OK1010808 Garvin 1,462 1,499 1,526 1,552 1,584 1,617<br />
RATLIFF CITY OK3001004 Carter 23 23 25 27 28 28<br />
RAVIA OK2003504 Johnston 53 60 66 73 80 88<br />
RINGLING OK2003404 Jefferson 134 137 138 141 144 148<br />
RUSH SPRINGS OK2002609 Grady 184 198 209 219 229 240<br />
SOUTHERN OKLA WATER CORP OK1010830 Carter 1,603 1,697 1,798 1,876 1,972 2,073<br />
STEPHENS CO RW & SD #1 OK2006906 Stephens 136 138 139 141 143 146<br />
STEPHENS CO RWD #4 (LOCO) OK2006904 Stephens 27 27 27 27 27 29<br />
STEPHENS CO RWD #5 OK2006969 Stephens 560 567 572 579 588 599<br />
SULPHUR OK2005001 Murray 961 1,045 1,142 1,232 1,336 1,441<br />
TERRAL OK2003405 Jefferson 39 40 40 41 42 43<br />
THACKERVILLE OK2004303 Love 209 1,015 1,030 1,044 1,061 1,077<br />
TISHOMINGO WTP OK1010815 Johnston 347 389 433 478 526 576<br />
VERDEN OK4002619 Grady 67 72 76 80 83 87<br />
WAYNE OK2004702 McClain 124 144 163 182 202 223<br />
WEST DAVIS RWD OK3005004 Murray 162 177 193 208 226 244<br />
WESTERN CARTER CO WATER CORP OK2001003 Carter 197 209 220 231 243 255<br />
WILSON MUNICIPAL AUTHORITY OK2001001 Carter 175 185 195 205 215 226<br />
WYNNEWOOD WATER & LIGHT OK1010812 Garvin 480 492 502 510 522 532<br />
1 SDWIS - Safe Drinking <strong>Water</strong> Information System<br />
AFY<br />
26 <strong>Lower</strong> <strong>Washita</strong> Regional Report <strong>Oklahoma</strong> Comprehensive <strong>Water</strong> Plan
Provider SDWIS ID 1 Sells To<br />
or Ongoing or Both<br />
Purchases from<br />
Ongoing<br />
Sales Purchases<br />
Emergency<br />
Treated<br />
or Raw<br />
Emergency<br />
or<br />
ARBUCKLE MCD None Ardmore<br />
Davis<br />
Wynnewood<br />
Dougherty<br />
Sulphur (future use)<br />
ARDMORE OK1010814 Southern <strong>Oklahoma</strong> <strong>Water</strong> Corp<br />
Lone Grove<br />
O<br />
O<br />
O<br />
O<br />
O<br />
E<br />
R<br />
R<br />
R<br />
R<br />
B<br />
T<br />
Treated<br />
or Raw<br />
or Both<br />
Southern <strong>Oklahoma</strong> <strong>Water</strong> Corp O T<br />
BRYAN CO RWS & SWMD #2 OK1010604 Bryan Co RWD #5 E T Durant O T<br />
BUCKHORN RWD OK3005002 Murray Co RWD #1 O T<br />
CEMENT OK3000806 Grady Co RWD # 7 O T<br />
CHICKASHA OK1010821 Grady Co RWD #6<br />
Norge <strong>Water</strong> Co<br />
CYRIL OK3000805 Caddo Co RWD #3 O T<br />
DAVIS OK1010822 Western Carter Co <strong>Water</strong> Corp<br />
West Davis RWD<br />
Wholesale <strong>Water</strong> Transfers (1 <strong>of</strong> 2)<br />
<strong>Lower</strong> <strong>Washita</strong> Region<br />
O<br />
O<br />
T<br />
T<br />
Fort Cobb MCD O T<br />
DOUGHERTY OK1010824 Murray Co RWD #1 E R<br />
ELMORE CITY OK2002521 Elmore City RW Corp O T<br />
ELMORE CITY RW CORP OK3002505 Elmore City O T Pauls Valley O T<br />
GARVIN CO RWD #4 OK3002503 Pauls Valley T<br />
GRADY CO RWD #2 OK2002605 Grady Co RWD #6 E T<br />
GRADY CO RWD #6 OK3002603 Grady Co RWD #2 E T Chickasha<br />
Tuttle<br />
GRADY CO RWD #7 (NINNEKAH) OK2002633 Cement O T<br />
HEALDTON OK1011102 Jefferson Co RWD #1 E T<br />
KINGSTON PWA OK2004501 Marshall County <strong>Water</strong> Corp E T<br />
O<br />
O<br />
T<br />
T<br />
O<br />
O<br />
T<br />
T<br />
Wholesale <strong>Water</strong> Transfers<br />
Some providers sell water on a<br />
“wholesale” basis to other providers,<br />
effectively increasing the amount <strong>of</strong> water<br />
that the selling provider must deliver and<br />
reducing the amount that the purchasing<br />
provider diverts from surface and<br />
groundwater sources. Wholesale water<br />
transfers between public water providers<br />
are fairly common and can provide<br />
an economical way to meet demand.<br />
Wholesale quantities typically vary from<br />
year to year depending upon growth,<br />
precipitation, emergency conditions, and<br />
agreements between systems.<br />
<strong>Water</strong> transfers between providers can<br />
help alleviate costs associated with<br />
developing or maintaining infrastructure,<br />
such as a reservoir or pipeline; allow<br />
access to higher quality or more reliable<br />
sources; or provide additional supplies<br />
only when required, such as in cases <strong>of</strong><br />
supply emergencies. Utilizing the 2008<br />
OCWP Provider Survey and OWRB water<br />
rights data, the Wholesale <strong>Water</strong> Transfers<br />
table presents a summary <strong>of</strong> known<br />
wholesale arrangements for providers<br />
in the region. Transfers can consist <strong>of</strong><br />
treated or raw water and can occur on a<br />
regular basis or only during emergencies.<br />
Providers commonly sell to and purchase<br />
from multiple water providers.<br />
LONE GROVE OK2001007 Ardmore E T<br />
JOHNSTON CO RWD #3 OK2003511 Ravia<br />
Milburn Public Works Authority<br />
E<br />
T<br />
T<br />
MADILL OK1010820 Marshall County <strong>Water</strong> Corp<br />
Oakland<br />
E<br />
O<br />
T<br />
T<br />
Marshall County <strong>Water</strong> Corp E T<br />
MANNSVILLE PWA OK2003505 Marshall County <strong>Water</strong> Corp E T<br />
MARSHALL CO WATER CORP OK1010848 Kingston PWA<br />
Madill<br />
Mannsville Public Works Authority<br />
E<br />
E<br />
E<br />
T<br />
T<br />
T<br />
Madill E T<br />
MURRAY CO RWD #1 OK2005012 Dougherty<br />
Buckhorn RWD<br />
O<br />
O<br />
T<br />
T<br />
<strong>Oklahoma</strong> Comprehensive <strong>Water</strong> Plan<br />
<strong>Lower</strong> <strong>Washita</strong> Regional Report 27
Wholesale <strong>Water</strong> Transfers (2 <strong>of</strong> 2)<br />
<strong>Lower</strong> <strong>Washita</strong> Region<br />
Provider SDWIS ID 1 Sells To<br />
or Ongoing or Both<br />
Purchases from<br />
Ongoing<br />
Sales Purchases<br />
Emergency<br />
Treated<br />
or Raw<br />
Emergency<br />
or<br />
Treated<br />
or Raw<br />
or Both<br />
NORGE WATER CO OK3002601 Chickasha O T<br />
OAKLAND OK3004513 Madill O T<br />
PAULS VALLEY OK1010808 Garvin Co RWD #4<br />
Elmore City RW Corp<br />
O<br />
O<br />
T<br />
T<br />
RATLIFF CITY OK3001004 Western Carter Co <strong>Water</strong> Corp O T<br />
RAVIA OK2003504 Johnston Co RWD # 3 E T<br />
RINGLING OK2003404 Cornish O T<br />
SOUTHERN OKLA WATER CORP OK1010830 Ardmore O T<br />
STEPHENS CO RWD #5 OK2006969 Comanche Co RWD #3 E T Duncan E T<br />
WEST DAVIS RWD OK3005004 Davis<br />
Western Carter Co <strong>Water</strong> Corp<br />
WESTERN CARTER CO WATER CORP OK2001003 Ratliff City<br />
West Davis RWD<br />
1 SDWIS - Safe Drinking <strong>Water</strong> Information System<br />
O<br />
E<br />
T<br />
T<br />
City <strong>of</strong> Davis O B<br />
O<br />
E<br />
T<br />
T<br />
28 <strong>Lower</strong> <strong>Washita</strong> Regional Report <strong>Oklahoma</strong> Comprehensive <strong>Water</strong> Plan
Public <strong>Water</strong> Provider <strong>Water</strong> Rights and Withdrawals - 2010 (1 <strong>of</strong> 2)<br />
<strong>Lower</strong> <strong>Washita</strong> Region<br />
Provider SDWIS ID 1 County<br />
Permitted<br />
Quantity<br />
Permitted<br />
Surface <strong>Water</strong><br />
Source<br />
Permitted Alluvial<br />
Groundwater<br />
Permitted Bedrock<br />
Groundwater<br />
ALEX OK2002603 Grady 174 --- --- 100%<br />
ANADARKO WTP OK1010806 Caddo 1,319 71% 0% 29%<br />
ARBUCKLE MCD None Murray 24,000 100% 0% 0%<br />
ARDMORE OK1010814 Carter 6,092 85% 15% 0%<br />
BINGER PWA OK2000803 Caddo 180 0% 100% 0%<br />
BRYAN CO RWS & SWMD #2 OK1010604 Bryan 921 100% 0% 0%<br />
BUCKHORN RWD OK3005002 Murray --- --- --- ---<br />
BYARS OK2004709 McClain 100 0% 0% 100%<br />
CADDO CO RWD #1 (LOOKEBA) OK2000802 Caddo 20 0% 100% 0%<br />
CEMENT OK3000806 Caddo 320 --- 100% ---<br />
CHICKASHA OK1010821 Grady 5,274 100% 0% 0%<br />
CORNISH OK3003404 Jefferson --- --- --- ---<br />
CYRIL OK3000805 Caddo 580 0% 100% 0%<br />
DAVIS OK1010822 Murray 5,625 100% 0% 0%<br />
DOUGHERTY OK1010824 Murray --- --- --- ---<br />
ELMORE CITY OK2002521 Garvin 298 80% 20% 0%<br />
ELMORE CITY RW CORP OK3002505 Garvin --- --- --- ---<br />
GARVIN CO RWD #1 OK2002516 Garvin --- --- --- ---<br />
GARVIN CO RWD #2 OK2002514 Garvin 525 0% 77% 23%<br />
GARVIN CO RWD #4 OK3002503 Garvin --- --- --- ---<br />
GARVIN CO RWD #6 (SW PURCHASE) OK3002515 Garvin --- --- --- ---<br />
GARVIN CO RWD #6 (WELLS) OK2002511 Garvin 400 0% 0% 100%<br />
GRACEMONT PWA OK2000811 Caddo 243 0% 100% 0%<br />
GRADY CO RWD #1 OK2002604 Grady 11 0% 100% 0%<br />
GRADY CO RWD #2 OK2002605 Grady 34 0% 56% 44%<br />
GRADY CO RWD #3 OK2002607 Grady 35 0% 0% 100%<br />
GRADY CO RWD #6 OK3002603 Grady 886 --- 100% ---<br />
GRADY CO RWD #7 (NINNEKAH) OK2002633 Grady --- --- --- ---<br />
HEALDTON OK1011102 Carter 1,873 79% 21% 0%<br />
JOHNSTON CO RWD #3 OK2003511 Johnston 507 0% 0% 100%<br />
KINGSTON PWA OK2004501 Marshall 1,250 0% 100% 0%<br />
LEON RWD #1 (LOVE CO) OK2004302 Love 130 0% 23% 77%<br />
LINDSAY PWA OK2002501 Garvin 2,168 1% 0% 99%<br />
AFY<br />
Percent<br />
Provider <strong>Water</strong> Rights<br />
Public water providers using surface water or<br />
groundwater obtain water rights from the OWRB.<br />
<strong>Water</strong> providers purchasing water from other<br />
suppliers or sources are not required to obtain<br />
water rights as long as the furnishing entity has<br />
the appropriate water right or other source <strong>of</strong><br />
authority. Each public water provider’s current<br />
water right(s) and source <strong>of</strong> supply have been<br />
summarized in this report. The percentage <strong>of</strong><br />
each provider’s total 2007 water rights from<br />
surface water, alluvial groundwater, and bedrock<br />
groundwater supplies was also calculated,<br />
indicating the relative proportions <strong>of</strong> sources<br />
available to each provider.<br />
A comparison <strong>of</strong> existing water rights to projected<br />
demands can show when additional water rights<br />
or other sources and in what amounts might<br />
be needed. Forecasts <strong>of</strong> conditions for the year<br />
2060 indicate where additional water rights<br />
may be needed to satisfy demands by that time.<br />
However, in most cases, wholesale water transfers<br />
to other providers must also be addressed by the<br />
selling provider’s water rights. Thus, the amount<br />
<strong>of</strong> water rights required will exceed the retail<br />
demand for a selling provider and will be less<br />
than the retail demand for a purchasing provider.<br />
In preparing to meet long-term needs, public<br />
water providers should consider strategic<br />
factors appropriate to their sources <strong>of</strong> water.<br />
For example, public water providers who use<br />
surface water can seek and obtain a “schedule<br />
<strong>of</strong> use” as part <strong>of</strong> their stream water right, which<br />
addresses projected growth and consequent<br />
increases in stream water use. Such schedules<br />
<strong>of</strong> use can be employed to address increases<br />
that are anticipated to occur over many years<br />
or even decades, as an alternative to the usual<br />
requirement to use the full authorized amount<br />
<strong>of</strong> stream water in a seven-year period. On the<br />
other hand, public water providers that utilize<br />
groundwater should consider the prospect that it<br />
may be necessary to purchase or lease additional<br />
land in order to increase their groundwater rights.<br />
<strong>Oklahoma</strong> Comprehensive <strong>Water</strong> Plan<br />
<strong>Lower</strong> <strong>Washita</strong> Regional Report 29
Public <strong>Water</strong> Provider <strong>Water</strong> Rights and Withdrawals - 2010 (2 <strong>of</strong> 2)<br />
<strong>Lower</strong> <strong>Washita</strong> Region<br />
Source<br />
Permitted<br />
Quantity<br />
Permitted<br />
Surface <strong>Water</strong><br />
Permitted Alluvial<br />
Groundwater<br />
Permitted Bedrock<br />
Groundwater<br />
Provider SDWIS ID 1 County<br />
AFY<br />
Percent<br />
LONE GROVE OK2001007 Carter 562 0% 100% 0%<br />
MADILL OK1010820 Marshall 3,442 100% 0% 0%<br />
MANNSVILLE PWA OK2003505 Johnston --- --- --- ---<br />
MARIETTA PWA OK2004301 Love 1,885 0% 100% 0%<br />
MARLOW PWA OK2006907 Stephens 5,994 32% 68% 0%<br />
MARSHALL CO WATER CORP OK1010848 Marshall 1,616 100% 0% 0%<br />
MAYSVILLE OK1010807 Garvin 700 100% 0% 0%<br />
MCCLAIN CO RWD #8 OK2004711 McClain 647 0% 0% 100%<br />
MILL CREEK OK2003501 Johnston 575 0% 0% 100%<br />
MURRAY CO RWD #1 OK2005012 Murray 764 0% 0% 100%<br />
NORGE WATER COMPANY OK3002601 Grady --- --- --- ---<br />
OAKLAND OK3004513 Marshall --- --- --- ---<br />
OAKVIEW WATER CORP OK2004506 Marshall 310 0% 100% 0%<br />
PAOLI OK2002502 Garvin --- --- --- ---<br />
PAULS VALLEY OK1010808 Garvin 5,354 100% 0% 0%<br />
RATLIFF CITY OK3001004 Carter 244 0% 100% 0%<br />
RAVIA OK2003504 Johnston 149 0% 100% 0%<br />
RINGLING OK2003404 Jefferson 233 0% 100% 0%<br />
RUSH SPRINGS OK2002609 Grady 137 0% 100% 0%<br />
SOUTHERN OKLA WATER CORP OK1010830 Carter 530 36% 64% 0%<br />
STEPHENS CO RW & SD #1 OK2006906 Stephens 55 0% 100% 0%<br />
STEPHENS CO RWD #4 (LOCO) OK2006904 Stephens 160 --- 100% ---<br />
STEPHENS CO RWD #5 OK2006969 Stephens 640 0% 100% 0%<br />
SULPHUR OK2005001 Murray 1,377 0% 0% 100%<br />
TERRAL OK2003405 Jefferson 25 --- --- 100%<br />
THACKERVILLE OK2004303 Love 299 0% 96% 4%<br />
TISHOMINGO WTP OK1010815 Johnston 1,144 45% 55% 0%<br />
VERDEN OK4002619 Grady 212 --- --- 100%<br />
WAYNE OK2004702 McClain 105 0% 0% 100%<br />
WEST DAVIS RWD OK3005004 Murray 135 0% 100% 0%<br />
WESTERN CARTER CO WATER CORP OK2001003 Carter 57 0% 100% 0%<br />
WILSON MUNICIPAL AUTHORITY OK2001001 Carter 160 0% 100% 0%<br />
WYNNEWOOD WATER & LIGHT OK1010812 Garvin 600 0% 0% 100%<br />
1 SDWIS - Safe Drinking <strong>Water</strong> Information System<br />
30 <strong>Lower</strong> <strong>Washita</strong> Regional Report <strong>Oklahoma</strong> Comprehensive <strong>Water</strong> Plan
Town <strong>of</strong> Alex (Grady County)<br />
Current Source <strong>of</strong> Supply<br />
Primary source: groundwater<br />
Short-Term Needs<br />
Infrastructure improvements: drill new wells.<br />
Long-Term Needs<br />
Infrastructure improvements: replace a portion <strong>of</strong> distribution<br />
system lines; Upgrade water treatment plant.<br />
Anadarko WTP (Caddo County)<br />
Current Source <strong>of</strong> Supply<br />
Primary source: Fort Cobb MCD<br />
Short-Term Needs<br />
Infrastructure improvements: replace distribution system<br />
lines.<br />
Long-Term Needs<br />
Infrastructure improvements: replace distribution system<br />
lines; add storage tank; add membrane to WTP.<br />
Arbuckle MCD<br />
Current Source <strong>of</strong> Supply<br />
Primary source: Arbuckle Lake<br />
Short-Term Needs<br />
None identified.<br />
Long-Term Needs<br />
Infrastructure improvements: new primary source pipeline for<br />
Sulphur municipal water supply.<br />
City <strong>of</strong> Ardmore (Carter County)<br />
Current Source <strong>of</strong> Supply<br />
Primary source: Arbuckle Lake, Mountain Lake/City Lake,<br />
Lake Jean Neustadt, Lake Scott King<br />
Short-Term Needs<br />
None identified.<br />
Long-Term Needs<br />
None identified.<br />
Binger PWA (Caddo County)<br />
Current Source <strong>of</strong> Supply<br />
Primary source: groundwater<br />
Short-Term Needs<br />
None identified.<br />
Long-Term Needs<br />
Infrastructure improvements: replace distribution system lines.<br />
Bryan County RWS & SWMD 2<br />
Current Source <strong>of</strong> Supply<br />
Primary source: Blue River, Eagle Lake<br />
Short-Term Needs<br />
Infrastructure improvements: add storage tanks.<br />
Long-Term Needs<br />
Infrastructure improvements: construct new reservoir or<br />
additional wells.<br />
OCWP Provider Survey<br />
<strong>Lower</strong> <strong>Washita</strong> Region<br />
Buckhorn RWD (Murray County)<br />
Current Source <strong>of</strong> Supply<br />
Primary source: Murray County District 1<br />
Short-Term Needs<br />
Infrastructure improvements: replace distribution system lines.<br />
Long-Term Needs<br />
Infrastructure improvements: add and replace distribution<br />
system lines.<br />
Town <strong>of</strong> Byars (McClain County)<br />
Current Source <strong>of</strong> Supply<br />
Primary source: groundwater<br />
Short-Term Needs<br />
Infrastructure improvements: replace distribution system lines.<br />
Long-Term Needs<br />
New supply source: groundwater.<br />
Infrastructure improvements: drill additional wells.<br />
Caddo County RWD 1 (Lookeba)<br />
Current Source <strong>of</strong> Supply<br />
Primary source: groundwater<br />
Short-Term Needs<br />
None identified.<br />
Long-Term Needs<br />
None identified.<br />
Town <strong>of</strong> Cement (Caddo County)<br />
Current Source <strong>of</strong> Supply<br />
Primary source: Grady County RWD 7<br />
Short-Term Needs<br />
Infrastructure improvements: replace distribution system lines.<br />
Long-Term Needs<br />
Infrastructure improvements: add storage tank.<br />
City <strong>of</strong> Chickasha (Grady County)<br />
Current Source <strong>of</strong> Supply<br />
Primary source: Ft. Cobb MCD<br />
Short-Term Needs<br />
Infrastructure improvements: replace water main lines.<br />
Long-Term Needs<br />
Infrastructure improvements: replace distribution system<br />
distribution system lines; add storage tanks; refurbish existing<br />
water tanks.<br />
Supply: seeking long-term source.<br />
Town <strong>of</strong> Cornish (Jefferson County)<br />
Current Source <strong>of</strong> Supply<br />
Primary source: town <strong>of</strong> Ringling.<br />
Short-Term Needs<br />
None identified.<br />
Long-Term Needs<br />
None identified.<br />
Town <strong>of</strong> Cyril (Caddo County)<br />
Current Source <strong>of</strong> Supply<br />
Primary source: RWD 3<br />
Short-Term Needs<br />
Infrastructure improvements: add storage.<br />
Long-Term Needs<br />
Infrastructure improvements: add storage.<br />
City <strong>of</strong> Davis (Murray County)<br />
Current Source <strong>of</strong> Supply<br />
Primary source: Arbuckle Lake, Honey Creek<br />
Short-Term Needs<br />
Infrastructure improvements: replace distribution system lines;<br />
construct new WTP.<br />
Long-Term Needs<br />
Infrastructure improvements: refurbish or drill wells; add storage.<br />
Town <strong>of</strong> Dougherty (Murray County)<br />
Current Source <strong>of</strong> Supply<br />
Primary source: Arbuckle Lake, Murray County 1<br />
Short-Term Needs<br />
Infrastructure improvements: replace distribution system lines;<br />
add storage tower fencing; refurbish storage tower; replace<br />
water meters.<br />
Long-Term Needs<br />
Infrastructure improvements: replace distribution system lines;<br />
add storage; new WTP.<br />
Elmore City (Garvin County)<br />
Current Source <strong>of</strong> Supply<br />
Primary source: Pauls Valley/Lake Longmire, Elmore City<br />
RWC, groundwater.<br />
Short-Term Needs<br />
None identified.<br />
Long-Term Needs<br />
None identified.<br />
Elmore City RWC (Garvin County)<br />
Current Source <strong>of</strong> Supply<br />
Primary sources: Pauls Valley PWA<br />
Short-Term Needs<br />
None identified.<br />
Long-Term Needs<br />
None identified.<br />
Garvin County RWD 1<br />
Current Source <strong>of</strong> Supply<br />
Primary source: groundwater<br />
Short-Term Needs<br />
None identified.<br />
Long-Term Needs<br />
None identified.<br />
Provider Supply Plans<br />
In 2008, a survey was sent to 785<br />
municipal and rural water providers<br />
throughout <strong>Oklahoma</strong> to collect vital<br />
background water supply and system<br />
information. Additional detail for each <strong>of</strong><br />
these providers was solicited in 2010 as<br />
part <strong>of</strong> follow-up interviews conducted by<br />
the ODEQ. The 2010 interviews sought<br />
to confirm key details <strong>of</strong> the earlier<br />
survey and document additional details<br />
regarding each provider’s water supply<br />
infrastructure and plans. This included<br />
information on existing sources <strong>of</strong> supply<br />
(including surface water, groundwater,<br />
and other providers), short-term supply<br />
and infrastructure plans, and long-term<br />
supply and infrastructure plans.<br />
In instances where no new source was<br />
identified, maintenance <strong>of</strong> the current<br />
source <strong>of</strong> supply is expected into the<br />
future. Providers may or may not have<br />
secured the necessary funding to<br />
implement their stated plans concerning<br />
infrastructure needs, commonly including<br />
additional wells or raw water conveyance,<br />
storage, and replacement/upgrade <strong>of</strong><br />
treatment and distribution systems.<br />
Additional support for individual water<br />
providers wishing to pursue enhanced<br />
planning efforts is documented in the<br />
Public <strong>Water</strong> Supply Planning Guide. This<br />
guide details how information contained<br />
in the OCWP <strong>Water</strong>shed Planning Region<br />
Reports and related planning documents<br />
can be used to formulate provider-level<br />
plans to meet present and future needs <strong>of</strong><br />
individual water systems.<br />
<strong>Oklahoma</strong> Comprehensive <strong>Water</strong> Plan<br />
<strong>Lower</strong> <strong>Washita</strong> Regional Report 31
OCWP Provider Survey<br />
<strong>Lower</strong> <strong>Washita</strong> Region<br />
Garvin County RWD 2<br />
Current Source <strong>of</strong> Supply<br />
Primary source: groundwater<br />
Emergency source: City <strong>of</strong> Lindsay<br />
Short-Term Needs<br />
Infrastructure improvements: drill additional wells.<br />
Long-Term Needs<br />
Infrastructure improvements: drill additional wells.<br />
Garvin County RWD 4<br />
Current Source <strong>of</strong> Supply<br />
Primary source: Pauls Valley Municipal Authority<br />
Short-Term Needs<br />
None identified.<br />
Long-Term Needs<br />
None identified.<br />
Garvin County RWD 6<br />
Current Source <strong>of</strong> Supply<br />
Primary source: Gerty Sands Aquifer and City <strong>of</strong><br />
Wynnewood<br />
Short-Term Needs<br />
Infrastructure improvements: drill additional wells; add<br />
storage.<br />
Long-Term Needs<br />
New supply source: Oscar aquifer.<br />
Infrastructure improvements: add additional wells to Oscar.<br />
Garvin County RWD 6 (SW Purchase)<br />
Current Source <strong>of</strong> Supply<br />
Primary source: City <strong>of</strong> Wynnewood<br />
Short-Term Needs<br />
New supply source: groundwater.<br />
Infrastructure improvements: add distribution system lines.<br />
Long-Term Needs<br />
New supply source: groundwater.<br />
Infrastructure improvements: add distribution system lines.<br />
Gracemont PWA (Caddo County)<br />
Current Source <strong>of</strong> Supply<br />
Primary source: Groundwater<br />
Short-Term Needs<br />
Infrastructure improvements: replace portion <strong>of</strong> distribution<br />
system lines.<br />
Long-Term Needs<br />
Infrastructure improvements: add distribution system lines.<br />
Grady County RWD 1<br />
Current Source <strong>of</strong> Supply<br />
Primary source: groundwater<br />
Short-Term Needs<br />
None identified.<br />
Long-Term Needs<br />
Infrastructure improvements: add storage.<br />
Grady County RWD 2<br />
Current Source <strong>of</strong> Supply<br />
Primary source: groundwater, Grady County RWD 6<br />
Short-Term Needs<br />
Infrastructure improvements: drill additional well.<br />
Long-Term Needs<br />
Infrastructure improvements: replace distribution system lines;<br />
add storage.<br />
Grady County RWD 3<br />
Current Source <strong>of</strong> Supply<br />
Primary source: groundwater<br />
Short-Term Needs<br />
Infrastructure improvements: replace distribution system lines.<br />
Long-Term Needs<br />
None identified.<br />
Grady County RWD 6<br />
Current Source <strong>of</strong> Supply<br />
Primary source: Cities <strong>of</strong> Chickasha and Tuttle<br />
Short-Term Needs<br />
Infrastructure improvements: add standpipe (Tuttle area).<br />
Long-Term Needs<br />
Infrastructure improvements: replace distribution system lines.<br />
Grady County RWD 7<br />
Current Source <strong>of</strong> Supply<br />
Primary source: groundwater<br />
Short-Term Needs<br />
Infrastructure improvements: drill additional wells.<br />
Long-Term Needs<br />
Infrastructure improvements: drill additional wells.<br />
Town <strong>of</strong> Healdton (Carter County)<br />
Current Source <strong>of</strong> Supply<br />
Primary source: Healdton Municipal Lake, groundwater<br />
Short-Term Needs<br />
Infrastructure improvements: drill additional well (Oscar<br />
aquifer).<br />
Long-Term Needs<br />
Infrastructure improvements: drill additional well; add storage.<br />
Johnston County RWD 3<br />
Current Source <strong>of</strong> Supply<br />
Primary source: groundwater (Arbuckle-Simpson)<br />
Short-Term Needs<br />
Infrastructure improvements: drill additional well; add<br />
distribution lines.<br />
Long-Term Needs<br />
Infrastructure improvements: drill additional wells; add storage.<br />
Kingston PWA (Marshall County)<br />
Current Source <strong>of</strong> Supply<br />
Primary source: groundwater; Marshall County<br />
Short-Term Needs<br />
None identified.<br />
Long-Term Needs<br />
None identified.<br />
Leon RWD 1 (Love County)<br />
Current Source <strong>of</strong> Supply<br />
Primary source: groundwater<br />
Short-Term Needs<br />
None identified.<br />
Long-Term Needs<br />
None identified.<br />
City <strong>of</strong> Lindsay PWA (Garvin County)<br />
Current Source <strong>of</strong> Supply<br />
Primary source: groundwater<br />
Short-Term Needs<br />
None identified.<br />
Long-Term Needs<br />
None identified.<br />
City <strong>of</strong> Lone Grove (Carter County)<br />
Current Source <strong>of</strong> Supply<br />
Primary source: groundwater<br />
Short-Term Needs<br />
Infrastructure improvements: redrill well.<br />
Long-Term Needs<br />
Infrastructure improvement: drill additional wells; add storage.<br />
City <strong>of</strong> Madill (Marshall County)<br />
Current Source <strong>of</strong> Supply<br />
Primary source: City Lake, Carter Lake, Hauani Lake<br />
Short-Term Needs<br />
None identified.<br />
Long-Term Needs<br />
None identified.<br />
Mannsville PWA (Johnston County)<br />
Current Source <strong>of</strong> Supply<br />
Primary source: groundwater (Antlers Sandstone aquifer)<br />
Emergency source: Marshall County <strong>Water</strong> Corp.<br />
Short-Term Needs<br />
Infrastructure improvement: add storage.<br />
Long-Term Needs<br />
Infrastructure improvement: add storage; drill additional wells.<br />
Marietta RWD (Love County)<br />
Current Source <strong>of</strong> Supply<br />
Primary source: groundwater<br />
Short-Term Needs<br />
Infrastructure improvement: drill additional wells; replace<br />
distribution system lines; add storage.<br />
Long-Term Needs<br />
Infrastructure improvement: drill additional wells; replace<br />
distribution system lines; add storage.<br />
Marlow PWA (Stephens County)<br />
Current Source <strong>of</strong> Supply<br />
Primary source: groundwater<br />
Short-Term Needs<br />
Infrastructure improvement: replace distribution system lines;<br />
add storage.<br />
Long-Term Needs<br />
None identified.<br />
Marshall County <strong>Water</strong> Corp.<br />
Current Source <strong>of</strong> Supply<br />
Primary source: Lakes Rex Smith, Oteaka and Ruel<br />
Short-Term Needs<br />
None identified.<br />
Long-Term Needs<br />
None identified.<br />
Town <strong>of</strong> Maysville (Garvin County)<br />
Current Source <strong>of</strong> Supply<br />
Primary source: Maysville Lake<br />
Short-Term Needs<br />
None identified.<br />
Long-Term Needs<br />
Infrastructure improvement: replace distribution system lines;<br />
add storage and booster stations; new WTP.<br />
McClain County RWD 8<br />
Current Source <strong>of</strong> Supply<br />
Primary source: groundwater<br />
Short-Term Needs<br />
Infrastructure improvement: drill additional wells; add storage.<br />
Long-Term Needs<br />
None identified.<br />
Town <strong>of</strong> Mill Creek (Johnston County)<br />
Current Source <strong>of</strong> Supply<br />
Primary source: groundwater (Arbuckle-Simpson)<br />
Short-Term Needs<br />
Infrastructure improvement: refurbish water tower.<br />
Long-Term Needs<br />
Infrastructure improvement: drill additional well; replace water<br />
main lines and cut-<strong>of</strong>f valves.<br />
Murray County 1<br />
Current Source <strong>of</strong> Supply<br />
Primary source: groundwater<br />
Short-Term Needs<br />
None identified.<br />
Long-Term Needs<br />
None identified.<br />
32 <strong>Lower</strong> <strong>Washita</strong> Regional Report <strong>Oklahoma</strong> Comprehensive <strong>Water</strong> Plan
OCWP Provider Survey<br />
<strong>Lower</strong> <strong>Washita</strong> Region<br />
Norge <strong>Water</strong> Company (Grady County)<br />
Current Source <strong>of</strong> Supply<br />
Primary source: City <strong>of</strong> Chickasha<br />
Short-Term Needs<br />
Infrastructure improvement: replace distribution system<br />
lines; add storage.<br />
Long-Term Needs<br />
None identified.<br />
Town <strong>of</strong> Oakland (Marshall County)<br />
Current Source <strong>of</strong> Supply<br />
Primary source: City <strong>of</strong> Madill<br />
Short-Term Needs<br />
None identified.<br />
Long-Term Needs<br />
New supply source: groundwater<br />
Infrastructure improvement: drill additional wells.<br />
Oakview <strong>Water</strong> Corp. (Marshall County)<br />
Current Source <strong>of</strong> Supply<br />
Primary source: groundwater<br />
Short-Term Needs<br />
None identified.<br />
Long-Term Needs<br />
None identified.<br />
Town <strong>of</strong> Paoli (Garvin County)<br />
Current Source <strong>of</strong> Supply<br />
Primary source: groundwater<br />
Short-Term Needs<br />
None identified.<br />
Long-Term Needs<br />
None identified.<br />
Pauls Valley (Garvin County)<br />
Current Source <strong>of</strong> Supply<br />
Primary source: R.C. Longmire Lake and Valley City Lake<br />
Short-Term Needs<br />
None identified.<br />
Long-Term Needs<br />
Infrastructure improvement: upsize raw water line; add storage<br />
Ratliff City (Carter County)<br />
Current Source <strong>of</strong> Supply<br />
Primary source: Western Carter County <strong>Water</strong> & Sewer<br />
Short-Term Needs<br />
None identified.<br />
Long-Term Needs<br />
None identified.<br />
Town <strong>of</strong> Ravia (Johnston County)<br />
Current Source <strong>of</strong> Supply<br />
Primary source: groundwater<br />
Short-Term Needs<br />
New supply source: surface water<br />
Long-Term Needs<br />
Infrastructure improvement: replace distribution system lines.<br />
Town <strong>of</strong> Ringling (Jefferson County)<br />
Current Source <strong>of</strong> Supply<br />
Primary source: groundwater<br />
Short-Term Needs<br />
Infrastructure improvement: drill additional well.<br />
Long-Term Needs<br />
Infrastructure improvement: replace distribution system lines;<br />
add storage; drill additional wells.<br />
Town <strong>of</strong> Rush Springs (Grady County)<br />
Current Source <strong>of</strong> Supply<br />
Primary source: groundwater<br />
Short-Term Needs<br />
None identified.<br />
Long-Term Needs<br />
None identified.<br />
Southern <strong>Oklahoma</strong> <strong>Water</strong> Corp. (Carter County)<br />
Current Source <strong>of</strong> Supply<br />
Primary source: Arbuckle Lake, Lake Murray, groundwater<br />
Short-Term Needs<br />
Infrastructure improvement: drill additional wells.<br />
Long-Term Needs<br />
Infrastructure improvement: drill additional wells.<br />
Stephens County RW & SD 1<br />
Current Source <strong>of</strong> Supply<br />
Primary source: groundwater<br />
Short-Term Needs<br />
None identified.<br />
Long-Term Needs<br />
None identified.<br />
Stephens County RWD 4<br />
Current Source <strong>of</strong> Supply<br />
Primary source: groundwater<br />
Emergency source: Jefferson County RWD<br />
Short-Term Needs<br />
Infrastructure improvement: refurbish additional well.<br />
Long-Term Needs<br />
None identified.<br />
Stephens County RWD 5<br />
Current Source <strong>of</strong> Supply<br />
Primary source: groundwater<br />
Emergency source: City <strong>of</strong> Duncan<br />
Short-Term Needs<br />
None identified.<br />
Long-Term Needs<br />
Infrastructure improvement: drill additional wells.<br />
City <strong>of</strong> Sulphur (Murray County)<br />
Current Source <strong>of</strong> Supply<br />
Primary source: groundwater<br />
Short-Term Needs<br />
Infrastructure improvement: replace portion <strong>of</strong> water main lines;<br />
replace pump station pump.<br />
Long-Term Needs<br />
Infrastructure improvement: drill additional wells; add pump<br />
station; refurbish existing wells.<br />
Town <strong>of</strong> Terral PWA (Stephens County)<br />
Current Source <strong>of</strong> Supply<br />
Primary source: groundwater, Jefferson County RWD 1<br />
Short-Term Needs<br />
None identified.<br />
Long-Term Needs<br />
Infrastructure improvement: drill additional wells.<br />
Thackerville (Love County)<br />
Current Source <strong>of</strong> Supply<br />
Primary source: groundwater<br />
Short-Term Needs<br />
Infrastructure improvement: drill additional wells.<br />
Long-Term Needs<br />
Infrastructure improvement: drill additional wells.<br />
Tishomingo WTP (Johnston County)<br />
Current Source <strong>of</strong> Supply<br />
Primary source: Pennington Creek<br />
Short-Term Needs<br />
Infrastructure improvement: add pump and valves in<br />
distribution system; upgrade water treatment plant.<br />
Long-Term Needs<br />
Infrastructure improvement: replace distribution system lines.<br />
Town <strong>of</strong> Verden (Grady County)<br />
Current Source <strong>of</strong> Supply<br />
Primary source: groundwater<br />
Short-Term Needs<br />
None identified.<br />
Long-Term Needs<br />
New supply source: groundwater (Rush Springs aquifer).<br />
Infrastructure improvement: drill additional wells; add storage<br />
and standpipe.<br />
Town <strong>of</strong> Wayne (McClain County)<br />
Current Source <strong>of</strong> Supply<br />
Primary source: groundwater<br />
Emergency source: McClain County RWD 8<br />
Short-Term Needs<br />
None identified.<br />
Long-Term Needs<br />
Infrastructure improvement: replace distribution system lines.<br />
West Davis RWD (Murray County)<br />
Current Source <strong>of</strong> Supply<br />
Primary source: City <strong>of</strong> Davis<br />
Short-Term Needs<br />
Infrastructure improvement: replace distribution system lines.<br />
Long-Term Needs<br />
Infrastructure improvement: drill additional wells; replace<br />
distribution system lines; add storage.<br />
Western Carter County <strong>Water</strong> Corp.<br />
Current Source <strong>of</strong> Supply<br />
Primary source: groundwater, City <strong>of</strong> Davis.<br />
Short-Term Needs<br />
None identified.<br />
Long-Term Needs<br />
None identified.<br />
Wilson Municipal Authority (Carter County)<br />
Current Source <strong>of</strong> Supply<br />
Primary source: groundwater (Oscar B aquifer)<br />
Short-Term Needs<br />
Infrastructure improvement: drill additional wells.<br />
Long-Term Needs<br />
Infrastructure improvement: drill additional wells.<br />
Wynnewood <strong>Water</strong> & Light (Garvin County)<br />
Current Source <strong>of</strong> Supply<br />
Primary source: Lake Arbuckle<br />
Short-Term Needs<br />
None identified.<br />
Long-Term Needs<br />
None identified.<br />
<strong>Oklahoma</strong> Comprehensive <strong>Water</strong> Plan<br />
<strong>Lower</strong> <strong>Washita</strong> Regional Report 33
34 <strong>Lower</strong> <strong>Washita</strong> Regional Report <strong>Oklahoma</strong> Comprehensive <strong>Water</strong> Plan
Drinking <strong>Water</strong> Infrastructure Cost Summary<br />
As part <strong>of</strong> the public water provider analysis, regional cost estimates<br />
to meet system drinking water infrastructure needs over the next<br />
50 years were prepared. While it is difficult to account for changes<br />
that may occur within this extended time frame, it is beneficial to<br />
evaluate, at least on the order-<strong>of</strong>-magnitude level, the long-range<br />
costs <strong>of</strong> providing potable water.<br />
Project cost estimates were developed for a selection <strong>of</strong> existing water<br />
providers, and then weighted to determine total regional costs. The<br />
OCWP method is similar to that utilized by the EPA to determine<br />
national drinking water infrastructure costs in 2007. However, the<br />
OCWP uses a 50-year planning horizon while the EPA uses a 20-<br />
year period. Also, the OCWP includes a broader spectrum <strong>of</strong> project<br />
types rather than limiting projects to those eligible for the Drinking<br />
<strong>Water</strong> <strong>State</strong> Revolving Fund program. While estimated costs for new<br />
reservoirs are not included, rehabilitation project costs for existing<br />
major reservoirs were applied at the regional level.<br />
More information on the methodology and cost estimates is<br />
available in the OCWP Drinking <strong>Water</strong> Infrastructure Needs<br />
Assessment by Region report.<br />
Provider System Category 1<br />
Infrastructure Cost Summary<br />
<strong>Lower</strong> <strong>Washita</strong> Region<br />
Infrastructure Need (millions <strong>of</strong> 2007 dollars)<br />
Present - 2020 2021 - 2040 2041 - 2060 Total Period<br />
Small $375 $202 $36 $613<br />
Medium $824 $933 $212 $1,969<br />
Large $0 $0 $0 $0<br />
Reservoir 2 $0 $7 $222 $229<br />
Total $1,199 $1,142 $470 $2,811<br />
1 Large providers are defined as those serving more than 100,000 people, medium systems as those serving between 3,301 and 100,000 people, and<br />
small systems as those serving 3,300 or fewer people.<br />
2 The “reservoir” category refers specifically to rehabilitation projects.<br />
• Approximately $2.8 billion is needed to meet the projected drinking water infrastructure needs <strong>of</strong> the <strong>Lower</strong><br />
<strong>Washita</strong> region over the next 50 years. The largest infrastructure costs are expected to occur within the next<br />
20 years.<br />
• Distribution and transmission projects account for more than 75 percent <strong>of</strong> the providers’ estimated<br />
infrastructure costs, followed distantly by water treatment projects.<br />
• Medium-sized providers have the largest overall drinking water infrastructure costs.<br />
• Projects involving rehabilitation <strong>of</strong> existing reservoir comprise approximately eight percent <strong>of</strong> the total costs.<br />
<strong>Oklahoma</strong> Comprehensive <strong>Water</strong> Plan<br />
<strong>Lower</strong> <strong>Washita</strong> Regional Report 35
<strong>Water</strong> Supply Options<br />
Limitations Analysis<br />
For each <strong>of</strong> the state’s 82 OCWP basins, an<br />
analysis <strong>of</strong> water supply and demand was<br />
followed by an analysis <strong>of</strong> limitations for surface<br />
water, bedrock groundwater, and alluvial<br />
groundwater use. Physical availability limitations<br />
for surface water were referred to as gaps.<br />
Availability limitations for alluvial and bedrock<br />
groundwater were referred to as depletions.<br />
For surface water, the most pertinent limiting<br />
characteristics considered were (1) physical<br />
availability <strong>of</strong> water, (2) permit availability,<br />
and (3) water quality. For alluvial and bedrock<br />
groundwater, permit availability was not a<br />
limiting factor through 2060, and existing<br />
data were insufficient to conduct meaningful<br />
groundwater quality analyses. Therefore,<br />
limitations for major alluvial and bedrock<br />
aquifers were related to physical availability<br />
<strong>of</strong> water and included an analysis <strong>of</strong> both the<br />
amount <strong>of</strong> any forecasted depletion relative to the<br />
amount <strong>of</strong> water in storage and rate at which the<br />
depletion was predicted to occur.<br />
Methodologies were developed to assess<br />
limitations and assign appropriate scores for<br />
each supply source in each basin. For surface<br />
water, scores were calculated weighting the<br />
characteristics as follows: 50% for physical<br />
availability, 30% for permit availability,<br />
and 20% for water quality. For alluvial and<br />
bedrock groundwater scores, the magnitude<br />
<strong>of</strong> depletion relative to amount <strong>of</strong> water<br />
in storage and rate <strong>of</strong> depletion were each<br />
weighted 50%.<br />
The resulting supply limitation scores were<br />
used to rank all 82 basins for surface water,<br />
major alluvial groundwater, and major bedrock<br />
groundwater sources (see <strong>Water</strong> Supply<br />
Limitations map in the regional summary).<br />
For each source, basins ranking the highest<br />
were considered to be “significantly limited”<br />
in the ability <strong>of</strong> that source to meet forecasted<br />
demands reliably. Basins with intermediate<br />
rankings were considered to be “potentially<br />
limited” for that source. For bedrock and<br />
alluvial groundwater rankings, “potentially<br />
limited” was also the baseline default given to<br />
basins lacking major aquifers due to typically<br />
lower yields and insufficient data. Basins with<br />
the lowest rankings were considered to be<br />
“minimally limited” for that source and not<br />
projected to have any gaps or depletions.<br />
Based on an analysis <strong>of</strong> all three sources <strong>of</strong><br />
water, the basins with the most significant<br />
limitations ranking were identified as “Hot<br />
Spots.” A discussion <strong>of</strong> the methodologies<br />
used in identifying Hot Spots, results, and<br />
recommendations can be found in the OCWP<br />
Executive Report.<br />
Primary Options<br />
To provide a range <strong>of</strong> potential solutions for<br />
mitigation <strong>of</strong> water supply shortages in each<br />
<strong>of</strong> the 82 OCWP basins, five primary options<br />
were evaluated for potential effectiveness: (1)<br />
demand management, (2) use <strong>of</strong> out-<strong>of</strong>-basin<br />
supplies, (3) reservoir use, (4) increasing<br />
reliance on surface water, and (5) increasing<br />
reliance on groundwater. For each basin, the<br />
potential effectiveness <strong>of</strong> each primary option<br />
was assigned one <strong>of</strong> three ratings: (1) typically<br />
effective, (2) potentially effective, and (3)<br />
likely ineffective (see <strong>Water</strong> Supply Option<br />
Effectiveness map in the regional summary).<br />
For basins where shortages are not projected,<br />
no options are necessary and thus none were<br />
evaluated.<br />
Demand Management<br />
“Demand management” refers to the potential<br />
to reduce water demands and alleviate gaps<br />
or depletions by implementing conservation<br />
or drought management measures. Demand<br />
management is a vitally important tool that<br />
can be implemented either temporarily or<br />
permanently to decrease demand and increase<br />
available supply. “Conservation measures”<br />
refer to long-term activities that result in<br />
consistent water savings throughout the year,<br />
while “drought management” refers to shortterm<br />
measures, such as temporary restrictions<br />
on outdoor watering. Municipal and industrial<br />
conservation techniques can include modifying<br />
customer behaviors, using more efficient<br />
plumbing fixtures, or eliminating water leaks.<br />
Agricultural conservation techniques can<br />
include reducing water demand through more<br />
efficient irrigation systems and production <strong>of</strong><br />
crops with decreased water requirements.<br />
Two specific scenarios for conservation<br />
were analyzed for the OCWP—moderate<br />
and substantial—to assess the relative<br />
effectiveness in reducing statewide water<br />
demand in the two largest demand sectors,<br />
Municipal/Industrial and Crop Irrigation. For<br />
the <strong>Water</strong>shed Planning Region reports, only<br />
moderately expanded conservation activities<br />
were considered when assessing the overall<br />
effectiveness <strong>of</strong> the demand management<br />
option for each basin. A broader analysis<br />
<strong>of</strong> moderate and substantial conservation<br />
measures statewide is discussed below and<br />
summarized in the “Expanded Options”<br />
section <strong>of</strong> the OCWP Executive Report.<br />
Demand management was considered to<br />
be “typically effective” in basins where it<br />
would likely eliminate both gaps and storage<br />
depletions and “potentially effective” in<br />
basins where it would likely either reduce<br />
gaps and depletions or eliminate either gaps<br />
or depletions (but not both). There were no<br />
basins where demand management could not<br />
reduce gaps and/or storage depletions to at<br />
least some extent; therefore this option was<br />
not rated “likely ineffective” for any basin.<br />
Out-<strong>of</strong>-Basin Supplies<br />
Use <strong>of</strong> “out-<strong>of</strong>-basin supplies” refers to the<br />
option <strong>of</strong> transferring water through pipelines<br />
from a source in one basin to another basin. This<br />
option was considered a “potentially effective”<br />
solution in all basins due to its general potential<br />
in eliminating gaps and depletions. The option<br />
was not rated “typically effective” because<br />
complexity and cost make it only practical as<br />
a long-term solution. The effectiveness <strong>of</strong> this<br />
option for a basin was also assessed with the<br />
consideration <strong>of</strong> potential new reservoir sites<br />
within the respective region as identified in<br />
the Expanded Options section below and the<br />
OCWP Reservoir Viability Study.<br />
Reservoir Use<br />
“Reservoir Use” refers to the development <strong>of</strong><br />
additional in-basin reservoir storage. Reservoir<br />
storage can be provided through increased<br />
use <strong>of</strong> existing facilities, such as reallocation<br />
<strong>of</strong> existing purposes at major federal reservoir<br />
sites or rehabilitation <strong>of</strong> smaller NRCS projects<br />
to include municipal and/or industrial water<br />
supply, or the construction <strong>of</strong> new reservoirs.<br />
The effectiveness rating <strong>of</strong> reservoir use for a<br />
basin was based on a hypothetical reservoir<br />
located at the furthest downstream basin<br />
outlet. <strong>Water</strong> transmission and legal or water<br />
quality constraints were not considered;<br />
however, potential constraints in permit<br />
availability were noted. A site located further<br />
upstream could potentially provide adequate<br />
yield to meet demand, but would likely<br />
require greater storage than a site located at<br />
the basin outlet. The effectiveness rating was<br />
also largely contingent upon the existence<br />
<strong>of</strong> previously studied reservoir sites (see the<br />
Expanded Options section below) and/or the<br />
ability <strong>of</strong> new streamflow diversions with<br />
storage to meet basin water demands.<br />
Reservoir use was considered “typically<br />
effective” in basins containing one or more<br />
potentially viable reservoir sites unless the<br />
basin was fully allocated for surface water<br />
and had no permit availability. For basins<br />
with no permit availability, reservoir use<br />
was considered “potentially effective,” since<br />
36 <strong>Lower</strong> <strong>Washita</strong> Regional Report <strong>Oklahoma</strong> Comprehensive <strong>Water</strong> Plan
diversions would be limited to existing<br />
permits. Reservoir use was also considered<br />
“potentially effective” in basins that generate<br />
sufficient reservoir yield to meet future<br />
demand. <strong>State</strong>wide, the reservoir use option<br />
was considered “likely ineffective” in only<br />
three basins (Basins 18, 55, and 66), where it<br />
was determined that insufficient streamflow<br />
would be available to provide an adequate<br />
reservoir yield to meet basin demand.<br />
Increasing Reliance on<br />
Surface <strong>Water</strong><br />
“Increasing reliance on surface water” refers to<br />
changing the surface water-groundwater use<br />
ratio to meet future demands by increasing<br />
surface water use. For baseline analysis, the<br />
proportion <strong>of</strong> future demand supplied by surface<br />
water and groundwater for each sector is<br />
assumed equal to current proportions. Increasing<br />
the use <strong>of</strong> surface water through direct diversions<br />
without reservoir storage or releases upstream<br />
from storage provides a reliable supply option<br />
in limited areas <strong>of</strong> the state and has potential to<br />
mitigate bedrock groundwater depletions and/<br />
or alluvial groundwater depletions. However,<br />
this option largely depends upon local conditions<br />
concerning the specific location, amount, and<br />
timing <strong>of</strong> the diversion.<br />
Due to this uncertainty, the pronounced<br />
periods <strong>of</strong> low streamflow in many river<br />
systems across the state, and the potential<br />
to create or augment surface water gaps, this<br />
option was considered “typically ineffective”<br />
for all basins. The preferred alternative<br />
statewide is reservoir use, which provides the<br />
most reliable surface water supply source.<br />
Increasing Reliance on<br />
Groundwater<br />
“Increasing reliance on groundwater” refers to<br />
changing the surface water-groundwater use<br />
ratio to meet future demands by increasing<br />
groundwater use. Supplies from major aquifers<br />
are particularly reliable because they generally<br />
exhibit higher well yields and contain large<br />
amounts <strong>of</strong> water in storage. Minor aquifers<br />
can also contain large amounts <strong>of</strong> water in<br />
storage, but well yields are typically lower and<br />
may be insufficient to meet the needs <strong>of</strong> high<br />
volume water users. Site-specific information<br />
on the suitability <strong>of</strong> minor aquifers for supply<br />
should be considered prior to large-scale<br />
use. Additional groundwater supplies may<br />
also be developed through artificial recharge<br />
(groundwater storage and recovery), which<br />
is summarized in the “Expanded Options”<br />
section <strong>of</strong> the OWRB Executive Report.<br />
Increased reliance on groundwater supplies<br />
was considered “typically effective” in basins<br />
where both gaps and depletions could be<br />
mitigated in a measured fashion that did not<br />
lead to additional groundwater depletions.<br />
This option was considered “potentially<br />
effective” in basins where surface water gaps<br />
could be mitigated by increased groundwater<br />
use, but would likely result in increased<br />
depletions in either alluvial or bedrock<br />
groundwater storage. Increased reliance<br />
on groundwater supplies was considered<br />
“typically ineffective” in basins where there<br />
were no major aquifers.<br />
Expanded Options<br />
In addition to the standard analysis <strong>of</strong> primary<br />
options for each basin, specific OCWP studies<br />
were conducted statewide on several more<br />
advanced though less conventional options<br />
that have potential to reduce basin gaps and<br />
depletions. More detailed summaries <strong>of</strong> these<br />
options are available in the OWRB Executive Report.<br />
Full reports are available on the OWRB website.<br />
Expanded Conservation<br />
Measures<br />
<strong>Water</strong> conservation was considered an<br />
essential component <strong>of</strong> the “demand<br />
management” option in basin-level analysis<br />
<strong>of</strong> options for reducing or eliminating<br />
gaps and storage depletions. At the basin<br />
level, moderately expanded conservation<br />
measures were used as the basis for analyzing<br />
effectiveness. In a broader OCWP study,<br />
summarized in the OCWP Executive Report<br />
and documented in the OCWP <strong>Water</strong><br />
Demand Forecast Report Addendum: Conservation<br />
and Climate Change, both moderately and<br />
substantially expanded conservation activities<br />
were analyzed at a statewide level for the<br />
state’s two largest demand sectors: Municipal/<br />
Industrial (M&I) and Crop Irrigation. For<br />
each sector, two scenarios were analyzed: (1)<br />
moderately expanded conservation activities,<br />
and (2) substantially expanded conservation<br />
activities. <strong>Water</strong> savings for the municipal<br />
and industrial and crop irrigation water use<br />
sectors were assessed, and for the M&I sector,<br />
a cost-benefit analysis was performed to<br />
quantify savings associated with reduced costs<br />
in drinking water production and decreased<br />
wastewater treatment. The energy savings and<br />
associated water savings realized as a result <strong>of</strong><br />
these decreases were also quantified.<br />
Artificial Aquifer Recharge<br />
In 2008, the <strong>Oklahoma</strong> Legislature passed<br />
Senate Bill 1410 requiring the OWRB to<br />
develop and implement criteria to prioritize<br />
potential locations throughout the state where<br />
artificial recharge demonstration projects are<br />
most feasible to meet future water supply<br />
challenges. A workgroup <strong>of</strong> numerous water<br />
agencies and user groups was organized to<br />
identify suitable locations in both alluvial and<br />
bedrock aquifers. Fatal flaw and threshold<br />
screening analyses resulted in identification <strong>of</strong><br />
six alluvial sites and nine bedrock sites. These<br />
sites were subjected to further analysis that<br />
resulted in five sites deemed by the workgroup<br />
as having the best potential for artificial<br />
recharge demonstration projects.<br />
Where applicable, potential recharge sites<br />
are noted in the “Increasing Reliance on<br />
Groundwater” option discussion in basin<br />
data and analysis sections <strong>of</strong> the <strong>Water</strong>shed<br />
Planning Region Reports. The site selection<br />
methodology and results for the five selected<br />
sites are summarized in the OCWP Executive<br />
Report; more detailed information on the<br />
workgroup and study is presented in the<br />
OCWP Artificial Aquifer Recharge Issues and<br />
Recommendations report.<br />
Marginal Quality <strong>Water</strong> Sources<br />
In 2008, the <strong>Oklahoma</strong> Legislature passed<br />
Senate Bill 1627 requiring the OWRB to<br />
establish a technical workgroup to analyze<br />
the expanded use <strong>of</strong> marginal quality water<br />
(MQW) from various sources throughout the<br />
state. The group included representatives from<br />
state and federal agencies, industry, and other<br />
stakeholders. Through facilitated discussions,<br />
the group defined MQW as that which has<br />
been historically unusable due to technological<br />
or economic issues associated with diverting,<br />
treating, and/or conveying the water. Five<br />
categories <strong>of</strong> MQW were identified for further<br />
characterization and technical analysis: (1)<br />
treated wastewater effluent, (2) stormwater<br />
run<strong>of</strong>f, (3) oil and gas flowback/produced water,<br />
(4) brackish surface and groundwater, and (5)<br />
water with elevated levels <strong>of</strong> key constituents,<br />
such as nitrates, that would require advanced<br />
treatment prior to beneficial use.<br />
A phased approach was utilized to meet the<br />
study’s objectives, which included quantifying<br />
and characterizing MQW sources and their<br />
locations for use through 2060, assessing<br />
constraints to MQW use, and matching<br />
identified sources <strong>of</strong> MQW with projected<br />
water shortages across the state. Feasibility<br />
<strong>of</strong> actual use was also reviewed. Of all<br />
the general MQW uses evaluated, water<br />
reuse—beneficially using treated wastewater<br />
to meet certain demand—is perhaps the<br />
most commonly applied elsewhere in the<br />
U.S. Similarly, wastewater was determined<br />
to be one <strong>of</strong> the most viable sources <strong>of</strong><br />
marginal quality water for short-term use in<br />
<strong>Oklahoma</strong>. Results <strong>of</strong> the workgroup’s study<br />
are summarized in the OCWP Executive Report;<br />
more detailed information on the workgroup<br />
and study is presented in the OCWP Marginal<br />
Quality <strong>Water</strong> Issues and Recommendations report.<br />
Potential Reservoir Development<br />
<strong>Oklahoma</strong> is the location <strong>of</strong> many reservoirs<br />
that provide a dependable, vital water<br />
supply source for numerous purposes. While<br />
economic, environmental, cultural, and<br />
geographical constraints generally limit the<br />
construction <strong>of</strong> new reservoirs, significant<br />
interest persists due to their potential in<br />
meeting various future needs, particularly<br />
<strong>Oklahoma</strong> Comprehensive <strong>Water</strong> Plan<br />
<strong>Lower</strong> <strong>Washita</strong> Regional Report 37
those associated with municipalities and<br />
regional public supply systems.<br />
As another option to address <strong>Oklahoma</strong>’s<br />
long-range water needs, the OCWP Reservoir<br />
Viability Study was initiated to identify<br />
potential reservoir sites throughout the state<br />
that have been analyzed to various degrees by<br />
the OWRB, Bureau <strong>of</strong> Reclamation (BOR),<br />
U.S. Army Corps <strong>of</strong> Engineers (USACE),<br />
Natural <strong>Resources</strong> Conservation Service<br />
(NRCS), and other public or private agencies.<br />
Principal elements <strong>of</strong> the study included<br />
extensive literature search; identification <strong>of</strong><br />
criteria to determine a reservoir’s viability;<br />
creation <strong>of</strong> a database to store essential<br />
information for each site; evaluation <strong>of</strong><br />
sites; Geographic Information System<br />
(GIS) mapping <strong>of</strong> the most viable sites;<br />
aerial photograph and map reconnaissance;<br />
screening <strong>of</strong> environmental, cultural, and<br />
endangered species issues; estimates <strong>of</strong><br />
updated construction costs; and categorical<br />
assessment <strong>of</strong> viability. The study revealed<br />
more than 100 sites statewide. Each was<br />
assigned a ranking, ranging from Category 4<br />
(sites with at least adequate information that<br />
are viable candidates for future development)<br />
to Category 0 (sites that exist only on a<br />
historical map and for which no study data can<br />
be verified).<br />
This analysis does not necessarily indicate an<br />
actual need or specific recommendation to<br />
build any potential project. Rather, these sites<br />
are presented to provide local and regional<br />
decision-makers with additional tools as<br />
they anticipate future water supply needs<br />
and opportunities. Study results present<br />
only a cursory examination <strong>of</strong> the many<br />
factors associated with project feasibility or<br />
implementation. Detailed investigations would<br />
be required in all cases to verify feasibility <strong>of</strong><br />
construction and implementation. A summary<br />
<strong>of</strong> potential reservoir sites statewide is<br />
available in the OCWP Executive Report; more<br />
detailed information on the study is presented<br />
in the OCWP Reservoir Viability Study. Potential<br />
reservoir development sites for this <strong>Water</strong>shed<br />
Planning Region appear on the following table<br />
and map.<br />
Reservoir Project Viability<br />
Categorization<br />
Category 4: Sites with at least adequate<br />
information that are viable candidates for future<br />
development.<br />
Category 3: Sites with sufficient data for analysis,<br />
but less than desirable for current viability.<br />
Category 2: Sites that may contain fatal flaws or<br />
other factors that could severely impede potential<br />
development.<br />
Category 1: Sites with limited available data and<br />
lacking essential elements <strong>of</strong> information.<br />
Category 0: Typically sites that exist only on an<br />
historical map. Study data cannot be located or<br />
verified.<br />
Potential Sites (Categories 3 & 4)<br />
<strong>Lower</strong> <strong>Washita</strong> Region<br />
Conservation Pool<br />
Name Category Stream Basin Purposes 1 Total<br />
Storage<br />
Surface<br />
Area<br />
Storage<br />
Dependable<br />
Yield<br />
AF Acres AF AFY<br />
Date<br />
Primary Study<br />
Agency<br />
Updated Cost Estimate 2<br />
(2010 dollars)<br />
Burneyville 3 Walnut Bayou & Simon Creek 22 WS, FW, R 194,000 8,546 119,000 25,000 1973 Bureau <strong>of</strong> Reclamation $162,429,000<br />
Caddo Creek 4 Caddo Creek 14 WS, FC, FW, R 333,980 9,787 236,000 40,000 1973 Bureau <strong>of</strong> Reclamation $164,362,000<br />
Chickasha 3 Little <strong>Washita</strong> 16 FC, FW, R 80,500 1,950 7,500 0 1951 USACE $116,512,000<br />
Courtney (Criner Hills) 4 Mud Creek 23 WS, FW, R 303,400 11,430 206,800 53,000 1976 Bureau <strong>of</strong> Reclamation $165,473,000<br />
Cox City 3 Rush Creek 14 WS, FC, FW, R 87,060 1,800 18,000 8,000 1981 USACE $75,787,000<br />
Durwood 4 <strong>Washita</strong> River 21 P, FC, R, FW 770,000 16,000 306,000 232,000 1951 Bureau <strong>of</strong> Reclamation, $166,429,000<br />
Gainesville 3 Red River 21 FC, WS, FW, R, P 82,151 4,268 35,000 17,500 1995 USACE $106,705,000<br />
Gracemont 3 Sugar Creek 16 FC, WS, FW, R 120,000 3,748 49,000 5,000 1973 Bureau <strong>of</strong> Reclamation $80,378,000<br />
Kechi 4 Little <strong>Washita</strong> River 16 FC, FW, R, WS 131,000 2,939 51,400 8,000 1973 Bureau <strong>of</strong> Reclamation $95,795,000<br />
Purdy 4 Rush Creek 14 WS, FC, FW, R 236,000 5,792 126,000 20,000 1973 Bureau <strong>of</strong> Reclamation $165,473,000<br />
Ravia 4 Mill Creek 21 WS, FW, R 0 1,718 100,800 25,300 1969 Bureau <strong>of</strong> Reclamation $146,816,000<br />
Verden 3 Spring Creek 16 WS, FW, R 46,000 2,048 34,000 5,000 1973 Bureau <strong>of</strong> Reclamation $56,222,000<br />
1 WS=<strong>Water</strong> Supply, R=Recreation, HP=Hydroelectric Power, IR=Irrigation, WQ=<strong>Water</strong> Quality, FW=Fish & Wildlife, FC=Flood Control, LF=Low Flow Regulation, N=Navigation, C=Conservation, CW=Cooling <strong>Water</strong><br />
2 The majority <strong>of</strong> cost estimates were updated using estimated costs from previous project reports combined with the U.S. Army Corps <strong>of</strong> Engineers Civil Works Construction Cost Index System (CWCCIS) annual escalation figures to<br />
scale the original cost estimates to present-day cost estimates. These estimated costs may not accurately reflect current conditions at the proposed project site and are meant to be used for general comparative purposes only.<br />
38 <strong>Lower</strong> <strong>Washita</strong> Regional Report <strong>Oklahoma</strong> Comprehensive <strong>Water</strong> Plan
Expanded <strong>Water</strong> Supply Options<br />
<strong>Lower</strong> <strong>Washita</strong> Region<br />
<strong>Oklahoma</strong> Comprehensive <strong>Water</strong> Plan<br />
<strong>Lower</strong> <strong>Washita</strong> Regional Report 39
<strong>Oklahoma</strong> Comprehensive <strong>Water</strong> Plan<br />
Data & Analysis<br />
<strong>Lower</strong> <strong>Washita</strong> <strong>Water</strong>shed Planning Region<br />
Basin 14<br />
41
Basin 14 Summary<br />
Synopsis<br />
• <strong>Water</strong> users are expected to continue to rely mainly on surface water and to a lesser<br />
extent alluvial and bedrock groundwater.<br />
• Alluvial groundwater storage depletions may occur by 2020, but will be minimal in<br />
size relative to aquifer storage in the basin. However, localized storage depletions may<br />
cause adverse effects for users.<br />
• To reduce the risk <strong>of</strong> adverse impacts on water supplies, it is recommended that<br />
storage depletions be decreased where economically feasible.<br />
• Additional conservation measures could reduce alluvial groundwater storage depletions.<br />
• Reservoir storage could be used as an alternative to mitigate alluvial groundwater<br />
storage depletions.<br />
Current Demand by Source and Sector<br />
<strong>Lower</strong> <strong>Washita</strong> Region, Basin 14<br />
Total Demand<br />
22,890 AFY<br />
Basin 14 accounts for about 28% <strong>of</strong> the current<br />
demand in the <strong>Lower</strong> <strong>Washita</strong> <strong>Water</strong>shed<br />
Planning Region. About 55% <strong>of</strong> the basin’s<br />
demand is from the Municipal and Industrial<br />
sector. Crop Irrigation is the second largest<br />
demand sector at 20%. Surface water satisfies<br />
about 56% <strong>of</strong> the current demand in the basin.<br />
Groundwater satisfies about 44% <strong>of</strong> the demand<br />
(19% alluvial and 25% bedrock). The peak<br />
summer month demand in Basin 14 is about 2.9<br />
times the winter monthly demand, which is<br />
similar to the overall statewide pattern.<br />
The flow in the <strong>Washita</strong> River near Dickson<br />
is typically greater than 22,000 AF/month<br />
throughout the year and greater than 60,000<br />
AF/month in the spring and early summer.<br />
However, the river can have periods <strong>of</strong> low<br />
flow in the summer, fall, and winter. There<br />
is one major federal reservoir and six large<br />
municipal lakes in Basin 14. Lake <strong>of</strong> the<br />
Arbuckles was constructed by the Bureau<br />
<strong>of</strong> Reclamation in 1967 on Rock Creek, a<br />
tributary <strong>of</strong> t he <strong>Washita</strong> River. The lake<br />
was built for the purposes <strong>of</strong> water supply,<br />
flood control, recreation, and fish and wildlife<br />
mitigation and contains 62,600 acre-feet <strong>of</strong><br />
conservation storage yielding 24,000 AFY.<br />
The entire yield is allocated to the Arbuckle<br />
Master Conservancy District, which provides<br />
water to the cities <strong>of</strong> Ardmore, Davis, Sulphur,<br />
Wynnewood, and Dougherty.<br />
Humphreys (yield <strong>of</strong> 3,226 AFY), Fuqua<br />
(yield <strong>of</strong> 3,427 AFY), Duncan (unknown<br />
yield), and Clear Creek (unknown yield)<br />
are municipal lakes used by the City <strong>of</strong><br />
Duncan for water supply and recreation.<br />
Duncan and Humphreys are on tributaries<br />
<strong>of</strong> Wildhorse Creek and Fuqua is on Black<br />
Bear Creek. Humphreys and Fuqua are<br />
NRCS projects that also provide flood<br />
control storage. The City <strong>of</strong> Pauls Valley<br />
obtains water supplies from Pauls Valley<br />
Lake (unknown yield) and RC Longmire<br />
(yield <strong>of</strong> 3,360 AFY). Pauls Valley is<br />
located on Washington Creek and RC<br />
Longmire, an NRCS structure, is located<br />
Keel Sandy Creek. All lakes in Basin 14<br />
are fully allocated except Fuqua, which<br />
currently has 2,182 AFY <strong>of</strong> unpermitted<br />
yield. Future use <strong>of</strong> these sources would<br />
need to take into consideration existing<br />
water rights. The availability <strong>of</strong> permits<br />
is not expected to limit the development<br />
<strong>of</strong> surface water supplies for in-basin use<br />
through 2060. Relative to other basins<br />
in the state, the surface water quality in<br />
Basin 14 is considered good. However,<br />
there are multiple creeks impaired for<br />
Agricultural use due to high levels <strong>of</strong><br />
<strong>Water</strong> <strong>Resources</strong><br />
<strong>Lower</strong> <strong>Washita</strong> Region, Basin 14<br />
42 <strong>Lower</strong> <strong>Washita</strong> Regional Report <strong>Oklahoma</strong> Comprehensive <strong>Water</strong> Plan
Median Historical Streamflow<br />
at the Basin Outlet<br />
<strong>Lower</strong> <strong>Washita</strong> Region, Basin 14<br />
Projected <strong>Water</strong> Demand<br />
<strong>Lower</strong> <strong>Washita</strong> Region, Basin 14<br />
chloride, sulfate, and total dissolved solids<br />
(TDS), including Caddo Creek, Wildhorse<br />
Creek, Rush Creek, a segment <strong>of</strong> the <strong>Washita</strong><br />
River, and Pauls Valley Lake.<br />
The majority <strong>of</strong> groundwater rights in Basin<br />
14 are from the <strong>Washita</strong> River major alluvial<br />
aquifer, Rush Springs major bedrock aquifer,<br />
and non-delineated minor bedrock aquifers.<br />
There are also substantial rights in the<br />
Arbuckle-Simpson major bedrock aquifer,<br />
which has over 2.4 million AF <strong>of</strong> water in<br />
storage in the basin, and in non-delineated<br />
minor alluvial aquifers. While these aquifers<br />
have substantial volumes <strong>of</strong> water in storage<br />
in Basin 14, the major aquifers underlie only<br />
relatively small portions <strong>of</strong> the basin and minor<br />
aquifers may have insufficient yields for large<br />
volume users. Another potential limitation<br />
is that the OWRB is currently studying the<br />
Arbuckle-Simpson aquifer to set a maximum<br />
annual yield and equal proportionate share that<br />
will likely decrease the amount <strong>of</strong> permitted<br />
water available for withdrawal. Basin 14<br />
contributes about 42,000 AFY <strong>of</strong> recharge<br />
to the Rush Springs and Arbuckle-Simpson<br />
aquifers. There are additional permits in other<br />
minor aquifers. Domestic users do not require<br />
a permit and are assumed to be obtaining<br />
supplies from groundwater sources in the<br />
basin. The use <strong>of</strong> groundwater to meet in-basin<br />
demand is not expected to be limited by the<br />
availability <strong>of</strong> permits through 2060. There are<br />
no significant groundwater quality issues in<br />
the basin. However, localized areas with high<br />
levels <strong>of</strong> nitrate and fluoride have been found<br />
in other areas <strong>of</strong> the Rush Springs aquifer and<br />
may occur in Basin 14.<br />
The projected 2060 water demand <strong>of</strong> 31,400<br />
AFY in Basin 14 reflects an 8,510 AFY increase<br />
(37%) over the 2010 demand. The largest<br />
demand will be in the Municipal and Industrial<br />
sector. However, largest growth in demand will<br />
be in the Crop Irrigation demand sector.<br />
Gaps & Depletions<br />
Based on projected demand and historical<br />
hydrology, alluvial groundwater storage<br />
depletions may occur by 2020. No surface<br />
water gaps or bedrock groundwater depletions<br />
are expected through 2060.<br />
Lake <strong>of</strong> the Arbuckles is capable <strong>of</strong> providing<br />
dependable water supplies to its existing users<br />
and with new infrastructure could be used<br />
to meet all <strong>of</strong> Basin 14 future surface water<br />
demand during periods <strong>of</strong> low streamflow.<br />
However, the lake is currently fully allocated.<br />
Therefore, any future use <strong>of</strong> this source would<br />
need to take into consideration existing water<br />
rights.<br />
Alluvial groundwater storage depletions are<br />
expected to be up to 390 AFY and have a 17%<br />
probability <strong>of</strong> occurring in at least one month<br />
<strong>Water</strong> Supply Limitations<br />
<strong>Lower</strong> <strong>Washita</strong> Region, Basin 14<br />
Surface <strong>Water</strong><br />
Alluvial Groundwater<br />
Bedrock Groundwater<br />
n Minimal n Potential n Significant<br />
<strong>Water</strong> Supply Option<br />
Effectiveness<br />
<strong>Lower</strong> <strong>Washita</strong> Region, Basin 14<br />
Demand Management<br />
Out-<strong>of</strong>-Basin Supplies<br />
Reservoir Use<br />
Increasing Supply from Surface <strong>Water</strong><br />
Increasing Supply from Groundwater<br />
n Typically Effective n Potentially Effective<br />
n Likely Ineffective<br />
n No Option Necessary<br />
<strong>of</strong> the year by 2060. Alluvial groundwater<br />
storage depletions in Basin 14 may occur<br />
during the summer and fall. Projected annual<br />
alluvial groundwater storage depletions are<br />
minimal relative to the amount <strong>of</strong> water in<br />
storage in Basin 14’s major aquifers. However,<br />
localized storage depletions may adversely<br />
affect well yields, water quality, and/or<br />
pumping costs.<br />
Options<br />
<strong>Water</strong> users are expected to continue to<br />
rely primarily on surface water supplies<br />
and, to a lesser extent, alluvial and bedrock<br />
groundwater. To reduce the risk <strong>of</strong> adverse<br />
impacts to the basin’s water users, alluvial<br />
groundwater storage depletions should be<br />
decreased where economically feasible.<br />
Moderately expanded permanent conservation<br />
activities in the Municipal and Industrial,<br />
Self-Supplied Residential, and Crop<br />
Irrigation demand sectors could reduce<br />
alluvial groundwater storage depletions.<br />
Temporary drought management activities<br />
may not be needed for groundwater demand<br />
since groundwater storage could continue to<br />
provide supplies during droughts.<br />
Out-<strong>of</strong>-basin supplies could mitigate<br />
groundwater storage depletions. The OCWP<br />
Reservoir Viability Study, which evaluated the<br />
potential for reservoirs throughout the state,<br />
identified nine potentially viable out-<strong>of</strong>-basin<br />
sites in the region. Additionally, Lake Texoma,<br />
in Basin 21, has substantial unpermitted yield<br />
to meet the needs <strong>of</strong> new users but its use is<br />
limited by water quality considerations. In<br />
light <strong>of</strong> the distance to reliable water supplies,<br />
out-<strong>of</strong>-basin supplies may not be cost-effective<br />
for many users in the basin.<br />
Additional reservoir storage in Basin 14 could<br />
effectively supplement supply during dry months.<br />
The entire increase in demand from 2010 to 2060<br />
could be supplied by a new river diversion and<br />
2,600 AF <strong>of</strong> reservoir storage at the basin outlet.<br />
The OCWP Reservoir Viability Study also identified<br />
three potential sites in Basin 14.<br />
Increased reliance on surface water through<br />
direct diversions without reservoir storage,<br />
may create surface water gaps and is not<br />
recommended.<br />
Increased reliance on the Rush Springs or<br />
Arbuckle-Simpson bedrock aquifers could<br />
mitigate alluvial groundwater storage<br />
depletions, but could create bedrock<br />
groundwater depletions. While depletions<br />
would be minimal compared to the amount <strong>of</strong><br />
water in storage in these aquifers, the Rush<br />
Springs and Arbuckle-Simpson underlies only<br />
relatively small portions <strong>of</strong> the basin.<br />
<strong>Oklahoma</strong> Comprehensive <strong>Water</strong> Plan<br />
<strong>Lower</strong> <strong>Washita</strong> Regional Report 43
Basin 14 Data & Analysis<br />
Surface <strong>Water</strong> <strong>Resources</strong><br />
• Historical streamflow from 1950 through 2007<br />
was used to estimate the range <strong>of</strong> future surface<br />
water supplies. The <strong>Washita</strong> River near Dickson<br />
had a period <strong>of</strong> below-average streamflow from<br />
the early 1960s to the mid 1970s. From the late<br />
1980s through the late 1990s, the basin went<br />
through a prolonged period <strong>of</strong> above-average<br />
streamflow and precipitation, demonstrating the<br />
hydrologic variability in the basin.<br />
• The median flow in the <strong>Washita</strong> River near<br />
Dickson is greater than 22,000 AF/month<br />
throughout the year and greater than 60,000 AF/<br />
month in the spring and early summer. However,<br />
the river can have periods <strong>of</strong> low flow in the<br />
summer, fall, and winter.<br />
• Relative to other basins in the state, the basin’s<br />
surface water quality is considered good.<br />
• There is one major and six large lakes in Basin<br />
14. Lake <strong>of</strong> the Arbuckles provides 24,000 AFY<br />
<strong>of</strong> dependable water supply yield for the Arbuckle<br />
Master Conservancy District and its members.<br />
The City <strong>of</strong> Duncan obtains water supplies from<br />
Lake Humphreys (yield <strong>of</strong> 3,226 AFY), Fuqua<br />
(yield <strong>of</strong> 3,427AFY), Duncan (unknown yield),<br />
and Clear Creek (unknown yield). The City <strong>of</strong><br />
Pauls Valley obtains water supplies from Pauls<br />
Valley Lake (unknown yield) and RC Longmire<br />
(yield <strong>of</strong> 3,360 AFY). With the exception <strong>of</strong> 2,182<br />
AFY <strong>of</strong> unpermitted yield from Fuqua, Basin 14’s<br />
reservoirs are fully allocated.<br />
Monthly Historical Streamflow at the Basin Outlet<br />
<strong>Lower</strong> <strong>Washita</strong> Region, Basin 14<br />
Historical Streamflow at the Basin Outlet<br />
<strong>Lower</strong> <strong>Washita</strong> Region, Basin 14<br />
Historical Precipitation<br />
Regional Climate Division<br />
44 <strong>Lower</strong> <strong>Washita</strong> Regional Report, Basin Data & Analysis <strong>Oklahoma</strong> Comprehensive <strong>Water</strong> Plan
Aquifer<br />
Groundwater <strong>Resources</strong> - Aquifer Summary 2010<br />
<strong>Lower</strong> <strong>Washita</strong> Region, Basin 14<br />
Portion <strong>of</strong> Basin<br />
Overlaying Aquifer<br />
Current<br />
Groundwater Rights<br />
Aquifer Storage<br />
in Basin<br />
Equal<br />
Proportionate<br />
Share<br />
Groundwater<br />
Available for<br />
New Permits<br />
Name Type Class 1 Percent AFY AF AFY/Acre AFY<br />
Antlers Bedrock Major
<strong>Water</strong> Demand<br />
• Basin 14’s water needs account for<br />
about 28% <strong>of</strong> the demand in the <strong>Lower</strong><br />
<strong>Washita</strong> <strong>Water</strong>shed Planning Region<br />
and will increase by 37% (8,510<br />
AFY) from 2010 to 2060. The largest<br />
demand will be in the Municipal and<br />
Industrial sector. However, the largest<br />
growth in demand will be from the<br />
Crop Irrigation demand sector.<br />
• Surface water is used to meet 56% <strong>of</strong><br />
total demands in the basin and its use<br />
will increase by 36% (4,630 AFY) from<br />
2010 to 2060. The majority <strong>of</strong> the<br />
surface water use and largest growth in<br />
surface water use during this period will<br />
be from the Municipal and Industrial<br />
demand sector.<br />
• Alluvial groundwater is used to meet 19%<br />
<strong>of</strong> total demand in the basin and its use<br />
will increase by 33% (1,420 AFY) from<br />
2010 to 2060. The majority <strong>of</strong> alluvial<br />
groundwater use during this period will<br />
be from the Municipal and Industrial<br />
demand sector. However, the highest<br />
growth in alluvial groundwater use from<br />
2010 to 2060 will be from the Crop<br />
Irrigation demand sector.<br />
• Bedrock groundwater is used to meet<br />
25% <strong>of</strong> total demand in the basin and<br />
its use will increase by 44% (2,460<br />
AFY) from 2010 to 2060. The majority<br />
<strong>of</strong> bedrock groundwater use by 2060<br />
and the highest growth in bedrock<br />
groundwater use will be from the Crop<br />
Irrigation demand sector.<br />
Surface <strong>Water</strong> Demand<br />
by Sector<br />
<strong>Lower</strong> <strong>Washita</strong> Region, Basin 14<br />
Planning<br />
Horizon<br />
Crop<br />
Irrigation<br />
Livestock<br />
Alluvial Groundwater Demand<br />
by Sector<br />
<strong>Lower</strong> <strong>Washita</strong> Region, Basin 14<br />
Total Demand by Sector<br />
<strong>Lower</strong> <strong>Washita</strong> Region, Basin 14<br />
Municipal &<br />
Industrial<br />
Oil & Gas<br />
AFY<br />
Self-Supplied<br />
Industrial<br />
Self-Supplied<br />
Residential<br />
Bedrock Groundwater Demand<br />
by Sector<br />
<strong>Lower</strong> <strong>Washita</strong> Region, Basin 14<br />
•Thermoelectric Power •Self-Supplied Residential •Self-Supplied Industrial •Oil & Gas •Municipal & Industrial •Livestock •Crop Irrigation<br />
Thermoelectric<br />
Power<br />
2010 4,610 2,280 12,630 1,890 230 1,250 0 22,890<br />
2020 5,390 2,340 13,270 3,270 230 1,290 0 25,790<br />
2030 6,180 2,400 13,840 3,010 230 1,330 0 26,990<br />
2040 6,970 2,450 14,390 3,060 230 1,360 0 28,460<br />
2050 7,580 2,510 15,020 3,030 230 1,400 0 29,770<br />
2060 8,550 2,570 15,680 2,920 240 1,440 0 31,400<br />
Total<br />
46 <strong>Lower</strong> <strong>Washita</strong> Regional Report, Basin Data & Analysis <strong>Oklahoma</strong> Comprehensive <strong>Water</strong> Plan
Monthly Demand Distribution by Sector (2010)<br />
<strong>Lower</strong> <strong>Washita</strong> Region, Basin 14<br />
Monthly Demand Distribution by Source (2010)<br />
<strong>Lower</strong> <strong>Washita</strong> Region, Basin 14<br />
Current Monthly Demand<br />
Distribution by Sector<br />
• The Municipal and Industrial and Self-<br />
Supplied Residential demand sectors use<br />
76% more water in summer months than<br />
in winter months. Crop Irrigation has a<br />
high demand in summer months and<br />
little or no demand in winter months.<br />
Other demand sectors have more<br />
consistent demand throughout the year.<br />
Current Monthly Demand<br />
Distribution by Source<br />
• The peak summer month total water<br />
demand in Basin 14 is 2.9 times the<br />
winter monthly demand, which is similar<br />
to the overall statewide pattern. Surface<br />
water use in the peak summer month is<br />
about 2.5 times the winter monthly use.<br />
Monthly alluvial groundwater use peaks<br />
in the summer at about 2.9 times the<br />
monthly winter use. Monthly bedrock<br />
groundwater use peaks in the summer<br />
at 4.3 times the monthly winter use.<br />
<strong>Oklahoma</strong> Comprehensive <strong>Water</strong> Plan<br />
<strong>Lower</strong> <strong>Washita</strong> Regional Report, Basin Data & Analysis 47
Gaps and Storage Depletions<br />
• Based on projected demand and historical<br />
hydrology, alluvial groundwater storage depletions<br />
may occur by 2020. No surface water gaps or<br />
bedrock groundwater depletions are expected in<br />
Basin 14 through 2060.<br />
• Lake <strong>of</strong> the Arbuckles is capable <strong>of</strong> providing<br />
dependable water supplies to its existing users,<br />
and with new infrastructure, could be used to meet<br />
all <strong>of</strong> the Basin 14 future surface water demand<br />
during periods <strong>of</strong> low streamflow. However, the<br />
lake is currently fully allocated. Therefore, any<br />
future use <strong>of</strong> this source would need to take into<br />
consideration existing water rights.<br />
• Alluvial groundwater storage depletions in Basin<br />
14 may occur during the summer and fall, peaking<br />
in size during the summer. Alluvial groundwater<br />
storage depletions in 2060 will be up to 28%<br />
(250 AF/month) <strong>of</strong> the alluvial groundwater<br />
demand in the peak summer month, and as<br />
much as 25% (140 AF/month) <strong>of</strong> the fall month’s<br />
alluvial groundwater demand. There will be a<br />
17% probability <strong>of</strong> alluvial groundwater storage<br />
depletions occurring in at least one month <strong>of</strong><br />
the year by 2060. Alluvial groundwater storage<br />
depletions are most likely to occur during summer<br />
months.<br />
• Projected annual alluvial groundwater storage<br />
depletions are minimal relative to the amount <strong>of</strong><br />
water stored in the basin’s major aquifers. However,<br />
localized storage depletions may adversely affect<br />
well yields, water quality, and/or pumping costs.<br />
Months (Season)<br />
Planning<br />
Horizon<br />
Surface <strong>Water</strong> Gaps by Season<br />
(2060 Demand)<br />
<strong>Lower</strong> <strong>Washita</strong> Region, Basin 14<br />
Magnitude and Probability <strong>of</strong> Annual<br />
Gaps and Storage Depletions<br />
<strong>Lower</strong> <strong>Washita</strong> Region, Basin 14<br />
Maximum Gaps/Storage Depletions<br />
Surface<br />
<strong>Water</strong><br />
Maximum Gap 1 Median Gap Probability<br />
AF/month AF/month Percent<br />
Dec-Feb (Winter) 0 0 0%<br />
Mar-May (Spring) 0 0 0%<br />
Jun-Aug (Summer) 0 0 0%<br />
Sep-Nov (Fall) 0 0 0%<br />
1 Amount shown represents largest amount for any one month in season indicated.<br />
Alluvial<br />
Groundwater<br />
AFY<br />
Bedrock<br />
Groundwater<br />
Probability <strong>of</strong> Gaps/<br />
Storage Depletions<br />
Surface<br />
<strong>Water</strong><br />
Percent<br />
Alluvial<br />
Groundwater<br />
2020 0 50 0 0% 2%<br />
2030 0 120 0 0% 3%<br />
2040 0 210 0 0% 7%<br />
2050 0 320 0 0% 14%<br />
2060 0 390 0 0% 17%<br />
Alluvial Groundwater Storage Depletions<br />
by Season (2060 Demand)<br />
<strong>Lower</strong> <strong>Washita</strong> Region, Basin 14<br />
Months (Season)<br />
Maximum<br />
Storage<br />
Depletion 1<br />
Median<br />
Storage<br />
Depletion<br />
Probability<br />
AF/month AF/month Percent<br />
Dec-Feb (Winter) 0 0 0%<br />
Mar-May (Spring) 0 0 0%<br />
Jun-Aug (Summer) 250 245 14%<br />
Sep-Nov (Fall) 140 70 3%<br />
1 Amount shown represents largest amount for any one month in season<br />
indicated.<br />
Bedrock Groundwater Storage<br />
Depletions by Season (2060 Demand)<br />
<strong>Lower</strong> <strong>Washita</strong> Region, Basin 14<br />
Months (Season)<br />
Storage Depletion 1<br />
AF/month<br />
Dec-Feb (Winter) 0<br />
Mar-May (Spring) 0<br />
Jun-Aug (Summer) 0<br />
Sep-Nov (Fall) 0<br />
1 Amount shown represents largest amount for any one month in season<br />
indicated.<br />
48 <strong>Lower</strong> <strong>Washita</strong> Regional Report, Basin Data & Analysis <strong>Oklahoma</strong> Comprehensive <strong>Water</strong> Plan
Conservation Activities 1<br />
Reliable Diversions Based on Available<br />
Streamflow and New Reservoir Storage<br />
<strong>Lower</strong> <strong>Washita</strong> Region, Basin 14<br />
Reservoir Storage<br />
AF<br />
Required Storage to Meet<br />
Growth in Demand (AF)<br />
Reducing <strong>Water</strong> Needs<br />
Through Conservation<br />
<strong>Lower</strong> <strong>Washita</strong> Region, Basin 14<br />
Diversion<br />
AFY<br />
100 300<br />
500 1,600<br />
1,000 3,300<br />
2,500 8,200<br />
5,000 15,000<br />
Required Storage to Meet Growth<br />
in Surface <strong>Water</strong> Demand (AF)<br />
2060 Gap/Storage Depletion<br />
Surface<br />
<strong>Water</strong><br />
Alluvial<br />
GW<br />
AFY<br />
Bedrock<br />
GW<br />
2,600<br />
1,300<br />
2060 Gap/Storage<br />
Depletion Probability<br />
Surface<br />
<strong>Water</strong><br />
Percent<br />
Alluvial<br />
GW<br />
Existing Conditions 0 390 0 0% 17%<br />
Moderately Expanded Conservation<br />
in Crop Irrigation <strong>Water</strong> Use<br />
Moderately Expanded<br />
Conservation in M&I <strong>Water</strong> Use<br />
Moderately Expanded<br />
Conservation in Crop Irrigation<br />
and M&I <strong>Water</strong> Use<br />
Substantially Expanded<br />
Conservation in Crop Irrigation<br />
and M&I <strong>Water</strong> Use<br />
0 370 0 0% 16%<br />
0 270 0 0% 12%<br />
0 240 0 0% 12%<br />
0 100 0 0% 3%<br />
1 Conservation Activities are documented in the OCWP <strong>Water</strong> Demand Forecast Report.<br />
<strong>Water</strong> Supply Options & Effectiveness<br />
Demand Management<br />
n Typically Effective<br />
n Likely Ineffective<br />
n Potentially Effective<br />
n No Option Necessary<br />
n Moderately expanded permanent conservation activities in the Municipal and Industrial, Self-Supplied<br />
Residential, and Crop Irrigation demand sectors could reduce alluvial groundwater storage depletions<br />
by 38%. Temporary drought management activities are not expected to be needed for groundwater<br />
demand, since groundwater storage could continue to provide supplies during droughts.<br />
Out-<strong>of</strong>-Basin Supplies<br />
n Out-<strong>of</strong>-basin supplies could mitigate alluvial and groundwater storage depletions. The OCWP Reservoir<br />
Viability Study, which evaluated the potential for reservoirs throughout the state, identified nine potential<br />
out-<strong>of</strong>-basin sites in the <strong>Lower</strong> <strong>Washita</strong> Region: Chickasha, Gracemont, Kechi and Verden in Basin<br />
16; Durwood, Gainesville and Ravia in Basin 21; Burneyville in Basin 22; and Courtney in Basin 23. In<br />
addition, Lake Texoma in Basin 21 has substantial unpermitted yield to meet the needs <strong>of</strong> new users, but<br />
its use is limited by water quality considerations. In light <strong>of</strong> the distance to reliable water supplies, out-<strong>of</strong>basin<br />
supplies may not be cost-effective for many users in the basin.<br />
Reservoir Use<br />
n Additional reservoir storage in Basin 14 could effectively supplement supply during dry months. The<br />
entire increase in demand from 2010 to 2060 could be supplied by a new river diversion and 2,600 AF<br />
<strong>of</strong> reservoir storage at the basin outlet. The use <strong>of</strong> multiple reservoirs in the basin or reservoirs upstream<br />
<strong>of</strong> the basin’s outlet may increase the amount <strong>of</strong> storage necessary to mitigate future storage depletions.<br />
- The OCWP Reservoir Viability Study also identified Caddo Creek, Cox City and Purdy Reservoirs as<br />
potentially viable sites in Basin 14<br />
Increasing Reliance on Surface <strong>Water</strong><br />
n Increased reliance on surface water through direct diversions without reservoir storage will increase<br />
surface water gaps and is not recommended.<br />
Increasing Reliance on Groundwater<br />
n Increased reliance on the Rush Springs or Arbuckle-Simpson bedrock aquifers could mitigate alluvial<br />
groundwater storage depletions but could create bedrock groundwater depletions. While depletions<br />
would be minimal compared to the amount <strong>of</strong> water in storage in these aquifers, the Rush Springs<br />
and Arbuckle-Simpson underlie only relatively small portions <strong>of</strong> the basin. In addition, the preliminary<br />
results <strong>of</strong> the Arbuckle-Simpson Hydrology Study indicate that in order to comply with 2003 Senate Bill<br />
288, the equal proportionate share will be significantly lower than the current 2 AFY/acre allocation for<br />
temporary permits.<br />
<strong>Oklahoma</strong> Comprehensive <strong>Water</strong> Plan<br />
<strong>Lower</strong> <strong>Washita</strong> Regional Report, Basin Data & Analysis 49
<strong>Oklahoma</strong> Comprehensive <strong>Water</strong> Plan<br />
Data & Analysis<br />
<strong>Lower</strong> <strong>Washita</strong> <strong>Water</strong>shed Planning Region<br />
Basin 15<br />
51
Basin 15 Summary<br />
Synopsis<br />
• <strong>Water</strong> users are expected to continue to rely on all sources: surface water, alluvial<br />
groundwater, and bedrock groundwater.<br />
• By 2020, there is a low probability <strong>of</strong> surface water gaps from increased demands on<br />
existing supplies during low flow periods.<br />
• Alluvial and bedrock groundwater storage depletions may occur by 2020, but will<br />
be small in size relative to aquifer storage in the basin. However, localized storage<br />
depletions may cause adverse effects for users.<br />
• To reduce the risk <strong>of</strong> adverse impacts on water supplies, it is recommended that gaps<br />
and storage depletions be decreased where economically feasible.<br />
• Additional conservation or temporary drought management measures could reduce<br />
surface water gaps and groundwater storage depletions.<br />
• Use <strong>of</strong> additional dependable groundwater supplies and/or developing new small<br />
reservoirs could be used mitigate surface water gaps without major impacts to<br />
groundwater storage.<br />
Basin 15 accounts for about 8% <strong>of</strong> the current<br />
demand in the <strong>Lower</strong> <strong>Washita</strong> <strong>Water</strong>shed<br />
Planning Region. About 36% <strong>of</strong> the basin’s<br />
demand is from the Crop Irrigation demand<br />
sector. Municipal and Industrial is the second<br />
largest demand sector at 29%. Surface water<br />
satisfies about 45% <strong>of</strong> the current demand<br />
in the basin. Groundwater satisfies about<br />
55% <strong>of</strong> the current demand (29% alluvial and<br />
26% bedrock). The peak summer month total<br />
water demand in Basin 15 is about 4.8 times<br />
the winter monthly demand, which is similar<br />
to the overall statewide pattern.<br />
The flow in the <strong>Washita</strong> River near Pauls<br />
Valley is typically greater than 14,900 AF/<br />
month throughout the year and greater than<br />
25,000 AF/month in the spring. However,<br />
the river can have periods <strong>of</strong> low flow in any<br />
month <strong>of</strong> the year. Wiley Post Memorial<br />
Lake provides 538 AFY <strong>of</strong> dependable yield<br />
to the City <strong>of</strong> Maysville and is currently fully<br />
allocated. The availability <strong>of</strong> permits is not<br />
expected to limit the development <strong>of</strong> surface<br />
water supplies for in-basin use through 2060.<br />
Relative to other basins in the state, the<br />
surface water quality in Basin 15 is considered<br />
Current Demand by Source and Sector<br />
<strong>Lower</strong> <strong>Washita</strong> Region, Basin 15<br />
<strong>Water</strong> <strong>Resources</strong><br />
<strong>Lower</strong> <strong>Washita</strong> Region, Basin 15<br />
Total Demand<br />
6,180 AFY<br />
52 <strong>Lower</strong> <strong>Washita</strong> Regional Report <strong>Oklahoma</strong> Comprehensive <strong>Water</strong> Plan
Median Historical Streamflow<br />
at the Basin Outlet<br />
<strong>Lower</strong> <strong>Washita</strong> Region, Basin 15<br />
Projected <strong>Water</strong> Demand<br />
<strong>Lower</strong> <strong>Washita</strong> Region, Basin 15<br />
poor. Stealy Creek is impaired for Agricultural<br />
use due to high levels <strong>of</strong> chloride.<br />
The greatest quantity <strong>of</strong> groundwater permits<br />
in Basin 15 are from the <strong>Washita</strong> River major<br />
alluvial aquifer. This aquifer has 681,000 AF <strong>of</strong><br />
storage in Basin 15 and underlies 28% <strong>of</strong> the<br />
basin. There are also substantial permits in the<br />
Rush Springs major bedrock aquifer, El Reno<br />
minor bedrock aquifer, and non-delineated<br />
minor bedrock aquifers. Basin 15 contributes<br />
about 1,000 AFY <strong>of</strong> recharge to the Rush<br />
Springs aquifer. Domestic users (Self-Supplied<br />
Residential demand sector) do not require<br />
a permit and are assumed to be obtaining<br />
supplies from aquifers in the basin. The use <strong>of</strong><br />
groundwater to meet in-basin demand is not<br />
expected to be limited by the availability <strong>of</strong><br />
permits through 2060. There are no significant<br />
groundwater quality issues in the basin.<br />
However, localized areas with high levels <strong>of</strong><br />
nitrate and fluoride have been found in the<br />
overall Rush Springs aquifer and may occur in<br />
Basin 15.<br />
The projected 2060 water demand <strong>of</strong> 9,750<br />
AFY in Basin 15 reflects a 3,570 AFY increase<br />
(58%) over the 2010 demand. The largest<br />
demand over this period will be in the Crop<br />
Irrigation demand sector. However, the<br />
largest growth in demand will be in the Oil<br />
and Gas demand sector.<br />
Gaps & Depletions<br />
Based on projected demand and historical<br />
hydrology, surface water gaps and groundwater<br />
storage depletions may occur by 2020.<br />
Surface water gaps will be up to 420 AFY<br />
and have a 16% probability <strong>of</strong> occurring in at<br />
least one month <strong>of</strong> the year by 2060. Alluvial<br />
groundwater storage depletions will be up<br />
to 220 AFY and have a 16% probability <strong>of</strong><br />
occurring in at least one month <strong>of</strong> the year<br />
by 2060. Surface water gaps and alluvial<br />
groundwater storage depletions in Basin 15<br />
may occur during the summer and fall. Bedrock<br />
groundwater storage depletions will be up to<br />
580 AFY and will occur throughout the year,<br />
peaking in summer. Relative to the amount<br />
<strong>of</strong> water in storage in the basin, projected<br />
groundwater storage depletions are small.<br />
However, localized storage depletions may<br />
adversely affect well yields, water quality, and/<br />
or pumping costs.<br />
Options<br />
<strong>Water</strong> users are expected to continue to<br />
rely on all sources: surface water, alluvial<br />
groundwater, and bedrock groundwater.<br />
To reduce the risk <strong>of</strong> adverse impacts to the<br />
basin’s water users, surface water gaps and<br />
groundwater storage depletions should be<br />
decreased where economically feasible.<br />
Moderately expanded permanent conservation<br />
activities in the Municipal and Industrial,<br />
Self-Supplied Residential, and Crop Irrigation<br />
<strong>Water</strong> Supply Limitations<br />
<strong>Lower</strong> <strong>Washita</strong> Region, Basin 15<br />
Surface <strong>Water</strong><br />
Alluvial Groundwater<br />
Bedrock Groundwater<br />
n Minimal n Potential n Significant<br />
<strong>Water</strong> Supply Option<br />
Effectiveness<br />
<strong>Lower</strong> <strong>Washita</strong> Region, Basin 15<br />
Demand Management<br />
Out-<strong>of</strong>-Basin Supplies<br />
Reservoir Use<br />
Increasing Supply from Surface <strong>Water</strong><br />
Increasing Supply from Groundwater<br />
n Typically Effective n Potentially Effective<br />
n Likely Ineffective<br />
n No Option Necessary<br />
demand sectors could reduce surface water<br />
gaps and groundwater storage depletions.<br />
Due to the low probability <strong>of</strong> gaps, temporary<br />
drought management may be effective in<br />
reducing surface water use and subsequent<br />
gaps. Temporary drought management<br />
activities are not expected to be needed for<br />
groundwater demand, since the groundwater<br />
storage could continue to provide supplies<br />
during droughts.<br />
Out-<strong>of</strong>-basin supplies could mitigate<br />
surface water gaps and groundwater storage<br />
depletions. The OCWP Reservoir Viability<br />
Study, which evaluated the potential for<br />
reservoirs throughout the state, identified<br />
twelve potentially viable out-<strong>of</strong>-basin sites<br />
in the <strong>Lower</strong> <strong>Washita</strong> Region. In addition,<br />
Lake Texoma, in Basin 21, has substantial<br />
unpermitted yield to meet the needs <strong>of</strong> new<br />
users, but its use may be limited by water<br />
quality constraints. In light <strong>of</strong> the low<br />
probability <strong>of</strong> gaps and distance to reliable<br />
water supplies, out-<strong>of</strong>-basin supplies may not<br />
be cost-effective for many users in the basin.<br />
Additional reservoir storage in Basin 15 could<br />
effectively supplement supply during dry<br />
months. The entire increase in demand from<br />
2010 to 2060 could be supplied by a new<br />
reservoir diversion and 800 AF <strong>of</strong> reservoir<br />
storage at the basin outlet.<br />
Increased reliance on surface water through<br />
direct diversions, without reservoir storage,<br />
will increase surface water gaps and is not<br />
recommended.<br />
Increased reliance on alluvial aquifer could<br />
mitigate surface water gaps and bedrock<br />
groundwater storage depletions, but would<br />
increase the <strong>Washita</strong> River alluvial aquifer<br />
storage depletions. Any increases in storage<br />
depletions would be small relative to the<br />
volume <strong>of</strong> water stored in the <strong>Washita</strong> River<br />
alluvial aquifer. However, the aquifer only<br />
underlies about 30% <strong>of</strong> the basin.<br />
<strong>Oklahoma</strong> Comprehensive <strong>Water</strong> Plan<br />
<strong>Lower</strong> <strong>Washita</strong> Regional Report 53
Basin 15 Data & Analysis<br />
Surface <strong>Water</strong> <strong>Resources</strong><br />
• Historical streamflow from 1950 through<br />
2007 was used to estimate the range <strong>of</strong><br />
future surface water supplies. The <strong>Washita</strong><br />
River near Pauls Valley had a period <strong>of</strong><br />
below-average streamflow from the early<br />
1960s to the early 1980s. From the mid<br />
1980s through the late 1990s, the basin<br />
went through a prolonged period <strong>of</strong> aboveaverage<br />
streamflow and precipitation,<br />
demonstrating the hydrologic variability in<br />
the basin.<br />
• The median flow in the <strong>Washita</strong> River near<br />
Pauls Valley is greater than 14,900 AF/<br />
month throughout the year and greater<br />
than 25,000 AF/month in the spring.<br />
However, the river can have periods <strong>of</strong> low<br />
flow in any month <strong>of</strong> the year.<br />
• Relative to other basins in the state,<br />
the surface water quality in Basin 15<br />
is considered poor. However, individual<br />
lakes and streams may have acceptable<br />
water quality.<br />
• Wiley Post Memorial Lake provides 538<br />
AFY <strong>of</strong> dependable yield to the City <strong>of</strong><br />
Maysville and is currently fully allocated.<br />
Monthly Historical Streamflow at the Basin Outlet<br />
<strong>Lower</strong> <strong>Washita</strong> Region, Basin 15<br />
Historical Streamflow at the Basin Outlet<br />
<strong>Lower</strong> <strong>Washita</strong> Region, Basin 15<br />
Historical Precipitation<br />
Regional Climate Division<br />
54 <strong>Lower</strong> <strong>Washita</strong> Regional Report, Basin Data & Analysis <strong>Oklahoma</strong> Comprehensive <strong>Water</strong> Plan
Aquifer<br />
Groundwater <strong>Resources</strong> - Aquifer Summary (2010)<br />
<strong>Lower</strong> <strong>Washita</strong> Region, Basin 15<br />
Portion <strong>of</strong> Basin<br />
Overlaying Aquifer<br />
Current<br />
Groundwater<br />
Rights<br />
Aquifer Storage<br />
in Basin<br />
Equal<br />
Proportionate<br />
Share<br />
Groundwater<br />
Available for<br />
New Permits<br />
Name Type Class 1 Percent AFY AF AFY/Acre AFY<br />
Canadian River Alluvial Major 3% 0 48,000 temporary 2.0 25,600<br />
Rush Springs Bedrock Major 2% 3,300 97,000 temporary 2.0 9,000<br />
<strong>Washita</strong> River Alluvial Major 28% 6,100 681,000 1.5 152,900<br />
El Reno Bedrock Minor 43% 2,300 763,000 temporary 2.0 291,500<br />
Non-Delineated<br />
Groundwater Source<br />
Non-Delineated<br />
Groundwater Source<br />
Bedrock Minor N/A 2,000 N/A temporary 2.0 N/A<br />
Alluvial Minor N/A 0 N/A temporary 2.0 N/A<br />
1 Bedrock aquifers with typical yields greater than 50 gpm and alluvial aquifers with typical yields greater than 150 gpm are considered major.<br />
Groundwater <strong>Resources</strong><br />
• The majority <strong>of</strong> groundwater rights in<br />
Basin 21 are from the <strong>Washita</strong> River,<br />
Rush Springs, and El Reno aquifers.<br />
There are also substantial water rights<br />
from non-delineated minor groundwater<br />
sources. Basin 15 contributes about<br />
1,000 AFY <strong>of</strong> recharge to the Rush<br />
Springs aquifer.<br />
• There are no significant groundwater<br />
quality issues in the basin; however,<br />
localized areas with high levels <strong>of</strong> nitrate<br />
and fluoride have been found in the<br />
Rush Springs aquifer and may occur in<br />
Basin 15.<br />
<strong>Oklahoma</strong> Comprehensive <strong>Water</strong> Plan<br />
<strong>Lower</strong> <strong>Washita</strong> Regional Report, Basin Data & Analysis 55
<strong>Water</strong> Demand<br />
• Basin 15’s water needs account for<br />
about 8% <strong>of</strong> the demand in the <strong>Lower</strong><br />
<strong>Washita</strong> <strong>Water</strong>shed Planning Region<br />
and will increase by 58% (3,570 AFY)<br />
from 2010 to 2060. The largest demand<br />
during this period will be in the Crop<br />
Irrigation demand sector. However, the<br />
largest growth in demand will be from<br />
the Oil and Gas demand sector.<br />
• Surface water is used to meet 45% <strong>of</strong><br />
total demand in the basin and its use<br />
will increase by 77% (2,160 AFY) from<br />
2010 to 2060. The largest surface<br />
water demand will initially be from the<br />
Crop Irrigation demand sector, which<br />
will be superseded by Oil and Gas water<br />
demand by 2060.<br />
• Alluvial groundwater is used to meet<br />
29% <strong>of</strong> total demand in the basin and<br />
its use will increase by 43% (770 AFY)<br />
from 2010 to 2060. The largest alluvial<br />
groundwater demand and growth in<br />
demand over this period will be in the<br />
Municipal and Industrial and Self-<br />
Supplied Residential demand sectors.<br />
• Bedrock groundwater is used to meet<br />
26% <strong>of</strong> total demand in the basin and<br />
its use will increase by 41% (640 AFY)<br />
from 2010 to 2060. The largest bedrock<br />
groundwater demand and growth in<br />
demand during this perios will be from<br />
the Crop Irrigation and Municipal and<br />
Industrial demand sectors.<br />
Surface <strong>Water</strong> Demand<br />
by Sector<br />
<strong>Lower</strong> <strong>Washita</strong> Region, Basin 15<br />
Planning<br />
Horizon<br />
Crop Irrigation<br />
Livestock<br />
Alluvial Groundwater Demand<br />
by Sector<br />
<strong>Lower</strong> <strong>Washita</strong> Region, Basin 15<br />
Total Demand by Sector<br />
<strong>Lower</strong> <strong>Washita</strong> Region, Basin 15<br />
Municipal &<br />
Industrial<br />
Oil & Gas<br />
AFY<br />
Self-Supplied<br />
Industrial<br />
Self-Supplied<br />
Residential<br />
Bedrock Groundwater Demand<br />
by Sector<br />
<strong>Lower</strong> <strong>Washita</strong> Region, Basin 15<br />
•Thermoelectric Power •Self-Supplied Residential •Self-Supplied Industrial •Oil & Gas •Municipal & Industrial •Livestock •Crop Irrigation<br />
Thermoelectric<br />
Power<br />
2010 2,220 860 1,830 480 120 670 0 6,180<br />
2020 2,420 870 1,980 680 120 750 0 6,820<br />
2030 2,620 890 2,110 930 120 810 0 7,480<br />
2040 2,830 900 2,250 1,210 130 880 0 8,200<br />
2050 2,980 910 2,390 1,540 130 940 0 8,890<br />
2060 3,230 930 2,540 1,900 140 1,010 0 9,750<br />
Total<br />
56 <strong>Lower</strong> <strong>Washita</strong> Regional Report, Basin Data & Analysis <strong>Oklahoma</strong> Comprehensive <strong>Water</strong> Plan
Monthly Demand Distribution by Sector (2010)<br />
<strong>Lower</strong> <strong>Washita</strong> Region, Basin 15<br />
Monthly Demand Distribution by Source (2010)<br />
<strong>Lower</strong> <strong>Washita</strong> Region, Basin 15<br />
Current Monthly Demand<br />
Distribution by Sector<br />
• The Municipal and Industrial and Self-<br />
Supplied Residential demand sectors use<br />
74% more water in summer months than<br />
in winter months. Crop Irrigation has a<br />
high demand in summer months and<br />
little or no demand in winter months.<br />
Other demand sectors have more<br />
consistent demand throughout the year.<br />
Current Monthly Demand<br />
Distribution by Source<br />
• The peak summer month total water<br />
demand in Basin 15 is 4.8 times the<br />
winter demand, which is similar to the<br />
overall statewide pattern. Surface water<br />
use in the peak summer month is 4.6<br />
times the winter monthly use. Monthly<br />
alluvial groundwater use peaks in the<br />
summer at 3.7 times the monthly winter<br />
use. Monthly bedrock groundwater use<br />
peaks in the summer at 7.1 times the<br />
monthly winter use.<br />
<strong>Oklahoma</strong> Comprehensive <strong>Water</strong> Plan<br />
<strong>Lower</strong> <strong>Washita</strong> Regional Report, Basin Data & Analysis 57
Gaps and Storage Depletions<br />
• Based on projected demand and historical hydrology,<br />
surface water gaps and groundwater storage depletions may<br />
occur by 2020.<br />
• Surface water gaps in Basin 15 may occur during the summer<br />
and fall, peaking in size during the summer. Surface water<br />
gaps in 2060 will be up to 31% (300 AF/month) <strong>of</strong> the surface<br />
water demand in the peak summer month, and as much<br />
as 32% (140 AF/month) <strong>of</strong> the fall monthly surface water<br />
demand. There will be a 16% probability <strong>of</strong> gaps occurring in<br />
at least one month <strong>of</strong> the year by 2060. Surface water gaps<br />
are most likely to occur during summer months.<br />
• Alluvial groundwater storage depletions in Basin 15 may<br />
occur during the summer and fall, peaking in size during the<br />
summer. Alluvial groundwater storage depletions in 2060 will<br />
be up to 30% (150 AF/month) <strong>of</strong> the alluvial groundwater<br />
demand in the peak summer month, and as much as 33% (80<br />
AF/month) <strong>of</strong> the fall monthly alluvial groundwater demand.<br />
There will be a 16% probability <strong>of</strong> alluvial groundwater<br />
storage depletions occurring in at least one month <strong>of</strong> the year<br />
by 2060. Alluvial groundwater storage depletions are most<br />
likely to occur during summer months.<br />
• Bedrock groundwater storage depletions in Basin 15 may<br />
occur throughout the year, peaking in size during the summer.<br />
Bedrock groundwater storage depletions in 2060 will be 30%<br />
(180 AF/month) <strong>of</strong> the bedrock groundwater demand in the<br />
peak summer month, and 13% (10 AF/month) <strong>of</strong> the winter<br />
monthly bedrock groundwater demand.<br />
• Relative to the amount <strong>of</strong> water in storage in the basin,<br />
projected groundwater storage depletions are small. However,<br />
localized storage depletions may adversely affect well yields,<br />
water quality, and/or pumping costs.<br />
Months (Season)<br />
Planning<br />
Horizon<br />
Surface <strong>Water</strong> Gaps<br />
by Season (2060 Demand)<br />
<strong>Lower</strong> <strong>Washita</strong> Region, Basin 15<br />
Magnitude and Probability<br />
<strong>of</strong> Annual Gaps and Storage Depletions<br />
<strong>Lower</strong> <strong>Washita</strong> Region, Basin 15<br />
Maximum Gaps/Storage Depletions<br />
Surface<br />
<strong>Water</strong><br />
Maximum<br />
Gap 1 Median Gap Probability<br />
AF/month AF/month Percent<br />
Dec-Feb (Winter) 0 0 0%<br />
Mar-May (Spring) 0 0 0%<br />
Jun-Aug (Summer) 300 230 12%<br />
Sep-Nov (Fall) 140 120 5%<br />
1 Amount shown represents largest amount for any one month in season indicated.<br />
Alluvial<br />
Groundwater<br />
AFY<br />
Bedrock<br />
Groundwater<br />
Probability <strong>of</strong> Gaps/<br />
Storage Depletions<br />
Surface<br />
<strong>Water</strong><br />
Alluvial<br />
Groundwater<br />
Percent<br />
2020 50 30 90 3% 3%<br />
2030 80 50 190 5% 5%<br />
2040 210 120 300 7% 7%<br />
2050 280 160 400 10% 10%<br />
2060 420 220 580 16% 16%<br />
Alluvial Groundwater Storage Depletion<br />
by Season (2060 Demand)<br />
<strong>Lower</strong> <strong>Washita</strong> Region, Basin 15<br />
Months (Season)<br />
Maximum<br />
Storage<br />
Depletion 1<br />
Median<br />
Storage<br />
Depletion<br />
Probability<br />
AF/month AF/month Percent<br />
Dec-Feb (Winter) 0 0 0%<br />
Mar-May (Spring) 0 0 0%<br />
Jun-Aug (Summer) 150 120 12%<br />
Sep-Nov (Fall) 80 70 5%<br />
1 Amount shown represents largest amount for any one month in season<br />
indicated.<br />
Bedrock Groundwater Storage<br />
Depletions by Season (2060 Demand)<br />
<strong>Lower</strong> <strong>Washita</strong> Region, Basin 15<br />
Months (Season)<br />
Average Storage Depletion 1<br />
AF/month<br />
Dec-Feb (Winter) 10<br />
Mar-May (Spring) 40<br />
Jun-Aug (Summer) 180<br />
Sep-Nov (Fall) 60<br />
1 Amount shown represents largest amount for any one month in season<br />
indicated.<br />
58 <strong>Lower</strong> <strong>Washita</strong> Regional Report, Basin Data & Analysis <strong>Oklahoma</strong> Comprehensive <strong>Water</strong> Plan
Conservation Activities 1<br />
Reliable Diversions Based on Available<br />
Streamflow and New Reservoir Storage<br />
<strong>Lower</strong> <strong>Washita</strong> Region, Basin 15<br />
Reservoir Storage<br />
AF<br />
Required Storage to Meet<br />
Growth in Demand (AF)<br />
Reducing <strong>Water</strong> Needs<br />
Through Conservation<br />
<strong>Lower</strong> <strong>Washita</strong> Region, Basin 15<br />
Required Storage to Meet Growth<br />
in Surface <strong>Water</strong> Demand (AF)<br />
2060 Gap/Storage Depletion<br />
Surface<br />
<strong>Water</strong><br />
Alluvial<br />
GW<br />
AFY<br />
Bedrock<br />
GW<br />
Diversion<br />
AFY<br />
100 700<br />
500 2,300<br />
1,000 4,400<br />
2,500 10,500<br />
5,000 17,100<br />
800<br />
400<br />
2060 Gap/Storage<br />
Depletion Probability<br />
Surface<br />
<strong>Water</strong><br />
Percent<br />
Alluvial<br />
GW<br />
Existing Conditions 420 220 580 16% 16%<br />
Moderately Expanded Conservation<br />
in Crop Irrigation <strong>Water</strong> Use<br />
Moderately Expanded<br />
Conservation in M&I <strong>Water</strong> Use<br />
Moderately Expanded<br />
Conservation in Crop Irrigation<br />
and M&I <strong>Water</strong> Use<br />
Substantially Expanded<br />
Conservation in Crop Irrigation<br />
and M&I <strong>Water</strong> Use<br />
350 190 520 14% 14%<br />
310 160 450 12% 12%<br />
280 150 380 10% 10%<br />
160 80 250 7% 7%<br />
1 Conservation Activities are documented in the OCWP <strong>Water</strong> Demand Forecast Report.<br />
<strong>Water</strong> Supply Options & Effectiveness<br />
Demand Management<br />
n Typically Effective<br />
n Likely Ineffective<br />
n Potentially Effective<br />
n No Option Necessary<br />
n Moderately expanded permanent conservation activities in the Municipal and Industrial, Self-Supplied<br />
Residential, and Crop Irrigation demand sectors could reduce surface water gaps, alluvial and bedrock<br />
groundwater depletions by 30% to 35%. Due to the low probability <strong>of</strong> gaps, temporary drought<br />
management may be effective in reducing surface water use and subsequent gaps. Temporary drought<br />
management activities may not be needed for groundwater demand, since the groundwater storage<br />
could continue to provide supplies during droughts.<br />
Out-<strong>of</strong>-Basin Supplies<br />
n Out-<strong>of</strong>-basin supplies could mitigate groundwater storage depletions. The OCWP Reservoir Viability Study,<br />
which evaluated the potential for reservoirs throughout the state, identified twelve potential out-<strong>of</strong>-basin<br />
sites in the <strong>Lower</strong> <strong>Washita</strong> Region: Caddo Creek, Cox City and Purdy in Basin 14; Chickasha, Gracemont,<br />
Kechi and Verden in Basin 16; Durwood, Gainesville and Ravia in Basin 21; Burneyville in Basin 22;<br />
and Courtney in Basin 23. In addition, Lake Texoma, in Basin 21, has substantial unpermitted yield to<br />
meet the needs <strong>of</strong> new users, but water quality issues may constrain its use. However, in light <strong>of</strong> the low<br />
probability <strong>of</strong> gaps and distance to reliable water supplies, out-<strong>of</strong>-basin supplies may not be cost-effective<br />
for many users in the basin.<br />
Reservoir Use<br />
n Additional reservoir storage in Basin 15 could effectively supplement supply during dry months. The<br />
entire increase in demand from 2010 to 2060 could be supplied by a new river diversion and 800<br />
AF <strong>of</strong> reservoir storage at the basin outlet. The use <strong>of</strong> multiple reservoirs in the basin or reservoirs<br />
upstream <strong>of</strong> the basin’s outlet may increase the amount <strong>of</strong> storage necessary to mitigate future gaps<br />
and storage depletions.<br />
Increasing Reliance on Surface <strong>Water</strong><br />
n Increased reliance on surface water through direct diversions, without reservoir storage, will increase<br />
surface water gaps and is not recommended.<br />
Increasing Reliance on Groundwater<br />
n Increased reliance on the <strong>Washita</strong> River alluvial aquifer could mitigate surface water gaps and bedrock<br />
groundwater storage depletions but would increase alluvial storage depletions. Any increases in storage<br />
depletions would be small relative to the volume <strong>of</strong> water stored in the <strong>Washita</strong> River alluvial aquifer.<br />
However, the aquifer only underlies about 30% <strong>of</strong> the basin.<br />
<strong>Oklahoma</strong> Comprehensive <strong>Water</strong> Plan<br />
<strong>Lower</strong> <strong>Washita</strong> Regional Report, Basin Data & Analysis 59
<strong>Oklahoma</strong> Comprehensive <strong>Water</strong> Plan<br />
Data & Analysis<br />
<strong>Lower</strong> <strong>Washita</strong> <strong>Water</strong>shed Planning Region<br />
Basin 16<br />
61
Basin 16 Summary<br />
Synopsis<br />
• <strong>Water</strong> users are expected to continue to rely primarily surface water and bedrock<br />
groundwater.<br />
• By 2020, there is a low probability <strong>of</strong> surface water gaps from increased demands<br />
on existing supplies during low flow periods.<br />
• Alluvial groundwater storage depletions may occur by 2020, but will be minimal in<br />
size relative to aquifer storage in the basin. However, localized storage depletions<br />
may cause adverse effects for users.<br />
• To reduce the risk <strong>of</strong> adverse impacts on water supplies, it is recommended that<br />
gaps and storage depletions be decreased where economically feasible.<br />
• Additional conservation or temporary drought management measures could reduce<br />
surface water gaps and groundwater storage depletions.<br />
• Increasing use <strong>of</strong> dependable groundwater supplies and/or developing<br />
new reservoirs could mitigate surface water gaps without major impacts to<br />
groundwater storage.<br />
<strong>Water</strong> <strong>Resources</strong><br />
<strong>Lower</strong> <strong>Washita</strong> Region, Basin 16<br />
Basin 16 accounts for about 25% <strong>of</strong> the current<br />
demand in the <strong>Lower</strong> <strong>Washita</strong> <strong>Water</strong>shed<br />
Planning Region. About 55% <strong>of</strong> the basin’s<br />
demand is from the Crop Irrigation demand<br />
sector. Municipal and Industrial is the second<br />
largest demand sector at 24%. Surface water<br />
satisfies about 44% <strong>of</strong> the current demand in the<br />
basin. Groundwater satisfies about 56% <strong>of</strong> the<br />
current demand (7% alluvial and 49% bedrock).<br />
The peak summer month total water demand in<br />
Basin 16 is about 7.3 times the winter monthly<br />
demand, which is more pronounced than the<br />
overall statewide pattern.<br />
The flow in the <strong>Washita</strong> River at Alex is<br />
typically greater than 12,900 AF/month<br />
throughout the year and greater than 20,000<br />
AF/month in the spring and early summer.<br />
However, the river can have periods <strong>of</strong> low<br />
flow in any month <strong>of</strong> the year, particularly in<br />
late summer and early fall. Lake Chickasha is<br />
the only large reservoir in the region. It was<br />
Current Demand by Source and Sector<br />
<strong>Lower</strong> <strong>Washita</strong> Region, Basin 16<br />
Total Demand<br />
19,720 AFY<br />
62 <strong>Lower</strong> <strong>Washita</strong> Regional Report <strong>Oklahoma</strong> Comprehensive <strong>Water</strong> Plan
Median Historical Streamflow<br />
at the Basin Outlet<br />
<strong>Lower</strong> <strong>Washita</strong> Region, Basin 16<br />
Projected <strong>Water</strong> Demand<br />
<strong>Lower</strong> <strong>Washita</strong> Region, Basin 16<br />
built on Spring Creek in 1958 for water supply<br />
and recreation for the City <strong>of</strong> Chickasha. The<br />
lake is currently not being used as a source <strong>of</strong><br />
water supply due to poor water quality. While<br />
Basin 16 currently has water available for new<br />
surface water permits, the basin is expected<br />
to be fully allocated by 2060. Relative to other<br />
basins in the state, the surface water quality<br />
in Basin 16 is considered poor. Stealy Creek is<br />
impaired for Agricultural use due to high levels<br />
<strong>of</strong> chloride.<br />
The majority <strong>of</strong> groundwater permits in Basin 16<br />
are from the Rush Springs major bedrock aquifer.<br />
This aquifer has over 9 million AF <strong>of</strong> storage in<br />
Basin 16 and underlies about 40% <strong>of</strong> the basin.<br />
There are also substantial permits in the El Reno<br />
minor bedrock aquifer and the <strong>Washita</strong> River<br />
major alluvial aquifer. Basin 16 contributes about<br />
43,000 AFY <strong>of</strong> recharge to the Rush Springs<br />
aquifer. The use <strong>of</strong> groundwater to meet in-basin<br />
demand is not expected to be limited by the<br />
availability <strong>of</strong> permits through 2060. Domestic<br />
users (Self-Supplied Residential demand sector)<br />
do not require a permit and are assumed to be<br />
obtaining supplies from aquifers in the basin. There<br />
are no significant groundwater quality issues in the<br />
basin. However, localized areas with high levels <strong>of</strong><br />
nitrate and fluoride have been found in the overall<br />
Rush Springs aquifer and may occur in Basin 16.<br />
The projected 2060 water demand <strong>of</strong> 26,380<br />
AFY in Basin 16 reflects a 6,660 AFY increase<br />
(34%) over the 2010 demand. The majority<br />
<strong>of</strong> the demand and the largest growth in<br />
demand will be in the Crop Irrigation demand<br />
sector. However, there will also be substantial<br />
growth in the Oil and Gas and Municipal and<br />
Industrial demand sectors.<br />
Gaps And Depletions<br />
Based on projected demand and historical<br />
hydrology, surface water gaps and alluvial<br />
groundwater storage depletions may occur<br />
by 2020. No bedrock groundwater storage<br />
depletions are expected through 2060. Surface<br />
water gaps and alluvial groundwater storage<br />
depletions in Basin 16 may occur during the<br />
summer. Surface water gaps will be up to 420<br />
AFY and have a 5% probability <strong>of</strong> occurring<br />
in at least one month <strong>of</strong> the year by 2060.<br />
Alluvial groundwater storage depletions will<br />
be up to 50 AFY and have a 5% probability <strong>of</strong><br />
occurring in at least one month <strong>of</strong> the year by<br />
2060. Projected alluvial groundwater storage<br />
depletions are minimal relative to the amount<br />
<strong>of</strong> water in storage in the <strong>Washita</strong> River<br />
aquifer. However, localized storage depletions<br />
may adversely affect well yields, water quality,<br />
and/or pumping costs.<br />
Options<br />
<strong>Water</strong> users are expected to continue to<br />
rely primarily on surface water and bedrock<br />
groundwater. To reduce the risk <strong>of</strong> adverse<br />
impacts to the basin’s water users, surface<br />
<strong>Water</strong> Supply Limitations<br />
<strong>Lower</strong> <strong>Washita</strong> Region, Basin 16<br />
Surface <strong>Water</strong><br />
Alluvial Groundwater<br />
Bedrock Groundwater<br />
n Minimal n Potential n Significant<br />
<strong>Water</strong> Supply Option<br />
Effectiveness<br />
<strong>Lower</strong> <strong>Washita</strong> Region, Basin 16<br />
Demand Management<br />
Out-<strong>of</strong>-Basin Supplies<br />
Reservoir Use<br />
Increasing Supply from Surface <strong>Water</strong><br />
Increasing Supply from Groundwater<br />
n Typically Effective n Potentially Effective<br />
n Likely Ineffective<br />
n No Option Necessary<br />
water gaps and alluvial groundwater storage<br />
depletions should be decreased where<br />
economically feasible.<br />
Moderately expanded permanent conservation<br />
activities in the Municipal and Industrial,<br />
Self-Supplied Residential, and Crop Irrigation<br />
demand sectors could reduce surface water<br />
gaps and alluvial groundwater storage<br />
depletions. Due to the low probability <strong>of</strong><br />
gaps, temporary drought management may<br />
be effective in reducing surface water use<br />
and subsequent gaps. Temporary drought<br />
management activities may not be needed for<br />
groundwater demand, since the groundwater<br />
storage could continue to provide supplies<br />
during droughts.<br />
Out-<strong>of</strong>-basin supplies could mitigate<br />
surface water gaps and groundwater storage<br />
depletions. The OCWP Reservoir Viability Study,<br />
which evaluated the potential for reservoirs<br />
throughout the state, identified eight potentially<br />
viable out-<strong>of</strong>-basin sites in the <strong>Lower</strong> <strong>Washita</strong><br />
Region. However, in light <strong>of</strong> the low probability<br />
<strong>of</strong> gaps and substantial groundwater supplies,<br />
out-<strong>of</strong>-basin supplies may not be cost-effective<br />
for many users in the basin.<br />
Additional reservoir storage in Basin 16 could<br />
effectively supplement supply during dry<br />
months. The entire increase in demand from<br />
2010 to 2060 could be supplied by a new<br />
reservoir diversion and 1,200 AF <strong>of</strong> reservoir<br />
storage at the basin outlet. The OCWP Reservoir<br />
Viability Study also identified four potentially<br />
viable sites in Basin 16.<br />
Increased reliance on surface water without<br />
reservoir storage, will increase surface water<br />
gaps and is not recommended.<br />
Increased reliance on bedrock groundwater<br />
could mitigate surface water gaps and alluvial<br />
groundwater storage depletions but could also<br />
create bedrock storage depletions. Any storage<br />
depletions would be minimal relative to the<br />
volume <strong>of</strong> water stored in the basin’s portion<br />
<strong>of</strong> the Rush Springs aquifer. However, this<br />
aquifer only underlies 40% <strong>of</strong> the basin.<br />
<strong>Oklahoma</strong> Comprehensive <strong>Water</strong> Plan<br />
<strong>Lower</strong> <strong>Washita</strong> Regional Report 63
Basin 16 Data & Analysis<br />
Surface <strong>Water</strong> <strong>Resources</strong><br />
• Historical streamflow from 1950 through<br />
2007 was used to estimate the range <strong>of</strong><br />
future surface water supplies. The <strong>Washita</strong><br />
River at Alex had a period <strong>of</strong> below-average<br />
streamflow from the early 1960s to the early<br />
1980s. From the mid 1980s through the late<br />
1990s, the basin went through a prolonged<br />
period <strong>of</strong> above-average streamflow and<br />
precipitation, demonstrating hydrologic<br />
variability in the basin.<br />
• The median flow in the <strong>Washita</strong> River at Alex<br />
is greater than 12,900 AF/month throughout<br />
the year and greater than 20,000 AF/month<br />
in the spring and early summer. However,<br />
the river can have periods <strong>of</strong> low flow in any<br />
month <strong>of</strong> the year, particularly in late summer<br />
and early fall.<br />
• Relative to other basins in the state, the surface<br />
water quality in Basin 16 is considered poor.<br />
However, individual lakes and streams may<br />
have acceptable water quality.<br />
• Lake Chickasha is owned by the City <strong>of</strong><br />
Chickasha. The lake is currently not being<br />
used as a major source <strong>of</strong> water supply due<br />
to poor water quality.<br />
Monthly Historical Streamflow at the Basin Outlet<br />
<strong>Lower</strong> <strong>Washita</strong> Region, Basin 16<br />
Historical Streamflow at the Basin Outlet<br />
<strong>Lower</strong> <strong>Washita</strong> Region, Basin 16<br />
Historical Precipitation<br />
Regional Climate Division<br />
64 <strong>Lower</strong> <strong>Washita</strong> Regional Report, Basin Data & Analysis <strong>Oklahoma</strong> Comprehensive <strong>Water</strong> Plan
Aquifer<br />
Groundwater <strong>Resources</strong> - Aquifer Summary (2010)<br />
<strong>Lower</strong> <strong>Washita</strong> Region, Basin 16<br />
Portion <strong>of</strong> Basin<br />
Overlaying<br />
Aquifer<br />
Current<br />
Groundwater<br />
Rights<br />
Aquifer Storage<br />
in Basin<br />
Equal<br />
Proportionate<br />
Share<br />
Groundwater<br />
Available for<br />
New Permits<br />
Name Type Class 1 Percent AFY AF AFY/Acre AFY<br />
Rush Springs Bedrock Major 40% 36,200 9,303,000 temporary 2.0 518,800<br />
<strong>Washita</strong> River Alluvial Major 20% 2,400 556,000 1.5 289,900<br />
El Reno Bedrock Minor 40% 5,500 1,493,000 temporary 2.0 569,000<br />
Non-Delineated Groundwater Source Bedrock Minor N/A 0 N/A temporary 2.0 N/A<br />
Non-Delineated Groundwater Source Alluvial Minor N/A 0 N/A temporary 2.0 N/A<br />
1 Bedrock aquifers with typical yields greater than 50 gpm and alluvial aquifers with typical yields greater than 150 gpm are considered major.<br />
Groundwater <strong>Resources</strong><br />
• The majority <strong>of</strong> groundwater permits<br />
in Basin 16 are from the Rush Springs<br />
aquifer. This aquifer has more than 9<br />
million AF <strong>of</strong> storage in Basin 16 and<br />
underlies 40% <strong>of</strong> the basin. There are<br />
also substantial permits in the El Reno<br />
aquifer and the <strong>Washita</strong> River aquifer.<br />
Basin 16 contributes about 43,000 AFY<br />
<strong>of</strong> recharge to the Rush Springs aquifer.<br />
• There are no significant groundwater<br />
quality issues in basin. However,<br />
localized areas with high levels <strong>of</strong> nitrate<br />
and fluoride have been found in the<br />
Rush Springs aquifer and may occur in<br />
Basin 16.<br />
<strong>Oklahoma</strong> Comprehensive <strong>Water</strong> Plan<br />
<strong>Lower</strong> <strong>Washita</strong> Regional Report, Basin Data & Analysis 65
<strong>Water</strong> Demand<br />
• Basin 16’s water needs account for<br />
about 25% <strong>of</strong> the demand in the <strong>Lower</strong><br />
<strong>Washita</strong> <strong>Water</strong>shed Planning Region<br />
and will increase by 34% (6,660 AFY)<br />
from 2010 to 2060. The majority <strong>of</strong><br />
the demand and the largest growth in<br />
demand will be from the Crop Irrigation<br />
demand sector. However, there will<br />
also be substantial growth in the Oil<br />
and Gas and Municipal and Industrial<br />
demand sectors.<br />
• Surface water is used to meet 44% <strong>of</strong><br />
total demand in the basin and its use<br />
will increase by 44% (3,820 AFY) from<br />
2010 to 2060. The majority <strong>of</strong> the<br />
surface water use will be in the Crop<br />
Irrigation and Municipal and Industrial<br />
demand sectors. However, the Oil and<br />
Gas demand sector will have the largest<br />
growth in surface water demand.<br />
• Alluvial groundwater is used to meet<br />
7% <strong>of</strong> total demand in the basin and<br />
its use will increase by 27% (360 AFY)<br />
from 2010 to 2060. The majority <strong>of</strong><br />
the alluvial groundwater demand and<br />
growth in demand during this period will<br />
be from the Self-Supplied Residential<br />
demand sector.<br />
• Bedrock groundwater is used to meet 49%<br />
<strong>of</strong> total demand in the basin and its use<br />
will increase by 26% (2,480 AFY) from<br />
2010 to 2060. The majority <strong>of</strong> the bedrock<br />
groundwater demand and growth in<br />
demand during this period will be from the<br />
Crop Irrigation demand sector.<br />
Surface <strong>Water</strong> Demand<br />
by Sector<br />
<strong>Lower</strong> <strong>Washita</strong> Region, Basin 16<br />
Planning<br />
Horizon<br />
Crop Irrigation<br />
Livestock<br />
Alluvial Groundwater Demand<br />
by Sector<br />
<strong>Lower</strong> <strong>Washita</strong> Region, Basin 16<br />
Total Demand by Sector<br />
<strong>Lower</strong> <strong>Washita</strong> Region, Basin 16<br />
Municipal &<br />
Industrial<br />
Oil & Gas<br />
AFY<br />
Self-Supplied<br />
Industrial<br />
Self-Supplied<br />
Residential<br />
Bedrock Groundwater Demand<br />
by Sector<br />
<strong>Lower</strong> <strong>Washita</strong> Region, Basin 16<br />
•Thermoelectric Power •Self-Supplied Residential •Self-Supplied Industrial •Oil & Gas •Municipal & Industrial •Livestock •Crop Irrigation<br />
Thermoelectric<br />
Power<br />
2010 10,860 2,100 4,790 810 160 1,000 0 19,720<br />
2020 11,390 2,140 5,080 1,150 160 1,060 0 20,980<br />
2030 11,920 2,180 5,330 1,550 160 1,100 0 22,240<br />
2040 12,450 2,220 5,560 2,010 170 1,150 0 23,560<br />
2050 12,860 2,270 5,790 2,530 170 1,190 0 24,810<br />
2060 13,510 2,310 6,030 3,120 180 1,230 0 26,380<br />
Total<br />
66 <strong>Lower</strong> <strong>Washita</strong> Regional Report, Basin Data & Analysis <strong>Oklahoma</strong> Comprehensive <strong>Water</strong> Plan
Monthly Demand Distribution by Sector (2010)<br />
<strong>Lower</strong> <strong>Washita</strong> Region, Basin 16<br />
Monthly Demand Distribution by Source (2010)<br />
<strong>Lower</strong> <strong>Washita</strong> Region, Basin 16<br />
Current Monthly Demand<br />
Distribution by Sector<br />
• The Municipal and Industrial and Self-<br />
Supplied Residential demand sectors use<br />
71% more water in summer months than<br />
in winter months. Crop Irrigation has a<br />
high demand in summer months and<br />
little or no demand in winter months.<br />
Other demand sectors have more<br />
consistent demand throughout the year.<br />
Current Monthly Demand<br />
Distribution by Source<br />
• The peak summer month total water<br />
demand in Basin 16 is 7.3 times the<br />
winter monthly demand, which is more<br />
pronounced than the overall statewide<br />
pattern. Surface water use in the<br />
peak summer month is 5.2 times the<br />
winter monthly use. Monthly alluvial<br />
groundwater use peaks in the summer<br />
at 3.1 times the monthly winter use.<br />
Monthly bedrock groundwater use peaks<br />
in the summer at 12.2 times the winter<br />
monthly use.<br />
<strong>Oklahoma</strong> Comprehensive <strong>Water</strong> Plan<br />
<strong>Lower</strong> <strong>Washita</strong> Regional Report, Basin Data & Analysis 67
Gaps and Storage Depletions<br />
• Based on projected demand and historical<br />
hydrology, surface water gaps and alluvial<br />
groundwater storage depletions may occur<br />
by 2020. No bedrock groundwater storage<br />
depletions are expected through 2060.<br />
• Surface water gaps in Basin 16 have a 5%<br />
probability <strong>of</strong> occurring during the summer<br />
by 2050. Surface water gaps in 2060<br />
will be up to 17% (420 AF/month) <strong>of</strong> the<br />
surface water demand in the peak summer<br />
month.<br />
• Alluvial groundwater storage depletions<br />
in Basin 16 have a 5% probability <strong>of</strong><br />
occurring during the summer by 2050.<br />
Alluvial groundwater storage depletions in<br />
2060 will be up to 19% (50 AF/month) <strong>of</strong><br />
the alluvial groundwater demand in the<br />
peak summer month. Projected annual<br />
alluvial groundwater storage depletions<br />
are minimal relative to the amount <strong>of</strong><br />
water stored in Basin 16’s major aquifers.<br />
However, localized storage depletions may<br />
adversely affect well yields, water quality,<br />
and/or pumping costs.<br />
Months (Season)<br />
Planning<br />
Horizon<br />
Magnitude and Probability<br />
<strong>of</strong> Annual Gaps and Storage Depletions<br />
<strong>Lower</strong> <strong>Washita</strong> Region, Basin 16<br />
Maximum Gaps/Storage Depletions<br />
Surface<br />
<strong>Water</strong><br />
Surface <strong>Water</strong> Gaps<br />
by Season (2060 Demand)<br />
<strong>Lower</strong> <strong>Washita</strong> Region, Basin 16<br />
Maximum Gap 1 Median Gap Probability<br />
AF/month AF/month Percent<br />
Dec-Feb (Winter) 0 0 0%<br />
Mar-May (Spring) 0 0 0%<br />
Jun-Aug (Summer) 420 390 5%<br />
Sep-Nov (Fall) 0 0 0%<br />
1 Amount shown represents largest amount for any one month in season indicated.<br />
Alluvial<br />
Groundwater<br />
AFY<br />
Bedrock<br />
Groundwater<br />
Probability <strong>of</strong> Gaps/<br />
Storage Depletions<br />
Surface<br />
<strong>Water</strong><br />
Alluvial<br />
Groundwater<br />
Percent<br />
2020 60 10 0 2% 2%<br />
2030 130 20 0 2% 2%<br />
2040 220 30 0 3% 2%<br />
2050 310 40 0 5% 5%<br />
2060 420 50 0 5% 5%<br />
Alluvial Groundwater Storage Depletions<br />
by Season (2060 Demand)<br />
<strong>Lower</strong> <strong>Washita</strong> Region, Basin 16<br />
Months (Season)<br />
Maximum<br />
Storage<br />
Depletion 1<br />
Median Storage<br />
Depletion<br />
Probability<br />
AF/month AF/month Percent<br />
Dec-Feb (Winter) 0 0 0%<br />
Mar-May (Spring) 0 0 0%<br />
Jun-Aug (Summer) 50 50 5%<br />
Sep-Nov (Fall) 0 0 0%<br />
1 Amount shown represents largest amount for any one month in season indicated.<br />
Bedrock Groundwater Storage Depletions<br />
by Season (2060 Demand)<br />
<strong>Lower</strong> <strong>Washita</strong> Region, Basin 16<br />
Months (Season)<br />
Average Storage Depletion 1<br />
AF/month<br />
Dec-Feb (Winter) 0<br />
Mar-May (Spring) 0<br />
Jun-Aug (Summer) 0<br />
Sep-Nov (Fall) 0<br />
1 Amount shown represents largest amount for any one month in season indicated.<br />
68 <strong>Lower</strong> <strong>Washita</strong> Regional Report, Basin Data & Analysis <strong>Oklahoma</strong> Comprehensive <strong>Water</strong> Plan
Conservation Activities 1<br />
Reliable Diversions Based on Available<br />
Streamflow and New Reservoir Storage<br />
<strong>Lower</strong> <strong>Washita</strong> Region, Basin 16<br />
Reservoir Storage<br />
AF<br />
Required Storage to Meet<br />
Growth in Demand (AF)<br />
Reducing <strong>Water</strong> Needs<br />
Through Conservation<br />
<strong>Lower</strong> <strong>Washita</strong> Region, Basin 16<br />
Diversion<br />
AFY<br />
100 1,000<br />
500 3,000<br />
1,000 5,500<br />
2,500 11,000<br />
5,000 17,400<br />
Required Storage to Meet Growth<br />
in Surface <strong>Water</strong> Demand (AF)<br />
2060 Gap/Storage Depletion<br />
Surface<br />
<strong>Water</strong><br />
Alluvial<br />
GW<br />
AFY<br />
Bedrock<br />
GW<br />
1,200<br />
500<br />
2060 Gap/<br />
Storage Depletion<br />
Probability<br />
Surface<br />
<strong>Water</strong><br />
Percent<br />
Alluvial<br />
GW<br />
Existing Conditions 420 50 0 5% 5%<br />
Moderately Expanded Conservation<br />
in Crop Irrigation <strong>Water</strong> Use<br />
Moderately Expanded<br />
Conservation in M&I <strong>Water</strong> Use<br />
Moderately Expanded<br />
Conservation in Crop Irrigation<br />
and M&I <strong>Water</strong> Use<br />
Substantially Expanded<br />
Conservation in Crop Irrigation<br />
and M&I <strong>Water</strong> Use<br />
350 40 0 5% 5%<br />
300 30 0 5% 5%<br />
240 30 0 5% 5%<br />
80 10 0 3% 2%<br />
1 Conservation Activities are documented in the OCWP <strong>Water</strong> Demand Forecast Report.<br />
<strong>Water</strong> Supply Options & Effectiveness<br />
Demand Management<br />
n Typically Effective<br />
n Likely Ineffective<br />
n Potentially Effective<br />
n No Option Necessary<br />
n Moderately expanded permanent conservation activities in the Municipal and Industrial, Self-Supplied<br />
Residential, and Crop Irrigation demand sectors could reduce surface water gaps and alluvial<br />
groundwater storage depletions by about 40%. Due to the low probability <strong>of</strong> gaps, temporary drought<br />
management may be effective in reducing surface water use and subsequent gaps. Temporary drought<br />
management activities may not be needed for groundwater demand, since the groundwater storage<br />
could continue to provide supplies during droughts.<br />
Out-<strong>of</strong>-Basin Supplies<br />
n Out-<strong>of</strong>-basin supplies could mitigate surface water gaps and groundwater storage depletions. The OCWP<br />
Reservoir Viability Study, which evaluated the potential for reservoirs throughout the state, identified eight<br />
potential out-<strong>of</strong>-basin sites in the <strong>Lower</strong> <strong>Washita</strong> Region: Caddo Creek, Cox City and Purdy in Basin 14;<br />
Durwood, Gainesville and Ravia in Basin 21; Burneyville in Basin 22; and Courtney in Basin 23. However,<br />
in light <strong>of</strong> the low probability <strong>of</strong> gaps and substantial groundwater supplies, out-<strong>of</strong>-basin supplies may not<br />
be cost-effective for many users in the basin.<br />
Reservoir Use<br />
n Additional reservoir storage in Basin 16 could effectively supplement supply during dry months. The<br />
entire increase in demand from 2010 to 2060 could be supplied by a new river diversion and 1,200 AF<br />
<strong>of</strong> reservoir storage at the basin outlet. The use <strong>of</strong> multiple reservoirs in the basin or reservoirs upstream<br />
<strong>of</strong> the basin’s outlet may increase the amount <strong>of</strong> storage necessary to mitigate future gaps and storage<br />
depletions. The OCWP Reservoir Viability Study also identified Chickasha (proposed), Gracemont, Kechi<br />
and Verden Reservoirs as potentially viable sites in Basin 16.<br />
Increasing Reliance on Surface <strong>Water</strong><br />
n Increased reliance on surface water through direct diversions without reservoir storage, will increase<br />
surface water gaps and is not recommended.<br />
Increasing Reliance on Groundwater<br />
n Increased reliance on the Rush Springs aquifer could mitigate surface water gaps and alluvial<br />
groundwater storage depletions, but could create bedrock storage depletions. Any increases in storage<br />
depletions would be minimal relative to the volume <strong>of</strong> water stored in the basin’s portion <strong>of</strong> the Rush<br />
Springs aquifer. However, this aquifer only underlies 40% <strong>of</strong> the basin.<br />
<strong>Oklahoma</strong> Comprehensive <strong>Water</strong> Plan<br />
<strong>Lower</strong> <strong>Washita</strong> Regional Report, Basin Data & Analysis 69
<strong>Oklahoma</strong> Comprehensive <strong>Water</strong> Plan<br />
Data & Analysis<br />
<strong>Lower</strong> <strong>Washita</strong> <strong>Water</strong>shed Planning Region<br />
Basin 21<br />
71
Basin 21 Summary<br />
Synopsis<br />
• <strong>Water</strong> users are expected to continue to rely mainly on surface water and<br />
bedrock groundwater.<br />
• Alluvial groundwater storage depletions may occur by 2020, but will be minimal in<br />
size relative to aquifer storage in the basin. However, localized storage depletions<br />
may cause adverse effects for users.<br />
• To reduce the risk <strong>of</strong> adverse impacts on water supplies, it is recommended that<br />
storage depletions be decreased where economically feasible.<br />
• Additional conservation measures could reduce alluvial groundwater storage<br />
depletions.<br />
• Reservoir storage or dependable bedrock groundwater supplies could be used as<br />
alternatives to mitigate alluvial groundwater storage depletions.<br />
Current Demand by Source and Sector<br />
<strong>Lower</strong> <strong>Washita</strong> Region, Basin 21<br />
Total Demand<br />
22,060 AFY<br />
Basin 21 accounts for about 27% <strong>of</strong> the<br />
current demand in the <strong>Lower</strong> <strong>Washita</strong><br />
<strong>Water</strong>shed Planning Region. About 40%<br />
<strong>of</strong> the basin’s demand is from the Crop<br />
Irrigation demand sector and 38% is from<br />
the Municipal and Industrial demand sector.<br />
Surface water satisfies about 54% <strong>of</strong> the<br />
current demand in the basin. Groundwater<br />
satisfies about 46% <strong>of</strong> the current demand<br />
(8% alluvial and 38% bedrock). The peak<br />
summer month total water demand in Basin<br />
21 is 4.4 times the winter monthly demand,<br />
which is similar to the overall statewide<br />
pattern.<br />
The Red River, the major river in Basin<br />
21, is not considered as a feasible water<br />
supply source at this time due to severe<br />
water quality constraints. Flow in Basin 21<br />
represents the flow in Lake Texoma from the<br />
<strong>Washita</strong> River and tributaries in the basin.<br />
Flow in the basin is greater than 34,000 AF/<br />
month throughout the year and greater than<br />
120,000 AF/month in the spring and early<br />
summer. However, both the <strong>Washita</strong> River<br />
and its tributaries can have periods <strong>of</strong> low<br />
flow in the winter, summer, and fall. Lake<br />
Texoma, a Corps <strong>of</strong> Engineer Project, was<br />
constructed on the Red River in 1944 for<br />
the purposes <strong>of</strong> flood control, water supply,<br />
recreation, navigation, and hydropower<br />
purposes, as well as for low flow regulation <strong>of</strong><br />
the Red River. The lake is subject to provisions<br />
<strong>of</strong> the Red River Compact, which equally<br />
allocates water supplies to Texas and<br />
<strong>Oklahoma</strong>. Each state is allotted<br />
a dependable water supply<br />
yield <strong>of</strong> 168,000 AFY; over<br />
160,000 AFY <strong>of</strong> unpermitted<br />
yield is available for<br />
allocation in <strong>Oklahoma</strong>.<br />
However, the water quality<br />
is very poor and is not suitable<br />
for most municipal and industrial<br />
uses without extensive treatment or<br />
blending. Lake Murray is a stateowned<br />
lake that was constructed<br />
on Hickory Creek in 1937 for<br />
recreation purposes and is one<br />
<strong>of</strong> southern <strong>Oklahoma</strong>’s major<br />
tourists’ attractions. The<br />
lake has 153,250 AF <strong>of</strong><br />
conservation storage,<br />
but none is allocated to<br />
water supply. Several<br />
permits have been<br />
issued for recreation,<br />
fish and wildlife<br />
purposes. The availability<br />
<strong>of</strong> permits is not expected<br />
to limit the development<br />
<strong>of</strong> surface water supplies for<br />
<strong>Water</strong> <strong>Resources</strong><br />
<strong>Lower</strong> <strong>Washita</strong> Region, Basin 21<br />
72 <strong>Lower</strong> <strong>Washita</strong> Regional Report <strong>Oklahoma</strong> Comprehensive <strong>Water</strong> Plan
Median Historical Streamflow<br />
at the Basin Outlet<br />
<strong>Lower</strong> <strong>Washita</strong> Region, Basin 21<br />
Projected <strong>Water</strong> Demand<br />
<strong>Lower</strong> <strong>Washita</strong> Region, Basin 21<br />
in-basin use through 2060. With the exception<br />
<strong>of</strong> the Red River and Lake Texoma, the surface<br />
water quality in Basin 21 is considered fair<br />
relative to other basins in the state. However,<br />
the Old Channel <strong>of</strong> the <strong>Washita</strong> River is<br />
impaired for Agricultural use due to high levels<br />
<strong>of</strong> chloride.<br />
The majority <strong>of</strong> groundwater rights in Basin 21<br />
are from the Antlers major bedrock aquifer, the<br />
Arbuckle-Simpson major bedrock aquifer, and<br />
the Red River major alluvial aquifer. The Antlers<br />
aquifer underlies southern portion <strong>of</strong> the basin<br />
(about 60% <strong>of</strong> the basin area) and has about 10<br />
million AF <strong>of</strong> storage in Basin 21. The Arbuckle-<br />
Simpson aquifer underlies the northeastern<br />
portion <strong>of</strong> the basin and has about 3.3 million AF<br />
<strong>of</strong> storage in the basin. The OWRB is currently<br />
studying the Arbuckle-Simpson aquifer to set a<br />
maximum annual yield and equal proportionate<br />
share that will likely decrease the amount <strong>of</strong><br />
permitted water available for withdrawal. Basin 21<br />
contributes about 94,000 AFY <strong>of</strong> recharge to the<br />
Rush Springs and Arbuckle-Simpson aquifers. The<br />
Red River aquifer underlies the southern border<br />
<strong>of</strong> the basin, excluding Lake Texoma, and has over<br />
700,000 AF <strong>of</strong> storage in the basin. There are also<br />
permits in minor bedrock and alluvial aquifers.<br />
Domestic users (Self-Supplied Residential demand<br />
sector) do not require a permit and are assumed to<br />
be obtaining supplies from aquifers in the basin.<br />
The use <strong>of</strong> groundwater to meet in-basin demand<br />
is not expected to be limited by the availability<br />
<strong>of</strong> permits through 2060. There are no significant<br />
groundwater quality issues in the basin.<br />
The projected 2060 water demand <strong>of</strong> 36,490<br />
AFY in Basin 21 reflects a 14,430 AFY increase<br />
(65%) over the 2010 demand. The largest<br />
demand and growth in demand over this<br />
period will be in the Municipal and Industrial<br />
demand sector. However, substantial growth<br />
in Crop Irrigation demand is also projected.<br />
Gaps & Depletions<br />
Based on projected demand and historical<br />
hydrology, alluvial groundwater storage<br />
depletions may occur by 2020. No surface<br />
water gaps or bedrock groundwater depletions<br />
are expected in Basin 21 through 2060. Alluvial<br />
groundwater storage depletions are expected<br />
to be up to 320 AFY and have a 3% probability<br />
<strong>of</strong> occurring in at least one month <strong>of</strong> the<br />
year by 2060. Alluvial groundwater storage<br />
depletions in Basin 21 may occur during the<br />
summer and fall. Projected annual alluvial<br />
groundwater storage depletions are minimal<br />
relative to the amount <strong>of</strong> water in storage<br />
in the aquifer. However, localized storage<br />
depletions may adversely affect well yields,<br />
water quality, and/or pumping costs.<br />
Lake Texoma is capable <strong>of</strong> providing<br />
dependable water supplies to its existing<br />
users, and with new infrastructure, could<br />
be used to meet all <strong>of</strong> Basin 21’s future<br />
surface water demand during periods <strong>of</strong> low<br />
<strong>Water</strong> Supply Limitations<br />
<strong>Lower</strong> <strong>Washita</strong> Region, Basin 21<br />
Surface <strong>Water</strong><br />
Alluvial Groundwater<br />
Bedrock Groundwater<br />
n Minimal n Potential n Significant<br />
<strong>Water</strong> Supply Option<br />
Effectiveness<br />
<strong>Lower</strong> <strong>Washita</strong> Region, Basin 21<br />
Demand Management<br />
Out-<strong>of</strong>-Basin Supplies<br />
Reservoir Use<br />
Increasing Supply from Surface <strong>Water</strong><br />
Increasing Supply from Groundwater<br />
n Typically Effective n Potentially Effective<br />
n Likely Ineffective<br />
n No Option Necessary<br />
streamflow. However, water quality limits the<br />
potential uses <strong>of</strong> the supply.<br />
Options<br />
<strong>Water</strong> users are expected to continue to rely<br />
primarily on surface water supplies and bedrock<br />
groundwater, and to a lesser extent alluvial<br />
groundwater storage. To reduce the risk <strong>of</strong><br />
adverse impacts to the basin’s water users,<br />
alluvial groundwater storage depletions should<br />
be decreased where economically feasible.<br />
Moderately expanded permanent conservation<br />
activities in the Municipal and Industrial,<br />
Self-Supplied Residential, and Crop Irrigation<br />
demand sectors could reduce alluvial<br />
groundwater storage depletions. Temporary<br />
drought management activities may not<br />
be needed for groundwater demand, since<br />
the groundwater storage could continue to<br />
provide supplies during droughts.<br />
Out-<strong>of</strong>-basin supplies could mitigate<br />
groundwater storage depletions. The OCWP<br />
Reservoir Viability Study, which evaluated the<br />
potential for reservoirs throughout the state,<br />
identified nine potentially viable out-<strong>of</strong> basin<br />
sites in the <strong>Lower</strong> <strong>Washita</strong> Region. However,<br />
in light <strong>of</strong> substantial available groundwater<br />
resources in the basin, out-<strong>of</strong>-basin supplies<br />
may not be cost-effective for many users.<br />
Lake Texoma could effectively supplement<br />
supply during dry months. However, the use<br />
<strong>of</strong> Lake Texoma is severely restricted by water<br />
quality constraints. The entire increase in<br />
demand from 2010 to 2060 could be supplied<br />
by a new reservoir diversion and 3,900 AF<br />
<strong>of</strong> reservoir storage at the basin outlet. The<br />
OCWP Reservoir Viability Study also identified<br />
Durwood, Gainesville, and Ravia Reservoirs as<br />
potentially viable sites in Basin 21.<br />
Increased reliance on surface water through direct<br />
diversions without reservoir storage may create<br />
surface water gaps and is not recommended.<br />
Increased reliance on the Antlers or Arbuckle-<br />
Simpson bedrock aquifers could mitigate<br />
alluvial groundwater storage depletions. Any<br />
consequential bedrock storage depletions<br />
would be minimal relative to the volume <strong>of</strong><br />
water stored in the basin’s major aquifers.<br />
However, forthcoming changes regarding<br />
the maximum annual yield and equal<br />
proportionate share for the Arbuckle-Simpson<br />
aquifer may decrease the availability <strong>of</strong> water<br />
under existing and/or new permits.<br />
<strong>Oklahoma</strong> Comprehensive <strong>Water</strong> Plan<br />
<strong>Lower</strong> <strong>Washita</strong> Regional Report 73
Basin 21 Data & Analysis<br />
Surface <strong>Water</strong> <strong>Resources</strong><br />
• Historical streamflow from 1950 through<br />
2007 was used to estimate the range <strong>of</strong> future<br />
surface water supplies. The basin had a period<br />
<strong>of</strong> below-average streamflow from the early<br />
1960s to the mid 1970s. From the mid 1980s<br />
through the late 1990s, the basin went through<br />
a prolonged period <strong>of</strong> above-average streamflow<br />
and precipitation, demonstrating the hydrologic<br />
variability in the basin.<br />
• Lake Texoma, at the outlet <strong>of</strong> Basin 21,<br />
impounds both the <strong>Washita</strong> River and Red River<br />
downstream <strong>of</strong> Rock Creek. However, the Red<br />
River is not considered a supply source due to<br />
water quality constraints.<br />
• The median flow in the basin is greater than<br />
34,000 AF/month throughout the year and greater<br />
than 120,000 AF/month in the spring and early<br />
summer. However, the basin can have periods <strong>of</strong><br />
low flow in the winter, summer, and fall.<br />
• With the exception <strong>of</strong> the Red River, water<br />
quality is considered fair relative to other<br />
basins in the state.<br />
• Lake Texoma, constructed by the Corps <strong>of</strong><br />
Engineers, provides <strong>Oklahoma</strong> 168,000 AFY <strong>of</strong><br />
dependable water supply yield <strong>of</strong> which 160,000<br />
AFY is unpermitted. However, water quality<br />
constrains potential uses. Lake Murray is a stateowned<br />
lake used for recreational purposes only.<br />
Monthly Historical Streamflow at the Basin Outlet<br />
<strong>Lower</strong> <strong>Washita</strong> Region, Basin 21<br />
Historical Streamflow at the Basin Outlet<br />
<strong>Lower</strong> <strong>Washita</strong> Region, Basin 21<br />
Historical Precipitation<br />
Regional Climate Division<br />
74 <strong>Lower</strong> <strong>Washita</strong> Regional Report, Basin Data & Analysis <strong>Oklahoma</strong> Comprehensive <strong>Water</strong> Plan
Aquifer<br />
Groundwater <strong>Resources</strong> - Aquifer Summary (2010)<br />
<strong>Lower</strong> <strong>Washita</strong> Region, Basin 21<br />
Portion <strong>of</strong> Basin<br />
Overlaying Aquifer<br />
Current<br />
Groundwater<br />
Rights<br />
Aquifer Storage<br />
in Basin<br />
Equal<br />
Proportionate<br />
Share<br />
Groundwater<br />
Available for<br />
New Permits<br />
Name Type Class 1 Percent AFY AF AFY/Acre AFY<br />
Antlers Bedrock Major 59% 23,400 10,016,000 2.1 1,281,500<br />
Arbuckle-Simpson Bedrock Major 11% 17,100 3,336,000 temporary 2.0 2 218,500<br />
Red River Alluvial Major 18% 4,900 724,000 temporary 2.0 389,700<br />
Marietta Bedrock Minor 9% 100 587,000 temporary 2.0 191,700<br />
Texoma Bedrock Minor 1% 0 101,000 temporary 2.0 38,400<br />
Woodbine Bedrock Minor 19% 500 3,282,000 temporary 2.0 422,000<br />
Non-Delineated Groundwater Source Bedrock Minor N/A 600 N/A temporary 2.0 N/A<br />
Non-Delineated Groundwater Source Alluvial Minor N/A 1,300 N/A temporary 2.0 N/A<br />
1 Bedrock aquifers with typical yields greater than 50 gpm and alluvial aquifers with typical yields greater than 150 gpm are considered major.<br />
2 Pursuant to 82 O.S. § 1020.9(A)(2), the temporary allocation for the Arbuckle-Simpson groundwater basin is subject to the OWRB’s case-by case determination <strong>of</strong> what amount will not<br />
likely degrade or interfere with springs or streams emanating from the Arbuckle-Simpson.<br />
Groundwater <strong>Resources</strong><br />
• The majority <strong>of</strong> groundwater rights<br />
in Basin 21 are from the Antlers,<br />
Arbuckle-Simpson, and Red River<br />
aquifers. The Antlers aquifer underlies<br />
the southern portions <strong>of</strong> the basin<br />
(59% <strong>of</strong> the basin area) and has<br />
more than 10 million AF <strong>of</strong> storage<br />
in Basin 21. The Arbuckle-Simpson<br />
aquifer underlies the northeastern<br />
portion <strong>of</strong> the basin and has more<br />
than 3.3 million AF <strong>of</strong> storage in the<br />
basin. The OWRB is currently studying<br />
the Arbuckle-Simpson aquifer to set<br />
a maximum annual yield and equal<br />
proportionate share that will likely<br />
decrease the amount <strong>of</strong> permitted<br />
water available for withdrawal.<br />
Basin 21 contributes about 94,000<br />
AFY <strong>of</strong> recharge to the Antlers and<br />
Arbuckle-Simpson aquifers. The Red<br />
River aquifer underlies the southern<br />
boundary <strong>of</strong> the basin, excluding Lake<br />
Texoma, and has more than 700,000<br />
AF <strong>of</strong> storage in the basin. There<br />
are also rights in minor bedrock and<br />
alluvial aquifers.<br />
• There are no significant groundwater<br />
quality issues in the basin.<br />
<strong>Oklahoma</strong> Comprehensive <strong>Water</strong> Plan<br />
<strong>Lower</strong> <strong>Washita</strong> Regional Report, Basin Data & Analysis 75
<strong>Water</strong> Demand<br />
• Basin 21’s water needs account for about<br />
27% <strong>of</strong> the demand in the <strong>Lower</strong> <strong>Washita</strong><br />
<strong>Water</strong>shed Planning Region and will<br />
increase by 65% (14,430 AFY) from 2010<br />
to 2060. The largest demand and growth<br />
in demand during this period will be from<br />
the Municipal and Industrial demand<br />
sector. However, substantial growth from<br />
Crop Irrigation demand is also projected.<br />
• Surface water is used to meet 54% <strong>of</strong> total<br />
basin demand and its use will increase<br />
by 61% (7,190 AFY) from 2010 to 2060.<br />
The largest surface water use and growth<br />
in surface water use during this period will<br />
be in the Municipal and Industrial sector.<br />
However, substantial growth in surface<br />
water use from the Crop Irrigation sector<br />
is also projected.<br />
• Alluvial groundwater is used to meet 8%<br />
<strong>of</strong> total demand in the basin and its use<br />
will increase by 46% (850 AFY) from<br />
2010 to 2060. The majority <strong>of</strong> the alluvial<br />
groundwater use and growth in alluvial<br />
groundwater use during this period will be<br />
from the Crop Irrigation demand sector.<br />
• Bedrock groundwater is used to meet<br />
38% <strong>of</strong> total demand in the basin and<br />
its use will increase by 77% (6,390 AFY)<br />
from 2010 to 2060. The largest bedrock<br />
groundwater use and growth in bedrock<br />
groundwater use during this period will be<br />
in the Municipal and Industrial demand<br />
sector. However, substantial growth in<br />
bedrock groundwater use from the Crop<br />
Irrigation demand sector is also projected.<br />
Surface <strong>Water</strong> Demand<br />
by Sector<br />
<strong>Lower</strong> <strong>Washita</strong> Region, Basin 21<br />
Planning<br />
Horizon<br />
Crop Irrigation<br />
Livestock<br />
Alluvial Groundwater Demand<br />
by Sector<br />
<strong>Lower</strong> <strong>Washita</strong> Region, Basin 21<br />
Total Demand by Sector<br />
<strong>Lower</strong> <strong>Washita</strong> Region, Basin 21<br />
Municipal &<br />
Industrial<br />
Oil & Gas<br />
AFY<br />
Self-Supplied<br />
Industrial<br />
Self-Supplied<br />
Residential<br />
Bedrock Groundwater Demand<br />
by Sector<br />
<strong>Lower</strong> <strong>Washita</strong> Region, Basin 21<br />
•Thermoelectric Power •Self-Supplied Residential •Self-Supplied Industrial •Oil & Gas •Municipal & Industrial •Livestock •Crop Irrigation<br />
Thermoelectric<br />
Power<br />
2010 8,800 1,820 8,400 1,420 1,490 130 0 22,060<br />
2020 9,550 1,840 12,960 2,730 1,490 170 0 28,740<br />
2030 10,310 1,870 14,330 2,240 1,490 200 0 30,440<br />
2040 11,070 1,900 15,710 2,070 1,500 220 0 32,470<br />
2050 11,650 1,930 17,170 1,800 1,520 240 0 34,310<br />
2060 12,580 1,960 18,700 1,430 1,560 260 0 36,490<br />
Total<br />
76 <strong>Lower</strong> <strong>Washita</strong> Regional Report, Basin Data & Analysis <strong>Oklahoma</strong> Comprehensive <strong>Water</strong> Plan
Monthly Demand Distribution by Sector (2010)<br />
<strong>Lower</strong> <strong>Washita</strong> Region, Basin 21<br />
Monthly Demand Distribution by Source (2010)<br />
<strong>Lower</strong> <strong>Washita</strong> Region, Basin 21<br />
Current Monthly Demand<br />
Distribution by Sector<br />
• The Municipal and Industrial and Self-<br />
Supplied Residential demand sectors use<br />
63% more water in summer months than<br />
in winter months. Crop Irrigation has a<br />
high demand in summer months and<br />
little or no demand in winter months.<br />
Other demand sectors have more<br />
consistent demand throughout the year.<br />
Current Monthly Demand<br />
Distribution by Source<br />
• The peak summer month demand in<br />
Basin 21 is 4.4 times the winter monthly<br />
demand, which is similar to the overall<br />
statewide pattern. Surface water use in<br />
the peak summer month is 3.5 times<br />
the winter monthly use. Monthly alluvial<br />
groundwater use peaks in the summer<br />
at 13.4 times the monthly winter use.<br />
Monthly bedrock groundwater use peaks<br />
in the summer at 5.0 times the winter<br />
monthly use.<br />
<strong>Oklahoma</strong> Comprehensive <strong>Water</strong> Plan<br />
<strong>Lower</strong> <strong>Washita</strong> Regional Report, Basin Data & Analysis 77
Gaps and Storage Depletions<br />
• Based on projected demand and historical<br />
hydrology, alluvial groundwater storage<br />
depletions may occur by 2020. No surface<br />
water gaps or bedrock groundwater depletions<br />
are expected in Basin 21 through 2060.<br />
• Lake Texoma is capable <strong>of</strong> providing<br />
dependable water supplies to its existing users,<br />
and with new infrastructure, could be used<br />
to meet all <strong>of</strong> Basin 21’s future surface water<br />
demand during periods <strong>of</strong> low streamflow.<br />
However, water quality limits the potential uses<br />
<strong>of</strong> the supply.<br />
• Alluvial groundwater storage depletions in<br />
Basin 21 may occur during the summer<br />
and fall, peaking in size during the summer.<br />
There will be a 3% probability <strong>of</strong> alluvial<br />
groundwater storage depletions occurring<br />
in at least one month <strong>of</strong> the year by 2040.<br />
Alluvial groundwater storage depletions in<br />
2060 will be up to 32% (220 AF/month) <strong>of</strong><br />
the alluvial groundwater demand in the peak<br />
summer month, and as much as 36% (100 AF/<br />
month) <strong>of</strong> the fall monthly alluvial groundwater<br />
demand. There is a low probability <strong>of</strong> alluvial<br />
groundwater storage depletions occurring<br />
during both summer and fall months.<br />
• Projected annual alluvial groundwater storage<br />
depletions are minimal relative to the amount<br />
<strong>of</strong> water in storage in the aquifer. However,<br />
localized storage depletions may adversely<br />
affect well yields, water quality, and/or<br />
pumping costs.<br />
Months (Season)<br />
Planning<br />
Horizon<br />
Magnitude and Probability<br />
<strong>of</strong> Annual Gaps and Storage Depletions<br />
<strong>Lower</strong> <strong>Washita</strong> Region, Basin 21<br />
Maximum Gaps/Storage Depletions<br />
Surface<br />
<strong>Water</strong><br />
Surface <strong>Water</strong> Gaps<br />
by Season (2060 Demand)<br />
<strong>Lower</strong> <strong>Washita</strong> Region, Basin 21<br />
Maximum Gap 1 Median Gap Probability<br />
AF/month AF/month Percent<br />
Dec-Feb (Winter) 0 0 0%<br />
Mar-May (Spring) 0 0 0%<br />
Jun-Aug (Summer) 0 0 0%<br />
Sep-Nov (Fall) 0 0 0%<br />
1 Amount shown represents largest amount for any one month in season indicated.<br />
Alluvial<br />
Groundwater<br />
AFY<br />
Bedrock<br />
Groundwater<br />
Probability <strong>of</strong> Gaps/<br />
Storage Depletions<br />
Surface<br />
<strong>Water</strong><br />
Alluvial<br />
Groundwater<br />
Percent<br />
2020 0 60 0 0% 2%<br />
2030 0 140 0 0% 2%<br />
2040 0 180 0 0% 3%<br />
2050 0 220 0 0% 3%<br />
2060 0 320 0 0% 3%<br />
Alluvial Groundwater Storage Depletions<br />
by Season (2060 Demand)<br />
<strong>Lower</strong> <strong>Washita</strong> Region, Basin 21<br />
Months (Season)<br />
Maximum<br />
Storage<br />
Depletion 1<br />
Median Storage<br />
Depletion<br />
Probability<br />
AF/month AF/month Percent<br />
Dec-Feb (Winter) 0 0 0%<br />
Mar-May (Spring) 0 0 0%<br />
Jun-Aug (Summer) 220 170 3%<br />
Sep-Nov (Fall) 100 100 2%<br />
1 Amount shown represents largest amount for any one month in season<br />
indicated.<br />
Bedrock Groundwater Storage Depletions<br />
by Season (2060 Demand)<br />
<strong>Lower</strong> <strong>Washita</strong> Region, Basin 21<br />
Months (Season)<br />
Average Storage Depletion 1<br />
AF/month<br />
Dec-Feb (Winter) 0<br />
Mar-May (Spring) 0<br />
Jun-Aug (Summer) 0<br />
Sep-Nov (Fall) 0<br />
1 Amount shown represents largest amount for any one month in season<br />
indicated.<br />
78 <strong>Lower</strong> <strong>Washita</strong> Regional Report, Basin Data & Analysis <strong>Oklahoma</strong> Comprehensive <strong>Water</strong> Plan
Conservation Activities 1<br />
Reliable Diversions Based on Available<br />
Streamflow and New Reservoir Storage<br />
<strong>Lower</strong> <strong>Washita</strong> Region, Basin 21<br />
Reservoir Storage<br />
AF<br />
Required Storage to Meet<br />
Growth in Demand (AF)<br />
Required Storage to<br />
Meet Growth in Surface<br />
<strong>Water</strong> Demand (AF)<br />
Reducing <strong>Water</strong> Needs<br />
Through Conservation<br />
<strong>Lower</strong> <strong>Washita</strong> Region, Basin 21<br />
2060 Gap/Storage Depletion<br />
Surface<br />
Bedrock<br />
<strong>Water</strong> Alluvial GW GW<br />
AFY<br />
Diversion<br />
AFY<br />
100 400<br />
500 1,800<br />
1,000 3,700<br />
2,500 9,200<br />
5,000 17,900<br />
3,900<br />
1,900<br />
2060 Gap/Storage<br />
Depletion Probability<br />
Surface<br />
<strong>Water</strong><br />
Percent<br />
Alluvial GW<br />
Existing Conditions 0 320 0 0% 3%<br />
Moderately Expanded Conservation<br />
in Crop Irrigation <strong>Water</strong> Use<br />
Moderately Expanded<br />
Conservation in M&I <strong>Water</strong> Use<br />
Moderately Expanded<br />
Conservation in Crop Irrigation<br />
and M&I <strong>Water</strong> Use<br />
Substantially Expanded<br />
Conservation in Crop Irrigation<br />
and M&I <strong>Water</strong> Use<br />
0 270 0 0% 3%<br />
0 260 0 0% 3%<br />
0 210 0 0% 3%<br />
0 140 0 0% 2%<br />
1 Conservation Activities are documented in the OCWP <strong>Water</strong> Demand Forecast Report.<br />
<strong>Water</strong> Supply Options & Effectiveness<br />
Demand Management<br />
n Typically Effective<br />
n Likely Ineffective<br />
n Potentially Effective<br />
n No Option Necessary<br />
n Moderately expanded permanent conservation activities in the Municipal and Industrial, Self-<br />
Supplied Residential, and Crop Irrigation demand sectors could reduce alluvial groundwater<br />
storage depletions by 34%. Temporary drought management activities may not be needed for<br />
alluvial groundwater demand, since groundwater storage could continue to provide supplies<br />
during droughts.<br />
Out-<strong>of</strong>-Basin Supplies<br />
n Out-<strong>of</strong>-basin supplies could mitigate groundwater storage depletions. The OCWP Reservoir Viability<br />
Study, which evaluated the potential for reservoirs throughout the state, identified nine potential<br />
out-<strong>of</strong>-basin sites in the <strong>Lower</strong> <strong>Washita</strong> Region: Caddo Creek, Cox City and Purdy in Basin 14;<br />
Chickasha, Gracemont, Kechi and Verden in Basin 16; Burneyville in Basin 22; and Courtney in<br />
Basin 23. However, in light <strong>of</strong> substantial available groundwater resources in the basin, out-<strong>of</strong>-basin<br />
supplies may not be cost-effective for many users.<br />
Reservoir Use<br />
n Lake Texoma or new reservoir storage in Basin 21 could effectively supplement supply during dry<br />
months. However, the use <strong>of</strong> Texoma is constrained by water quality. Alternatively, the entire increase<br />
in demand from 2010 to 2060 could be supplied by a new river diversion and 3,900 AF <strong>of</strong> reservoir<br />
storage at the basin outlet. The use <strong>of</strong> multiple reservoirs in the basin or reservoirs upstream <strong>of</strong> the<br />
basin’s outlet may increase the amount <strong>of</strong> storage necessary to mitigate future gaps and storage<br />
depletions. The OCWP Reservoir Viability Study also identified Durwood, Gainesville, and Ravia<br />
Reservoirs as potentially viable sites in Basin 21.<br />
Increasing Reliance on Surface <strong>Water</strong><br />
n Increased reliance on surface water through direct diversions, without reservoir storage, may create<br />
surface water gaps and is not recommended.<br />
Increasing Reliance on Groundwater<br />
n Increased reliance on the Antlers or Arbuckle-Simpson bedrock aquifers could mitigate alluvial<br />
groundwater storage depletions. Any resulting bedrock storage depletions would be minimal relative<br />
to the volume <strong>of</strong> water stored in the basin’s major aquifers. However, results <strong>of</strong> the Arbuckle-Simpson<br />
Hydrology Study indicate that in order to comply with 2003 Senate Bill 288, the equal proportionate<br />
share will be significantly lower than the current 2 AFY/acre allocation for temporary permits.<br />
<strong>Oklahoma</strong> Comprehensive <strong>Water</strong> Plan<br />
<strong>Lower</strong> <strong>Washita</strong> Regional Report, Basin Data & Analysis 79
<strong>Oklahoma</strong> Comprehensive <strong>Water</strong> Plan<br />
Data & Analysis<br />
<strong>Lower</strong> <strong>Washita</strong> <strong>Water</strong>shed Planning Region<br />
Basin 22<br />
81
Basin 22 Summary<br />
Synopsis<br />
• <strong>Water</strong> users are expected to continue to rely primarily on surface water and<br />
bedrock groundwater.<br />
• By 2020, there is a very high probability <strong>of</strong> surface water gaps from increased<br />
demands on existing supplies.<br />
• Alluvial and bedrock groundwater storage depletions are likely by 2020, but will be<br />
minimal relative to aquifer storage in the basin. However, localized storage depletions<br />
may cause adverse effects for users.<br />
• To reduce the risk <strong>of</strong> adverse impacts on water supplies, it is recommended that gaps<br />
and storage depletions be decreased where economically feasible.<br />
• Additional conservation measures could reduce surface water gaps and groundwater<br />
storage depletions.<br />
• To mitigate surface water gaps, dependable groundwater supplies and/or developing<br />
new reservoirs could be used as alternatives. These supply sources could be used<br />
without major impacts to groundwater storage.<br />
• Basin 22 has been identified as a “hot spot” where more pronounced water supply<br />
availability issues are forecasted. (See “Regional and <strong>State</strong>wide Opportunities and<br />
Solutions” in the 2012 OCWP Executive Report.)<br />
<strong>Water</strong> <strong>Resources</strong><br />
<strong>Lower</strong> <strong>Washita</strong> Region, Basin 22<br />
Basin 22 accounts for about 8% <strong>of</strong> the current<br />
demand in the <strong>Lower</strong> <strong>Washita</strong> <strong>Water</strong>shed<br />
Planning Region. About 40% <strong>of</strong> the basin’s<br />
demand is from the Municipal and Industrial<br />
demand sector. Crop Irrigation is the second<br />
largest demand sector at 32%, followed by the<br />
Oil and Gas demand sector at 22%. Surface<br />
water satisfies about 43% <strong>of</strong> the current<br />
demand in the basin. Groundwater satisfies<br />
about 57% <strong>of</strong> the current demand (5% alluvial<br />
and 52% bedrock). The peak summer month<br />
demand in Basin 22 is 3.7 times the winter<br />
monthly demand, which is similar to the<br />
overall statewide pattern.<br />
Current Demand by Source and Sector<br />
<strong>Lower</strong> <strong>Washita</strong> Region, Basin 22<br />
Total Demand<br />
6,070 AFY<br />
82 <strong>Lower</strong> <strong>Washita</strong> Regional Report <strong>Oklahoma</strong> Comprehensive <strong>Water</strong> Plan
Median Historical Streamflow<br />
at the Basin Outlet<br />
<strong>Lower</strong> <strong>Washita</strong> Region, Basin 22<br />
Projected <strong>Water</strong> Demand<br />
<strong>Lower</strong> <strong>Washita</strong> Region, Basin 22<br />
The flow in the Walnut Bayou upstream <strong>of</strong><br />
the Red River is typically very low or zero<br />
from July through February. The flow is<br />
typically greater than 500 AF/month from<br />
March and April, and greater than 1,500 AF/<br />
month in May and June. However, the river<br />
can have periods <strong>of</strong> low flow in these months<br />
as well. Healdton Lake is an NRCS structure<br />
that provides flood control and recreation,<br />
as well as a dependable water supply yield<br />
<strong>of</strong> 413 AFY to the City <strong>of</strong> Healdton. The<br />
availability <strong>of</strong> permits is not expected to limit<br />
the development <strong>of</strong> surface water supplies for<br />
in-basin use through 2060. Relative to other<br />
basins in the state, the surface water quality<br />
in Basin 22 is considered fair.<br />
The majority <strong>of</strong> groundwater permits in Basin<br />
22 are from the Antlers major bedrock aquifer.<br />
This aquifer has 758,000 AF <strong>of</strong> storage in Basin<br />
22 and underlies about 40% <strong>of</strong> the basin. There<br />
are also rights in the Red River major alluvial<br />
aquifer and minor non-delineated alluvial and<br />
bedrock aquifers. Basin 22 contributes about<br />
8,000 AFY <strong>of</strong> recharge to the Antlers aquifer.<br />
Domestic users (Self-Supplied Residential<br />
demand sector) do not require a permit and are<br />
assumed to be obtaining supplies from aquifers<br />
in the basin. The use <strong>of</strong> groundwater to meet<br />
in-basin demand is not expected to be limited<br />
by the availability <strong>of</strong> permits through 2060.<br />
There are no significant groundwater quality<br />
issues in the basin.<br />
The projected 2060 water demand <strong>of</strong> 8,750<br />
AFY in Basin 22 reflects a 2,680 AFY increase<br />
(44%) over the 2010 demand. The majority<br />
<strong>of</strong> the demand over this period will be in the<br />
Municipal and Industrial and Crop Irrigation<br />
demand sectors.<br />
Gaps & Depletions<br />
Based on projected demand and historical<br />
hydrology, surface water gaps and<br />
groundwater storage depletions may occur<br />
by 2020. Surface water gaps will be up to 820<br />
AFY and have a 98% probability <strong>of</strong> occurring<br />
in at least one month <strong>of</strong> the year by 2060.<br />
Surface water gaps may occur throughout the<br />
year, peaking in summer. Alluvial groundwater<br />
storage depletions will be up to 130 AFY and<br />
have a 95% probability <strong>of</strong> occurring in at<br />
least one month <strong>of</strong> the year by 2060. Alluvial<br />
groundwater storage depletions in Basin 22<br />
may occur during the summer and fall, peaking<br />
in summer. Bedrock groundwater storage<br />
depletions will be 920 AFY in 2060 and will<br />
occur during the summer. Projected annual<br />
alluvial and bedrock groundwater storage<br />
depletions are minimal relative to the amount<br />
<strong>of</strong> water in storage in the aquifer. However,<br />
localized storage depletions may adversely<br />
affect well yields, water quality, and/or<br />
pumping costs.<br />
<strong>Water</strong> Supply Limitations<br />
<strong>Lower</strong> <strong>Washita</strong> Region, Basin 22<br />
Surface <strong>Water</strong><br />
Alluvial Groundwater<br />
Bedrock Groundwater<br />
n Minimal n Potential n Significant<br />
<strong>Water</strong> Supply Option<br />
Effectiveness<br />
<strong>Lower</strong> <strong>Washita</strong> Region, Basin 22<br />
Demand Management<br />
Out-<strong>of</strong>-Basin Supplies<br />
Reservoir Use<br />
Increasing Supply from Surface <strong>Water</strong><br />
Increasing Supply from Groundwater<br />
n Typically Effective n Potentially Effective<br />
n Likely Ineffective<br />
n No Option Necessary<br />
Options<br />
<strong>Water</strong> users are expected to continue to<br />
rely primarily on surface water and bedrock<br />
groundwater. To reduce the risk <strong>of</strong> adverse<br />
impacts to the basin’s water users, surface<br />
water gaps and groundwater storage<br />
depletions should be decreased where<br />
economically feasible.<br />
Moderately expanded permanent conservation<br />
activities in the Municipal and Industrial,<br />
Self-Supplied Residential, and Crop Irrigation<br />
demand sectors could reduce surface water<br />
gaps and groundwater storage depletions.<br />
Permanent conservation activities will be more<br />
effective than temporary drought management,<br />
since gaps will occur in almost every year<br />
and aquifer storage could continue to provide<br />
supplies during droughts.<br />
Out-<strong>of</strong>-basin supplies could mitigate<br />
groundwater storage depletions. The OCWP<br />
Reservoir Viability Study, which evaluated the<br />
potential for reservoirs throughout the state,<br />
identified eleven potentially viable out-<strong>of</strong>basin<br />
sites in the <strong>Lower</strong> <strong>Washita</strong> Region.<br />
Additionally, Lake Texoma in Basin 21 has<br />
substantial unpermitted yield to meet the<br />
needs <strong>of</strong> new users, but its use is limited by<br />
water quality constraints. However, in light<br />
<strong>of</strong> the distance to reliable water supplies,<br />
out-<strong>of</strong>-basin supplies may not be costeffective<br />
for some users in the basin.<br />
Additional reservoir storage in Basin 22 could<br />
effectively supplement supply during dry<br />
months. The entire increase in surface water<br />
use from 2010 to 2060 could be supplied<br />
by a new river diversion and 5,700 AF <strong>of</strong><br />
reservoir storage at the basin outlet. The<br />
OCWP Reservoir Viability Study also identified<br />
Burneyville Reservoir as a potentially viable<br />
reservoir site in Basin 22.<br />
Increased reliance on surface water through direct<br />
diversions without reservoir storage, will increase<br />
surface water gaps and is not recommended.<br />
Increased reliance on major aquifers could<br />
mitigate surface water gaps, but would<br />
increase storage depletions. Any increases in<br />
storage depletions would be small relative to<br />
the volume <strong>of</strong> water stored in the Antlers and<br />
Red River aquifers. However, the aquifers only<br />
underlie the southern portion <strong>of</strong> the basin.<br />
<strong>Oklahoma</strong> Comprehensive <strong>Water</strong> Plan<br />
<strong>Lower</strong> <strong>Washita</strong> Regional Report 83
Basin 22 Data & Analysis<br />
Surface <strong>Water</strong> <strong>Resources</strong><br />
• Historical streamflow from 1950 through<br />
2007 was used to estimate the range<br />
<strong>of</strong> future surface water supplies. The<br />
Walnut Bayou upstream <strong>of</strong> the Red<br />
River had a period <strong>of</strong> below-average<br />
streamflow from the early 1950s to<br />
the early 1970s. From the early 1980s<br />
through the mid 1990s, the basin went<br />
through a prolonged period <strong>of</strong> aboveaverage<br />
streamflow and precipitation,<br />
demonstrating the hydrologic variability<br />
in the basin.<br />
• The median flow in the Walnut Bayou<br />
upstream <strong>of</strong> the Red River is very low<br />
or zero from July through February.<br />
The median flow is greater than 500<br />
AF/month from March through June<br />
and greater than 1,500 AF/month in<br />
May and June. However, the bayou<br />
can have periods <strong>of</strong> low flow in these<br />
months as well.<br />
• Relative to other basins in the state,<br />
the surface water quality in Basin 22 is<br />
considered fair.<br />
• Healdton Lake provides 413 AFY <strong>of</strong><br />
dependable yield to the City <strong>of</strong> Healdton<br />
and is fully allocated.<br />
Monthly Historical Streamflow at the Basin Outlet<br />
<strong>Lower</strong> <strong>Washita</strong> Region, Basin 22<br />
Historical Streamflow at the Basin Outlet<br />
<strong>Lower</strong> <strong>Washita</strong> Region, Basin 22<br />
Historical Precipitation<br />
Regional Climate Division<br />
84 <strong>Lower</strong> <strong>Washita</strong> Regional Report, Basin Data & Analysis <strong>Oklahoma</strong> Comprehensive <strong>Water</strong> Plan
Aquifer<br />
Groundwater <strong>Resources</strong> - Aquifer Summary (2010)<br />
<strong>Lower</strong> <strong>Washita</strong> Region, Basin 22<br />
Portion <strong>of</strong> Basin<br />
Overlaying Aquifer<br />
Current<br />
Groundwater<br />
Rights<br />
Aquifer Storage<br />
in Basin<br />
Equal<br />
Proportionate<br />
Share<br />
Groundwater<br />
Available for<br />
New Permits<br />
Name Type 1 Class 2 Percent AFY AF AFY/Acre AFY<br />
Antlers Bedrock Major 40% 20,700 778,000 2.1 152,800<br />
Red River Alluvial Major 21% 700 214,000 temporary 2.0 88,000<br />
Marietta Bedrock Minor 2% 0 39,000 temporary 2.0 12,800<br />
Non-Delineated Groundwater Source Bedrock Minor N/A 2,400 N/A temporary 2.0 N/A<br />
Non-Delineated Groundwater Source Alluvial Minor N/A 1,600 N/A temporary 2.0 N/A<br />
1 Bedrock aquifers with typical yields greater than 50 gpm and alluvial aquifers with typical yields greater than 150 gpm are considered major.<br />
Groundwater <strong>Resources</strong><br />
• The majority <strong>of</strong> groundwater rights<br />
in Basin 22 are from the Antlers<br />
aquifer. This aquifer has 778,000 AF<br />
<strong>of</strong> storage in Basin 22 and underlies<br />
about 40% <strong>of</strong> the basin. Basin 22<br />
contributes about 8,000 AFY <strong>of</strong><br />
recharge to the Antlers aquifer. There<br />
are also rights in the Red River aquifer<br />
and from minor non-delineated<br />
groundwater sources.<br />
• There are no significant groundwater<br />
quality issues in basin.<br />
<strong>Oklahoma</strong> Comprehensive <strong>Water</strong> Plan<br />
<strong>Lower</strong> <strong>Washita</strong> Regional Report, Basin Data & Analysis 85
<strong>Water</strong> Demand<br />
• Basin 22’s water needs account for<br />
about 8% <strong>of</strong> the demand in the <strong>Lower</strong><br />
<strong>Washita</strong> <strong>Water</strong>shed Planning Region<br />
and will increase by 44% (2,680 AFY)<br />
from 2010 to 2060. The majority <strong>of</strong> the<br />
demand during this period will be from<br />
the Municipal and Industrial and Crop<br />
Irrigation demand sectors.<br />
• Surface water is used to meet 43%<br />
<strong>of</strong> total demands in the basin and its<br />
use will increase by 31% (820 AFY)<br />
from 2010 to 2060. The majority <strong>of</strong><br />
the surface water use and growth in<br />
surface water use during this period<br />
will be from the Municipal and<br />
Industrial demand sector.<br />
• Alluvial groundwater is used to meet<br />
5% <strong>of</strong> total demands in the basin and<br />
its use will increase by 62% (210 AFY)<br />
from 2010 to 2060. The majority <strong>of</strong> the<br />
alluvial groundwater use and growth<br />
in alluvial groundwater use during this<br />
period will be from the Crop Irrigation<br />
demand sector.<br />
• Bedrock groundwater is used to meet<br />
52% <strong>of</strong> total demands in the basin and<br />
its use will increase by 53% (1,650 AFY)<br />
from 2010 to 2060. The majority <strong>of</strong> the<br />
bedrock groundwater use and growth<br />
in bedrock groundwater use during this<br />
period will be from the Crop Irrigation<br />
demand sector.<br />
Surface <strong>Water</strong> Demand<br />
by Sector<br />
<strong>Lower</strong> <strong>Washita</strong> Region, Basin 22<br />
Planning<br />
Horizon<br />
Crop Irrigation<br />
Livestock<br />
Alluvial Groundwater Demand<br />
by Sector<br />
<strong>Lower</strong> <strong>Washita</strong> Region, Basin 22<br />
Total Demand by Sector<br />
<strong>Lower</strong> <strong>Washita</strong> Region, Basin 22<br />
Municipal &<br />
Self-Supplied<br />
Industrial Oil & Gas 1 Industrial<br />
AFY<br />
Bedrock Groundwater Demand<br />
by Sector<br />
<strong>Lower</strong> <strong>Washita</strong> Region, Basin 22<br />
•Thermoelectric Power •Self-Supplied Residential •Self-Supplied Industrial •Oil & Gas •Municipal & Industrial •Livestock •Crop Irrigation<br />
Self-Supplied<br />
Residential<br />
Thermoelectric<br />
Power<br />
2010 1,950 350 2,440 1,320 0 10 0 6,070<br />
2020 2,220 350 3,030 2,530 0 30 0 8,160<br />
2030 2,490 360 3,200 1,810 0 30 0 7,890<br />
2040 2,750 360 3,370 1,380 0 30 0 7,890<br />
2050 2,960 370 3,550 1,320 0 30 0 8,230<br />
2060 3,290 370 3,730 1,320 0 40 0 8,750<br />
1 The demand forecast developed in accordance with the O&G work group estimates that 2050 and 2060 demands in seven counties will drop below the 2010 demand<br />
level (due to Woodford Shale being played out). As a conservative approach, this assumption is not explicitly carried over into the Gap Analysis. Instead, where applicable,<br />
basin demands (in the <strong>Lower</strong> <strong>Washita</strong> Region, Basin 22) are assumed to never fall below the 2010 base year demand levels. This is reflected in the Region and Basin Total<br />
Demand by Sector tables.<br />
Total<br />
86 <strong>Lower</strong> <strong>Washita</strong> Regional Report, Basin Data & Analysis <strong>Oklahoma</strong> Comprehensive <strong>Water</strong> Plan
Monthly Demand Distribution by Sector (2010)<br />
<strong>Lower</strong> <strong>Washita</strong> Region, Basin 22<br />
Monthly Demand Distribution by Source (2010)<br />
<strong>Lower</strong> <strong>Washita</strong> Region, Basin 22<br />
Current Monthly Demand<br />
Distribution by Sector<br />
• The Municipal and Industrial and Self-<br />
Supplied Residential demand sectors use<br />
74% more water in summer months than<br />
in winter months. Crop Irrigation has a<br />
high demand in summer months and<br />
little or no demand in winter months.<br />
Other demand sectors have more<br />
consistent demand throughout the year.<br />
Current Monthly Demand<br />
Distribution by Source<br />
• The peak summer month total water<br />
demand in Basin 22 is 3.7 times the<br />
monthly winter demand, which is<br />
similar to the overall statewide pattern.<br />
Surface water use in the peak summer<br />
month is 1.4 times the monthly winter<br />
use. Monthly alluvial groundwater use<br />
peaks in the summer at 22 times the<br />
winter monthly use. Monthly bedrock<br />
groundwater use peaks in the summer at<br />
7 times the monthly winter use.<br />
<strong>Oklahoma</strong> Comprehensive <strong>Water</strong> Plan<br />
<strong>Lower</strong> <strong>Washita</strong> Regional Report, Basin Data & Analysis 87
Gaps and Storage Depletions<br />
• Based on projected demand and historical hydrology, surface<br />
water gaps and groundwater storage depletions may occur<br />
by 2020.<br />
• Surface water gaps in Basin 22 may occur throughout the<br />
year, peaking in size during the summer. There will be a 98%<br />
probability <strong>of</strong> gaps occurring in at least one month <strong>of</strong> the<br />
year by 2020. Surface water gaps in 2060 will be up to 30%<br />
(110 AF/month) <strong>of</strong> the surface water demand in the peak<br />
summer month, and as much as 21% (50 AF/month) <strong>of</strong> the<br />
winter monthly surface water demand. Surface water gaps<br />
have a high probability <strong>of</strong> occurring in all seasons.<br />
• Alluvial groundwater storage depletions in Basin 22 may<br />
occur during the summer and fall, peaking in size during<br />
the summer. There will be a 95% probability <strong>of</strong> alluvial<br />
groundwater storage depletions occurring in at least one<br />
month <strong>of</strong> the year by 2020. Alluvial groundwater storage<br />
depletions in 2060 will be up to 29% (50 AF/month) <strong>of</strong> the<br />
alluvial groundwater demand in the peak summer month,<br />
and as much as 17% (10 AF/month) <strong>of</strong> the fall monthly<br />
alluvial groundwater demand. Alluvial groundwater storage<br />
depletions have a high probability <strong>of</strong> occurring in both the<br />
summer and fall.<br />
• Bedrock groundwater storage depletions in Basin 22 may<br />
occur during the summer. Bedrock groundwater storage<br />
depletions in 2060 will be 38% (460 AF/month) <strong>of</strong> the<br />
bedrock groundwater demand on average in the peak<br />
summer month.<br />
• Projected annual alluvial and bedrock groundwater<br />
storage depletions are minimal relative to the amount<br />
<strong>of</strong> water in storage in major aquifers. However, localized<br />
storage depletions may adversely affect well yields, water<br />
quality, or pumping costs.<br />
Months (Season)<br />
Magnitude and Probability<br />
<strong>of</strong> Annual Gaps and Storage Depletions<br />
<strong>Lower</strong> <strong>Washita</strong> Region, Basin 22<br />
Planning<br />
Horizon<br />
Surface <strong>Water</strong> Gaps<br />
by Season (2060 Demand)<br />
<strong>Lower</strong> <strong>Washita</strong> Region, Basin 22<br />
Maximum Gaps/Storage Depletions<br />
Surface<br />
<strong>Water</strong><br />
Maximum Gap 1 Median Gap Probability<br />
AF/month AF/month Percent<br />
Dec-Feb (Winter) 50 50 81%<br />
Mar-May (Spring) 70 60 55%<br />
Jun-Aug (Summer) 110 110 90%<br />
Sep-Nov (Fall) 70 70 83%<br />
1 Amount shown represents largest amount for any one month in season indicated.<br />
Alluvial<br />
Groundwater<br />
AFY<br />
Bedrock<br />
Groundwater<br />
Probability <strong>of</strong> Gaps/<br />
Storage Depletions<br />
Surface<br />
<strong>Water</strong><br />
Alluvial<br />
Groundwater<br />
Percent<br />
2020 1,300 80 260 98% 95%<br />
2030 840 80 400 98% 95%<br />
2040 640 80 570 98% 95%<br />
2050 710 100 710 98% 95%<br />
2060 820 130 920 98% 95%<br />
Alluvial Groundwater Storage Depletions<br />
by Season (2060 Demand)<br />
<strong>Lower</strong> <strong>Washita</strong> Region, Basin 22<br />
Months (Season)<br />
Maximum<br />
Storage<br />
Depletion 1<br />
Median<br />
Storage<br />
Depletion<br />
Probability<br />
AF/month AF/month Percent<br />
Dec-Feb (Winter) 0 0 0%<br />
Mar-May (Spring) 0 0 0%<br />
Jun-Aug (Summer) 50 50 90%<br />
Sep-Nov (Fall) 10 10 57%<br />
1 Amount shown represents largest amount for any one month in season<br />
indicated.<br />
Bedrock Groundwater Storage Depletions<br />
by Season (2060 Demand)<br />
<strong>Lower</strong> <strong>Washita</strong> Region, Basin 22<br />
Months (Season)<br />
Average Storage Depletion 1<br />
AF/month<br />
Dec-Feb (Winter) 0<br />
Mar-May (Spring) 0<br />
Jun-Aug (Summer) 460<br />
Sep-Nov (Fall) 0<br />
1 Amount shown represents largest amount for any one month in season<br />
indicated.<br />
88 <strong>Lower</strong> <strong>Washita</strong> Regional Report, Basin Data & Analysis <strong>Oklahoma</strong> Comprehensive <strong>Water</strong> Plan
Conservation Activities 1<br />
Reliable Diversions Based on Available<br />
Streamflow and New Reservoir Storage<br />
<strong>Lower</strong> <strong>Washita</strong> Region, Basin 22<br />
Reservoir Storage<br />
AF<br />
Required Storage to Meet<br />
Growth in Demand (AF)<br />
Required Storage to<br />
Meet Growth in Surface<br />
<strong>Water</strong> Demand (AF)<br />
Reducing <strong>Water</strong> Needs<br />
Through Conservation<br />
<strong>Lower</strong> <strong>Washita</strong> Region, Basin 22<br />
2060 Gap/Storage Depletion<br />
Surface<br />
<strong>Water</strong><br />
Alluvial<br />
GW<br />
AFY<br />
Bedrock<br />
GW<br />
Diversion<br />
AFY<br />
100 100<br />
500 200<br />
1,000 500<br />
2,500 1,200<br />
5,000 2,300<br />
5,700<br />
1,800<br />
2060 Gap/Storage<br />
Depletion Probability<br />
Surface<br />
<strong>Water</strong><br />
Percent<br />
Alluvial<br />
GW<br />
Existing Conditions 820 130 920 98% 95%<br />
Moderately Expanded Conservation<br />
in Crop Irrigation <strong>Water</strong> Use<br />
Moderately Expanded<br />
Conservation in M&I <strong>Water</strong> Use<br />
Moderately Expanded<br />
Conservation in Crop Irrigation<br />
and M&I <strong>Water</strong> Use<br />
Substantially Expanded<br />
Conservation in Crop Irrigation<br />
and M&I <strong>Water</strong> Use<br />
820 110 810 98% 95%<br />
470 90 860 98% 93%<br />
460 80 750 98% 93%<br />
230 40 580 97% 88%<br />
1 Conservation Activities are documented in the OCWP <strong>Water</strong> Demand Forecast Report.<br />
<strong>Water</strong> Supply Options & Effectiveness<br />
Demand Management<br />
n Typically Effective<br />
n Likely Ineffective<br />
n Potentially Effective<br />
n No Option Necessary<br />
n Moderately expanded permanent conservation activities in the Municipal and Industrial and Crop<br />
Irrigation demand sectors could reduce surface water gaps by about 44%. Alluvial groundwater<br />
storage depletions could be reduced by about 38% and bedrock storage depletions could be<br />
reduced by about 18%. Permanent conservation activities will be more effective temporary drought<br />
management measures, since gaps will occur in almost every year and aquifers storage could<br />
continue to provide supplies during droughts.<br />
Out-<strong>of</strong>-Basin Supplies<br />
n Out-<strong>of</strong>-basin supplies could mitigate groundwater storage depletions. The OCWP Reservoir Viability Study,<br />
which evaluated the potential for reservoirs throughout the state, identified eleven potential out-<strong>of</strong>-basin<br />
sites in the <strong>Lower</strong> <strong>Washita</strong> Region: Caddo Creek, Cox City and Purdy in Basin 14; Chickasha, Gracemont,<br />
Kechi and Verden in Basin 16; Durwood, Gainesville and Ravia in Basin 21; and Courtney in Basin 23.<br />
In addition, Lake Texoma in Basin 21 has substantial unpermitted yield to meet the needs <strong>of</strong> new users.<br />
However, its use is severely constrained by water quality issues. However, in light <strong>of</strong> the distance to reliable<br />
water supplies, out-<strong>of</strong>-basin supplies may not be cost-effective for some users in the basin.<br />
Reservoir Use<br />
n Additional reservoir storage in Basin 22 could effectively supplement supply during dry months. The entire<br />
increase in water use from 2010 to 2060 could be supplied by a new reservoir diversion and 5,700 AF<br />
<strong>of</strong> reservoir storage at the basin outlet. The use <strong>of</strong> multiple reservoirs in the basin or reservoirs upstream<br />
<strong>of</strong> the basin’s outlet may increase the amount <strong>of</strong> storage necessary to mitigate future gaps and storage<br />
depletions. The OCWP Reservoir Viability Study also identified Burneyville Reservoir as a potentially viable<br />
reservoir site in Basin 22.<br />
Increasing Reliance on Surface <strong>Water</strong><br />
n Increased reliance on surface water through direct diversions without reservoir storage will increase<br />
surface water gaps and is not recommended.<br />
Increasing Reliance on Groundwater<br />
n Increased reliance on major aquifers could mitigate surface water gaps, but would increase storage<br />
depletions. Any increases in storage depletions would be small relative to the volume <strong>of</strong> water stored in<br />
the Antlers and Red River aquifers. However, the aquifers only underlie the southern portion <strong>of</strong> the basin.<br />
<strong>Oklahoma</strong> Comprehensive <strong>Water</strong> Plan<br />
<strong>Lower</strong> <strong>Washita</strong> Regional Report, Basin Data & Analysis 89
<strong>Oklahoma</strong> Comprehensive <strong>Water</strong> Plan<br />
Data & Analysis<br />
<strong>Lower</strong> <strong>Washita</strong> <strong>Water</strong>shed Planning Region<br />
Basin 23<br />
91
Basin 23 Summary<br />
Synopsis<br />
• <strong>Water</strong> users are expected to continue to rely primarily on bedrock groundwater and, to<br />
a lesser extent, surface water.<br />
• By 2020, there is a moderate probability <strong>of</strong> surface water gaps from increased<br />
demand on existing supplies during low flow periods.<br />
• Bedrock groundwater storage depletions may occur by 2020. Future bedrock<br />
groundwater withdrawals are expected to occur from non-delineated minor aquifers.<br />
Localized storage depletions may cause adverse effects for users.<br />
• To reduce the risk <strong>of</strong> adverse impacts on water supplies, it is recommended that gaps<br />
and storage depletions be decreased where economically feasible.<br />
• Additional conservation measures could reduce surface water gaps and groundwater<br />
storage depletions.<br />
• To mitigate surface water gaps, major aquifers and/or developing new small reservoirs<br />
could be used as alternatives. These supply sources could be used without major<br />
impacts to groundwater storage.<br />
<strong>Water</strong> <strong>Resources</strong><br />
<strong>Lower</strong> <strong>Washita</strong> Region, Basin 23<br />
Basin 23 accounts for about 4% <strong>of</strong> the current<br />
demand in the <strong>Lower</strong> <strong>Washita</strong> <strong>Water</strong>shed<br />
Planning Region. About 48% <strong>of</strong> the basin’s<br />
demand is from the Municipal and Industrial<br />
demand sector. Livestock is the second<br />
largest demand sector at 26%, followed by<br />
Crop Irrigation at 19% <strong>of</strong> the basin’s demand.<br />
Surface water satisfies about 23% <strong>of</strong> the<br />
current demand in the basin. Groundwater<br />
satisfies about 77% <strong>of</strong> the current demand<br />
(2% alluvial and 75% bedrock). The peak<br />
summer month demand in Basin 23 is 2.6 times<br />
the winter monthly demand, which is similar<br />
to the overall statewide pattern.<br />
The flow in Mud Creek upstream <strong>of</strong> the Red<br />
River is typically greater than 350 AF/month<br />
throughout the year and greater than 4,000<br />
AF/month in the spring and early summer.<br />
However, the creek can have periods <strong>of</strong> low<br />
Current Demand by Source and Sector<br />
<strong>Lower</strong> <strong>Washita</strong> Region, Basin 23<br />
Total Demand<br />
3,520 AFY<br />
92 <strong>Lower</strong> <strong>Washita</strong> Regional Report <strong>Oklahoma</strong> Comprehensive <strong>Water</strong> Plan
Median Historical Streamflow<br />
at the Basin Outlet<br />
<strong>Lower</strong> <strong>Washita</strong> Region, Basin 23<br />
Projected <strong>Water</strong> Demand<br />
<strong>Lower</strong> <strong>Washita</strong> Region, Basin 23<br />
to no flow in any month <strong>of</strong> the year. There<br />
are no major reservoirs in Basin 23. The<br />
availability <strong>of</strong> permits is not expected to limit<br />
the development <strong>of</strong> surface water supplies for<br />
in-basin use through 2060. Relative to other<br />
basins in the state, the surface water quality<br />
in Basin 23 is considered fair. Fox Branch and<br />
Oak Creek are impaired for Agricultural use<br />
due to high levels <strong>of</strong> chloride, sulfate, and total<br />
dissolved solids (TDS).<br />
The majority <strong>of</strong> groundwater rights (9,800<br />
AFY) in Basin 23 are from non-delineated<br />
minor bedrock aquifers. There are also 100<br />
AFY <strong>of</strong> groundwater rights in non-delineated<br />
minor alluvial aquifers. The major Red River<br />
alluvial aquifer and major Antlers bedrock<br />
aquifer underlie small portions <strong>of</strong> the basin,<br />
but are not used. The basin contributes<br />
1,000 AFY <strong>of</strong> recharge to the Antlers aquifer.<br />
Domestic users do not require a permit and are<br />
assumed to be obtaining supplies from aquifers<br />
in the basin. The use <strong>of</strong> groundwater to meet<br />
in-basin demand is not expected to be limited<br />
by the availability <strong>of</strong> permits through 2060.<br />
There are no significant groundwater quality<br />
issues in the basin.<br />
The projected 2060 water demand <strong>of</strong> 4,480<br />
AFY in Basin 23 reflects a 960 AFY increase<br />
(27%) over the 2010 demand. The largest<br />
demand and growth in demand over this<br />
period will be in the Municipal and Industrial<br />
demand sector.<br />
Gaps & Depletions<br />
Based on projected demand and historical<br />
hydrology, surface water gaps and bedrock<br />
groundwater storage depletions may occur by<br />
2020. Surface water gaps will be up to 170 AFY<br />
and have a 43% probability <strong>of</strong> occurring in at<br />
least one month <strong>of</strong> the year by 2060. Surface<br />
water gaps in Basin 23 may occur throughout<br />
the year, but are most likely to occur in<br />
summer and fall months. Bedrock groundwater<br />
storage depletions will be 600 AFY and occur<br />
throughout the year, peaking in summer.<br />
Future bedrock groundwater withdrawals are<br />
expected to occur from non-delineated minor<br />
aquifers. Therefore, the extent <strong>of</strong> the storage<br />
depletions cannot fully be evaluated due to<br />
insufficient information. Localized storage<br />
depletions may adversely affect well yields,<br />
water quality, and/or pumping costs.<br />
Options<br />
<strong>Water</strong> users are expected to continue to rely<br />
primarily on bedrock groundwater and surface<br />
water. To reduce the risk <strong>of</strong> adverse impacts<br />
to the basin’s water users, surface water gaps<br />
and bedrock groundwater storage depletions<br />
should be decreased where economically<br />
feasible.<br />
Moderately expanded permanent conservation<br />
activities in the Municipal and Industrial,<br />
<strong>Water</strong> Supply Limitations<br />
<strong>Lower</strong> <strong>Washita</strong> Region, Basin 23<br />
Surface <strong>Water</strong><br />
Alluvial Groundwater<br />
Bedrock Groundwater<br />
n Minimal n Potential n Significant<br />
<strong>Water</strong> Supply Option<br />
Effectiveness<br />
<strong>Lower</strong> <strong>Washita</strong> Region, Basin 23<br />
Demand Management<br />
Out-<strong>of</strong>-Basin Supplies<br />
Reservoir Use<br />
Increasing Supply from Surface <strong>Water</strong><br />
Increasing Supply from Groundwater<br />
n Typically Effective n Potentially Effective<br />
n Likely Ineffective<br />
n No Option Necessary<br />
Self-Supplied Residential, and Crop Irrigation<br />
demand sectors could reduce surface water<br />
gaps and groundwater storage depletions.<br />
Temporary drought management activities<br />
may not be effective for this basin, since there<br />
is a moderate probability <strong>of</strong> surface water gaps<br />
and storage in bedrock aquifers may continue<br />
to provide supplies during droughts.<br />
Out-<strong>of</strong>-basin supplies could mitigate<br />
surface water gaps and groundwater storage<br />
depletions. The OCWP Reservoir Viability<br />
Study, which evaluated the potential for<br />
reservoirs throughout the state, identified<br />
eleven potentially viable out-<strong>of</strong>-basin sites<br />
in the <strong>Lower</strong> <strong>Washita</strong> Region. In additional,<br />
Lake Texoma, in Basin 21, has substantial<br />
unpermitted yield to meet the needs <strong>of</strong> new<br />
users, but the lake’s water quality severely<br />
limits its use. However, in light <strong>of</strong> the distance<br />
to reliable water supplies, out-<strong>of</strong>-basin<br />
supplies may not be cost-effective for many<br />
users in the basin.<br />
Additional reservoir storage in Basin 23 could<br />
effectively supplement supply during dry<br />
months. The entire increase in demand from<br />
2010 to 2060 could be supplied by a new river<br />
diversion and 600 AF <strong>of</strong> reservoir storage at<br />
the basin outlet. The OCWP Reservoir Viability<br />
Study also identified Courtney Reservoir as a<br />
potentially viable site in Basin 23.<br />
Increased reliance on surface water through direct<br />
diversions, without reservoir storage, will increase<br />
surface water gaps and is not recommended.<br />
Increased reliance on major alluvial aquifers<br />
could mitigate surface water gaps, but may<br />
create storage depletions. Any increases in<br />
storage depletions would be small relative to<br />
the volume <strong>of</strong> water stored in the Red River<br />
aquifer. However, this aquifer only underlies<br />
the extreme southern portion <strong>of</strong> the basin<br />
(about 12% <strong>of</strong> the basin area).<br />
<strong>Oklahoma</strong> Comprehensive <strong>Water</strong> Plan<br />
<strong>Lower</strong> <strong>Washita</strong> Regional Report 93
Basin 23 Data & Analysis<br />
Surface <strong>Water</strong> <strong>Resources</strong><br />
• Historical streamflow from 1950<br />
through 2007 was used to estimate<br />
the range <strong>of</strong> future surface water<br />
supplies. Mud Creek upstream <strong>of</strong> the<br />
Red River had a period <strong>of</strong> belowaverage<br />
streamflow from the early<br />
1960s to the early 1970s. From the<br />
early 1980s through the late 1990s,<br />
the basin went through a prolonged<br />
period <strong>of</strong> above-average streamflow<br />
and precipitation, demonstrating<br />
hydrologic variability in the basin.<br />
• The median flow in Mud Creek<br />
upstream <strong>of</strong> the Red River is greater<br />
than 350 AF/month throughout<br />
the year and greater than 4,000<br />
AF/month in the spring and early<br />
summer. However, the creek can<br />
have periods <strong>of</strong> low to no flow in any<br />
month <strong>of</strong> the year.<br />
• Relative to other basins in the state,<br />
the surface water quality in Basin 23 is<br />
considered fair.<br />
• There are no major reservoirs in<br />
Basin 23.<br />
Monthly Historical Streamflow at the Basin Outlet<br />
<strong>Lower</strong> <strong>Washita</strong> Region, Basin 23<br />
Historical Streamflow at the Basin Outlet<br />
<strong>Lower</strong> <strong>Washita</strong> Region, Basin 23<br />
Historical Precipitation<br />
Regional Climate Division<br />
94 <strong>Lower</strong> <strong>Washita</strong> Regional Report, Basin Data & Analysis <strong>Oklahoma</strong> Comprehensive <strong>Water</strong> Plan
Aquifer<br />
Groundwater <strong>Resources</strong> - Aquifer Summary (2010)<br />
<strong>Lower</strong> <strong>Washita</strong> Region, Basin 23<br />
Portion <strong>of</strong> Basin<br />
Overlaying Aquifer<br />
Current<br />
Groundwater<br />
Rights<br />
Aquifer Storage<br />
in Basin<br />
Equal<br />
Proportionate<br />
Share<br />
Groundwater<br />
Available for<br />
New Permits<br />
Name Type Class 1 Percent AFY AF AFY/Acre AFY<br />
Antlers Bedrock Major 2% 0 63,000 2.1 13,400<br />
Red River Alluvial Major 12% 0 171,000 temporary 2.0 89,600<br />
Non-Delineated Groundwater Source Bedrock Minor N/A 9,800 N/A temporary 2.0 N/A<br />
Non-Delineated Groundwater Source Alluvial Minor N/A 100 N/A temporary 2.0 N/A<br />
1 Bedrock aquifers with typical yields greater than 50 gpm and alluvial aquifers with typical yields greater than 150 gpm are considered major.<br />
Groundwater <strong>Resources</strong><br />
• The majority <strong>of</strong> groundwater rights<br />
in Basin 23 are from non-delineated<br />
minor bedrock groundwater<br />
sources. There are also 100 AFY <strong>of</strong><br />
groundwater rights in non-delineated<br />
minor alluvial aquifers. While minor<br />
aquifers may have a large amount<br />
<strong>of</strong> water in storage, they typically<br />
provide lower yields which may not be<br />
sufficient for large-scale users. The<br />
Red River and Antlers major aquifers<br />
underlie small portions <strong>of</strong> the basin,<br />
but currently have no water rights.<br />
The basin contributes 1,000 AFY <strong>of</strong><br />
recharge to the Antlers aquifer.<br />
• There are no significant groundwater<br />
quality issues in basin.<br />
<strong>Oklahoma</strong> Comprehensive <strong>Water</strong> Plan<br />
<strong>Lower</strong> <strong>Washita</strong> Regional Report, Basin Data & Analysis 95
<strong>Water</strong> Demand<br />
• Basin 23’s water needs account for<br />
about 4% <strong>of</strong> the demand in the <strong>Lower</strong><br />
<strong>Washita</strong> <strong>Water</strong>shed Planning Region and<br />
will increase by 27% (960 AFY) from<br />
2010 to 2060. The largest demand and<br />
growth in demand during this period will<br />
be from the Municipal and Industrial<br />
demand sector.<br />
• Surface water is used to meet 23% <strong>of</strong><br />
total demand in the basin and its use will<br />
increase by 41% (330 AFY) from 2010<br />
to 2060. The majority <strong>of</strong> the surface<br />
water use and growth in surface water<br />
use during this period will be from the<br />
Municipal and Industrial demand sector.<br />
• Alluvial groundwater is used to meet<br />
2% <strong>of</strong> total demand in the basin and<br />
its use will increase by 8% (10 AFY)<br />
from 2010 to 2060. This increase in<br />
alluvial groundwater use is minimal<br />
on a basin-scale. The majority <strong>of</strong> the<br />
alluvial groundwater use and growth<br />
in alluvial groundwater use during this<br />
period will be from the Self-Supplied<br />
Residential demand sector.<br />
• Bedrock groundwater is used to meet<br />
75% <strong>of</strong> total demand in the basin<br />
and its use will increase by 24% (620<br />
AFY) from 2010 to 2060. The largest<br />
bedrock groundwater use and growth<br />
in bedrock groundwater use during this<br />
period will be from the Municipal and<br />
Industrial demand sector.<br />
Surface <strong>Water</strong> Demand<br />
by Sector<br />
<strong>Lower</strong> <strong>Washita</strong> Region, Basin 23<br />
Planning<br />
Horizon<br />
Crop Irrigation<br />
Livestock<br />
Alluvial Groundwater Demand<br />
by Sector<br />
<strong>Lower</strong> <strong>Washita</strong> Region, Basin 23<br />
Total Demand by Sector<br />
<strong>Lower</strong> <strong>Washita</strong> Region, Basin 23<br />
Municipal &<br />
Industrial<br />
Oil & Gas<br />
AFY<br />
Self-Supplied<br />
Industrial<br />
Self-Supplied<br />
Residential<br />
Bedrock Groundwater Demand<br />
by Sector<br />
<strong>Lower</strong> <strong>Washita</strong> Region, Basin 23<br />
•Thermoelectric Power •Self-Supplied Residential •Self-Supplied Industrial •Oil & Gas •Municipal & Industrial •Livestock •Crop Irrigation<br />
Thermoelectric<br />
Power<br />
2010 670 920 1,670 50 0 210 0 3,520<br />
2020 700 930 2,070 80 0 210 0 3,990<br />
2030 730 930 2,120 90 0 210 0 4,080<br />
2040 760 940 2,190 100 0 220 0 4,210<br />
2050 790 950 2,260 110 0 220 0 4,330<br />
2060 830 960 2,340 130 0 220 0 4,480<br />
Total<br />
96 <strong>Lower</strong> <strong>Washita</strong> Regional Report, Basin Data & Analysis <strong>Oklahoma</strong> Comprehensive <strong>Water</strong> Plan
Monthly Demand Distribution by Sector (2010)<br />
<strong>Lower</strong> <strong>Washita</strong> Region, Basin 23<br />
Monthly Demand Distribution by Source (2010)<br />
<strong>Lower</strong> <strong>Washita</strong> Region, Basin 23<br />
Current Monthly Demand<br />
Distribution by Sector<br />
• The Municipal and Industrial and Self-<br />
Supplied Residential demand sectors use<br />
80% more water in summer months than<br />
in winter months. Crop Irrigation has a<br />
high demand in summer months and<br />
little or no demand in winter months.<br />
Other demand sectors have more<br />
consistent demand throughout the year.<br />
Current Monthly Demand<br />
Distribution by Source<br />
• The peak summer month total water<br />
demand in Basin 23 is 2.6 times the<br />
winter monthly demand, which is similar<br />
to the overall statewide pattern. Surface<br />
water use in the peak summer month<br />
is 2.1 times the winter monthly use.<br />
Monthly alluvial groundwater use peaks<br />
in the summer at about 2.1 times the<br />
monthly winter use. Monthly bedrock<br />
groundwater use peaks in the summer at<br />
2.8 times the winter monthly use.<br />
<strong>Oklahoma</strong> Comprehensive <strong>Water</strong> Plan<br />
<strong>Lower</strong> <strong>Washita</strong> Regional Report, Basin Data & Analysis 97
Gaps and Storage Depletions<br />
• Based on projected demand and historical<br />
hydrology, surface water gaps and bedrock<br />
groundwater storage depletions may occur<br />
by 2020. No alluvial groundwater storage<br />
depletions are expected through 2060.<br />
• Surface water gaps in Basin 23 may occur<br />
throughout the year. Surface water gaps<br />
in 2060 will be up to 29% (40 AF/month)<br />
<strong>of</strong> the surface water demand in the peak<br />
summer month, and as much as 29% (20<br />
AF/month) <strong>of</strong> the winter monthly surface<br />
water demand. There will be a 43%<br />
probability <strong>of</strong> gaps occurring in at least<br />
one month <strong>of</strong> the year by 2060. Surface<br />
water gaps are most likely to occur during<br />
summer and fall months.<br />
• Bedrock groundwater storage depletions in<br />
Basin 23 may occur throughout the year,<br />
peaking in size during the summer. Bedrock<br />
groundwater storage depletions in 2060<br />
will be 20% (100 AF/month) <strong>of</strong> the bedrock<br />
groundwater demand in the peak summer<br />
month, and 17% (30 AF/month) on average<br />
<strong>of</strong> the winter monthly bedrock groundwater<br />
demand.<br />
• Future bedrock groundwater withdrawals<br />
are expected to occur from non-delineated<br />
minor aquifers. Therefore, the extent <strong>of</strong> the<br />
storage depletions cannot be fully evaluated<br />
due to insufficient information.<br />
Months (Season)<br />
Planning<br />
Horizon<br />
Magnitude and Probability<br />
<strong>of</strong> Annual Gaps and Storage Depletions<br />
<strong>Lower</strong> <strong>Washita</strong> Region, Basin 23<br />
Maximum Gaps/Storage Depletions<br />
Surface<br />
<strong>Water</strong><br />
Surface <strong>Water</strong> Gaps<br />
by Season (2060 Demand)<br />
<strong>Lower</strong> <strong>Washita</strong> Region, Basin 23<br />
Maximum Gap 1 Median Gap Probability<br />
AF/month AF/month Percent<br />
Dec-Feb (Winter) 20 10 19%<br />
Mar-May (Spring) 20 20 5%<br />
Jun-Aug (Summer) 40 40 29%<br />
Sep-Nov (Fall) 30 20 33%<br />
1 Amount shown represents largest amount for any one month in season indicated.<br />
Alluvial<br />
Groundwater<br />
AFY<br />
Bedrock<br />
Groundwater<br />
Probability <strong>of</strong> Gaps/<br />
Storage Depletions<br />
Surface<br />
<strong>Water</strong><br />
Alluvial<br />
Groundwater<br />
Percent<br />
2020 90 0 300 38% 0%<br />
2030 100 0 360 40% 0%<br />
2040 130 0 440 40% 0%<br />
2050 150 0 520 40% 0%<br />
2060 170 0 600 43% 0%<br />
Alluvial Groundwater Storage Depletions<br />
by Season (2060 Demand)<br />
<strong>Lower</strong> <strong>Washita</strong> Region, Basin 23<br />
Months (Season)<br />
Maximum<br />
Storage<br />
Depletion 1<br />
Median Storage<br />
Depletion<br />
Probability<br />
AF/month AF/month Percent<br />
Dec-Feb (Winter) 0 0 0%<br />
Mar-May (Spring) 0 0 0%<br />
Jun-Aug (Summer) 0 0 0%<br />
Sep-Nov (Fall) 0 0 0%<br />
1 Amount shown represents largest amount for any one month in season<br />
indicated.<br />
Bedrock Groundwater Storage Depletions<br />
by Season (2060 Demand)<br />
<strong>Lower</strong> <strong>Washita</strong> Region, Basin 23<br />
Months (Season)<br />
Average Storage Depletion 1<br />
AF/month<br />
Dec-Feb (Winter) 30<br />
Mar-May (Spring) 40<br />
Jun-Aug (Summer) 100<br />
Sep-Nov (Fall) 60<br />
1 Amount shown represents largest amount for any one month in season indicated.<br />
98 <strong>Lower</strong> <strong>Washita</strong> Regional Report, Basin Data & Analysis <strong>Oklahoma</strong> Comprehensive <strong>Water</strong> Plan
Conservation Activities 1<br />
Reliable Diversions Based on Available<br />
Streamflow and New Reservoir Storage<br />
<strong>Lower</strong> <strong>Washita</strong> Region, Basin 23<br />
Reservoir Storage<br />
AF<br />
Required Storage to Meet<br />
Growth in Demand (AF)<br />
Required Storage to<br />
Meet Growth in Surface<br />
<strong>Water</strong> Demand (AF)<br />
Reducing <strong>Water</strong> Needs<br />
Through Conservation<br />
<strong>Lower</strong> <strong>Washita</strong> Region, Basin 23<br />
2060 Gap/Storage Depletion<br />
Surface<br />
<strong>Water</strong><br />
Alluvial<br />
GW<br />
AFY<br />
Bedrock<br />
GW<br />
Diversion<br />
AFY<br />
100 200<br />
500 800<br />
1,000 1,500<br />
2,500 3,100<br />
5,000 4,700<br />
600<br />
200<br />
2060 Gap/Storage<br />
Depletion Probability<br />
Surface<br />
<strong>Water</strong><br />
Percent<br />
Alluvial<br />
GW<br />
Existing Conditions 170 0 600 43% 0%<br />
Moderately Expanded Conservation<br />
in Crop Irrigation <strong>Water</strong> Use<br />
Moderately Expanded<br />
Conservation in M&I <strong>Water</strong> Use<br />
Moderately Expanded<br />
Conservation in Crop Irrigation<br />
and M&I <strong>Water</strong> Use<br />
Substantially Expanded<br />
Conservation in Crop Irrigation<br />
and M&I <strong>Water</strong> Use<br />
170 0 580 43% 0%<br />
80 0 270 34% 0%<br />
80 0 250 34% 0%<br />
30 0 50 22% 0%<br />
1 Conservation Activities are documented in the OCWP <strong>Water</strong> Demand Forecast Report.<br />
<strong>Water</strong> Supply Options & Effectiveness<br />
Demand Management<br />
n Typically Effective<br />
n Likely Ineffective<br />
n Potentially Effective<br />
n No Option Necessary<br />
n Moderately expanded permanent conservation activities in the Municipal and Industrial, Self-Supplied<br />
Residential, and Crop Irrigation demand sectors could reduce surface water gaps by about 53%. Bedrock<br />
groundwater storage depletions could be reduced by 58%. Temporary drought management activities will<br />
not be effective for this basin, since there is a moderate probability <strong>of</strong> surface water gaps and storage in<br />
bedrock aquifers may continue to provide supplies during droughts.<br />
Out-<strong>of</strong>-Basin Supplies<br />
n Out-<strong>of</strong>-basin supplies could mitigate surface water gaps and groundwater storage depletions. The OCWP<br />
Reservoir Viability Study, which evaluated the potential for reservoirs throughout the state, identified<br />
eleven potential out-<strong>of</strong>-basin sites in the <strong>Lower</strong> <strong>Washita</strong> Region: Caddo Creek, Cox City and Purdy in<br />
Basin 14; Chickasha, Gracemont, Kechi and Verden in Basin 16; Durwood, Gainesville and Ravia in<br />
Basin 21; and Burneyville in Basin 22. In addition, Lake Texoma, in Basin 21, has substantial unpermitted<br />
yield to meet the needs <strong>of</strong> new users, but its use is severely constrained by water quality issues. However,<br />
in light <strong>of</strong> the distance to reliable water supplies, out-<strong>of</strong>-basin supplies may not be cost-effective for many<br />
users in the basin.<br />
Reservoir Use<br />
n Additional reservoir storage in Basin 23 could effectively supplement supply during dry months. The<br />
entire increase in demand from 2010 to 2060 could be supplied by a new river diversion and 600 AF <strong>of</strong><br />
reservoir storage at the basin outlet. The use <strong>of</strong> multiple reservoirs in the basin or reservoirs upstream<br />
<strong>of</strong> the basin’s outlet may increase the amount <strong>of</strong> storage necessary to mitigate future gaps and storage<br />
depletions. The OCWP Reservoir Viability Study identified Courtney Reservoir as a potentially viable site in<br />
Basin 23.<br />
Increasing Reliance on Surface <strong>Water</strong><br />
n Increased reliance on surface water through direct diversions, without reservoir storage, may create<br />
surface water gaps and is not recommended.<br />
Increasing Reliance on Groundwater<br />
n Increased reliance on major alluvial aquifers could mitigate surface water gaps, but may create storage<br />
depletions. Any increases in storage depletions would be small relative to the volume <strong>of</strong> water stored<br />
in the Red River aquifer. However, this aquifer only underlies the extreme southern portion <strong>of</strong> the basin<br />
(about 12% <strong>of</strong> the basin area).<br />
<strong>Oklahoma</strong> Comprehensive <strong>Water</strong> Plan<br />
<strong>Lower</strong> <strong>Washita</strong> Regional Report, Basin Data & Analysis 99
Glossary<br />
Acre-foot: volume <strong>of</strong> water that would cover<br />
one acre <strong>of</strong> land to a depth <strong>of</strong> one foot; equivalent<br />
to 43,560 cubic feet or 325,851 gallons.<br />
Alkalinity: measurement <strong>of</strong> the water’s ability<br />
to neutralize acids. High alkalinity usually<br />
indicates the presence <strong>of</strong> carbonate, bicarbonates,<br />
or hydroxides. <strong>Water</strong>s that have high alkalinity<br />
values are <strong>of</strong>ten considered undesirable because<br />
<strong>of</strong> excessive hardness and high concentrations<br />
<strong>of</strong> sodium salts. <strong>Water</strong>s with low alkalinity have<br />
little capacity to buffer acidic inputs and are<br />
susceptible to acidification (low pH).<br />
Alluvial aquifer: aquifer with porous media<br />
consisting <strong>of</strong> loose, unconsolidated sediments<br />
deposited by fluvial (river) or aeolian (wind)<br />
processes, typical <strong>of</strong> river beds, floodplains,<br />
dunes, and terraces.<br />
Alluvial groundwater: water found in an<br />
alluvial aquifer.<br />
Alluvium: sediments <strong>of</strong> clay, silt, gravel, or other<br />
unconsolidated material deposited over time<br />
by a flowing stream on its floodplain or delta;<br />
frequently associated with higher-lying terrace<br />
deposits <strong>of</strong> groundwater.<br />
Appendix B areas: waters <strong>of</strong> the state into<br />
which discharges may be limited and that<br />
are located within the boundaries <strong>of</strong> areas<br />
listed in Appendix B <strong>of</strong> OWRB rules Chapter<br />
45 on <strong>Oklahoma</strong>’s <strong>Water</strong> Quality Standards<br />
(OWQS); including but not limited to National<br />
and <strong>State</strong> parks, forests, wilderness areas,<br />
wildlife management areas, and wildlife refuges.<br />
Appendix B may include areas inhabited by<br />
federally listed threatened or endangered species<br />
and other appropriate areas.<br />
Appropriative right: right acquired under<br />
the procedure provided by law to take a specific<br />
quantity <strong>of</strong> water by direct diversion from a<br />
stream, an impoundment thereon, or a playa lake,<br />
and to apply such water to a specific beneficial<br />
use or uses.<br />
Aquifer: geologic unit or formation that<br />
contains sufficient saturated, permeable material<br />
to yield economically significant quantities <strong>of</strong><br />
water to wells and springs.<br />
Artificial recharge: any man-made process<br />
specifically designed for the primary purpose <strong>of</strong><br />
increasing the amount <strong>of</strong> water entering into an<br />
aquifer.<br />
Attainable uses: best uses achievable for a<br />
particular waterbody given water <strong>of</strong> adequate<br />
quality.<br />
Background: ambient condition upstream or<br />
upgradient from a facility, practice, or activity<br />
that has not been affected by that facility,<br />
practice or activity.<br />
Basin: see Surface water basin.<br />
Basin outlet: the furthest downstream<br />
geographic point in an OCWP planning basin.<br />
Bedrock aquifer: aquifer with porous media<br />
consisting <strong>of</strong> lithified (semi-consolidated or<br />
consolidated) sediments, such as limestone,<br />
sandstone, siltstone, or fractured crystalline rock.<br />
Bedrock groundwater: water found in a<br />
bedrock aquifer.<br />
Beneficial use: (1) The use <strong>of</strong> stream or<br />
groundwater when reasonable intelligence and<br />
diligence are exercised in its application for a<br />
lawful purpose and as is economically necessary<br />
for that purpose. Beneficial uses include but are<br />
not limited to municipal, industrial, agricultural,<br />
irrigation, recreation, fish and wildlife, etc., as<br />
defined in OWRB rules Chapter 20 on stream<br />
water use and Chapter 30 on groundwater use.<br />
(2) A classification in OWQS <strong>of</strong> the waters <strong>of</strong> the<br />
<strong>State</strong>, according to their best uses in the interest<br />
<strong>of</strong> the public set forth in OWRB rules Chapter 45<br />
on OWQS.<br />
<strong>Board</strong>: <strong>Oklahoma</strong> <strong>Water</strong> <strong>Resources</strong> <strong>Board</strong>.<br />
Chlorophyll-a: primary photosynthetic plant<br />
pigment used in water quality analysis as a<br />
measure <strong>of</strong> algae growth.<br />
Conductivity: a measure <strong>of</strong> the ability <strong>of</strong><br />
water to pass electrical current. High specific<br />
conductance indicates high concentrations <strong>of</strong><br />
dissolved solids.<br />
Conjunctive management: water<br />
management approach that takes into account<br />
the interactions between groundwaters and<br />
surface waters and how those interactions may<br />
affect water availability.<br />
Conservation: protection from loss and waste.<br />
Conservation <strong>of</strong> water may mean to save or<br />
store water for later use or to use water more<br />
efficiently.<br />
Conservation pool: reservoir storage <strong>of</strong> water<br />
for the project’s authorized purpose other than<br />
flood control.<br />
Consumptive use: a use <strong>of</strong> water that diverts it<br />
from a water supply.<br />
Cultural eutrophication: condition<br />
occurring in lakes and streams whereby<br />
normal processes <strong>of</strong> eutrophication are<br />
accelerated by human activities.<br />
Dam: any artificial barrier, together with<br />
appurtenant works, which does or may impound<br />
or divert water.<br />
Degradation: any condition caused by the<br />
activities <strong>of</strong> humans resulting in the prolonged<br />
impairment <strong>of</strong> any constituent <strong>of</strong> an aquatic<br />
environment.<br />
Demand: amount <strong>of</strong> water required to meet<br />
the needs <strong>of</strong> people, communities, industry,<br />
agriculture, and other users.<br />
Demand forecast: estimate <strong>of</strong> expected water<br />
demands for a given planning horizon.<br />
Demand management: adjusting use<br />
<strong>of</strong> water through temporary or permanent<br />
conservation measures to meet the water needs <strong>of</strong><br />
a basin or region.<br />
Demand sectors: distinct consumptive users<br />
<strong>of</strong> the state’s waters. For OCWP analysis, seven<br />
demand sectors were identified: thermoelectric<br />
power, self-supplied residential, self-supplied<br />
industrial, oil and gas, municipal and industrial,<br />
livestock, and crop irrigation.<br />
Dependable yield: the maximum amount <strong>of</strong><br />
water a reservoir can dependably supply from<br />
storage during a drought <strong>of</strong> record.<br />
Depletion: a condition that occurs when<br />
the amount <strong>of</strong> existing and future demand for<br />
groundwater exceeds available recharge.<br />
Dissolved oxygen: amount <strong>of</strong> oxygen gas<br />
dissolved in a given volume <strong>of</strong> water at a<br />
particular temperature and pressure, <strong>of</strong>ten<br />
expressed as a concentration in parts <strong>of</strong> oxygen<br />
per million parts <strong>of</strong> water. Low levels <strong>of</strong> dissolved<br />
oxygen facilitate the release <strong>of</strong> nutrients from<br />
sediments.<br />
Diversion: to take water from a stream or<br />
waterbody into a pipe, canal, or other conduit,<br />
either by pumping or gravity flow.<br />
Domestic use: in relation to OWRB<br />
permitting, the use <strong>of</strong> water by a natural<br />
individual or by a family or household for<br />
household purposes, for farm and domestic<br />
animals up to the normal grazing capacity <strong>of</strong><br />
the land whether or not the animals are actually<br />
owned by such natural individual or family,<br />
100 <strong>Lower</strong> <strong>Washita</strong> Regional Report <strong>Oklahoma</strong> Comprehensive <strong>Water</strong> Plan
and for the irrigation <strong>of</strong> land not exceeding a<br />
total <strong>of</strong> three acres in area for the growing <strong>of</strong><br />
gardens, orchards, and lawns. Domestic use also<br />
includes: (1) the use <strong>of</strong> water for agriculture<br />
purposes by natural individuals, (2) use <strong>of</strong><br />
water for fire protection, and (3) use <strong>of</strong> water<br />
by non-household entities for drinking water<br />
purposes, restroom use, and the watering <strong>of</strong><br />
lawns, provided that the amount <strong>of</strong> water used<br />
for any such purposes does not exceed five<br />
acre-feet per year.<br />
Drainage area: total area above the discharge<br />
point drained by a receiving stream.<br />
DWSRF: see <strong>State</strong> Revolving Fund (SRF).<br />
Drought management: short-term measures<br />
to conserve water to sustain a basin’s or region’s<br />
needs during times <strong>of</strong> below normal rainfall.<br />
Ecoregion (ecological region): an<br />
ecologically and geographically defined area;<br />
sometimes referred to as a bioregion.<br />
Effluent: any fluid emitted by a source to a<br />
stream, reservoir, or basin, including a partially or<br />
completely treated waste fluid that is produced<br />
by and flows out <strong>of</strong> an industrial or wastewater<br />
treatment plant or sewer.<br />
Elevation: elevation in feet in relation to mean<br />
sea level (MSL).<br />
Equal proportionate share (EPS): portion<br />
<strong>of</strong> the maximum annual yield <strong>of</strong> water from a<br />
groundwater basin that is allocated to each acre<br />
<strong>of</strong> land overlying the basin or subbasin.<br />
Eutrophic: a water quality characterization,<br />
or “trophic status,” that indicates abundant<br />
nutrients and high rates <strong>of</strong> productivity in a lake,<br />
frequently resulting in oxygen depletion below<br />
the surface.<br />
Eutrophication: the process whereby the<br />
condition <strong>of</strong> a waterbody changes from one <strong>of</strong><br />
low biologic productivity and clear water to one<br />
<strong>of</strong> high productivity and water made turbid by<br />
the accelerated growth <strong>of</strong> algae.<br />
Flood control pool: reservoir storage <strong>of</strong> excess<br />
run<strong>of</strong>f above the conservation pool storage<br />
capacity that is discharged at a regulated rate to<br />
reduce potential downstream flood damage.<br />
Floodplain: the land adjacent to a body <strong>of</strong> water<br />
which has been or may be covered by flooding,<br />
including, but not limited to, the one-hundred<br />
year flood (the flood expected to be equaled or<br />
exceeded every 100 years on average).<br />
Fresh water: water that has less than five<br />
thousand (5,000) parts per million total dissolved<br />
solids.<br />
Gap: an anticipated shortage in supply <strong>of</strong><br />
surface water due to a deficiency <strong>of</strong> physical<br />
water supply or the inability or failure to obtain<br />
necessary water rights.<br />
Groundwater: fresh water under the surface<br />
<strong>of</strong> the earth regardless <strong>of</strong> the geologic structure<br />
in which it is standing or moving outside the cut<br />
bank <strong>of</strong> a definite stream.<br />
Groundwater basin: a distinct underground<br />
body <strong>of</strong> water overlain by contiguous land<br />
having substantially the same geological<br />
and hydrological characteristics and yield<br />
capabilities. The area boundaries <strong>of</strong> a major<br />
or minor basin can be determined by political<br />
boundaries, geological, hydrological, or other<br />
reasonable physical boundaries.<br />
Groundwater recharge: see Recharge.<br />
Hardness: a measure <strong>of</strong> the mineral content <strong>of</strong><br />
water. <strong>Water</strong> containing high concentrations<br />
(usually greater than 60 ppm) <strong>of</strong> iron, calcium,<br />
magnesium, and hydrogen ions is usually<br />
considered “hard water.”<br />
High Quality <strong>Water</strong>s (HQW): a designation<br />
in the OWQS referring to waters that exhibit<br />
water quality exceeding levels necessary to<br />
support the propagation <strong>of</strong> fishes, shellfishes,<br />
wildlife, and recreation in and on the water.<br />
This designation prohibits any new point<br />
source discharge or additional load or increased<br />
concentration <strong>of</strong> specified pollutants.<br />
Hydraulic conductivity: the capacity <strong>of</strong> rock<br />
to transmit groundwater under pressure.<br />
Hydrologic unit code: a numerical designation<br />
utilized by the United <strong>State</strong>s Geologic Survey<br />
and other federal and state agencies as a way<br />
<strong>of</strong> identifying all drainage basins in the U.S. in<br />
a nested arrangement from largest to smallest,<br />
consisting <strong>of</strong> a multi-digit code that identifies<br />
each <strong>of</strong> the levels <strong>of</strong> classification within twodigit<br />
fields.<br />
Hypereutrophic: a surface water quality<br />
characterization, or “trophic status,” that<br />
indicates excessive primary productivity and<br />
excessive nutrient levels in a lake.<br />
Impaired water: waterbody in which the<br />
quality fails to meet the standards prescribed for<br />
its beneficial uses.<br />
Impoundment: body <strong>of</strong> water, such as a pond<br />
or lake, confined by a dam, dike, floodgate, or<br />
other barrier established to collect and store<br />
water.<br />
Infiltration: the gradual downward flow <strong>of</strong><br />
water from the surface <strong>of</strong> the earth into the<br />
subsurface.<br />
Instream flow: a quantity <strong>of</strong> water to be set<br />
aside in a stream or river to ensure downstream<br />
environmental, social, and economic benefits are<br />
met (further defined in the OCWP Instream Flow<br />
Issues & Recommendations report).<br />
Interbasin transfer: the physical conveyance<br />
<strong>of</strong> water from one basin to another.<br />
Levee: a man-made structure, usually an earthen<br />
embankment, designed and constructed to<br />
contain, control, or divert the flow <strong>of</strong> water so as<br />
to provide protection from temporary flooding.<br />
Major groundwater basin: a distinct<br />
underground body <strong>of</strong> water overlain by<br />
contiguous land and having essentially the same<br />
geological and hydrological characteristics and<br />
from which groundwater wells yield at least<br />
fifty (50) gallons per minute on the average<br />
basinwide if from a bedrock aquifer, and at least<br />
one hundred fifty (150) gallons per minute on<br />
the average basinwide if from an alluvium and<br />
terrace aquifer, or as otherwise designated by<br />
the OWRB.<br />
Marginal quality water: waters that have<br />
been historically unusable due to technological<br />
or economic issues associated with diversion,<br />
treatment, or conveyance.<br />
Maximum annual yield (MAY):<br />
determination by the OWRB <strong>of</strong> the total amount<br />
<strong>of</strong> fresh groundwater that can be produced from<br />
each basin or subbasin allowing a minimum<br />
twenty-year life <strong>of</strong> such basin or subbasin.<br />
Mesotrophic: a surface water quality<br />
characterization, or “trophic status,” describing<br />
those lakes with moderate primary productivity<br />
and moderate nutrient levels.<br />
Million gallons per day (mgd): a rate <strong>of</strong> flow<br />
equal to 1.54723 cubic feet per second or 3.0689<br />
acre-feet per day.<br />
Minor groundwater basin: a distinct<br />
underground body <strong>of</strong> water overlain by<br />
contiguous land and having substantially the<br />
same geological and hydrological characteristics<br />
and which is not a major groundwater basin.<br />
Nitrogen limited: in reference to water<br />
chemistry, where growth or amount <strong>of</strong><br />
primary producers (e.g., algae) is restricted in a<br />
waterbody due in large part to available nitrogen.<br />
Non-consumptive use: use <strong>of</strong> water in<br />
a manner that does not reduce the amount<br />
<strong>of</strong> supply, such as navigation, hydropower<br />
production, protection <strong>of</strong> habitat for hunting,<br />
maintaining water levels for boating recreation,<br />
or maintaining flow, level and/or temperature for<br />
fishing, swimming, habitat, etc.<br />
Non-delineated groundwater source:<br />
an area where no major or minor aquifer has<br />
been studied that may or may not supply a<br />
well yield; also referred to as a “non-delineated<br />
minor aquifer.”<br />
<strong>Oklahoma</strong> Comprehensive <strong>Water</strong> Plan<br />
<strong>Lower</strong> <strong>Washita</strong> Regional Report 101
Nonpoint source (NPS): a source <strong>of</strong><br />
pollution without a well-defined point <strong>of</strong> origin.<br />
Nonpoint source pollution is commonly caused<br />
by sediment, nutrients, and organic or toxic<br />
substances originating from land use activities.<br />
It occurs when the rate <strong>of</strong> material entering a<br />
waterbody exceeds its natural level.<br />
Normal pool elevation: the target lake<br />
elevation at which a reservoir was designed to<br />
impound water to create a dependable water<br />
supply; sometimes referred to as the top <strong>of</strong> the<br />
conservation pool.<br />
Normal pool storage: volume <strong>of</strong> water held in<br />
a reservoir when it is at normal pool elevation.<br />
Numerical criteria: concentrations or other<br />
quantitative measures <strong>of</strong> chemical, physical or<br />
biological parameters that are assigned to protect<br />
the beneficial use <strong>of</strong> a waterbody.<br />
Numerical standard: the most stringent <strong>of</strong><br />
the OWQS numerical criteria assigned to the<br />
beneficial uses for a given stream.<br />
Nutrient-impaired reservoir: reservoir with<br />
a beneficial use or uses impaired by humaninduced<br />
eutrophication as determined by a<br />
Nutrient-Limited <strong>Water</strong>shed Impairment Study.<br />
Nutrient-Limited <strong>Water</strong>shed (NLW):<br />
watershed <strong>of</strong> a waterbody with a designated<br />
beneficial use that is adversely affected by excess<br />
nutrients as determined by a Carlson’s Trophic<br />
<strong>State</strong> Index (using chlorophyll-a) <strong>of</strong> 62 or greater,<br />
or is otherwise listed as “NLW” in Appendix A <strong>of</strong><br />
the OWQS.<br />
Nutrients: elements or compounds essential<br />
as raw materials for an organism’s growth and<br />
development; these include carbon, oxygen,<br />
nitrogen, and phosphorus.<br />
<strong>Oklahoma</strong> <strong>Water</strong> Quality Standards<br />
(OWQS): rules promulgated by the OWRB<br />
in <strong>Oklahoma</strong> Administrative Code Title 785,<br />
Chapter 45, which establish classifications <strong>of</strong><br />
uses <strong>of</strong> waters <strong>of</strong> the state, criteria to maintain<br />
and protect such classifications, and other<br />
standards or policies pertaining to the quality <strong>of</strong><br />
such waters.<br />
Oligotrophic: a surface water quality<br />
characterization, or “trophic status,” describing<br />
those lakes with low primary productivity and/or<br />
low nutrient levels.<br />
Outfall: a point source that contains the effluent<br />
being discharged to the receiving water.<br />
Percolation: the movement <strong>of</strong> water through<br />
unsaturated subsurface soil layers, usually<br />
continuing downward to the groundwater or<br />
water table (distinguished from Seepage).<br />
Permit availability: the amount <strong>of</strong> water that<br />
could be made available for withdrawals under<br />
permits issued in accordance with <strong>Oklahoma</strong><br />
water law.<br />
pH: the measurement <strong>of</strong> the hydrogen-ion<br />
concentration in water. A pH below 7 is acidic<br />
(the lower the number, the more acidic the water,<br />
with a decrease <strong>of</strong> one full unit representing an<br />
increase in acidity <strong>of</strong> ten times) and a pH above<br />
7 (to a maximum <strong>of</strong> 14) is basic (the higher the<br />
number, the more basic the water). In <strong>Oklahoma</strong>,<br />
fresh waters typically exhibit a pH range from 5.5<br />
in the southeast to almost 9.0 in central areas.<br />
Phosphorus limited: in reference to water<br />
chemistry, where growth or amount <strong>of</strong><br />
primary producers (e.g., algae) is restricted in<br />
a waterbody due in large part to the amount <strong>of</strong><br />
available phosphorus.<br />
Physical water availability: amount <strong>of</strong> water<br />
currently in streams, rivers, lakes, reservoirs, and<br />
aquifers; sometimes referred to as “wet water.”<br />
Point source: any discernible, confined and<br />
discrete conveyance, including any pipe, ditch,<br />
channel, tunnel, well, discrete fissure, container,<br />
rolling stock or concentrated animal feeding<br />
operation from which pollutants are or may be<br />
discharged. This term does not include return<br />
flows from irrigation agriculture.<br />
Potable: describing water suitable for drinking.<br />
Primary Body Contact Recreation (PBCR):<br />
a classification in OWQS <strong>of</strong> a waterbody’s<br />
use; involves direct body contact with the<br />
water where a possibility <strong>of</strong> ingestion exists.<br />
In these cases, the water shall not contain<br />
chemical, physical or biological substances in<br />
concentrations that irritate the skin or sense<br />
organs or are toxic or cause illness upon ingestion<br />
by human beings.<br />
Primary productivity: the production <strong>of</strong><br />
chemical energy in organic compounds by living<br />
organisms. In lakes and streams, this is essentially<br />
the lowest denominator <strong>of</strong> the food chain<br />
(phytoplankton) bringing energy into the system<br />
via photosynthesis.<br />
Prior groundwater right: comparable to a<br />
permit, a right to use groundwater recognized<br />
by the OWRB as having been established by<br />
compliance with state groundwater laws in effect<br />
prior to 1973.<br />
Provider: private or public entity that supplies<br />
water to end users or other providers. For OCWP<br />
analyses, “public water providers” included<br />
approximately 785 non-pr<strong>of</strong>it, local governmental<br />
municipal or community water systems and rural<br />
water districts.<br />
Recharge: the inflow <strong>of</strong> water to an alluvial or<br />
bedrock aquifer.<br />
Reservoir: a surface depression containing<br />
water impounded by a dam.<br />
Return water or return flow: the portion <strong>of</strong><br />
water diverted from a water supply that returns<br />
to a watercourse.<br />
Reverse osmosis: a process that removes<br />
salts and other substances from water. Pressure<br />
is placed on the stronger <strong>of</strong> two unequal<br />
concentrations separated by a semi-permeable<br />
membrane; a common method <strong>of</strong> desalination.<br />
Riparian water right (riparian right): the<br />
right <strong>of</strong> an owner <strong>of</strong> land adjoining a stream or<br />
watercourse to use water from that stream for<br />
reasonable purposes.<br />
Riverine: relating to, formed by, or resembling a<br />
river (including tributaries), stream, etc.<br />
Salinity: the concentration <strong>of</strong> salt in water<br />
measured in milligrams per liter (mg/L) or parts<br />
per million (ppm).<br />
Salt water: any water containing more than<br />
five thousand (5,000) parts per million total<br />
dissolved solids.<br />
Saturated thickness: thickness below the<br />
zone <strong>of</strong> the water table in which the interstices<br />
are filled with groundwater.<br />
Scenic Rivers: streams in “Scenic River”<br />
areas designated by the <strong>Oklahoma</strong> Legislature<br />
that possess unique natural scenic beauty,<br />
water conservation, fish, wildlife and outdoor<br />
recreational values. These areas are listed and<br />
described in Title 82 <strong>of</strong> <strong>Oklahoma</strong> Statutes,<br />
Section 1451.<br />
Sediment: particles transported and<br />
deposited by water deriving from rocks, soil,<br />
or biological material.<br />
Seepage: the movement <strong>of</strong> water through<br />
saturated material <strong>of</strong>ten indicated by the<br />
appearance or disappearance <strong>of</strong> water at the<br />
ground surface, as in the loss <strong>of</strong> water from a<br />
reservoir through an earthen dam (distinguished<br />
from Percolation).<br />
Sensitive sole source groundwater basin<br />
or subbasin: a major groundwater basin or<br />
subbasin all or a portion <strong>of</strong> which has been<br />
designated by the U.S. Environmental Protection<br />
Agency (EPA) as a “Sole Source Aquifer” and<br />
serves as a mechanism to protect drinking<br />
water supplies in areas with limited water<br />
supply alternatives. It includes any portion <strong>of</strong> a<br />
contiguous aquifer located within five miles <strong>of</strong><br />
the known areal extent <strong>of</strong> the surface outcrop <strong>of</strong><br />
the designated groundwater basin or subbasin.<br />
Sensitive <strong>Water</strong> Supplies (SWS):<br />
designation that applies to public and private<br />
water supplies possessing conditions that make<br />
them more susceptible to pollution events. This<br />
102 <strong>Lower</strong> <strong>Washita</strong> Regional Report <strong>Oklahoma</strong> Comprehensive <strong>Water</strong> Plan
designation restricts point source discharges<br />
in the watershed and institutes a 10 µg/L<br />
(micrograms per liter) chlorophyll-a criterion<br />
to protect against taste and odor problems and<br />
reduce water treatment costs.<br />
S<strong>of</strong>t water: water that contains little to no<br />
magnesium or calcium salts.<br />
<strong>State</strong> Revolving Fund (SRF): fund or<br />
program used to provide loans to eligible<br />
entities for qualified projects in accordance with<br />
Federal law, rules and guidelines administered<br />
by the EPA and state. Two separate SRF<br />
programs are administered in <strong>Oklahoma</strong>: the<br />
Clean <strong>Water</strong> SRF is intended to control water<br />
pollution and is administered by OWRB; the<br />
Drinking <strong>Water</strong> SRF was created to provide safe<br />
drinking water and is administered jointly by<br />
the OWRB and ODEQ.<br />
Storm sewer: a sewer specifically designed to<br />
control and convey stormwater, surface run<strong>of</strong>f,<br />
and related drainage.<br />
Stream system: drainage area <strong>of</strong> a watercourse<br />
or series <strong>of</strong> watercourses that converges in a large<br />
watercourse with defined boundaries.<br />
Stream water: water in a definite stream that<br />
includes water in ponds, lakes, reservoirs, and<br />
playa lakes.<br />
Streamflow: the rate <strong>of</strong> water discharged from<br />
a source indicated in volume with respect to time.<br />
Surface water: water in streams and<br />
waterbodies as well as diffused over the land<br />
surface.<br />
Surface water basin: geographic area drained<br />
by a single stream system. For OCWP analysis,<br />
<strong>Oklahoma</strong> has been divided into 82 surface water<br />
basins (also referenced as “planning basins”).<br />
Temporary permit: for groundwater basins<br />
or subbasins for which a maximum annual<br />
yield has not been determined, temporary<br />
permits are granted to users allocating two<br />
acre-feet <strong>of</strong> water per acre <strong>of</strong> land per year.<br />
Temporary permits are for one-year terms that<br />
can be revalidated annually by the permittee.<br />
When the maximum annual yield and equal<br />
proportionate share are approved by the OWRB,<br />
all temporary permits overlying the studied<br />
basin are converted to regular permits at the<br />
new approved allocation amount.<br />
Terrace deposits: fluvial or wind-blown<br />
deposits occurring along the margin and above<br />
the level <strong>of</strong> a body <strong>of</strong> water and representing the<br />
former floodplain <strong>of</strong> a stream or river.<br />
Total dissolved solids (TDS): a measure <strong>of</strong><br />
the amount <strong>of</strong> dissolved material in the water<br />
column, reported in mg/L, with values in fresh<br />
water naturally ranging from 0-1000 mg/L. High<br />
concentrations <strong>of</strong> TDS limit the suitability <strong>of</strong><br />
water as a drinking and livestock watering source<br />
as well as irrigation supply.<br />
Total maximum daily load (TMDL): sum<br />
<strong>of</strong> individual wasteload allocations for point<br />
sources, safety reserves, and loads from nonpoint<br />
source and natural backgrounds.<br />
Total nitrogen: for water quality analysis, a<br />
measure <strong>of</strong> all forms <strong>of</strong> nitrogen (organic and<br />
inorganic). Excess nitrogen can lead to harmful<br />
algae blooms, hypoxia, and declines in wildlife<br />
and habitat.<br />
Total phosphorus: for water quality<br />
analysis, a measure <strong>of</strong> all forms <strong>of</strong> phosphorus,<br />
<strong>of</strong>ten used as an indicator <strong>of</strong> eutrophication<br />
and excessive productivity.<br />
Transmissivity: measure <strong>of</strong> how much water<br />
can be transmitted horizontally through<br />
an aquifer. Transmissivity is the product <strong>of</strong><br />
hydraulic conductivity <strong>of</strong> the rock and saturated<br />
thickness <strong>of</strong> the aquifer.<br />
Tributary: stream or other body <strong>of</strong> water, surface<br />
or underground, that contributes to another<br />
larger stream or body <strong>of</strong> water.<br />
Trophic <strong>State</strong> Index (TSI): one <strong>of</strong> the most<br />
commonly used measurements to compare lake<br />
trophic status, based on algal biomass. Carlson’s<br />
TSI uses chlorophyll-a concentrations to define<br />
the level <strong>of</strong> eutrophication on a scale <strong>of</strong> 1 to 100,<br />
thus indicating the general biological condition <strong>of</strong><br />
the waterbody.<br />
Trophic status: a lake’s trophic state,<br />
essentially a measure <strong>of</strong> its biological<br />
productivity. The various trophic status levels<br />
(Oligotrophic, Mesotrophic, Eutrophic, and<br />
Hypereutrophic) provide a relative measure <strong>of</strong><br />
overall water quality conditions in a lake.<br />
Turbidity: a combination <strong>of</strong> suspended and<br />
colloidal materials (e.g., silt, clay, or plankton)<br />
that reduce the transmission <strong>of</strong> light through<br />
scattering or absorption. Turbidity values are<br />
generally reported in Nephelometric Turbidity<br />
Units (NTUs).<br />
Vested stream water right (vested right):<br />
comparable to a permit, a right to use stream<br />
water recognized by the OWRB as having been<br />
established by compliance with state stream<br />
water laws in effect prior to 1963.<br />
Waste by depletion: unauthorized use <strong>of</strong> wells<br />
or groundwater; drilling a well, taking, or using<br />
fresh groundwater without a permit, except for<br />
domestic use; taking more fresh groundwater<br />
than is authorized by permit; taking or using<br />
fresh groundwater so that the water is lost for<br />
beneficial use; transporting fresh groundwater<br />
from a well to the place <strong>of</strong> use in such a manner<br />
that there is an excessive loss in transit; allowing<br />
fresh groundwater to reach a pervious stratum<br />
and be lost into cavernous or otherwise pervious<br />
materials encountered in a well; drilling wells and<br />
producing fresh groundwater there from except<br />
in accordance with well spacing requirements; or<br />
using fresh groundwater for air conditioning or<br />
cooling purposes without providing facilities to<br />
aerate and reuse such water.<br />
Waste by pollution: permitting or causing the<br />
pollution <strong>of</strong> a fresh water strata or basin through<br />
any act that will permit fresh groundwater<br />
polluted by minerals or other waste to filter or<br />
intrude into a basin or subbasin, or failure to<br />
properly plug abandoned fresh water wells.<br />
<strong>Water</strong> quality: physical, chemical, and<br />
biological characteristics <strong>of</strong> water that determine<br />
diversity, stability, and productivity <strong>of</strong> the climax<br />
biotic community or affect human health.<br />
<strong>Water</strong> right: right to the use <strong>of</strong> stream or<br />
groundwater for beneficial use reflected by<br />
permits or vested rights for stream water or<br />
permits or prior rights for groundwater.<br />
Wastewater reuse: treated municipal and<br />
industrial wastewater captured and reused<br />
commonly for non-potable irrigation and<br />
industrial applications to reduce demand upon<br />
potable water systems.<br />
<strong>Water</strong> supply: a body <strong>of</strong> water, whether<br />
static or moving on or under the surface <strong>of</strong> the<br />
ground, or in a man-made reservoir, available for<br />
beneficial use on a dependable basis.<br />
<strong>Water</strong> supply availability: for OCWP<br />
analysis, the consideration <strong>of</strong> whether or not<br />
water is available that meets three necessary<br />
requirements: physical water is present, the<br />
water is <strong>of</strong> a usable quality, and a water right<br />
or permit to use the water has been or can be<br />
obtained.<br />
<strong>Water</strong> supply options: alternatives that a<br />
basin or region may implement to meet changing<br />
water demands. For OCWP analysis, “primary<br />
options“ include demand management, use <strong>of</strong><br />
out-<strong>of</strong>-basin supplies, reservoir use, increasing<br />
reliance on surface water, and increasing reliance<br />
on groundwater; “expanded options” include<br />
expanding conservation measures, artificial<br />
aquifer recharge, use <strong>of</strong> marginal quality water<br />
sources, and potential reservoir development.<br />
<strong>Water</strong> table: The upper surface <strong>of</strong> a zone <strong>of</strong><br />
saturation; the upper surface <strong>of</strong> the groundwater.<br />
<strong>Water</strong>body: any specified segment or body <strong>of</strong><br />
waters <strong>of</strong> the state, including but not limited to<br />
an entire stream or lake or a portion there<strong>of</strong>.<br />
<strong>Water</strong>course: the channel or area that conveys<br />
a flow <strong>of</strong> water.<br />
<strong>Oklahoma</strong> Comprehensive <strong>Water</strong> Plan<br />
<strong>Lower</strong> <strong>Washita</strong> Regional Report 103
<strong>Water</strong>s <strong>of</strong> the state: all streams, lakes, ponds,<br />
marshes, watercourses, waterways, wells,<br />
springs, irrigation systems, drainage systems, and<br />
other bodies or accumulations <strong>of</strong> water, surface<br />
and underground, natural or artificial, public<br />
or private, which are contained within, flow<br />
through, or border upon the state.<br />
<strong>Water</strong>shed: the boundaries <strong>of</strong> a drainage area<br />
<strong>of</strong> a watercourse or series <strong>of</strong> watercourses that<br />
diverge above a designated location or diversion<br />
point determined by the OWRB.<br />
Well: any type <strong>of</strong> excavation for the purpose <strong>of</strong><br />
obtaining groundwater or to monitor or observe<br />
conditions under the surface <strong>of</strong> the earth; does<br />
not include oil and gas wells.<br />
Well yield: amount <strong>of</strong> water that a water<br />
supply well can produce (usually in gpm), which<br />
generally depends on the geologic formation and<br />
well construction.<br />
Wholesale: for purposes <strong>of</strong> OCWP Public<br />
<strong>Water</strong> Provider analyses, water sold from one<br />
public water provider to another.<br />
Withdrawal: water removed from a supply source.<br />
104 <strong>Lower</strong> <strong>Washita</strong> Regional Report <strong>Oklahoma</strong> Comprehensive <strong>Water</strong> Plan
AF: acre-foot or acre-feet<br />
AFD: acre-feet per day<br />
AFY: acre-feet per year<br />
BMPs: best management practices<br />
BOD: biochemical oxygen demand<br />
cfs: cubic feet per second<br />
CWAC: Cool <strong>Water</strong> Aquatic Community<br />
CWSRF: Clean <strong>Water</strong> <strong>State</strong> Revolving Fund<br />
DO: dissolved oxygen<br />
DWSRF: Drinking <strong>Water</strong> <strong>State</strong> Revolving Fund<br />
EPS: equal proportionate share<br />
FACT: Funding Agency Coordinating Team<br />
gpm: gallons per minute<br />
HLAC: Habitat Limited Aquatic Community<br />
HQW: High Quality <strong>Water</strong>s<br />
NRCS: Natural <strong>Resources</strong> Conservation Service<br />
NTU: Nephelometric Turbidity Unit (see<br />
“Turbidity”)<br />
OCWP: <strong>Oklahoma</strong> Comprehensive <strong>Water</strong> Plan<br />
ODEQ: <strong>Oklahoma</strong> Department <strong>of</strong><br />
Environmental Quality<br />
O&G: Oil and Gas<br />
ORW: Outstanding Resource <strong>Water</strong><br />
OWQS: <strong>Oklahoma</strong> <strong>Water</strong> Quality Standards<br />
OWRB: <strong>Oklahoma</strong> <strong>Water</strong> <strong>Resources</strong> <strong>Board</strong><br />
PBCR: Primary Body Contact Recreation<br />
pH: hydrogen ion activity<br />
ppm: parts per million<br />
RD: Rural Development<br />
REAP: Rural Economic Action Plan<br />
SBCR: Secondary Body Contact Recreation<br />
USACE: United <strong>State</strong>s Army Corps <strong>of</strong> Engineers<br />
USEPA: United <strong>State</strong>s Environmental<br />
Protection Agency<br />
USGS: United <strong>State</strong>s Geological Survey<br />
WLA: wasteload allocation<br />
WWAC: Warm <strong>Water</strong> Aquatic Community<br />
<strong>Water</strong> Quantity Conversion Factors<br />
HUC: hydrologic unit code<br />
M&I: municipal and industrial<br />
MAY: maximum annual yield<br />
mgd: million gallons per day<br />
μS/cm: microsiemens per centimeter (see<br />
specific conductivity)<br />
SDWIS: Safe Drinking <strong>Water</strong> Information<br />
System<br />
SRF: <strong>State</strong> Revolving Fund<br />
SSI: Self-Supplied Industrial<br />
SSR: Self-Supplied Residential<br />
SWS: Sensitive <strong>Water</strong> Supply<br />
Initial Unit<br />
Desired Unit<br />
CFS GPM MGD AFY AFD<br />
CFS ----- 450 .646 724 1.98<br />
GPM .00222 ----- .00144 1.61 .00442<br />
MGD 1.55 695 ----- 1120 3.07<br />
AFY .0014 .62 .00089 ----- .00274<br />
mg/L: milligrams per liter<br />
TDS: total dissolved solids<br />
AFD .504 226 .326 365 -----<br />
NLW: nutrient-limited watershed<br />
NPS: nonpoint source<br />
TMDL: total maximum daily load<br />
TSI: Trophic <strong>State</strong> Index<br />
EXAMPLE: Converting from MGD to CFS. To convert from an initial value <strong>of</strong> 140 MGD to CFS, multiply<br />
140 times 1.55 to come up with the desired conversion, which would be 217 CFS (140 X 1.55 = 217).<br />
NPDES: National Pollutant Discharge<br />
Elimination System<br />
TSS: total suspended solids<br />
CFS: cubic feet per second<br />
GPM: gallons per minute<br />
MGD: millions gallons per day<br />
AFY: acre-feet per year<br />
AFD: acre-feet per day<br />
1 acre-foot: 325,851 gallons<br />
<strong>Oklahoma</strong> Comprehensive <strong>Water</strong> Plan<br />
<strong>Lower</strong> <strong>Washita</strong> Regional Report 105
Sources<br />
AMEC Earth & Environmental. (2011). Climate Impacts to Streamflow. Commissioned by the <strong>Oklahoma</strong><br />
<strong>Water</strong> <strong>Resources</strong> <strong>Board</strong> as a supplement to the 2012 Update <strong>of</strong> the <strong>Oklahoma</strong> Comprehensive <strong>Water</strong> Plan.<br />
Available online at http://www.owrb.ok.gov/ocwp (October 2011).<br />
CDM. (2009). Programmatic Work Plan. Published through a cooperative agreement with the <strong>Oklahoma</strong><br />
<strong>Water</strong> <strong>Resources</strong> <strong>Board</strong> and U.S. Army Corps <strong>of</strong> Engineers as a supplement to the 2012 Update <strong>of</strong><br />
the <strong>Oklahoma</strong> Comprehensive <strong>Water</strong> Plan. Available online at http://www.owrb.ok.gov/ocwp (October<br />
2011).<br />
CDM. (2009). Provider Survey Summary Report. Published through a cooperative agreement with the<br />
<strong>Oklahoma</strong> <strong>Water</strong> <strong>Resources</strong> <strong>Board</strong> and U.S. Army Corps <strong>of</strong> Engineers as a supplement to the 2012<br />
Update <strong>of</strong> the <strong>Oklahoma</strong> Comprehensive <strong>Water</strong> Plan. Available online at http://www.owrb.ok.gov/ocwp<br />
(October 2011).<br />
CDM. (2010). Artificial Aquifer Recharge Issues and Recommendations. Data and technical input provided<br />
by the OCWP Artificial Aquifer Recharge Workgroup. Commissioned by the <strong>Oklahoma</strong> <strong>State</strong><br />
Legislature in 2008 and published through an agreement with the <strong>Oklahoma</strong> <strong>Water</strong> <strong>Resources</strong><br />
<strong>Board</strong> as a supplement to the 2012 Update <strong>of</strong> the <strong>Oklahoma</strong> Comprehensive <strong>Water</strong> Plan. Available online at<br />
http://www.owrb.ok.gov/ocwp (October 2011).<br />
CDM. (2010). Conjunctive <strong>Water</strong> Management in <strong>Oklahoma</strong> and Other <strong>State</strong>s. Published through a cooperative<br />
agreement with the <strong>Oklahoma</strong> <strong>Water</strong> <strong>Resources</strong> <strong>Board</strong> and U.S. Army Corps <strong>of</strong> Engineers as a<br />
supplement to the 2012 Update <strong>of</strong> the <strong>Oklahoma</strong> Comprehensive <strong>Water</strong> Plan. Available online at http://<br />
www.owrb.ok.gov/ocwp (October 2011).<br />
CDM. (2010). Marginal Quality <strong>Water</strong> Issues and Recommendations. Data and technical input provided by the<br />
OCWP Marginal Quality <strong>Water</strong> Workgroup. Commissioned by the <strong>Oklahoma</strong> <strong>State</strong> Legislature<br />
in 2008 and published through an agreement with the <strong>Oklahoma</strong> <strong>Water</strong> <strong>Resources</strong> <strong>Board</strong> as a<br />
supplement to the 2012 Update <strong>of</strong> the <strong>Oklahoma</strong> Comprehensive <strong>Water</strong> Plan. Available online at http://<br />
www.owrb.ok.gov/ocwp (October 2011).<br />
CDM. (2011). Conservation and Climate Change (<strong>Water</strong> Demand Addendum). Published through a cooperative<br />
agreement with the <strong>Oklahoma</strong> <strong>Water</strong> <strong>Resources</strong> <strong>Board</strong> and U.S. Army Corps <strong>of</strong> Engineers as a<br />
supplement to the 2012 Update <strong>of</strong> the <strong>Oklahoma</strong> Comprehensive <strong>Water</strong> Plan. Available online at http://<br />
www.owrb.ok.gov/ocwp (October 2011).<br />
CDM. (2011). Drinking <strong>Water</strong> Infrastructure Needs Assessment by Region. Published through a cooperative<br />
agreement with the <strong>Oklahoma</strong> <strong>Water</strong> <strong>Resources</strong> <strong>Board</strong> and U.S. Army Corps <strong>of</strong> Engineers as a<br />
supplement to the 2012 Update <strong>of</strong> the <strong>Oklahoma</strong> Comprehensive <strong>Water</strong> Plan. Available online at http://<br />
www.owrb.ok.gov/ocwp (October 2011).<br />
CDM. (2011). <strong>Water</strong> Demand Forecast Report. Published through a cooperative agreement with the<br />
<strong>Oklahoma</strong> <strong>Water</strong> <strong>Resources</strong> <strong>Board</strong> and U.S. Army Corps <strong>of</strong> Engineers as a supplement to the 2012<br />
Update <strong>of</strong> the <strong>Oklahoma</strong> Comprehensive <strong>Water</strong> Plan. Available online at http://www.owrb.ok.gov/ocwp<br />
(October 2011).<br />
CDM. (2011). <strong>Water</strong> Supply Hot Spot Report. Published through a cooperative agreement with the<br />
<strong>Oklahoma</strong> <strong>Water</strong> <strong>Resources</strong> <strong>Board</strong> and U.S. Army Corps <strong>of</strong> Engineers as a supplement to the 2012<br />
Update <strong>of</strong> the <strong>Oklahoma</strong> Comprehensive <strong>Water</strong> Plan. Available online at http://www.owrb.ok.gov/ocwp<br />
(October 2011).<br />
CDM. (2011). <strong>Water</strong> Supply Permit Availability Report. Published through a cooperative agreement with the<br />
<strong>Oklahoma</strong> <strong>Water</strong> <strong>Resources</strong> <strong>Board</strong> and U.S. Army Corps <strong>of</strong> Engineers as a supplement to the 2012<br />
Update <strong>of</strong> the <strong>Oklahoma</strong> Comprehensive <strong>Water</strong> Plan. Available online at http://www.owrb.ok.gov/ocwp<br />
(October 2011).<br />
C.H. Guernsey & Company. (2010). Reservoir Viability Study. Commissioned by the <strong>Oklahoma</strong> <strong>Water</strong><br />
<strong>Resources</strong> <strong>Board</strong> as a supplement to the 2012 Update <strong>of</strong> the <strong>Oklahoma</strong> Comprehensive <strong>Water</strong> Plan.<br />
Available online at http://www.owrb.ok.gov/ocwp (October 2011).<br />
C.H. Guernsey & Company. (2011). <strong>Water</strong> Conveyance Study. Commissioned by the <strong>Oklahoma</strong> <strong>Water</strong><br />
<strong>Resources</strong> <strong>Board</strong> as a supplement to the 2012 Update <strong>of</strong> the <strong>Oklahoma</strong> Comprehensive <strong>Water</strong> Plan.<br />
Available online at http://www.owrb.ok.gov/ocwp (October 2011).<br />
FirstSouthwest Bank. (2011). Infrastructure Financing Needs and Opportunities. Commissioned by the<br />
<strong>Oklahoma</strong> <strong>Water</strong> <strong>Resources</strong> <strong>Board</strong> as a supplement to the 2012 Update <strong>of</strong> the <strong>Oklahoma</strong> Comprehensive<br />
<strong>Water</strong> Plan. Available online at http://www.owrb.ok.gov/ocwp (October 2011).<br />
INTERA. (2011). Instream Flow Issues and Recommendations. Data and technical input provided by the<br />
OCWP Instream Flow Workgroup. Published through an agreement with the <strong>Oklahoma</strong> <strong>Water</strong><br />
<strong>Resources</strong> <strong>Board</strong> as a supplement to the 2012 Update <strong>of</strong> the <strong>Oklahoma</strong> Comprehensive <strong>Water</strong> Plan.<br />
Available online at http://www.owrb.ok.gov/ocwp (October 2011).<br />
<strong>Oklahoma</strong> Climatological Survey. (2010). Climate Issues and Recommendations. Published through an<br />
agreement with the <strong>Oklahoma</strong> <strong>Water</strong> <strong>Resources</strong> <strong>Board</strong> as a supplement to the 2012 Update <strong>of</strong> the<br />
<strong>Oklahoma</strong> Comprehensive <strong>Water</strong> Plan. Available online at http://www.owrb.ok.gov/ocwp (October<br />
2011).<br />
<strong>Oklahoma</strong> Department <strong>of</strong> Environmental Quality. (2008). Integrated <strong>Water</strong> Quality Assessment Report.<br />
Published by the <strong>Oklahoma</strong> Department <strong>of</strong> Environmental Quality. Available online at http://<br />
www.deq.state.ok.us/wqdnew/305b_303d/ (October 2011).<br />
CDM. (2011). Physical <strong>Water</strong> Supply Availability Report. Published through a cooperative agreement with the<br />
<strong>Oklahoma</strong> <strong>Water</strong> <strong>Resources</strong> <strong>Board</strong> and U.S. Army Corps <strong>of</strong> Engineers as a supplement to the 2012<br />
Update <strong>of</strong> the <strong>Oklahoma</strong> Comprehensive <strong>Water</strong> Plan. Available online at http://www.owrb.ok.gov/ocwp<br />
(October 2011).<br />
CDM. (2011). Public <strong>Water</strong> Supply Planning Guide. Published through a cooperative agreement with the<br />
<strong>Oklahoma</strong> <strong>Water</strong> <strong>Resources</strong> <strong>Board</strong> and U.S. Army Corps <strong>of</strong> Engineers as a supplement to the 2012<br />
Update <strong>of</strong> the <strong>Oklahoma</strong> Comprehensive <strong>Water</strong> Plan. Available online at http://www.owrb.ok.gov/ocwp<br />
(October 2011).<br />
<strong>Oklahoma</strong> <strong>State</strong> University Division <strong>of</strong> Agriculture Sciences and Natural <strong>Resources</strong> (DASNR). (2011).<br />
Agricultural <strong>Water</strong> Issues and Recommendations. Commissioned by the <strong>Oklahoma</strong> <strong>Water</strong> <strong>Resources</strong><br />
<strong>Board</strong> and the <strong>Oklahoma</strong> Department <strong>of</strong> Agriculture Food and Forestry as a supplement to the 2012<br />
Update <strong>of</strong> the <strong>Oklahoma</strong> Comprehensive <strong>Water</strong> Plan. Available online at http://www.owrb.ok.gov/ocwp<br />
(October 2011).<br />
<strong>Oklahoma</strong> <strong>Water</strong> <strong>Resources</strong> <strong>Board</strong>. (1980). 1980 Update <strong>of</strong> the <strong>Oklahoma</strong> Comprehensive <strong>Water</strong> Plan. Published<br />
by the <strong>Oklahoma</strong> <strong>Water</strong> <strong>Resources</strong> <strong>Board</strong>. Available online at http://www.owrb.ok.gov/ocwp<br />
(October 2011).<br />
106 <strong>Lower</strong> <strong>Washita</strong> Regional Report <strong>Oklahoma</strong> Comprehensive <strong>Water</strong> Plan
<strong>Oklahoma</strong> <strong>Water</strong> <strong>Resources</strong> <strong>Board</strong>. (1995). 1995 Update <strong>of</strong> the <strong>Oklahoma</strong> Comprehensive <strong>Water</strong> Plan. Published<br />
by the <strong>Oklahoma</strong> <strong>Water</strong> <strong>Resources</strong> <strong>Board</strong>. Available online at http://www.owrb.ok.gov/ocwp<br />
(October 2011).<br />
<strong>Oklahoma</strong> <strong>Water</strong> <strong>Resources</strong> <strong>Board</strong>. (2007). <strong>Oklahoma</strong> <strong>Water</strong> Atlas. Published by the <strong>Oklahoma</strong> <strong>Water</strong><br />
<strong>Resources</strong> <strong>Board</strong>.<br />
<strong>Oklahoma</strong> <strong>Water</strong> <strong>Resources</strong> <strong>Board</strong>. (2011). 2012 OCWP Executive Report. Published by the <strong>Oklahoma</strong><br />
<strong>Water</strong> <strong>Resources</strong> <strong>Board</strong> under the authority <strong>of</strong> the <strong>Oklahoma</strong> <strong>State</strong> Legislature as the principal<br />
report for the <strong>of</strong>ficial update <strong>of</strong> the <strong>Oklahoma</strong> Comprehensive <strong>Water</strong> Plan. Available online at<br />
http://www.owrb.ok.gov/ocwp (October 2011).<br />
<strong>Oklahoma</strong> <strong>Water</strong> <strong>Resources</strong> <strong>Board</strong>. (2011). Beaver-Cache <strong>Water</strong>shed Planning Region Report. Published by<br />
the <strong>Oklahoma</strong> <strong>Water</strong> <strong>Resources</strong> <strong>Board</strong> under the authority <strong>of</strong> the <strong>Oklahoma</strong> <strong>State</strong> Legislature as<br />
an ancillary report for the <strong>of</strong>ficial update <strong>of</strong> the <strong>Oklahoma</strong> Comprehensive <strong>Water</strong> Plan. Available<br />
online at http://www.owrb.ok.gov/ocwp (October 2011).<br />
<strong>Oklahoma</strong> <strong>Water</strong> <strong>Resources</strong> <strong>Board</strong>. (2009). Beneficial Use Monitoring Program Report. Published by<br />
the <strong>Oklahoma</strong> <strong>Water</strong> <strong>Resources</strong> <strong>Board</strong>. Available online at http://www.owrb.ok.gov/quality/<br />
monitoring/bump.php (October 2011).<br />
<strong>Oklahoma</strong> <strong>Water</strong> <strong>Resources</strong> <strong>Board</strong>. (2011). Blue-Boggy <strong>Water</strong>shed Planning Region Report. Published by the<br />
<strong>Oklahoma</strong> <strong>Water</strong> <strong>Resources</strong> <strong>Board</strong> under the authority <strong>of</strong> the <strong>Oklahoma</strong> <strong>State</strong> Legislature as an<br />
ancillary report for the <strong>of</strong>ficial update <strong>of</strong> the <strong>Oklahoma</strong> Comprehensive <strong>Water</strong> Plan. Available<br />
online at http://www.owrb.ok.gov/ocwp (October 2011).<br />
<strong>Oklahoma</strong> <strong>Water</strong> <strong>Resources</strong> <strong>Board</strong>. (2011). Central <strong>Water</strong>shed Planning Region Report. Published by the<br />
<strong>Oklahoma</strong> <strong>Water</strong> <strong>Resources</strong> <strong>Board</strong> under the authority <strong>of</strong> the <strong>Oklahoma</strong> <strong>State</strong> Legislature as an<br />
ancillary report for the <strong>of</strong>ficial update <strong>of</strong> the <strong>Oklahoma</strong> Comprehensive <strong>Water</strong> Plan. Available<br />
online at http://www.owrb.ok.gov/ocwp (October 2011).<br />
<strong>Oklahoma</strong> <strong>Water</strong> <strong>Resources</strong> <strong>Board</strong>. (2011). Eufaula <strong>Water</strong>shed Planning Region Report. Published by the<br />
<strong>Oklahoma</strong> <strong>Water</strong> <strong>Resources</strong> <strong>Board</strong> under the authority <strong>of</strong> the <strong>Oklahoma</strong> <strong>State</strong> Legislature as an<br />
ancillary report for the <strong>of</strong>ficial update <strong>of</strong> the <strong>Oklahoma</strong> Comprehensive <strong>Water</strong> Plan. Available<br />
online at http://www.owrb.ok.gov/ocwp (October 2011).<br />
<strong>Oklahoma</strong> <strong>Water</strong> <strong>Resources</strong> <strong>Board</strong>. (2011). Grand <strong>Water</strong>shed Planning Region Report. Published by the<br />
<strong>Oklahoma</strong> <strong>Water</strong> <strong>Resources</strong> <strong>Board</strong> under the authority <strong>of</strong> the <strong>Oklahoma</strong> <strong>State</strong> Legislature as an<br />
ancillary report for the <strong>of</strong>ficial update <strong>of</strong> the <strong>Oklahoma</strong> Comprehensive <strong>Water</strong> Plan. Available<br />
online at http://www.owrb.ok.gov/ocwp (October 2011).<br />
<strong>Oklahoma</strong> <strong>Water</strong> <strong>Resources</strong> <strong>Board</strong>. (2011). <strong>Lower</strong> Arkansas <strong>Water</strong>shed Planning Region Report. Published by<br />
the <strong>Oklahoma</strong> <strong>Water</strong> <strong>Resources</strong> <strong>Board</strong> under the authority <strong>of</strong> the <strong>Oklahoma</strong> <strong>State</strong> Legislature as<br />
an ancillary report for the <strong>of</strong>ficial update <strong>of</strong> the <strong>Oklahoma</strong> Comprehensive <strong>Water</strong> Plan. Available<br />
online at http://www.owrb.ok.gov/ocwp (October 2011).<br />
<strong>Oklahoma</strong> <strong>Water</strong> <strong>Resources</strong> <strong>Board</strong>. (2011). <strong>Lower</strong> <strong>Washita</strong> <strong>Water</strong>shed Planning Region Report. Published by<br />
the <strong>Oklahoma</strong> <strong>Water</strong> <strong>Resources</strong> <strong>Board</strong> under the authority <strong>of</strong> the <strong>Oklahoma</strong> <strong>State</strong> Legislature as<br />
an ancillary report for the <strong>of</strong>ficial update <strong>of</strong> the <strong>Oklahoma</strong> Comprehensive <strong>Water</strong> Plan. Available<br />
online at http://www.owrb.ok.gov/ocwp (October 2011).<br />
<strong>Oklahoma</strong> <strong>Water</strong> <strong>Resources</strong> <strong>Board</strong>. (2011). Middle Arkansas <strong>Water</strong>shed Planning Region Report. Published by<br />
the <strong>Oklahoma</strong> <strong>Water</strong> <strong>Resources</strong> <strong>Board</strong> under the authority <strong>of</strong> the <strong>Oklahoma</strong> <strong>State</strong> Legislature as<br />
an ancillary report for the <strong>of</strong>ficial update <strong>of</strong> the <strong>Oklahoma</strong> Comprehensive <strong>Water</strong> Plan. Available<br />
online at http://www.owrb.ok.gov/ocwp (October 2011).<br />
<strong>Oklahoma</strong> <strong>Water</strong> <strong>Resources</strong> <strong>Board</strong>. (2011). <strong>Oklahoma</strong> <strong>State</strong>wide <strong>Water</strong> Quality Trends Analysis. Published<br />
by the <strong>Oklahoma</strong> <strong>Water</strong> <strong>Resources</strong> <strong>Board</strong> as a supplement to the 2012 Update <strong>of</strong> the <strong>Oklahoma</strong><br />
Comprehensive <strong>Water</strong> Plan. Available online at http://www.owrb.ok.gov/ocwp (October 2011).<br />
<strong>Oklahoma</strong> <strong>Water</strong> <strong>Resources</strong> <strong>Board</strong>. (2011). Panhandle <strong>Water</strong>shed Planning Region Report. Published by the<br />
<strong>Oklahoma</strong> <strong>Water</strong> <strong>Resources</strong> <strong>Board</strong> under the authority <strong>of</strong> the <strong>Oklahoma</strong> <strong>State</strong> Legislature as an<br />
ancillary report for the <strong>of</strong>ficial update <strong>of</strong> the <strong>Oklahoma</strong> Comprehensive <strong>Water</strong> Plan. Available<br />
online at http://www.owrb.ok.gov/ocwp (October 2011).<br />
<strong>Oklahoma</strong> <strong>Water</strong> <strong>Resources</strong> <strong>Board</strong>. (2011). Southeast <strong>Water</strong>shed Planning Region Report. Published by the<br />
<strong>Oklahoma</strong> <strong>Water</strong> <strong>Resources</strong> <strong>Board</strong> under the authority <strong>of</strong> the <strong>Oklahoma</strong> <strong>State</strong> Legislature as an<br />
ancillary report for the <strong>of</strong>ficial update <strong>of</strong> the <strong>Oklahoma</strong> Comprehensive <strong>Water</strong> Plan. Available<br />
online at http://www.owrb.ok.gov/ocwp (October 2011).<br />
<strong>Oklahoma</strong> <strong>Water</strong> <strong>Resources</strong> <strong>Board</strong>. (2011). Southwest <strong>Water</strong>shed Planning Region Report. Published by the<br />
<strong>Oklahoma</strong> <strong>Water</strong> <strong>Resources</strong> <strong>Board</strong> under the authority <strong>of</strong> the <strong>Oklahoma</strong> <strong>State</strong> Legislature as an<br />
ancillary report for the <strong>of</strong>ficial update <strong>of</strong> the <strong>Oklahoma</strong> Comprehensive <strong>Water</strong> Plan. Available<br />
online at http://www.owrb.ok.gov/ocwp (October 2011).<br />
<strong>Oklahoma</strong> <strong>Water</strong> <strong>Resources</strong> <strong>Board</strong>. (2011). Upper Arkansas <strong>Water</strong>shed Planning Region Report. Published by<br />
the <strong>Oklahoma</strong> <strong>Water</strong> <strong>Resources</strong> <strong>Board</strong> under the authority <strong>of</strong> the <strong>Oklahoma</strong> <strong>State</strong> Legislature as<br />
an ancillary report for the <strong>of</strong>ficial update <strong>of</strong> the <strong>Oklahoma</strong> Comprehensive <strong>Water</strong> Plan. Available<br />
online at http://www.owrb.ok.gov/ocwp (October 2011).<br />
<strong>Oklahoma</strong> <strong>Water</strong> <strong>Resources</strong> <strong>Board</strong>. (2011). <strong>Water</strong> Policy and Related Recommendations for <strong>Oklahoma</strong>.<br />
Published by the <strong>Oklahoma</strong> <strong>Water</strong> <strong>Resources</strong> <strong>Board</strong> as a supplement to the 2012 Update <strong>of</strong> the<br />
<strong>Oklahoma</strong> Comprehensive <strong>Water</strong> Plan. Available online at http://www.owrb.ok.gov/ocwp (October<br />
2011).<br />
<strong>Oklahoma</strong> <strong>Water</strong> <strong>Resources</strong> <strong>Board</strong>. (2011). <strong>Water</strong> Quality Issues and Recommendations. Analysis provided<br />
by the OCWP <strong>Water</strong> Quality Workgroup. Published by the <strong>Oklahoma</strong> <strong>Water</strong> <strong>Resources</strong> <strong>Board</strong> as<br />
a supplement to the 2012 Update <strong>of</strong> the <strong>Oklahoma</strong> Comprehensive <strong>Water</strong> Plan. Available online at http://<br />
www.owrb.ok.gov/ocwp (October 2011).<br />
<strong>Oklahoma</strong> <strong>Water</strong> <strong>Resources</strong> <strong>Board</strong>. (2011). West Central <strong>Water</strong>shed Planning Region Report. Published by<br />
the <strong>Oklahoma</strong> <strong>Water</strong> <strong>Resources</strong> <strong>Board</strong> under the authority <strong>of</strong> the <strong>Oklahoma</strong> <strong>State</strong> Legislature as<br />
an ancillary report for the <strong>of</strong>ficial update <strong>of</strong> the <strong>Oklahoma</strong> Comprehensive <strong>Water</strong> Plan. Available<br />
online at http://www.owrb.ok.gov/ocwp (October 2011).<br />
Robertson, Lindsay. Tribal <strong>Water</strong> Issues and Recommendations. (2011). Commissioned through an agreement<br />
with the <strong>Oklahoma</strong> <strong>Water</strong> <strong>Resources</strong> <strong>Board</strong> as a supplement to the 2012 Update <strong>of</strong> the <strong>Oklahoma</strong><br />
Comprehensive <strong>Water</strong> Plan. Available online at http://www.owrb.ok.gov/ocwp (October 2011).<br />
Wahl, Kenneth L.; Tortorelli, Robert L. Changes in Flow in the Beaver-North Canadian River Basin Upstream<br />
from Canton Lake, Western <strong>Oklahoma</strong>. (1997). WRI; 96-4304 Published by the United <strong>State</strong>s Geological<br />
Survey. Available online at http://pubs.usgs.gov/wri/wri964304/.<br />
<strong>Oklahoma</strong> Comprehensive <strong>Water</strong> Plan<br />
<strong>Lower</strong> <strong>Washita</strong> Regional Report 107


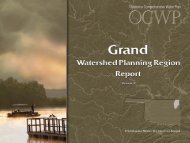

![A Commodity & a Resource [pdf] - Water Resources Board - State of ...](https://img.yumpu.com/42536671/1/190x143/a-commodity-a-resource-pdf-water-resources-board-state-of-.jpg?quality=85)