Volume 1 - Main Report
Volume 1 - Main Report
Volume 1 - Main Report

You also want an ePaper? Increase the reach of your titles
YUMPU automatically turns print PDFs into web optimized ePapers that Google loves.
Environmental and Social Impact Assessment<br />
of the Deception Bay Wharf and<br />
Sediment Management<br />
<strong>Main</strong> <strong>Report</strong><br />
VOLUME 1<br />
November 2012<br />
Project: 101-53046-02
Presented to<br />
Canadian Royalties lnc.<br />
By<br />
IVAR inc.<br />
Prepared by:<br />
ues<br />
Project<br />
Sc<br />
Natalie Gagné, Eng. M. Sc<br />
Project Manager<br />
Approved by<br />
imon ppe, Eng.<br />
Project Director<br />
NOVEMBER 2012<br />
1 01-53046-02
NOTE TO THE READER<br />
THIS DOCUMENT IS A TRANSLATION OF A DOCUMENT ORIGINALLY WRITTEN IN FRENCH.<br />
Canadian Royalties Inc.<br />
GENIVAR<br />
101-53046-02 November 2012<br />
i
PROJECT TEAM<br />
Canadian Royalties inc.<br />
Vice-President<br />
Health and Safety - Environment : Gail Amyot<br />
Superintendent - Environment : Stephane Twigg<br />
GENIVAR Inc.<br />
Project Manager : Simon Latullipe, eng.<br />
ESIA Managers : Jacques Lacroix, geographer, M. Sc.<br />
Natalie Gagné, eng. M. Sc.<br />
Collaborators : Patrick Charbonneau, Biologist. M. Sc.<br />
Jean Deshayes<br />
Claire Dubé, anthropologist, M.Sc.<br />
Marc Gauthier, biol., Ph.D.<br />
Mélanie Lévesque, oceanographer, M.Sc.<br />
Vincent Métivier, Jr. eng., M.Sc.<br />
Edith Normandeau, M.Sc. land-use planner<br />
Jean-François Poulin, biologist, M. Sc.<br />
Julie Simard, geomorphologist, Ph. D.<br />
Steve Renaud, eng. M.Sc.<br />
Field team : David Ouzilleau Samson, geographer M. Sc.<br />
Philippe Charest-Gélinas, biologist<br />
Nathalie Guérard, diver, fauna technician<br />
Frédéric Milord, diver, fauna technician<br />
Mathieu Monast, Professional diver<br />
Kevin Chalifoux-Moisan, Professional diver<br />
Vincent Métivier, eng. M. Sc.<br />
Pierre Hébert, hydraulic technician<br />
Mélanie Lévesque, oceanographer M. Sc.<br />
Benoit Chabot, fauna technician<br />
Canadian Royalties Inc.<br />
GENIVAR<br />
101-53046-02 November 2012<br />
i
PROJECT TEAM (CONT.)<br />
Inuits Collaborators : Quppa Tarkik<br />
Putu Qumaaluk<br />
Adamie Kiatainak<br />
Willie Kiatainak<br />
Mapping and geomatics : Jean-Marc Tremblay<br />
Edition : Linette Poulin<br />
Traductors : Open Text<br />
Lynda Hayes<br />
Courtney Aikman<br />
Hugues Chicoine<br />
Sara Anne Bilodeau<br />
Valérie Fortin, ing. jr<br />
Référence à citer :<br />
GENIVAR. 2012. Environmental and Social Impact Assessment of the Deception Bay Wharf<br />
and Sediment Management. <strong>Report</strong> from GENIVAR for Canadian Royalties Inc..<br />
281 p. and appendices.<br />
Canadian Royalties Inc.<br />
GENIVAR<br />
101-53046-02 November 2012<br />
ii
TABLE OF CONTENTS<br />
Page<br />
Note to the reader ...................................................................................................................... i<br />
Project team ............................................................................................................................... i<br />
Table of contents ...................................................................................................................... iii<br />
List des tables ........................................................................................................................... xi<br />
List des figures ......................................................................................................................... xv<br />
Liste des maps ....................................................................................................................... xvii<br />
List of appendices - <strong>Volume</strong> 2 ................................................................................................ xix<br />
List of appendices - <strong>Volume</strong> 3 .............................................................................................. xxiii<br />
List of acronyms ..................................................................................................................... xxv<br />
1. INTRODUCTION ............................................................................................................. 1<br />
1.1 Setting the Context ................................................................................................ 1<br />
1.2 Project Justification ............................................................................................... 2<br />
1.3 Legal and Regulatory Framework ......................................................................... 3<br />
1.3.1 James Bay and Northern Québec Agreement ........................................ 3<br />
1.3.2 Sanarrutik Agreement ............................................................................. 3<br />
1.3.3 Environmental assessment process ........................................................ 3<br />
1.3.4 Environmental requirements ................................................................... 4<br />
1.3.5 Detailed design of the project .................................................................. 5<br />
2. STUDY AREA .................................................................................................................. 7<br />
2.1 Generalities ........................................................................................................... 7<br />
2.2 Port and Navigation Infrastructures ....................................................................... 7<br />
2.2.1 Port infrastructures .................................................................................. 7<br />
2.2.2 Navigation ............................................................................................... 7<br />
2.3 Land Disposal Site and Access Road ................................................................... 8<br />
3. DESCRIPTION OF THE PROJECT’S VARIANTS ........................................................ 11<br />
3.1 Port Infrastructures .............................................................................................. 11<br />
3.1.1 Generalities ........................................................................................... 11<br />
3.1.2 Comparative analysis of variants .......................................................... 11<br />
3.2 Management of Dredged Sediments ................................................................... 12<br />
Canadian Royalties Inc.<br />
GENIVAR<br />
101-53046-02 November 2012<br />
iii
TABLE OF CONTENTS (cont.)<br />
Page<br />
3.3 Disposal Sites for Dredged Sediments ............................................................... 14<br />
3.2.1 Generalities ........................................................................................... 14<br />
3.2.2 Description and location of sites 1 to 4 ................................................. 14<br />
3.2.3 Description and location of sites A to E................................................. 15<br />
3.2.4 Comparative analysis of variants .......................................................... 15<br />
4. SCOPE OF THE ENVIRONMENTAL ASSESSEMENT AND CONSULTATIONS<br />
WITH THE INUIT........................................................................................................... 19<br />
4.1 Scope of the Environmental Assessment ........................................................... 19<br />
4.2 Public Consultations and Other Meetings with Stakeholders .............................. 20<br />
4.2.1 Public consultations carried out by the CRI in 2006 in Salluit,<br />
Kangiqsujuaq and Purvinituq ................................................................ 22<br />
4.2.1.1 Concerns raised .............................................................. 22<br />
4.2.1.2 Business opportunities and the local economy ....................... 25<br />
4.2.1.3 Environmental impacts and impacts on the practice of<br />
traditional activities .............................................................. 27<br />
4.2.2 Consultation with communities, stakeholders and regional<br />
representatives – spring 2012 ............................................................... 29<br />
4.2.3 Meetings held in Salluit and Kangiqsujuaq in September, 2012 ........... 31<br />
5. METHODOLOGY .......................................................................................................... 33<br />
5.1 Physical Environment .......................................................................................... 33<br />
5.1.1 Review and Analysis of the Existing Information .................................. 33<br />
5.1.2 Sedimentological and Oceanographic Survey Campaigns ................... 33<br />
5.1.3 Core Sampling and Description of Sediments ...................................... 34<br />
5.1.4 Water Level Measurements .................................................................. 34<br />
5.1.5 Bathymetric Surveys ............................................................................. 37<br />
5.1.6 Current Measurements, Waves and Flow ............................................. 37<br />
5.1.6.1 Drifters .............................................................. 37<br />
5.1.6.2 ADCP .............................................................. 37<br />
5.1.7 Turbidity and CTD Sensors ................................................................... 38<br />
Canadian Royalties Inc.<br />
GENIVAR<br />
101-53046-02 November 2012<br />
iv
TABLE OF CONTENTS (cont.)<br />
Page<br />
5.2 Biological Environment ........................................................................................ 38<br />
5.2.1 Marine Environment .............................................................................. 38<br />
5.2.1.1 Benthic Wildlife Inventory Protocols for 2007, 2008 and<br />
2011 ............................................................... 38<br />
5.2.1.2 2012 Field Campaign – Benthic Fauna and Aquatic<br />
Grass Beds ............................................................... 43<br />
5.2.2 Terrestrial Environment ......................................................................... 44<br />
5.2.2.1 Special-Status Plant Species .................................................. 44<br />
5.3 Human Environment ............................................................................................ 45<br />
6. DESCRIPTION OF THE ENVIRONMENT .................................................................... 47<br />
6.1 Physical Environment .......................................................................................... 47<br />
6.1.1 Geology ................................................................................................. 47<br />
6.1.2 Geomorphology ..................................................................................... 49<br />
6.1.2.1 Relief and Bathymetry ............................................................. 49<br />
6.1.2.2 Stratigraphic Context and Surface Deposits ........................... 50<br />
6.1.2.3 Dynamic Terrestrial Geomorphology ...................................... 56<br />
6.1.3 Climate .................................................................................................. 60<br />
6.1.3.1 Climate Means ............................................................... 60<br />
6.1.3.2 Wind Regime ............................................................... 62<br />
6.1.3.3 Sea Ice ............................................................... 62<br />
6.1.3.4 Climate Change and Outlooks ................................................ 65<br />
6.1.4 Physical Oceanography ........................................................................ 68<br />
6.1.4.1 Tides and Water Level ............................................................ 68<br />
6.1.4.2 Waves ............................................................... 68<br />
6.1.4.3 Flow and Currents ............................................................... 73<br />
6.1.4.4 Water Physicochemistry ......................................................... 79<br />
6.1.5 Sediment Quality ................................................................................... 81<br />
6.1.6 Hydrosedimentary Dynamics .............................................................. 101<br />
Canadian Royalties Inc.<br />
GENIVAR<br />
101-53046-02 November 2012<br />
v
TABLE OF CONTENTS (cont.)<br />
Page<br />
6.1.7 Marine Sound Environment................................................................. 102<br />
6.1.7.1 Ambient Noise ............................................................ 102<br />
6.1.7.2 Sound Attenuation ............................................................ 103<br />
6.2 Biological Environment ...................................................................................... 103<br />
6.2.1 Marine Environment ............................................................................ 103<br />
6.2.1.1 Aquatic Grass Beds ............................................................ 103<br />
6.2.1.2 Benthic Fauna ............................................................ 104<br />
6.2.1.3 Ichthyofauna ............................................................ 119<br />
6.2.1.4 Marine Mammals ............................................................ 120<br />
6.2.1.5 Special-Status Species ......................................................... 131<br />
6.2.2 Terrestrial Environment ....................................................................... 132<br />
6.2.2.1 Flora ............................................................ 132<br />
6.2.2.2 Mammals ............................................................ 135<br />
6.2.2.3 Avifauna ............................................................ 136<br />
6.2.2.4 Special-Status Species ......................................................... 136<br />
6.3 Human Environment ......................................................................................... 138<br />
6.3.1 General ............................................................................................... 138<br />
6.3.2 Sociopolitical and Institutional Frameworks ........................................ 139<br />
6.3.2.1 Kativik Regional Government ............................................... 139<br />
6.3.2.2 Makivik Corporation ............................................................ 140<br />
6.3.2.3 Northern Villages and Municipal Councils ............................ 141<br />
6.3.2.4 Landholding Corporations..................................................... 141<br />
6.3.2.5 Kativik School Board ............................................................ 142<br />
6.3.2.6 NRBHSS and Health Centres ............................................... 142<br />
6.3.2.7 Other Bodies ............................................................ 143<br />
6.3.3 Agreements ......................................................................................... 143<br />
6.3.3.1 Sanarrutik and Sivunirmut Agreements ................................ 143<br />
Canadian Royalties Inc.<br />
GENIVAR<br />
101-53046-02 November 2012<br />
vi
TABLE OF CONTENTS (cont.)<br />
Page<br />
6.3.3.2 Nunavik Inuit Land Claims Agreement .................................. 143<br />
6.3.3.3 Nunavik Nickel Agreement .................................................... 144<br />
6.3.4 Sociodemographic Framework ............................................................ 145<br />
6.3.4.1 Demographic Situation .......................................................... 145<br />
6.3.4.2 Health ............................................................. 146<br />
6.3.4.3 Housing ............................................................. 148<br />
6.3.4.4 Transportation ............................................................. 149<br />
6.3.4.5 Economic Context ............................................................. 150<br />
6.3.4.6 Economically Active Population and Labour Market ............. 151<br />
6.3.5 Use of Land and Resources ................................................................ 152<br />
6.3.5.1 Land and Resource Management and Development ........... 152<br />
6.3.5.2 Inuit Use of the Territory ....................................................... 152<br />
6.3.6 Archeological Potential ........................................................................ 158<br />
6.3.7 Landscape ........................................................................................... 160<br />
7. PROJECT DESCRIPTION .......................................................................................... 163<br />
7.1 Wharf infrastructures ......................................................................................... 163<br />
7.1.1 Location ............................................................................................... 163<br />
7.1.2 Permanent wharf ................................................................................. 164<br />
7.1.3 Temporary wharf ................................................................................. 170<br />
7.1.4 Piles driving ......................................................................................... 173<br />
7.1.5 Dredging .............................................................................................. 174<br />
7.1.5.1 Description of the work ......................................................... 174<br />
7.1.5.2 Sediment dispersion ............................................................. 174<br />
7.1.6 Riprap .................................................................................................. 176<br />
7.1.7 <strong>Main</strong>tenance ........................................................................................ 176<br />
7.1.8 Geotechnical considerations ............................................................... 177<br />
7.2 Transshipment of ore ........................................................................................ 178<br />
Canadian Royalties Inc.<br />
GENIVAR<br />
101-53046-02 November 2012<br />
vii
TABLE OF CONTENTS (cont.)<br />
Page<br />
7.3 Navigation ......................................................................................................... 185<br />
7.3.1 Ballast water and invasion of foreign species ..................................... 186<br />
7.4 Disposal site for the dredged sediment ............................................................. 186<br />
7.4.1 Dredged sediment transportation ........................................................ 189<br />
7.4.2 Water management............................................................................. 189<br />
7.5 Closing and decommissioning .......................................................................... 190<br />
7.5.1 Wharf .................................................................................................. 190<br />
7.5.2 Management sediment site ................................................................. 190<br />
7.6 Completion schedule ......................................................................................... 190<br />
7.7 Costs of the work .............................................................................................. 190<br />
7.8 Required equipment .......................................................................................... 192<br />
7.9 Estimation of required personal ........................................................................ 192<br />
8. ASSESSMENT OF ENVIRONMENTAL EFFECTS .................................................... 193<br />
8.1 Method for identifying and assessing environmental effects ............................. 193<br />
8.2<br />
8.1.1 Determining the magnitude of an environmental effect ....................... 193<br />
8.1.1.1 Intensity of the effect ............................................................ 193<br />
8.1.1.2 Degree of disturbance .......................................................... 195<br />
8.1.1.3 Intensity ............................................................ 195<br />
8.1.2 Duration/intensity association ............................................................. 196<br />
8.1.2.1 Duration of the effect ............................................................ 196<br />
8.1.2.2 Duration / intensity index ...................................................... 196<br />
8.1.3 Magnitude of the effect ....................................................................... 196<br />
8.1.3.1 Extent of the effect ............................................................ 197<br />
8.1.3.2 Extent/duration/intensity relationship ...................................... 197<br />
8.1.4 Mitigation measures and residual environmental effects .................... 198<br />
Analysis of environmental effects ...................................................................... 198<br />
8.2 .1 Port infrastructures .............................................................................. 200<br />
8.2 .2 Sediment dump ................................................................................... 233<br />
Canadian Royalties Inc.<br />
GENIVAR<br />
101-53046-02 November 2012<br />
viii
TABLE OF CONTENTS (cont.)<br />
Page<br />
8.3 Principal issues ................................................................................................. 244<br />
8.3.1 Marine Mammals ................................................................................. 244<br />
8.3.1.1 Dredging ............................................................. 245<br />
8.3.1.2 Drilling of piles and sheet piles ............................................. 245<br />
8.3.1.3 Navigation ............................................................. 247<br />
8.3.1.4 Inuit use of the land for traditional purposes ......................... 249<br />
8.4 Fish habitat ........................................................................................................ 250<br />
8.5 Environmental impacts on the project ............................................................... 251<br />
8.5.1 Earthquakes ........................................................................................ 251<br />
8.5.2 Ice ........................................................................................................ 251<br />
8.5.3 Avalanche ............................................................................................ 251<br />
8.6 Cumulative effects ............................................................................................. 252<br />
8.6.1 Legal framework and general .............................................................. 252<br />
8.6.2 Scope of the study ............................................................................... 252<br />
8.6.2.1 Study area and period covered ............................................. 252<br />
8.6.2.2 Valued environmental components ....................................... 252<br />
8.6.2.3 Past, present and future activities, projects and events ........ 252<br />
8.6.3 Analysis of cumulative effects ............................................................. 254<br />
8.6.3.1 Marine mammals ............................................................. 254<br />
8.6.3.2 Inuit use of the land for traditional purposes ......................... 257<br />
8.6.3.3 Fish habitat ............................................................. 258<br />
9. ENVIRONMENTAL MONITORING AND FOLLOW-UP PROGRAMS ........................ 259<br />
10. RÉFÉRENCES ............................................................................................................ 265<br />
Canadian Royalties Inc.<br />
GENIVAR<br />
101-53046-02 November 2012<br />
ix
LIST DES TABLES<br />
Page<br />
Table 3.1 Analysis of Variants – Port Infrastructures ................................................ 13<br />
Table 3.2 Analysis of Variants – Land disposal of the sediments ............................. 17<br />
Table 4.1<br />
Summary of meetings between CRI and stakeholders – August<br />
2008 to October 2012 ................................................................................ 21<br />
Table 6.1 Design criteria chosen for infrastructure earthquake resistance ............... 49<br />
Table 6.2 Typical sedimentary sequence of the Deception Bay region. ................... 50<br />
Table 6.3<br />
Monthly and annual mean temperatures at Deception Bay from<br />
1963 to 1973. ............................................................................................ 60<br />
Table 6.4 Number of degree-days at Iqaluit (Climate normals 1971 to 2000). .......... 61<br />
Table 6.5 Mean precipitation at Deception Bay from 1963 to 1973. ......................... 61<br />
Table 6.6 Anticipated warming of temperatures in Nunavik for 2020 and 2050,<br />
relative to the data for the 1980s (modified from Ouranos, 2007). ............ 66<br />
Table 6.7 Anticipated variation of precipitation in Nunavik for 2020 and 2050,<br />
in relation to the data for the 1980s (modified from Ouranos, 2007). ........ 66<br />
Table 6.8 Deception Bay tide table ........................................................................... 70<br />
Table 6.9 Weather conditions observed at Salluit Airport on September 13<br />
and 14, 2012 (Environment Canada, 2012). ............................................. 70<br />
Table 6.10<br />
Descriptive statistics of current speed different depths in Deception<br />
Bay between September 5 and 29, 2006. ................................................. 73<br />
Table 6.11 Drifter displacement speeds near sites Q1 and Q2. .................................. 76<br />
Table 6.12<br />
Displacement speeds of drifters offshore from the Canadian<br />
Royalties camp on August 2, 2012. ........................................................... 77<br />
Table 6.13 Temperature and salinity values of deep water layer of Transect 1<br />
(August 2012). ........................................................................................... 79<br />
Table 6.14<br />
Table 6.15<br />
Concentration of suspended particulate matter measured near sites<br />
Q1 and Q2, August 5, 2012. ...................................................................... 80<br />
Descriptive statistics on suspended particulate matter near sites Q1<br />
and Q2 (August 5, 2012) ........................................................................... 81<br />
Table 6.16 Sediment quality at site Q1 (July 2012) ..................................................... 85<br />
Table 6.17<br />
Typical underwater sound pressure levels measured directly in<br />
Deception Bay on July 12, 2012. ............................................................. 103<br />
Table 6.18 Sound attenuation at sites Q1 and Q2. ................................................... 103<br />
Canadian Royalties Inc.<br />
GENIVAR<br />
101-53046-02 November 2012<br />
xi
Table 6.19<br />
LIST DES TABLES (Cont.)<br />
Canadian Royalties Inc.<br />
GENIVAR<br />
101-53046-02 November 2012<br />
xii<br />
Page<br />
Inventory and estimate of coverage (%) of aquatic grass beds found<br />
at sites Q1 and Q2 ................................................................................... 107<br />
Table 6.20 Epibenthic fauna inventory at sites Q1 and Q2 ........................................ 109<br />
Table 6.21<br />
Table 6.22<br />
Table 6.23<br />
Table 6.23<br />
Densities of endobenthic invertebrates (number of organisms/m2)<br />
measured at sites Q1 and Q2, August 2012 ............................................ 111<br />
Diversity indices for the 16 stations sampled at sites Q1 and Q2 in<br />
Deception Bay, August 2012. .................................................................. 119<br />
<strong>Main</strong> fish species present in Deception Bay, likely to use the study<br />
zone. ........................................................................................................ 121<br />
<strong>Main</strong> fish species present in Deception Bay, likely to use the study<br />
zone (continued). ..................................................................................... 122<br />
Table 6.24 Marine mammals likely to use Deception Bay ......................................... 123<br />
Table 6.25<br />
Characteristics of the main marine mammals likely to frequent<br />
Deception Bay (GENIVAR, 2007b). ......................................................... 125<br />
Table 6.26 Land mammals likely to be present in the Deception Bay sector............. 135<br />
Table 6.27 List of bird species observed in the study zone ....................................... 137<br />
Table 6.28 List of special-status bird species likely to frequent the study area ......... 138<br />
Table 6.29<br />
Table 6.30<br />
Sociodemographic data for Salluit and Kangiqsujuaq in comparison<br />
with Québec as a whole in 2011 and 2006 .............................................. 145<br />
List of the main wildlife species harvested by the Salluit and<br />
Kangiqsujuaq communities (Thiffault 2007, GENIVAR, 2007 and<br />
2007b). ..................................................................................................... 157<br />
Table 7.1 Comparison of the different wharf concepts............................................. 170<br />
Table 7.2 Estimated volumes of riprap and structures areas ................................... 176<br />
Table 7.3 Summary of safety factors ....................................................................... 177<br />
Table 7.4 Permanent Wharf ..................................................................................... 191<br />
Table 7.5 Temporary Wharf ..................................................................................... 191<br />
Table 7.6 Machinery and equipment ........................................................................ 192<br />
Table 7.7 Estimated number of workers .................................................................. 192<br />
Table 8.1<br />
Grid for evaluating the importance of components of the biological<br />
and human environments ........................................................................ 195<br />
Table 8.2 Grid for assessing an impact's intensity ................................................... 195<br />
Table 8.3 Grid for assessing the duration - intensity index ...................................... 196
LIST DES TABLES (Cont.)<br />
Page<br />
Table 8.4 Grid for assessing the effect's significance ............................................. 198<br />
Table 8.5<br />
Identification of potential effects matrix - Temporary and permanent<br />
port infrastructures .................................................................................. 202<br />
Table 8.6 Identification of potential effects matrix of the land sediment dump. ....... 234<br />
Table 8.7 Surface areas of affected fish habitat ...................................................... 250<br />
Table 8.8<br />
Summary of present and future activities, projects and events likely<br />
to have affected or affect VECs ............................................................... 253<br />
Table 9.1 Limit Values ............................................................................................. 263<br />
Canadian Royalties Inc.<br />
GENIVAR<br />
101-53046-02 November 2012<br />
xiii
Figure 6.1<br />
LIST DES FIGURES<br />
Page<br />
Geological provinces of Québec and tectonostratigraphic units<br />
(modified from GENIVAR, 2007 and Mouksil, 1996). ................................ 47<br />
Figure 6.2 Lithology of the study site (modified from Lamothe, 2007). ....................... 48<br />
Figure 6.3<br />
Debris cone from the 2005 slush flow, related to winter thaws<br />
(CEN, 2012). ............................................................................................. 59<br />
Figure 6.4 Wind roses for Deception Bay and Salluit ................................................. 63<br />
Figure 6.5<br />
Figure 6.6<br />
Figure 6.7<br />
Freeze-up and break-up dates for the Arctic region (Environment<br />
Canada, 2012) ........................................................................................... 64<br />
History of the percentage of ice coverage in the Hudson Strait<br />
sector ......................................................................................................... 65<br />
Water level measured in Deception Bay between August 8 and<br />
September 15, 2012 (CD). The red line shows the bay water level<br />
variation caused by the passage of atmospheric disturbances. The<br />
levels are all represented relative to the Chart Datums. ........................... 69<br />
Figure 6.8 Variation of the water level in Deception Bay between September 6<br />
and 16, 2012 (CD). The line represents the atmospheric component<br />
of the water levels measured. ................................................................... 71<br />
Figure 6.9<br />
Figure 6.10<br />
Figure 6.11<br />
Recorded series of the significant height of waves, their period and<br />
the tide measured between September 5 and 22, 2006 (modified<br />
from GENIVAR, 2007a). ............................................................................ 72<br />
Recorded series of the significant height of the waves, their period<br />
and the tide measured between September 22 and 29, 2006<br />
(modified from GENIVAR, 2007a). ............................................................ 72<br />
Current speeds measured between September 5 and 29, 2006 at<br />
station 1200 located at a depth of 11 m. The bottom portion shows<br />
the speeds at 10.5 m, 6.8 m and 3.0 m. .................................................... 74<br />
Figure 6.12 Currentometric profile produced in Section T1, August 3, 2012 ................ 75<br />
Figure 6.13 Currentometric profile produced in Section T2 – August 2, 2012 .............. 75<br />
Figure 6.14<br />
Canadian Sediment Quality Guidelines (CCME, 1999) Québec<br />
sediment quality criteria (taken from Environment Canada and<br />
MDDEP, 2007). ......................................................................................... 83<br />
Figure 6.15 Proportions of phyla collected at site Q1, August 2012. .......................... 118<br />
Figure 6.16 Proportions of phyla collected at site Q21, August 2012. ........................ 118<br />
Figure 7.1 Permanent Dock Facility Concept ........................................................... 179<br />
Figure 7.2 Permanent Dock Facility Concept ........................................................... 180<br />
Figure 7.3 Transfer points ........................................................................................ 181<br />
Figure 7.4 Temporary Dock Facility Concept ........................................................... 182<br />
Canadian Royalties Inc.<br />
GENIVAR<br />
101-53046-02 November 2012<br />
xv
LISTE DES MAPS<br />
Page<br />
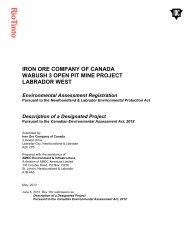
Map 2.1 Study Area ................................................................................................... 9<br />
Map 5.1<br />
Map 5.2<br />
Sampling Stations Locations for Sediment Physicochemical and<br />
Granulometric Analysis ............................................................................. 35<br />
Location of Water Physicochemical Sampling Stations, ADCP<br />
Transects and Water Level Gages ............................................................ 39<br />
Map 5.3 Suspended solids sampling stations location, August 2012 ...................... 41<br />
Map 6.1 Relief and Bathymetry ............................................................................... 51<br />
Map 6.2 Surface deposits and geomorphology ....................................................... 53<br />
Map 6.3<br />
Trajectory of Drifters on August 1, 2 and 5, 2012 and Outlook of<br />
Hydrodynamic Conditions ......................................................................... 77<br />
Map 6.4 Benthos and Aquatic-Grass Bed Characterization Stations<br />
Locations for Q1 and Q2 sites, August 2012 ........................................... 105<br />
Map 6.5 Traditional Land Use ............................................................................... 155<br />
Map 6.6 Human Environment ................................................................................ 159<br />
Map 7.1 General Layout ........................................................................................ 165<br />
Map 7.2 Permanent Wharf Layout Concept .......................................................... 167<br />
Map 7.3 Temporary Wharf Layout Concept .......................................................... 171<br />
Map 7.4 Sediment Disposal Site ........................................................................... 183<br />
Map 7.5 Ships Path ............................................................................................... 187<br />
Map 8.1 Proposed Marine Mammal Monitoring Area ............................................ 246<br />
Canadian Royalties Inc.<br />
GENIVAR<br />
101-53046-02 November 2012<br />
xvii
LIST OF APPENDICES<br />
VOLUME 2<br />
APPENDIX 1 Correspondence from Mrs. Judy Doré to Mrs. Gail Amyot, July 10, 2012<br />
APPENDIX 2<br />
APPENDIX 3<br />
Photos<br />
Sediment physico-chemical analysis results–<br />
2006, 2007, 2011<br />
APPENDIX 4 Surface samples granulometric analysis results – 2012<br />
APPENDIX 5<br />
APPENDIX 6<br />
Hydrological analysis of flows in Deception River<br />
Avalanches hazard assessment<br />
APPENDIX 8 Certificate of analysis of the SS concentrations - 2012<br />
APPENDIX 9 Certificate of analysis of the sediment physico-chemical properties– 2012<br />
APPENDIX 11<br />
APPENDIX 12<br />
APPENDIX 17<br />
Aquatic plants – Underwater photographs<br />
Requests and responses of the CDPNQ and of the MRNF on the species<br />
at risk in the studied area<br />
Wharf infrastructures and terrestrial sediment disposal plans<br />
17.1 Permanent wharf<br />
506117-7000-41-DK-0001, 506117-7000-41-DK-0002,<br />
506117-7000-41-DK-0003, 506117-7000-41-DK-0004<br />
506117-7000-41-DK-0005, 506117-7000-41-DK-0006<br />
506117-7000-41-DK-0007, 506117-7000-41-DK-0008<br />
17.2 Temporary wharf<br />
533079-8301-0001, 533079-8301-0002<br />
17.3 Sediment disposal site<br />
101-53046-02_F01, 101-53046-02_F02<br />
Canadian Royalties Inc.<br />
GENIVAR<br />
101-53046-02 November 2012<br />
xix
LIST OF APPENDICES<br />
VOLUME 2<br />
(CONTINUED)<br />
APPENDIX 18<br />
APPENDIX 19<br />
APPENDIX 20<br />
APPENDIX 21<br />
APPENDIX 23<br />
APPENDIX 24<br />
Dredge calculation note<br />
Geochemical testing results<br />
Photos of the Arctic Class icebreaker<br />
Common mitigation measures<br />
Typical environmental monitoring form<br />
Navigation monitoring protocole<br />
Canadian Royalties Inc.<br />
GENIVAR<br />
101-53046-02 November 2012<br />
xxi
LIST OF APPENDICES<br />
VOLUME 3<br />
APPENDIX 7<br />
Hydrodynamic modeling of Deception Bay– Sector report<br />
APPENDIX 10 Caracterization of the underwater sound environment - 2012 -<br />
Sector report<br />
APPENDIX 13<br />
APPENDIX 14<br />
APPENDIX 15<br />
APPENDIX 16<br />
APPENDIX 22<br />
Field survey of vascular plant species at risk - Sector report<br />
Avian fauna - Sector report<br />
Archeology - Sector report<br />
Visual integration study - Sector report<br />
Study on maritime navigation in Deception Bay - Sector report<br />
Canadian Royalties Inc.<br />
GENIVAR<br />
101-53046-02 November 2012<br />
xxiii
LIST OF ACRONYMS<br />
Nunavik Inuit Land Claims Agreement<br />
Kativik Regional Government<br />
Canadian Food Inspection Agency<br />
Canadian Royalties Inc.<br />
Centre de données sur le patrimoine naturel du Québec<br />
Kativik Local Development Centre<br />
Federal Environmental and Social Impact Review Panel<br />
Committee on the Status on Endangered Wildlife in Canada<br />
The Kativik Environmental Quality Commission<br />
The Kativik School Board<br />
Nunavut Wildlife Management Board<br />
Kativik Regional Development Council<br />
Vulnerable marine ecosystems<br />
Environment Canada<br />
Environmental and Social Impact Assessment<br />
Institut national de santé publique<br />
Loi sur la qualité de l’environnement<br />
Ministère du Développement durable, de l’Environnement et des Parcs<br />
Ministère des Ressources naturelles et de la Faune<br />
Kativik Municipal Housing Bureau<br />
Fisheries and Oceans Canada<br />
Higher high water large tide<br />
Ranglan south nickel Projet<br />
Nunavik Nickel Project<br />
Nunavik Regional Health and Social Services Board<br />
NLCA<br />
KRG<br />
CFIA<br />
CRI<br />
CDPNQ<br />
KLDC<br />
FRP-North<br />
COSEWIC<br />
KEQC<br />
KSB<br />
NWMB<br />
KRDC<br />
VME<br />
EC<br />
ESIA<br />
INSPQ<br />
LQE<br />
MDDEP<br />
MRNF<br />
KMHB<br />
DFO<br />
HHWLT<br />
RSNP<br />
NNiP<br />
NRHSSB<br />
Canadian Royalties Inc.<br />
GENIVAR<br />
101-53046-02 November 2012<br />
xxv
1. INTRODUCTION<br />
1.1 Setting the Context<br />
The Nunavik Nickel Project (NNiP), headed by Canadian Royalties Inc. (CRI) was<br />
the subject of an environmental and social impact assessment (ESIA)<br />
(GENIVAR, 2007a), which was filed with the Ministère du Développement durable,<br />
de l’Environnement et des Parcs (MDDEP) 1 and transmitted to the Kativik<br />
Environmental Quality Commission (KEQC) in April 2007. A certificate of authority<br />
for the NNiP was issued on May 20, 2008 under section 201 of the Environment<br />
Quality Act (EQA) (RSQ, c. Q-2) (V/Ref.: 3215-14-007).<br />
As part of the 2007 ESIA, five variants were studied in relation to the installation of<br />
port infrastructures to be used for shipping copper and nickel concentrate to<br />
foundries in Europe. Following analysis of these variants, the Deception Bay site was<br />
chosen, considering the configuration of the location and the fact that an existing<br />
road is already being used and maintained on the site.<br />
The MDDEP authorized the construction of port infrastructures in 2008 with a<br />
certificate of authorization for the NNiP. The Federal Administrator also authorized<br />
the work following the recommendation of the Federal Review Panel North (FRP-N).<br />
Work began in July 2011 with the preparation of the site. During dredging activities<br />
in 2011, a landslide occurred, which required a reassessment of the variants, leading<br />
to the production of an ESIA (GENIVAR, 2011). This assessment was submitted to<br />
competent authorities in December, 2011, suggesting a new location for the wharf.<br />
In February 2012, federal authorities advised CRI that relocating the wharf would<br />
require new public consultations, which could not be completed before the fall<br />
of 2012. They also informed CRI that the disposal of dredged sediments at sea was<br />
no longer an option favoured by Environment Canada (EC).<br />
In April 2012, FRP-N, EC and Fisheries and Oceans Canada (DFO) sent CRI<br />
requests for information on the project as defined in the study of December 2011.<br />
In May, 2012, CRI decided to install port infrastructures on the site already<br />
authorized, to do so in two steps in 2013 (a temporary wharf and a permanent<br />
wharf), to dispose of the dredged sediments in a designated repository on land, and<br />
to immediately advise the relevant authorities of these changes. FRP-N responded<br />
by asking for the production of a complete and independent environmental<br />
1<br />
Ministère du Développement durable, de l’Environnement, de la Faune et des Parcs (MDDEFP) since<br />
September, 2012.<br />
Canadian Royalties Inc.<br />
GENIVAR<br />
101-53046-02 November 2012<br />
1
assessment on the temporary wharf, the permanent wharf, previsions for capital<br />
dredging and maintenance, sediment management, and the choice of a sediment<br />
disposal site.<br />
This report responds to the request of FRP-N and to questions and comments<br />
formulated in April 2012. It aims to provide all of the necessary information to allow<br />
the assessment of the impacts of the port infrastructures and the management of<br />
dredged sediments. All of the relevant information and data on sampling records and<br />
campaigns in recent years have been put together, particularly in relation to the<br />
aquatic environment. The report also includes an assessment of the effects of<br />
navigation in Deception Bay.<br />
1.2 Project Justification<br />
The purpose of the project is based primarily on the need to route concentrated<br />
nickel and copper, produced by the CRI, from the concentrator on the Expo site to<br />
the foundries. The construction of a wharf and warehouse separate from those of<br />
Xstrata is essential for the following reasons (already known):<br />
• The Xstrata wharf cannot accommodate two ships simultaneously;<br />
• Since the Xstrata and CRI concentrates do not have the same physical<br />
characteristics, they require different loading installations; the concentrate<br />
produced by CRI is moister, according to the requirements of purchasing<br />
foundries;<br />
• The CRI and Xstrata concentrates may not be stored in the same building due to<br />
basic commercial principles.<br />
Although the construction of the port infrastructures was delayed due to the landslide<br />
that occurred in July 2011, the construction of the mineral processing plant<br />
continued. It will be completed in December, 2012, and the production of nickel and<br />
copper concentrates will begin in January 2013. The copper concentrate hall in<br />
Deception Bay will therefore be ready to receive ore as of January 2013. This<br />
warehouse will have a nominal storage capacity of 53,325 metric tons (mt) of<br />
concentrate.<br />
To ensure that the concentrates are well managed in the warehouse and during<br />
loading, CRI will build a temporary wharf in the summer of 2013. This wharf will allow<br />
the company to empty the warehouse of the concentrate produced in preceding<br />
months and to load the ship with as much care as if the permanent wharf were in<br />
place. The conveyor and the loading arm of the permanent infrastructure will be<br />
installed on this temporary infrastructure. It will be designed to be installed and<br />
dismantled quickly, and it will be very stable and reliable. The first shipment of ore,<br />
scheduled for August 2013, will be carried out from the temporary wharf.<br />
Canadian Royalties Inc.<br />
GENIVAR<br />
101-53046-02 November 2012<br />
2
1.3 Legal and Regulatory Framework<br />
1.3.1 James Bay and Northern Québec Agreement<br />
On November 11, 1975, the James Bay and Northern Québec Agreement (JBNQA)<br />
was ratified between the Government of Québec, Hydro-Québec, Société d’énergie<br />
de la Baie James, Société de développement de la Baie-James, and the Grand<br />
Council of the Cree of Québec and the Northern Quebec Inuit Association. The<br />
Government of Canada is also part of the Agreement. The JBNQA is based on two<br />
guiding principles, namely that Québec needs to use its resources for the benefit of<br />
all of its residents, and that the Government of Québec recognizes the needs of<br />
Aboriginal people, both Cree and Inuit.<br />
The territorial regime defined by the JBNQA recognizes three categories of land,<br />
covering an area of 1,082 million km 2 . Category I lands are those assigned to each<br />
Cree or Inuit community for their exclusive use. They represent 14, 348 km 2 or 1.3 %<br />
of the land under agreement. Category II lands constitute a buffer zone where only<br />
Aboriginals have the right to hunt, fish, trap, and run outfitters. They represent<br />
159,880 km 2 or 14.8 % of the land under agreement. Category III lands are public<br />
lands on which indigenous peoples may, subject to the principle of conservation,<br />
pursue traditional activities year round in addition to having exclusive rights to hunt<br />
certain animal species. They represent 907,772 km 2 or 83.9 % of the land under<br />
agreement.<br />
1.3.2 Sanarrutik Agreement<br />
On April 9, 2002, the Government of Québec and the Inuit ratified the Sanarrutik<br />
Agreement, inaugurating a partnership on economic and community development.<br />
The Agreement is based on the desire to develop the potential of Nunavik while<br />
respecting the environment, and on increased responsibility of the Inuit towards their<br />
economic and social development. Based on the Paix des Braves Agreement, also<br />
negotiated in 2002 between the Government of Québec and the Cree, the Sanarrutik<br />
Agreement is in effect for 25 years. It is a complement to the JBNQA and does not<br />
change that agreement’s foundations.<br />
1.3.3 Environmental assessment process<br />
In accordance with the rules laid down in the JBNQA, Chapter II of the EQA<br />
(EQA., c. Q-2) contains specific provisions applicable to the northern regions of<br />
Quebec. The applicable environmental assessment procedures differ with regards to<br />
the active participation of the Cree and Inuit who live there.<br />
Canadian Royalties Inc.<br />
GENIVAR<br />
101-53046-02 November 2012<br />
3
For the region north of the 55 th parallel, the JBNQA created the KEQC, which is<br />
responsible for the preliminary assessment and the review of development projects<br />
that fall under provincial jurisdiction. The KEQC is composed of nine members, four<br />
of whom are appointed by the Government of Quebec and four by the Kativik<br />
Regional Government (KRG). The Quebec government names its president, with the<br />
approval of the KRG. The JBNQA created the Kativik Environmental Advisory<br />
Committee (KEAC), which monitors the implementation and administration of the<br />
environmental protection plan of Section 23 of the JBNQA. This committee is<br />
composed of nine members, three of whom are named by the Government of<br />
Québec, three by the Government of Canada, and three others by the KRG.<br />
For development projects that fall under federal jurisdiction, the FRP-N is<br />
responsible for the preliminary assessment and to make recommendations to the<br />
Federal Administrator as to whether or not to authorize a project. The FRP-N is<br />
composed of three members appointed by the Government of Canada and two<br />
members appointed by the KRG.<br />
Finally, the Nunavik Marine Region Impact Review Board (NMRIRB) was established<br />
in 2008 as an institution of public government under the Nunavik Inuit Land Claims<br />
Agreement (NILCA) of 2007. This commission determines whether the proposed<br />
projects require an examination of the ecosytemic or socio-economic impacts or not.<br />
If so, it must then decide, in light of this review, whether or not the projects should be<br />
carried out, and if so, under what conditions, and to report its decision to the<br />
competent Federal Minister.<br />
1.3.4 Environmental requirements<br />
The Deception Bay port facilities proposal is one of the projects described in<br />
Annex A of Chapter 11 of the EQA. That is why this project is subject to an<br />
environmental and social impact assessment. The project was authorized by the<br />
MDDEP in 2008.<br />
Because of amendments to the Canadian Environmental Assessment Act in 2012,<br />
the project is not subject to a federal environmental assessment (Appendix 1.<br />
Correspondence from Julie Doré to Gail Amyot, July 10, 2012).<br />
The DFO must issue an authorization under the Fisheries Act (RS, 1985, c. F-14) to<br />
allow the deterioration, destruction or disturbance of the fish habitat caused by the<br />
construction of permanent infrastructures. A request for modification of the<br />
authorization issued in July 2010 by Transport Canada (8200-2006-3001-09-001)<br />
under the Navigable Waters Protection Act (RSC, 1985, c. N-22) must be made.<br />
Canadian Royalties Inc.<br />
GENIVAR<br />
101-53046-02 November 2012<br />
4
1.3.5 Detailed design of the project<br />
After the environmental assessment process, the design of definitive drawings and<br />
specifications (DDS) will be undertaken. In addition to the working methods and<br />
mitigation measures set out in this document, the final design will meet applicable<br />
standards with regard to the projected equipment and infrastructures. The DDS<br />
should, where appropriate, be subject to an assessment and permit applications<br />
under the laws and regulations enacted by the governments of Canada and Quebec.<br />
Canadian Royalties Inc.<br />
GENIVAR<br />
101-53046-02 November 2012<br />
5
2. STUDY AREA<br />
2.1 Generalities<br />
The study area encompasses all of Deception Bay, including the sites studied for the<br />
port infrastructures (Q1 and Q2) and dredged sediment disposal sites (4, A, B, C, D<br />
and E). It also includes part of Deception River and its estuary and Lake Duquet to<br />
the south, and extends to Pointe-Noire to the north (map 2.1 and Appendix 2).<br />
The study area is approximately 23 km long and 5 km wide. It covers an area of<br />
approximately 105 km 2 and lies between latitudes 62°01'N and 62°12’N and<br />
longitudes 74°29'W and 74°49'W. These boundaries provide a framework for the<br />
main effects of the port infrastructures, the land disposal site and navigation on<br />
different components of natural and human environments, such as sediment quality,<br />
marine organisms and the Inuit’s use of land for traditional purposes.<br />
As needed, this study area is enlarged or adjusted to include elements relevant to<br />
the description of the environment or the environmental impact assessment.<br />
2.2 Port and Navigation Infrastructures<br />
2.2.1 Port infrastructures<br />
The central geographical coordinates of site Q1 and site Q2 are given below<br />
(map 2.1).<br />
Site Q1<br />
• 62° 08' 23" latitude north;<br />
• 74° 41' 03" longitude west.<br />
Site Q2<br />
• 62° 08' 09" latitude north;<br />
• 74° 40' 10" longitude west.<br />
2.2.2 Navigation<br />
The navigation study area includes the maneuvering area for ships around the<br />
wharf site, and the portion of Deception Bay located northwest of the wharf up to<br />
Pointe-Noire.<br />
Canadian Royalties Inc.<br />
GENIVAR<br />
101-53046-02 November 2012<br />
7
2.3 Land Disposal Site and Access Road<br />
The land disposal sites studied are shown on map 2.1. Their central geographical<br />
coordinates are as follows:<br />
Site A<br />
• 62° 08’ 03’’ latitude north;<br />
• 74° 40’ 26’’ longitude west.<br />
Site B<br />
• 62° 07’ 48’’ latitude north;<br />
• 74° 39’ 49’’’ longitude west.<br />
Site C<br />
• 62° 07’ 35’’ latitude north;<br />
• 74° 39’ 44’’ longitude west.<br />
Site D<br />
• 62° 07’ 17’’ latitude north;<br />
• 74° 39’ 42’’ longitude west.<br />
Site E<br />
• 62° 07’ 19’’ latitude north;<br />
• 74° 40’ 16’’ longitude west.<br />
Site 4<br />
• 62° 06' 07" latitude north;<br />
• 74° 35' 30" longitude west.<br />
Canadian Royalties Inc.<br />
GENIVAR<br />
101-53046-02 November 2012<br />
8
Arctic<br />
Island<br />
Neptune<br />
Island<br />
74°40'0"W<br />
74°30'0"W<br />
False<br />
Cove<br />
62°13'0"N<br />
Egg Rock<br />
Pointe Noire<br />
Projet Nunavik Nickel / Nunavik Nickel Project<br />
EIES pour l’aménagement d’infrastructures portuaires et<br />
la gestion des sédiments à la baie Déception /<br />
ESIA for the Deception Bay Wharf and Sediment Management<br />
Carte 2.1 / Map 2.1<br />
Zone d'étude / Study Area<br />
62°13'0"N<br />
Moosehead<br />
Islands<br />
0 1 2 3 km<br />
Projection : UTM, zone 18, NAD83<br />
Équidistance des courbes / Contour Interval : 50 pieds / feet<br />
Mont de<br />
la Table<br />
Source :<br />
Base : BNDT, 1 : 50 000, 1976 à 1995**, © Sa Majesté la Reine du<br />
Chef du Canada, reproduit avec la permission de RNCan<br />
White Rock<br />
Inventaires et cartographie / Surveys and mapping : GENIVAR<br />
Fichier / File : 101_53046_EIES_BD_c2_1_loc_121120.mxd<br />
Novembre / November 2012<br />
101-53046-02<br />
Pointe Théron<br />
62°9'0"N<br />
Baie<br />
Kangirsugaarjuk /<br />
Careenage Arm<br />
Xstrata<br />
Nickel<br />
Q1<br />
A<br />
E<br />
Q2<br />
B<br />
C<br />
D<br />
Baie Déception /<br />
Deception Bay<br />
Plage du<br />
Bombardier<br />
62°9'0"N<br />
Ancien terrain d'aviation /<br />
Inactive Air Field<br />
Ancienne pourvoirie /<br />
Inactive Outfitter<br />
(camp Kanguq)<br />
Campement<br />
temporaire /<br />
Temporary<br />
Camp<br />
Site 4<br />
Rivière Déception<br />
62°5'0"N<br />
62°5'0"N<br />
Lac<br />
Duquet<br />
Composantes du projet / Project Components<br />
Infrastructures portuaires projetées (variantes) /<br />
Proposed wharf (variants)<br />
Site de dépôt des sédiments (variantes) /<br />
Sediment disposal site (variants)<br />
Zone d'étude / Study area<br />
Infrastuctures existantes / Existing Infrastructure<br />
Campement Inuit permanent / Inuit permanent camp<br />
62°1'0"N<br />
Infrastructures portuaires / Wharf<br />
Route / Road<br />
74°40'0"W<br />
74°30'0"W<br />
62°1'0"N
3. DESCRIPTION OF THE PROJECT’S VARIANTS<br />
3.1 Port Infrastructures<br />
3.1.1 Generalities<br />
On September 4, 2006, sediment sampling took place in the vicinity of each of the<br />
three potential wharf sites being studied. Site Q1 was being considered at that time,<br />
and special attention was paid to the data that came from this site.<br />
In 2011, sediment sampling was conducted on site Q2, since by then, this site was<br />
being considered as the wharf site. Drilling work, carried out as part of the Stantec<br />
geotechnical study, took place in September 2011. A total of 13 drilling operations<br />
were performed in the sediments of site Q2.<br />
The substances analyzed and the criteria considered in 2006 and 2011 can be found<br />
in Tables 1 and 2, available in Appendix 3. The maps showing the sampling points<br />
are also presented.<br />
Thus, in light of test results obtained between 2006 and 2011, and considering the<br />
comments received in the analysis report submitted in December 2011, sites Q1 and<br />
Q2 were the subject of complementary investigations in the summer of 2012. Site Q1<br />
could once again be considered as a location for the port infrastructures due to major<br />
changes to the design concept.<br />
It is important to note that site Q1 was different after the events that occurred on<br />
July 11, 2011. During construction of the wharf, a landslide occurred to the right of<br />
the construction site. The event took place over a few hours. An estimated volume of<br />
16,000 m 3 of boulders (all from blasting) had been put in place to build the pier. The<br />
landslide occurred because of the seabed’s unsuspected resistance to puncturing.<br />
The stone did not penetrate the adjacent clay as expected. Also, the unsuspected<br />
presence of a layer of soft and sensitive clay was also a cause; the weight of the fill<br />
surpassed the clay’s shear strength, resulting in the collapse of the clay and the<br />
subsequent landslide. No corrective work has been done to date.<br />
3.1.2 Comparative analysis of variants<br />
Both variants (sites Q1 and Q2) were compared according to environmental and<br />
technical criteria. The comparative analysis of the sites was done considering that a<br />
floating wharf would be built in both cases. Since these two sites were located less<br />
than 800 m from each other, the environmental impacts associated with the<br />
construction and operation of these sites would be similar.<br />
Canadian Royalties Inc.<br />
GENIVAR<br />
101-53046-02 November 2012<br />
11
A score ranging from 1 to 3 was given to each criterion for each site, 3 being the best<br />
option and 1 being the worst. The criteria were considered equivalent to each other.<br />
The variant with the best score was chosen, with a maximum possible score of 18.<br />
Site Q1 proved to be the most advantageous, with a score of 14 (Table 3.1).<br />
3.2 Management of Dredged Sediments<br />
Two options are available for the management of dredged sediments: sea disposal<br />
and land disposal. The environmental assessment report of December 2011<br />
(GENIVAR, 2011) provided for sea disposal and suggested four sites in Deception<br />
Bay. However, various criteria for selecting the management method were<br />
reassessed in light of new analyses of technical and environmental data, and as a<br />
result of comments received from various stakeholders, including federal authorities.<br />
Sea disposal was therefore discarded as a management method for the following<br />
reasons:<br />
• When sea disposal was considered as a management method, the volume of<br />
dredged sediments was estimated to be high, which posed major technical and<br />
environmental challenges for their management on land;<br />
• The hydrodynamic conditions of Deception Bay (GENIVAR, 2012) are such that<br />
there is a significant risk of creating sediment plumes during sea disposal<br />
operations, which would take time to dissipate (in addition to the plume created<br />
by the dredging itself), and could affect marine wildlife and some sensitive<br />
habitats, such as the estuary of Deception River under certain weather<br />
conditions (especially winds from the northwest);<br />
• Inventories made on one of the sea disposal sites studied show the probable<br />
presence of soft corals, which suggests their presence in all of the sea disposal<br />
sites studied. These organisms form vulnerable marine ecosystems (VME),<br />
which Canada is committed to protecting by supporting Resolution 61/105 of the<br />
United Nations General Assembly of 2006 on fishing activities and the protection<br />
of VME;<br />
• The DPO asked that before considering sea disposal, all other land disposal<br />
options be considered;<br />
• The time required for the recolonization of benthos in an Arctic sea disposal site<br />
is unknown;<br />
• Sea disposal in Deception Bay has a significant risk of disturbing the marine<br />
mammals that live there, especially the beluga, which carry out breeding<br />
activities in the bay;<br />
• The frequent round-trip traffic of the barges transporting sediments between the<br />
dredging and disposal sites also poses a risk of collision with marine mammals.<br />
Canadian Royalties Inc.<br />
GENIVAR<br />
101-53046-02 November 2012<br />
12
E3 – Effect on benthos Average 2 Average 2<br />
Table 3.1 Analysis of Variants – Port Infrastructures<br />
Site Q1<br />
Score<br />
Score<br />
1<br />
1<br />
Site Q2<br />
Environment<br />
E1 – Effect on ichtyofauna Average 2 Average 2<br />
E2 – Effect on marine flora<br />
Average<br />
Site disturbed after the landslide of 2011<br />
2 Strong 1<br />
Technical<br />
T1 – Proximity to the concentrate hall Opposite concentrate hall 3<br />
T2 – Authorization process Site authorized at CA global 3<br />
850 m from concentrate hall<br />
Requires the installation of a conveyor above<br />
the trajectory of the avalanche corridor<br />
Modification of CA global required<br />
T3 – Trajectory of the avalanche<br />
corridor<br />
The wharf infrastructures could be affected by<br />
sediments caught up in the spill resulting from a<br />
landslide<br />
2 Little risk of the wharf being affected 3<br />
Total<br />
Note: Must be read with map 7.1- General layout<br />
14 10
3.3 Disposal Sites for Dredged Sediments<br />
3.2.1 Generalities<br />
The management site for dredged sediments on land must be set up as closely as<br />
possible to port infrastructures to minimize sediment transport between the<br />
excavation site and the storage site.<br />
During the preparation of the environmental assessment in December 2011, four<br />
potential sites were identified and analyzed on the basis of information available on<br />
the topographical maps, namely sites 1-4.<br />
In the summer of 2012, a site visit was conducted by a team from GENIVAR Inc.<br />
(GENIVAR) comprising an engineer, biologists and a botanist to locate potential new<br />
sites and to make an inventory to determine which site would have the fewest<br />
environmental issues. Sites A to E were then identified<br />
The following sections draw a general portrait of these sites and present a<br />
comparative analysis.<br />
3.2.2 Description and location of sites 1 to 4<br />
Site 1 was to be installed on the wharf built in the fall of 2011 in the context in which<br />
port infrastructures (wharf and ore concentrate hall) were to be built on site Q2.<br />
However, in the summer of 2012, it was decided to build the concentrate hall<br />
according to what had been presented in the 2007 ESIA and authorized by provincial<br />
authorities. Thus, site 1 could not be considered as a potential site for the<br />
management of dredged sediments.<br />
Scenario 2 consisted of building a basin behind the concentrate hall then proposed<br />
on site Q2. This scenario was not chosen due to the fact that excessive blasting<br />
would be required.<br />
Site 3 was located to the east of the petrol station and was to be built on the side of<br />
the hill, south of the existing road. The concept proposed in March 2012 also<br />
included the blasting of a large amount of rock. In addition, a survey done in this<br />
sector by Golder and Associates in December 2008 revealed a deep layer of clay. It<br />
was therefore considered preferable to avoid this area and not to consider site 3 as a<br />
potential sediment management site.<br />
Canadian Royalties Inc.<br />
GENIVAR<br />
101-53046-02 November 2012<br />
14
Site 4 was the most remote of the 4 proposed sites, about 7 km from Q1. To get<br />
there, a road of about 1.5 km in length would have to be built from the existing road.<br />
Of all of the sites proposed in the spring of 2012, only site 4 was considered as a<br />
potential sediment management site for the purpose of this environmental<br />
assessment.<br />
3.2.3 Description and location of sites A to E<br />
Apart from site 4, five other potential sites for the management of dredged sediments<br />
were included in field surveys in the summer of 2012. Map 2.1 shows the location of<br />
each site.<br />
Site A is located opposite the petrol station, on the south side of the existing road.<br />
About 262,000 m 3 of rock originating from blasting operations conducted in the<br />
summer of 2010 is currently stored there. This site is approximately 650 m from<br />
site Q1.<br />
Site B is also located along the existing road, southeast of Site A and about 1.3 km<br />
from the proposed port infrastructure. However, due to the small area available, a<br />
large amount of rock would have to be blasted to create a hole big enough to hold<br />
the volume of dredged sediments.<br />
Sites C, D and E are located on the hill along Deception Bay to the southwest, in<br />
hollows of the existing terrain. These sites form natural holes requiring minimal<br />
blasting. However, the construction of access roads is required for each of these<br />
sites. The approximate length of these roads is 0.3 km for site C, 1.4 km for site D<br />
and 1.8 km for site E.<br />
3.2.4 Comparative analysis of variants<br />
These six variants (sites 4, A, B, C, D and E) were compared according to<br />
environmental and technical criteria. A score ranging from 1 to 3 was given to each<br />
criterion for each site, with 3 being the best option and 1 the worst. The criteria were<br />
considered equivalent to each other. The variant with the best score was retained,<br />
the maximum score being 36.<br />
Site A proved to be the most advantageous, with a score of 35.<br />
Table 3.2 presents the analysis of the scenarios.<br />
Canadian Royalties Inc.<br />
GENIVAR<br />
101-53046-02 Novembre 2012<br />
15
Table 3.2 Variance analysis - Terrestrial sediments deposit<br />
Preliminary document<br />
Sediment volume estimated at 50 000 m 3<br />
Site 4<br />
Score<br />
Site A<br />
Score<br />
Site B<br />
Score<br />
Site C<br />
Score<br />
Site D<br />
Score<br />
Site E<br />
Score<br />
Environnement<br />
E1 - Impact on wildlife and marine<br />
High<br />
Migratory corridor for caribou<br />
1 Low 3<br />
High<br />
Blasting required near the bay<br />
1<br />
Medium,<br />
potential migratory corridor for caribou<br />
2<br />
Medium,<br />
potential migratory corridor for caribou<br />
2<br />
High,<br />
potential migratory corridor for caribou and<br />
presence of a freshwater body<br />
1<br />
E2 - Species at risk: wildlife and vegetation None 3 None 3 None 3<br />
Suitable site for the establishment of<br />
species at risk<br />
2<br />
Suitable site for the establishment of<br />
species at risk<br />
2 Presence of a falcon nest 1<br />
E3 - Impact on vegetation<br />
Low<br />
Relatively bare ground<br />
3<br />
Low<br />
Relatively bare ground and disturbed area<br />
3<br />
Medium<br />
Well-developed vegetation cover<br />
2<br />
Medium<br />
Small slope ground, Well-developed<br />
vegetation cover, presence rocky hillside<br />
2<br />
Medium<br />
Small slope ground, Well-developed<br />
vegetation cover, presence rocky hillside<br />
2<br />
Medium<br />
Small slope ground, Well-developed<br />
vegetation cover, presence rocky hillside<br />
2<br />
E4 - Archaeological potential<br />
High, sensitive environments due to the<br />
presence of a protected archaeological site<br />
1 Low 3 Low 3 Low 3 Low 3 Low 3<br />
E5 - Visual integration to landscape<br />
Integration to the landscape is difficult<br />
because it's visible from a great distance<br />
1 Easy integration to the landscape 3 Visual breakthrough from Inuit camps 2<br />
Site dissimulated but access road partially<br />
visible<br />
2<br />
Site dissimulated but access road partially<br />
visible<br />
Presence of inuksuit (2) possibly used by<br />
the Inuit as ATV or snowmobile trail tag<br />
2<br />
Site dissimulated but access road partially<br />
visible<br />
2<br />
E6 - Air quality, acoustic environment (Inuit<br />
camp distance from the Bombardier beach)<br />
2.5 km 3 2.8 km 3 2.3 km 3 2.0 km, access road at 1.65 km 2 1.7 km, access road at 0.5 km 2 2.1 km, access road at 0.5 km 2<br />
E7 - Road safety - risk of accidents related to<br />
transportation<br />
Longer route<br />
The highest risks<br />
1<br />
Shortest route<br />
Lowest Risks<br />
3<br />
Relatively short route<br />
Relatively low risks<br />
3<br />
Medium length route<br />
Medium risks<br />
2<br />
Long route, significant slopes<br />
High risks<br />
1<br />
Longest route, significant slopes<br />
High risks<br />
1<br />
Technical<br />
T1 - Accessibility, roads<br />
Route with a length of the order of 1.5 km to<br />
construct<br />
Easy access 3 Easy access 3<br />
Route with a length of the order of 0.3 km to<br />
construct<br />
2<br />
Route with a length of the order of 1.4 km to<br />
construct<br />
1<br />
Route with a length of the order of 1.8 km to<br />
construct<br />
1<br />
T2 - Ownership, leases Off lease CRI 1 On lease CRI 3 Off lease CRI 1 Off lease CRI 1 Off lease CRI 1 Off lease CRI 1<br />
T3 - Water management<br />
A collection system and a conduit must be<br />
designed to concentrate and channel the<br />
dike resurgent water towards Deception<br />
Bay, environments rich in plant species<br />
must be avoided<br />
1 Low 3 Low 3<br />
A collection system and a conduit must be<br />
designed to concentrate and channel the<br />
dike resurgent water towards Deception<br />
Bay<br />
1<br />
A collection system and a conduit must be<br />
designed to concentrate and channel the<br />
dike resurgent water towards Deception<br />
Bay<br />
1<br />
A collection system and a conduit must be<br />
designed to concentrate and channel the<br />
dike resurgent water towards Deception<br />
Bay<br />
1<br />
T4 - Blasting<br />
Required for the construction of retention<br />
dykes, remote from the bay<br />
2 None 3<br />
Required to create a pit due to the limited<br />
space available, site located near the bay<br />
1<br />
Required to increase the depression and for<br />
the dikes construction, remote from the bay<br />
2<br />
Required to increase the depression and for<br />
the dikes construction, remote from the bay<br />
2<br />
Required to increase the depression and for<br />
the dikes construction, remote from the bay<br />
2<br />
T5 - Approximate area affected by the<br />
construction (site and road)- m 2 17 500 m2 1 47 900 m 2 2 10 340 m 2 1 44 260 m 2 2 16 840 m 2 1 44 650 m 2 2<br />
Total 18 35 26 23 20 19<br />
Note: Must be read with map 2.1 - Study Area
4. SCOPE OF THE ENVIRONMENTAL ASSESSEMENT AND<br />
CONSULTATIONS WITH THE INUIT<br />
4.1 Scope of the Environmental Assessment<br />
The environmental assessment focuses on the structures, work and activities listed<br />
below (the project):<br />
• The temporary and permanent port infrastructures (wharf) and the related<br />
facilities and work, including dredging;<br />
• Ore transshipment activities from the concentrate hall to the ships;<br />
• Navigation required to transport concentrated nickel and copper to overseas<br />
processing plants and the supply of goods, materials and petroleum products;<br />
• The construction of a land disposal site;<br />
• The transportation of dredged sediments and their disposal.<br />
The construction, operation, maintenance and modification phases are covered.<br />
When CRI mining activities come to an end in the area, the port infrastructures will<br />
be given to the regional government for its own needs.<br />
The components of the physical, biological and human environments of Deception<br />
Bay that could be affected by the project are included in the environmental<br />
assessment.<br />
Emphasis is placed on components highlighting the socioeconomic or ecosytemic<br />
point of view. These components are:<br />
• Marine mammals;<br />
• Land use by the Inuit for traditional purposes.<br />
The report is accompanied by five sectorial reports, which are presented in the<br />
Appendix. They cover the following topics:<br />
• Hydrodynamics (Appendix 7);<br />
• The underwater sound environment (Appendix 10);<br />
• Threatened or vulnerable vascular plant species (Appendix 13);<br />
• Avifauna (Appendix 14);<br />
• Archeology (Appendix 15);<br />
• Landscape (Appendix 16).<br />
Canadian Royalties Inc.<br />
GENIVAR<br />
101-53046-02 November 2012<br />
19
4.2 Public Consultations and Other Meetings with Stakeholders<br />
This section presents a summary of the public consultations and meetings organized<br />
by the CRI with various stakeholders on the construction of the mining complex and<br />
the port installations in Deception Bay, held since 2006.<br />
Since 2002, CRI has periodically met with the KRG, the Makivik Corporation and<br />
several other groups and decision makers from the Inuit villages most affected by the<br />
NNiP. Table 4.1 presents the dates, places and stakeholders that were met, and the<br />
topics discussed or addressed between August 2008 and October 2012.<br />
In 2006, consultations on the NNiP as a whole took place in the communities of<br />
Salluit, Kangiqsujuaq and Purvinituq. The results of these consultations are<br />
summarized in section 4.2.1. Public meetings and private interviews were held in the<br />
spring of 2012 by EEM Inc., consultant on corporate environmental and social<br />
responsibilities (section 4.2.2.). Section 4.2.3 summarizes the most recent meetings<br />
held in September 2012 in the communities of Salluit and Kangiqsujuaq.<br />
The majority of the requests and concerns of participants in the public consultations<br />
were taken into account by CRI. The Nunavik Nickel Agreement, signed in 2008 by<br />
CRI, the Landholding Corporation of Nunaturlik in Kangiqsujuaq, the Landholding<br />
Corporation of Qarqalik in Salluit and the village of Puvirnituq, provides a set of<br />
previsions relating to socioeconomic benefits (jobs, training contracts, etc.) and<br />
financial compensation. It also led to the establishment of a liaison committee which<br />
is a place for discussion between the signatories. Its members make sure the<br />
agreement is implemented. CRI conducts follow-ups on over 30 components of the<br />
NNiP and the environment, which aim to ensure the effectiveness of measures<br />
implemented to minimize the negative effects of the project and to provide corrective<br />
measures, if needed.<br />
Since November 2011, a monthly report about the activities and the performance in<br />
environment and health and safety at work has been sent to KRG representatives,<br />
the Landholding Corporations of Qarqalik and Nunaturlik, the villages of Salluit,<br />
Kangiqsujuaq and Puvirnituq, and the Makivik Corporation.<br />
Canadian Royalties Inc.<br />
GENIVAR<br />
101-53046-02 November 2012<br />
20
Table 4.1 Summary of meetings between CRI and stakeholders – August 2008 to October 2012<br />
Date Place Stakeholders Subject(s) discussed<br />
August 2008 • Causes and consequences of the event at the port site<br />
Kangiqsujuaq • Nunavik Nickel Liaison Committee • Announcement of the temporary closure<br />
June 2009 Montréal • Nunavik Nickel Liaison Committee<br />
• Update on the search for financial partners and the process of cleaning up the<br />
historical sites (FRAN)<br />
December 2009 Kuujjuaq • Nunavik Nickel Liaison Committee • Presentation of new partners and reiteration of the signing of the IBA<br />
July 2010<br />
Signatory villages • Inuit from the signatory villages of the • Contracts with Inuit firms<br />
and Kuujjuaq<br />
Nunavik Nickel Agreement<br />
• Jobs and subsidies that could be granted for social activities in the communities<br />
September 2010 Expo • Nunavik Nickel Committee • Update on the progress of permits and work, presentation of upcoming work.<br />
December 2010 Signatory villages • Nunavik Nickel Committee • Cancelled due to bad weather<br />
• Update on information about concerns, comments and questions from the different<br />
• Nunavik Nickel Liaison Committee<br />
February-March Expo and<br />
communities<br />
• Inuit from the signatory villages of the<br />
2011<br />
Signatory villages<br />
• Definition of workforce needs and training programs provided by CRI<br />
Nunavik Nickel Agreement<br />
• Project progress<br />
• Project progress, work completed and to come<br />
May 2011 Montréal • Nunavik Nickel Committee<br />
• Problems encountered in the summer of 2011<br />
• Process of awarding contracts<br />
• Training program<br />
October 2011 Puvirnituq • Nunavik Nickel Committee<br />
• Project progress<br />
• Problems encountered in the summer of 2011<br />
March 2012 Expo site • Nunavik Nickel Committee • No quorum – update on work and EHS performance<br />
March and May<br />
2012<br />
July 2012<br />
September 2012<br />
Signatory villages<br />
Salluit and<br />
Kangiqsujuaq<br />
Salluit and<br />
Kangiqsujuaq<br />
October 2012 Montréal<br />
• CRI team<br />
• Inuit from the signatory villages of the<br />
Nunavik Nickel Agreement<br />
• (≈ 50 pers./village)<br />
• Members of CRI management<br />
• Leaders of villages and landholding<br />
corporations<br />
• Stakeholders from KRG in environment<br />
and renewable resources<br />
• Member of CRI management<br />
• Leaders of villages and landholding<br />
corporations<br />
• Meeting with representatives of<br />
signatories of the Nunavik Nickel<br />
Agreement<br />
• Public presentations with question periods and discussions<br />
• Radio program<br />
• Reception of job applications<br />
• Private meetings with community leaders and other people to draw up a<br />
stakeholder map<br />
• Presentation of the port infrastructure construction project to receive comments<br />
• Revised wharf project (new concept to be built in 2013)<br />
• Presentation of the report on the stakeholder consultation<br />
• Among other things, presentation of the port infrastructure construction project to<br />
receive comments
4.2.1 Public consultations carried out by the CRI in 2006 in Salluit, Kangiqsujuaq and<br />
Purvinituq<br />
Public consultations were held from July 31 to August 12, 2006 in the villages of<br />
Puvirnituq, Salluit and Kangiqsujuaq. The groups that were met during these<br />
consultations were composed of members of municipal councils, landholding<br />
corporations, and the boards of directors of three village cooperatives.<br />
In Salluit, a focus group composed of village residents was formed, and some other<br />
people were interviewed individually. In Kangiqsujuaq, a local radio program was<br />
broadcast to introduce the NNiP to the population. The villagers were then asked to<br />
call in and share their concerns and expectations in relation to the project. A total of<br />
13 people participated in the radio program. Some organizations, such as the<br />
Makivik Corporation and the Association of Nunavik Landholding Corporations were<br />
met in Kuujjuaq.<br />
The meetings were conducted in English and discussions were translated, for the<br />
most part, into Inuktitut. On average, the duration of a meeting was two hours. All<br />
meetings began with an overview of the project, including the location and<br />
description of the major mining infrastructures. This presentation was then followed<br />
by discussions, mainly about the public’s concerns and expectations about the<br />
project.<br />
The main objective of the meetings was to discuss the stakeholders’ various<br />
concerns and expectations regarding the NNiP and the use of land and resources by<br />
the villagers of Salluit and Kangiqsujuaq. Affected populations also expressed their<br />
positive or negative experiences with the Raglan project.<br />
These consultations sometimes led to discussion on mitigation and compensation<br />
measures that could be considered throughout the implementation of the project.<br />
4.2.1.1 Concerns raised<br />
The concerns and expectations raised by stakeholders are grouped around the<br />
different themes that were discussed at the meetings. In 2006 and 2007, the majority<br />
of discussions focused on the mine site and concerns about Deception Bay.<br />
Access to Employment and Training<br />
Hiring<br />
Participants expressed specific concerns about the fact that hiring priority could be<br />
given to workers from the south. A sense of injustice was also reported with regards<br />
to the employment priority given to residents of Salluit and Kangiqsujuaq. It was also<br />
mentioned that Inuit employees have faced discrimination.<br />
Canadian Royalties Inc.<br />
GENIVAR<br />
101-53046-02 November 2012<br />
22
Several participants mentioned that the hiring of Inuit employees should be<br />
maximized. They believe that it is advantageous to promote the hiring of Inuit, in<br />
particular because of their adaptability to the North, which is a harsh environment.<br />
Some stakeholders mentioned that it was preferable to offer jobs to the whole<br />
population of Nunavik, without granting priority to certain villages, although a<br />
precedent was set with agreements relative to the Raglan mine, which prioritized the<br />
villages of Salluit and Kangiqsujuaq for hiring workers. Thus, according to<br />
stakeholders from Salluit, jobs should first be offered equitably to the villages of<br />
Salluit and Kangiqsujuaq, and then to the other villages of Nunavik. In light of other<br />
mining projects, people feared that unionizing the mine would put the Inuit at a<br />
disadvantage in terms of hiring. Workers from the south usually have more<br />
experience, which, the participants thought, could affect the Inuit. Participants said<br />
that they hoped their work experience and their skills would be recognized for hiring<br />
purposes.<br />
The people from Salluit said they feared that the jobs being offered to them only<br />
applied to goods and services at the mine, such as cleaning, cooking, etc. They<br />
hoped to have the opportunity to get jobs in the goods and services sector, but also<br />
in more specialized sectors, such as heavy machinery.<br />
According to some participants, the CRI may have trouble finding Inuit employees<br />
ready to work in the mine, since many already work or have worked at the Raglan<br />
mine and have said they would not be ready to do this type of work again and<br />
experience the same conditions. To facilitate the hiring of Inuit, offering better<br />
working conditions, such as short rotation periods, was suggested. However,<br />
according to some stakeholders from Kangiqsujuaq, young people were more<br />
interested in working in the new mine. It was also mentioned that employees who<br />
had been fired from the Raglan mine should have a second chance of being hired at<br />
the new mine.<br />
Training programs<br />
Since education is an important issue, some stakeholders indicated that mining<br />
activities should be part of secondary school training. Students could visit the mine<br />
and find out about work opportunities for the future.<br />
It was noted that training programs in partnership with the Kativik School Board<br />
(KSB) should be created. A variety of stakeholders suggested that the training<br />
programs should be relatively short and focused on training in the workplace in order<br />
Canadian Royalties Inc.<br />
GENIVAR<br />
101-53046-02 November 2012<br />
23
to keep the young students motivated. In addition to training programs, it was noted<br />
that summer jobs should be offered to young students to motivate them to continue<br />
their studies. Advertising campaigns could also contribute to motivating the young<br />
people to finish high school, continue their studies and then work at the mine.<br />
Finally, it was reported that well before the beginning of the construction phase, a list<br />
of typical jobs available should be distributed in the villages so the young people<br />
could begin their training as early as possible in order to be ready for the mine<br />
opening.<br />
Labour relations<br />
Like what happened in other mining projects, people expressed concern in 2006 that<br />
labour relations would be difficult between employees from the south and the Inuit.<br />
They anticipated competition for jobs, fearing that the employees from the south, not<br />
wanting to lose their jobs to the Inuit, would exhibit discriminatory behavior.<br />
A cultural exchange program with the employees was suggested by participants in<br />
order to explain the Inuit cultural context and its values, and provide information on<br />
traditional customs. This type of program had already been implemented at the<br />
Raglan mine and was considered very positive. Participants in the 2006<br />
consultations also suggested that a liaison agent be hired to manage conflicts and<br />
promote understanding between workers from the south and the Inuit.<br />
Turnover<br />
According to different stakeholders, the high turnover rate for Inuit employees at the<br />
Raglan mine could be partially due to difficult labour relations. This phenomenon was<br />
attributed to the fact that the Inuit are very close to each other and that when a<br />
negative event happens in the community or one person has a problem, all of the<br />
community members are affected. They then tend to leave their jobs to be closer to<br />
their people.<br />
Effect of job creation on the villages<br />
Comments on the positive or negative effects of jobs created in the Inuit villages<br />
were discussed.<br />
According to some, job creation in the villages could contribute to increasing social<br />
problems, such as alcohol and drug abuse, since people would have more money to<br />
spend. Others felt that job creation could contribute to reducing social problems<br />
because people are busy working.<br />
Canadian Royalties Inc.<br />
GENIVAR<br />
101-53046-02 November 2012<br />
24
Some believe that job creation will stimulate the local economy and bring more<br />
money into the villages. This improvement to the local economy will allow a greater<br />
variety of products to be offered to the population.<br />
4.2.1.2 Business opportunities and the local economy<br />
Companies<br />
Most stakeholders expressed the fear that the majority of contracts related to the<br />
project would be granted to companies in the south. They feared that Rouyn-<br />
Noranda would be the city that would benefit most from the project, as was the case<br />
for the Raglan mine.<br />
Stakeholders from Puvirnituq and Salluit noted that there are several companies in<br />
these two villages, and in all of Nunavik, which could meet the mine’s various needs<br />
(diesel supply, construction of workers’ camps and building maintenance, air<br />
transport, heavy machinery operation, etc.). New companies could also be created to<br />
produce energy (hydraulic or wind). It was also mentioned that all of the goods and<br />
services provided to the mine could come from Salluit companies. It was recalled<br />
that the contracts should be offered to the private sector and not only to landholding<br />
corporations or to the Makivik Corporation. Several stakeholders thought it essential<br />
to choose local companies for mine contracts, especially those that are 100% owned<br />
by Inuit, as stipulated in the JBNQA.<br />
Involvement and Investments<br />
Residents of the villages of Puvirnituq, Salluit and Kangiqsujuaq said they wanted to<br />
be involved in the project and some were even interested in being on the board of<br />
directors. Several stakeholders also showed interest in making corporate and private<br />
investments in the mining company.<br />
Benefits and Royalties<br />
Residents of the villages of Salluit and Kangiqsujuaq said they expected to receive<br />
significant royalties. They would like to obtain more benefits than in the context of the<br />
Raglan mine.<br />
The Inuit of Salluit said they were ready to negotiate. According to them, it would be<br />
more profitable for the community to accept the arrival of such a project and to<br />
negotiate benefits and royalties to compensate for the impacts. The negotiations<br />
should involve the population, rather than just the municipal council and the<br />
Canadian Royalties Inc.<br />
GENIVAR<br />
101-53046-02 November 2012<br />
25
landholding corporation. The people of Salluit fear that the benefits and royalties<br />
received by the new mining project will not be collected by the landholding<br />
corporation.<br />
Members of the Kangiqsujuaq community would like to have a greater part of the<br />
royalties than the village of Salluit, since they believe that their community will be<br />
more affected by the project. They would also like the royalties received to be<br />
distributed to the families to counteract poverty, instead of investing the money in<br />
village infrastructures.<br />
Others felt that the royalties should be offered equally to all of the villages in<br />
Nunavik. No priority should be granted to the villages of Salluit and Kangiqsujuaq.<br />
However, according to the Makivik Corporation, since a precedent was set with the<br />
Raglan mine favouring the villages most affected by the mine (Salluit and<br />
Kangiqsujuaq), it would be very difficult to proceed otherwise and involve all of the<br />
villages in Nunavik equally for the new mining project.<br />
Finally, in light of other mining projects, people fear that certain aspects that were<br />
negotiated or agreed upon with the mining company will end up being forgotten and<br />
not respected.<br />
Opportunities for the Local Economy<br />
The arrival of a new mine is perceived by most of the people who were met as a<br />
project promoting job creation and offering good opportunities, especially for young<br />
people.<br />
Instead of providing air transportation to the mine for employees from Salluit, the<br />
people of Salluit would prefer a road to be built between Salluit and Deception Bay.<br />
According to the stakeholders who were met, this road would have several<br />
advantages. For example, it could:<br />
• Allow villagers to get to work at the mine more easily;<br />
• Allow workers to go back to their villages more often;<br />
• Reduce the village’s costs for food supplies, construction equipment and heavy<br />
machinery for the village;<br />
• Allow people to travel more easily to their hunting and fishing areas;<br />
• Promote tourism in the village by making it more accessible;<br />
• Promote opportunities for creating new businesses.<br />
Canadian Royalties Inc.<br />
GENIVAR<br />
101-53046-02 November 2012<br />
26
Kangiqsujuaq stakeholders also suggested that a road be built between Wakeham<br />
Beach and the new mine. This road would be useful to mine employees who live in<br />
Kangiqsujuaq, and also to tourists who wish to visit Parc national des Pingualuit. The<br />
new mine could thus contribute to promoting tourism. Tourists could even include a<br />
visit to mine infrastructures in their tour.<br />
Kangiqsujuaq stakeholders said they would like CRI to build a wharf at Douglas<br />
Harbour instead of Deception Bay.<br />
4.2.1.3 Environmental impacts and impacts on the practice of traditional activities<br />
Participants mentioned that nowadays, mine projects must respect the environment<br />
to be allowed to continue their activities. They expect that the permit application<br />
process will be respected to ensure that the environment is adequately protected.<br />
People hope that the promoter will learn from errors that occurred at the Raglan<br />
mine, especially in terms of the management of mining residues (dust that can affect<br />
the quality of the water) and accidental spills.<br />
According to some stakeholders, an open-pit mine is much more damaging to the<br />
environment than an underground mine. Necessary measures to protect the<br />
environment must be taken. The main concerns about the effects of the mine on the<br />
environment are related to a change in water quality, potential contamination of fish,<br />
a change in air quality, potential contamination of caribou meat, and changes to the<br />
population’s hunting and fishing activities.<br />
Change in Water Quality<br />
Several stakeholders feared that mine tailings and mining activities in general affect<br />
the quality of water in the rivers and lakes. According to participants, water quality<br />
should be monitored in the waterways affected by the project before the project<br />
begins, and until the mine closes.<br />
Potential Contamination of Fish<br />
Stakeholders feared that changes in water quality could lead to contamination of<br />
migrating fish in the rivers.<br />
The people of Kangiqsujuaq fear that mining will have effects on fish populations,<br />
since for several years, dead fish have been seen in the Wakeham Bay River. At<br />
Wakeham Beach, dead crustaceans were also found on the coast. People question<br />
Canadian Royalties Inc.<br />
GENIVAR<br />
101-53046-02 November 2012<br />
27
the connection between these events and current mining activities. It is hoped that<br />
an environmental monitoring program of fish populations in the waterways affected<br />
by the project will be conducted to ensure that fish are not contaminated and that this<br />
contamination does not accumulate in people who eat the fish.<br />
Changes in Air Quality Due to Dust<br />
Air quality is also a concern. People fear that mine tailings will be dispersed by the<br />
wind and snow and that they will affect the natural environment. To limit the dispersal<br />
of mine tailings, it is proposed that they be converted into sand and gravel and<br />
placed in a strategic location, determined by the direction of dominant winds.<br />
In Kangiqsujuaq, the population is concerned about air pollution because yellow and<br />
brown clouds are sometimes seen in the sky over the bay. People wonder if these<br />
clouds are related to mining activities.<br />
A monitoring program on snow quality in Parc national des Pingualuit is suggested,<br />
since mine tailings are very fine and can be carried by the wind and snow over long<br />
distances.<br />
It was noted that the use of the road in the Deception Bay and Lac Watts area<br />
created more dust, which can affect the environment.<br />
Paving the road has been suggested as a mitigation measure. Transporting ore in<br />
closed trucks was also suggested. It was found that a canvas covering was not<br />
enough to prevent the dispersal of ore concentrate.<br />
Potential Contamination of Caribou Meat<br />
Several stakeholders who were met feared that the contamination of the<br />
environment by mine tailings could affect caribou meat.<br />
A monitoring program on the quality of caribou meat was suggested to make sure<br />
that it is not contaminated or that this contamination does not accumulate in people<br />
who eat caribou meat.<br />
Other Environment-Related Concerns and Expectations<br />
• The people of Kangiqsujuaq mentioned that the water reservoir seemed to be<br />
located in a shallow stream and in a topographical area that would not hold<br />
water. This spot did not seem like the best place for a reservoir.<br />
Canadian Royalties Inc.<br />
GENIVAR<br />
101-53046-02 November 2012<br />
28
• The importance of concluding a long-term agreement between Xstrata Nickel<br />
and CRI for the use of existing port infrastructures was mentioned several times.<br />
Several stakeholders thought it would be preferable to consider the use of<br />
existing infrastructures to minimize impacts on the environment.<br />
• The Makivik Corporation also underscored that in Nunavik nearly 600 abandoned<br />
mining exploration sites continue to pollute the environment.<br />
Some stakeholders suggested that during the construction phase, the incinerator<br />
and water treatment plant should be built first. A recycling process (tires, used<br />
oil, etc.) should be established early in the project. In addition, on the<br />
construction sites, vehicle engines should be turned off when the vehicles are not<br />
running. Finally, it was reported that all buildings should be properly insulated to<br />
minimize heat loss.<br />
• Stakeholders from Salluit and Kangiqsujuaq expect impacts on the landscape to<br />
be minimized by restoring the affected areas as much as possible. They believe<br />
that the rehabilitation of mine sites should begin as soon as the mine is closed,<br />
by filling the mine pits with sterile tailings to return the sites to their original state.<br />
4.2.2 Consultation with communities, stakeholders and regional representatives –<br />
spring 2012<br />
The consultation activities carried out by the MES took place from March 19 to 23,<br />
and May 22 and 23, 2012 in the communities of Kangiqsujuaq, Salluit and<br />
Puvirnituq. They also involve Inuit workers from the mine. These activities include<br />
public meetings, individual meetings with stakeholders (government, local,<br />
landholding corporations, healthcare, economic and environmental), a radio program<br />
(in Kangiqsujuaq) and telephone interviews with a variety of regional representatives.<br />
Participants in the public meetings were invited to share their main concerns about<br />
the NNiP and its impacts. They are summarized below:<br />
• Water: wastewater treatment (at the mining facilities and those of Deception<br />
Bay), proximity of the petroleum station to Deception Bay, effects on snowmelt<br />
during the hunting season.<br />
• Air: dust generated by mining activities and the discharge of polluting particles<br />
into the air during blasting.<br />
• Wildlife: the impacts of mine tailings (mercury) on the quality of water and fish<br />
and on the birds that frequent the settling ponds, the health of animals in general,<br />
and changes in migration routes (caribou).<br />
• Parc du Pingualuit: general impacts on its environment and on tourism.<br />
Canadian Royalties Inc.<br />
GENIVAR<br />
101-53046-02 November 2012<br />
29
• Land use: impacts on relations with the land its use due to fears of<br />
contamination, impacts on subsistence activities near the mine and navigability<br />
near the Deception Bay pier (partially collapsed).<br />
• Inuit workers: racism, stress, language problems, tensions between the Inuit,<br />
difficulty contacting families from the mine.<br />
• Health problems related to the influx of money in the communities: drug and<br />
alcohol abuse, violence, pressure on social services, corruption.<br />
• Economy: sharing monetary compensation and economic benefits for too short a<br />
time.<br />
• Employment: Poor quality jobs, insufficient training to allow access to better jobs,<br />
inadequate hiring, dismissal without notice.<br />
• Positive impacts: jobs generated by the mine encourage people with drug and<br />
alcohol problems to regain control, local hiring, benefits related to monetary<br />
compensation.<br />
The stakeholders and the regional representatives interviewed were invited to make<br />
recommendations on the management of various aspects of the project, to express<br />
the needs of the communities and the challenges they face, and to give their advice<br />
as to the role mining companies should play in their development.<br />
Recommendations on the management of the project were based on:<br />
• The involvement of the Inuit in environmental management (impact assessment<br />
and monitoring);<br />
• The location of port infrastructures;<br />
• Opportunities for fish compensation projects;<br />
• Mitigation measures affecting wildlife;<br />
• Employment, work conditions and training;<br />
• The development of better collaboration between the CRI and the Inuit;<br />
• Economic benefits for communities.<br />
The following needs and challenges of the communities were raised:<br />
• Social problems: drug and alcohol abuse, high crime rates, population growth.<br />
• Culture: loss of traditional knowledge and methods.<br />
• Infrastructures: housing shortages, overcrowded houses, lack of public meeting<br />
places and infrastructures in general (Salluit and Puvirnituq).<br />
• Economy: cost of transporting goods and people, job creation and training<br />
programs.<br />
Canadian Royalties Inc.<br />
GENIVAR<br />
101-53046-02 November 2012<br />
30
The proposals made by the stakeholders and regional representatives on the role<br />
that mining companies should play on community development:<br />
• Provide support in resolving social problems, the development of public<br />
infrastructures (swimming pools, meeting places) and the construction of<br />
housing.<br />
• Education: establish a fund to help people get an education (bursaries) in the<br />
mining sector, help develop education infrastructures (college), sponsor and<br />
support summer and science camps.<br />
• Participate in the construction of roads between Kangiqsujuaq and the mine and<br />
between Salluit and Deception Bay.<br />
Finally, participants in the consultations had the opportunity to express their opinions<br />
on the exercise they were invited to participate in, and their ideas on the follow-up<br />
that the CRI should provide. In general, participants expressed their satisfaction with<br />
the consultation and said they hoped that greater efforts would be made to better<br />
inform communities about the project (using the wide range of tools available). They<br />
also said that they wanted to be more involved.<br />
4.2.3 Meetings held in Salluit and Kangiqsujuaq in September, 2012<br />
In September, 2012, a member of the CRI management team met leaders of the<br />
villages and landholding corporations of Salluit and Kangiqsujuaq to present them<br />
with the revised port infrastructure project, and the stakeholder consultation report.<br />
In Kangiqsujuaq, the CEO of the landholding corporation, Aloupa Kulula, had no<br />
specific comments. He found it interesting that the current design causes less impact<br />
than the design of 2007. He appreciated that the CRI had sent the consultation<br />
report to stakeholders. Mary Pilurtuut, Mayor of NV Kangiqsujuaq, was also met. The<br />
new port infrastructure concept and the consultation report were presented to her.<br />
She said she would forward the information to the municipal councilors.<br />
A meeting that was scheduled with Charlie Alaku, President of the Landholding<br />
Corporation, did not take place. In Kangiqsujuaq, individual meetings were held on<br />
September 15 and 17, 2012 with two representatives of the landholding corporation<br />
and one representative of the municipal council. They did not make any specific<br />
comments after the presentation of the future port facilities. One of them said that he<br />
appreciated the fact that the concept seemed to have fewer impacts on Deception<br />
Bay than the 2007 proposal.. They also appreciated receiving the consultation<br />
report. In general, these representatives appreciated being informed of the various<br />
project options, including those on the choices of the dredged sediment<br />
management site.<br />
Canadian Royalties Inc.<br />
GENIVAR<br />
101-53046-02 November 2012<br />
31
Meetings were held in Salluit on September 18, 2012 with two representatives of the<br />
landholding corporation and one representative of the municipal council. These<br />
representatives said they appreciated the new wharf concept and the fact that the<br />
footprint of permanent infrastructures in Deception Bay was reduced, compared to<br />
the old concept. They also appreciated the decision to reuse pieces of the current<br />
temporary wharf in the construction of the permanent wharf.<br />
The six alternatives studied for the dredged sediment management site, and the<br />
preferred options were presented. The possibility that these materials could be<br />
transported to China was also discussed, an option they preferred to the others. In<br />
the following few weeks, they hoped to visit the sites studied to make an informed<br />
decision. This visit did not take place; the representatives decided it was not<br />
necessary. The members of the board of directors of the landholding corporation<br />
stated their opinions on the two options they preferred. They said the final choice<br />
was up to the CRI. The transmission of the consultation report was appreciated,<br />
since some people had noted that the public needed more information about the<br />
environmental process.<br />
Canadian Royalties Inc.<br />
GENIVAR<br />
101-53046-02 November 2012<br />
32
5. METHODOLOGY<br />
This section describes the methods employed during various inventory campaigns<br />
conduced in the study zone. They focused especially on the physical and biological<br />
environments of Deception Bay. Other field inventories and campaigns made it<br />
possible to characterize certain components of the terrestrial environment, including<br />
special-status plant species, avian fauna and the archeological potential. In the case<br />
of components of the environment that were the subject of sector reports<br />
(archeology, hydrodynamics, underwater sound environment, avian fauna, flora and<br />
landscape), the methods employed are described in these reports.<br />
Finally, the methodology used to assess the project’s effects on the environment is<br />
presented at the beginning of Section 8.<br />
5.1 Physical Environment<br />
5.1.1 Review and Analysis of the Existing Information<br />
To analyze the components of the physical environment, three main studies were<br />
consulted (Stantec, 2012; Stantec, 2011; Laboratoires d’Expertises de Québec<br />
ltée [LEQ], 2007). These expert studies were conducted within the context of<br />
geotechnical analyses for the drafting of design criteria for the future port<br />
infrastructures. The results of granulometric analyses coming from these studies, as<br />
well as the GENIVAR study (2012) were also considered. In addition, a study of<br />
the avalanche risk in the Deception Bay sector (NG1 and Sierra Neige, 2010),<br />
the numerous existing information in the sector report and in the ESIA<br />
(GENIVAR, 2007a and b), and several scientific publications were consulted. Finally,<br />
the surface deposits were mapped by aerial photography on a scale of 1:10,000.<br />
5.1.2 Sedimentological and Oceanographic Survey Campaigns<br />
Since the presence of the future port infrastructures may cause an alteration of the<br />
local currents and rebalancing in sedimentary transition, modelling of the flow was<br />
proposed by CRI to better describe the currents in Deception Bay.<br />
This modelling also seeks to measure certain hydrodynamic parameters in order to<br />
meet two main objectives, namely:<br />
1. attempt to predict the behaviour of the dispersion plumes created during<br />
dredging work that will be performed for deployment of the wharf;<br />
2. evaluate the necessity of providing for maintenance dredging to maintain a<br />
sufficient water depth for ships.<br />
Canadian Royalties Inc.<br />
GENIVAR<br />
101-53046-02 November 2012<br />
33
To meet these objectives, a sedimentological and oceanographic survey campaign<br />
was conducted from July 30 to August 7, 2012 by GENIVAR. Thus, sediment core<br />
samples were taken and a description of the surface sediment of the seabed was<br />
produced. Water level measurements, bathymetric surveys, current measurements<br />
and physicochemical parameter readings were performed.<br />
5.1.3 Core Sampling and Description of Sediments<br />
The sampling campaign was conducted with a universal core head percussion corer.<br />
Two holes were bored at site Q1 (CO1 and CO2) and three holes at site Q2 (CO4,<br />
CO5 and CO6) (Map 5.1). The length of the core samples ranges from 20 cm to<br />
110 cm. The analysis results are presented in Appendix 4.<br />
The samples were transported to GENIVAR’s Québec City warehouse and a visual<br />
characterization of the different sedimentary units was performed. Six subsamples<br />
were taken and sent to the Université Laval sedimentology and geomorphology<br />
laboratory for granulometric analyses. The subsamples submitted are:<br />
• BD Q1_CO-1 0-10 cm;<br />
• BD Q1_CO-2 5-15 cm;<br />
• BD Q2_CO-5 10-25 cm;<br />
• BD Q2_CO-6 0-28 cm;<br />
• BD Q2_CO-6 28-34 cm;<br />
• BD Q2_CO-6 34-45 cm.<br />
A visual description of the seabed surface sediments was produced according to<br />
predefined records that account for the granulometric texture, compacity, wear and<br />
lithological nature of the sediments. The characterization was conducted at<br />
predefined stations of long transects in front of sites Q1 and Q2 (Map 5.1). The<br />
characterization was performed in two stages, first by direct observation of the<br />
seabed by the divers and then by the description of the first 15 centimetres of<br />
sediments collected with a grab at each station.<br />
5.1.4 Water Level Measurements<br />
The water levels were recorded at three locations in Deception Bay, for a period of<br />
more than 35 days with Solinst Levelogger Model 3001 sensors (LT F30/M10)<br />
(Map 5.2). This measuring campaign made it possible to correct the depths relative<br />
to the water levels recorded with the sensors and to express the bathymetric data<br />
relative to the Chart Datums.<br />
Canadian Royalties Inc.<br />
GENIVAR<br />
101-53046-02 November 2012<br />
34
A<br />
62°8'24"N<br />
74°41'0"W<br />
BH-102<br />
BH-101<br />
BH-117<br />
BH-103<br />
BH-113<br />
BH-104<br />
74°40'50"W<br />
BH-114<br />
BH-115<br />
Baie Déception /<br />
Deception Bay<br />
62°8'24"N<br />
62°8'30"N<br />
-28<br />
74°41'0"W<br />
A<br />
74°40'0"W<br />
74°39'0"W<br />
62°8'30"N<br />
62°8'22"N<br />
BH-105<br />
BH-108<br />
BH-106<br />
BH-116<br />
62°8'22"N<br />
Q1<br />
Baie Déception /<br />
Deception Bay<br />
C02<br />
BH-110<br />
BD1-1<br />
62°8'20"N<br />
C01<br />
BH-107<br />
BH-109<br />
BH-408<br />
BH-111<br />
BH-112<br />
BH-409<br />
BH-411<br />
62°8'20"N<br />
BD1-2<br />
B<br />
Q2<br />
62°8'18"N<br />
BD1-3<br />
Site Q1<br />
BH-424<br />
BH-423<br />
BH-410<br />
BH-412<br />
BH-414<br />
BH-419<br />
BH-413<br />
BH-416<br />
BH-415<br />
BH-417<br />
62°8'18"N<br />
62°8'0"N<br />
A<br />
BD2-5<br />
BD3-7<br />
BD3-9<br />
62°8'0"N<br />
0 20 40 m<br />
74°41'0"W<br />
74°40'50"W<br />
BH-420<br />
BH-418<br />
100<br />
BD3-9<br />
BD3-10<br />
B<br />
74°40'10"W<br />
74°40'0"W<br />
BD2-6<br />
62°8'10"N<br />
62°8'10"N<br />
200<br />
B<br />
Baie Déception /<br />
Deception Bay<br />
C06<br />
62°8'6"N<br />
62°8'8"N<br />
Site Q2<br />
C04<br />
C05<br />
62°8'6"N<br />
62°8'8"N<br />
62°7'30"N<br />
Échantillonnage / Sampling<br />
BH-102<br />
BH-414<br />
C02<br />
BD1-2<br />
Analyse physico-chimique /<br />
Physicochemical analysis (Stantec, 2012)<br />
Analyse granulométrique /<br />
Granulometric analysis (Stantec, 2012)<br />
Analyse granulométrique /<br />
Granulometric analysis (GENIVAR, 2012)<br />
Analyse granulométrique /<br />
Granulometric analysis (GENIVAR, 2007)<br />
Composantes du projet / Project Components<br />
Infrastructures portuaires projetées (variantes) /<br />
Proposed wharf (variants)<br />
Site de dépôt des sédiments (variantes) /<br />
Sediment disposal site (variants)<br />
700<br />
600<br />
500<br />
800<br />
300<br />
400<br />
C<br />
Projet Nunavik Nickel / Nunavik Nickel Project<br />
EIES pour l’aménagement d’infrastructures portuaires et<br />
la gestion des sédiments à la baie Déception /<br />
ESIA for the Deception Bay Wharf and Sediment Management<br />
Carte 5.1 / Map 5.1<br />
Localisation des stations d’échantillonnage de<br />
sédiment pour les analyses physico-chimiques et<br />
granulométriques / Sampling Stations Locations for<br />
Sediment Physicochemical and Granulometric Analysis<br />
0 100 200 300 m<br />
Projection : UTM, zone 18, NAD83<br />
Équidistance des courbes / Contour Interval : 50 pieds / feet<br />
62°7'30"N<br />
62°8'4"N<br />
62°8'4"N<br />
Zone d'étude / Study area<br />
Infrastructures existantes / Existing Infrastructure<br />
Infrastructures portuaires / Wharf<br />
E<br />
D<br />
Source :<br />
Base : BNDT, 1 : 50 000, 1976 à 1995**, © Sa Majesté la Reine du<br />
Chef du Canada, reproduit avec la permission de RNCan<br />
Inventaires et cartographie / Surveys and mapping : GENIVAR<br />
Fichier / File : 101_53046_EIES_BD_c5_1_sed_granulo_121120.mxd<br />
0 20 40 m<br />
74°40'10"W<br />
74°40'0"W<br />
Route / Road<br />
74°41'0"W<br />
74°40'0"W<br />
Novembre / November 2012<br />
74°39'0"W<br />
101-53046-02
5.1.5 Bathymetric Surveys<br />
Bathymetric surveys were conducted from a zodiac boat opposite sites Q1 and Q2<br />
and in front of Sensor No. 3 facing the CRI temporary camp (Map 5.2). These<br />
surveys were conducted with an ODOM, model HT 100 bathymetric echosounder,<br />
with a frequency of 200 kHz and a Z-axis precision of 0.1%. The DGPS<br />
(MobileMapper CX) linked to the echosounder offers an X-axis and Y-axis precision<br />
of less than 1.0 m.<br />
For each water depth measurement, the time and the position were also recorded<br />
simultaneously via the use of HYPACK hydrographic survey software. The use of<br />
this data concomitantly with the water level data from Sensors No. 2 and No. 3<br />
allowed adequate establishment of the depths relative to the Chart Datums.<br />
5.1.6 Current Measurements, Waves and Flow<br />
5.1.6.1 Drifters<br />
5.1.6.2 ADCP<br />
Several instruments (drifters, ADCP [Acoustic Doppler Current Profiler], turbidity<br />
sensor and CTD [conductivity, temperature, depth] sensor) were deployed to<br />
measure the currents, the waves and the physicochemical parameters of the water.<br />
The drifters are two metal plates laid out crosswise and attached to a float by a chain<br />
of a predetermined length, so that the device drifts freely with the currents. To<br />
characterize and visualize the flow of the surface currents, six drifters were placed at<br />
1 m (n = 3) to 3 m (n = 3) below the surface of the water.<br />
The drifters were launched several times during flood tide and ebb tide near sites Q1<br />
and Q2, and in front of the CRI temporary camp (Map 5.2). For each drifter, position<br />
coordinates were taken regularly with a GPS (Garmin model ETREX). This<br />
positioning data made it possible to visualize the trajectories of the drifters and<br />
deepen the knowledge of the bay’s surface currents.<br />
The speed and direction of the currents all along the water column were measured<br />
with a 300 kHz Workhorse Sentinel ADCP current profiler. This instrument, fastened<br />
to the boat and positioned by means of the DGPS, allowed measurements to be<br />
taken along transects. These transects are located at the entrance to Deception Bay<br />
(Transect 1) and near the future port facilities (Transect 2) (Map 5.2). The position of<br />
Canadian Royalties Inc.<br />
GENIVAR<br />
101-53046-02 November 2012<br />
37
these transects makes it possible to produce a general picture of the flow and<br />
exchanges of water between Deception Bay and Hudson Strait, and particularly to<br />
characterize the currents in front of sites Q1 and Q2. Several surveys were<br />
conducted along Transects 1 and 2. However, we should mention that the poor<br />
navigation conditions at the entrance to the bay limited the number of surveys of<br />
Transect 1.<br />
5.1.7 Turbidity and CTD Sensors<br />
The water quality profiles were produced with a YSI 600 OMS V2 turbidity sensor,<br />
used jointly with a Solinst model CTD (conductivity, temperature, depth) sensor.<br />
Vertical deployment of these sensors allows collection of several physicochemical<br />
measurements along the entire water column, i.e. temperature, conductivity,<br />
pressure and turbidity. The data collected allow production of turbidity, temperature<br />
and salinity profiles according to the depth. These profiles, considered in perspective<br />
with the tidal conditions at the time of the measurement, also allow interpretation of<br />
the source of water masses.<br />
These sensors thus were deployed several times at the centre of Transects 1 and 2.<br />
Additional profiles were produced near the mouth of the Deception River and facing<br />
sites Q1 and Q2. When the sensors were lowered, measurements were taken every<br />
2.5 m, down to the river bottom.<br />
Finally, water samples integrated into the entire water column were taken at<br />
25 stations to measure suspended particulate matter (SPM): 10 at site Q1, 10 at site<br />
Q2, two near the mouth of the Deception River and one in front of the CRI temporary<br />
camp. This data is intended to describe the natural variability of water quality and<br />
thereby assess the potential impacts of dredging operations during construction of<br />
the port infrastructures.<br />
5.2 Biological Environment<br />
5.2.1 Marine Environment<br />
5.2.1.1 Benthic Wildlife Inventory Protocols for 2007, 2008 and 2011<br />
Within the context of studies of the marine environment conducted in Deception Bay,<br />
several inventories of benthic invertebrate communities were conducted.<br />
Canadian Royalties Inc.<br />
GENIVAR<br />
101-53046-02 November 2012<br />
38
6<br />
74°50'0"W<br />
74°45'0"W<br />
74°40'0"W<br />
A<br />
74°42'0"W<br />
74°35'0"W<br />
74°41'0"W<br />
74°40'0"W<br />
74°30'0"W<br />
74°39'0"W<br />
62°12'0"N<br />
1<br />
Transect 1<br />
CTD-T1-2<br />
CTD-T1-3<br />
CTD-T1-4<br />
Xstrata<br />
Nickel<br />
62°12'0"N<br />
Mont de<br />
la Table<br />
Moosehead<br />
Islands<br />
62°8'30"N<br />
CTD-Q1-4<br />
CTD-Q1-3<br />
CTD-Q1-1<br />
CTD-Q1-2<br />
CTD-Q2-1<br />
CTD-Q1-5<br />
Q1 CTDP1<br />
CTD20<br />
Baie Déception /<br />
Deception Bay<br />
CTD9<br />
CTD32<br />
CTDP3<br />
CTDP2<br />
Transect 2<br />
CTDP4<br />
CTD-T2-1<br />
CTD-T2-2<br />
CTD-T2-3<br />
CTD-T2-4<br />
CTD21<br />
CTD22<br />
62°8'30"N<br />
62°10'0"N<br />
White<br />
Rock<br />
Pointe Théron<br />
62°8'0"N<br />
500<br />
400<br />
300<br />
200<br />
100<br />
200<br />
CTD19<br />
CTD600<br />
CTD-Q2<br />
A<br />
1200<br />
Q2<br />
600<br />
2<br />
CTD-Q2-2<br />
CTD18<br />
CTDP5<br />
CTD-Q2<br />
CTD-Q2-3<br />
CTD49<br />
62°8'0"N<br />
62°10'0"N<br />
0 150 300 m<br />
74°42'0"W<br />
74°41'0"W<br />
74°40'0"W<br />
74°39'0"W<br />
Échantillonnage / Sampling<br />
62°8'0"N<br />
600<br />
1<br />
CTD-T1-1<br />
CTD18<br />
CTDP5<br />
Composantes du projet / Project Components<br />
Infrastructures portuaires projetées (variantes) /<br />
Proposed wharf (variants)<br />
Infrastructures existantes / Existing Infrastructure<br />
74°50'0"W<br />
Sonde à niveau d'eau / Water level probe (2012)<br />
Station de profils verticaux /<br />
Vertical profile station (2012)<br />
Station de profils verticaux /<br />
Vertical profile station (2007)<br />
Station de mesure en surface /<br />
Surface measurement station (2007)<br />
Station temporelle / Temporal station (2007)<br />
Transect ADCP / ADCP Transect (2012)<br />
Site de dépôt des sédiments (variantes) /<br />
Sediment disposal site (variants)<br />
Zone d'étude / Study area<br />
Campement Inuit permanent /<br />
Inuit permanent camp<br />
Infrastructures portuaires / Wharf<br />
Route / Road<br />
Campement temporaire / Temporary camp<br />
Baie Kangirsugaarjuk /<br />
Careenage Arm<br />
74°45'0"W<br />
A<br />
550<br />
500<br />
Xstrata<br />
Nickel<br />
1200<br />
Q1<br />
A<br />
Q2<br />
B<br />
C<br />
E D<br />
74°40'0"W<br />
CTD29<br />
Baie Déception /<br />
Deception Bay<br />
150<br />
Plage du<br />
Bombardier<br />
CTD-RIV-2<br />
Chemin d'accès proposé /<br />
Proposed access road<br />
3<br />
CTD30<br />
CTD-CAMP<br />
200<br />
100<br />
Campement<br />
temporaire /<br />
Temporary<br />
Camp<br />
400<br />
300<br />
Site 4<br />
400<br />
300<br />
200<br />
600<br />
500<br />
74°35'0"W<br />
CTD31<br />
100<br />
700<br />
CTD-RIV-1<br />
Emissaire /<br />
Pipeline<br />
Ancien terrain d'aviation /<br />
Inactive Air Field<br />
Rivière Déception<br />
Projet Nunavik Nickel / Nunavik Nickel Project<br />
EIES pour l’aménagement d’infrastructures portuaires et<br />
la gestion des sédiments à la baie Déception /<br />
ESIA for the Deception Bay Wharf and Sediment Management<br />
Carte 5.2 / Map 5.2<br />
Localisation des stations d’échantillons de la<br />
physico-chimie de l’eau, des transects ADCP et<br />
des sondes à niveau d’eau /<br />
Location of Water Physicochemical Sampling Stations,<br />
ADCP Transects and Water Level Gages<br />
0 0,5 1 1,5 km<br />
Projection : UTM, zone 18, NAD83<br />
Équidistance des courbes / Contour Interval : 50 pieds / feet<br />
Source :<br />
Base : BNDT, 1 : 50 000, 1976 à 1995**, © Sa Majesté la Reine du<br />
Chef du Canada, reproduit avec la permission de RNCan<br />
Inventaires et cartographie / Surveys and mapping : GENIVAR<br />
Fichier / File : 101_53046_EIES_BD_c5_2_physico_eau_121120.mxd<br />
Novembre / November 2012<br />
101-53046-02 74°30'0"W<br />
62°8'0"N<br />
62°6'0"N<br />
500
74°40'0"W<br />
A<br />
74°42'0"W<br />
74°35'0"W<br />
74°41'0"W<br />
74°40'0"W<br />
74°30'0"W<br />
74°39'0"W<br />
Pointe Théron<br />
Xstrata<br />
Nickel<br />
A<br />
Xstrata<br />
Nickel<br />
400<br />
1000<br />
62°8'30"N<br />
BD16<br />
BD15<br />
BD05<br />
BD14<br />
BD04<br />
600<br />
BD03<br />
700<br />
BD17<br />
BD18<br />
BD01<br />
BD02<br />
Q1<br />
Baie Déception /<br />
Deception Bay<br />
62°8'30"N<br />
400<br />
500<br />
62°8'0"N<br />
500<br />
Q1<br />
A<br />
Q2<br />
100<br />
62°8'0"N<br />
200<br />
300<br />
500<br />
400<br />
300<br />
200<br />
100<br />
200<br />
A<br />
Q2<br />
BD06<br />
BD08<br />
BD10<br />
BD07<br />
BD09<br />
BD19<br />
BD20<br />
BD22<br />
BD21<br />
BD23<br />
62°8'0"N<br />
62°8'0"N<br />
B<br />
Baie Déception /<br />
Deception Bay<br />
0 150 300 m<br />
74°42'0"W<br />
74°41'0"W<br />
74°40'0"W<br />
74°39'0"W<br />
C<br />
1000<br />
E<br />
D<br />
Plage du<br />
Bombardier<br />
BD24<br />
BD12<br />
BD11<br />
BD13<br />
Ancien terrain d'aviation /<br />
Inactive Air Field<br />
BD25<br />
Échantillonnage / Sampling<br />
BD06<br />
1200<br />
Station d'échantillonnage des matières en<br />
suspension (MES) /<br />
Suspended solids sampling station<br />
200<br />
Projet Nunavik Nickel / Nunavik Nickel Project<br />
EIES pour l’aménagement d’infrastructures portuaires et<br />
la gestion des sédiments à la baie Déception /<br />
ESIA for the Deception Bay Wharf and Sediment Management<br />
Composantes du projet / Project Components<br />
Infrastructures portuaires projetées (variantes) /<br />
Proposed wharf (variants)<br />
Site de dépôt des sédiments (variantes) /<br />
Sediment disposal site (variants)<br />
Campement<br />
temporaire /<br />
Temporary<br />
Camp<br />
100<br />
Carte 5.3 / Map 5.3<br />
Localisation des stations d'échantillonnage des<br />
matières en suspension (MES), août 2012 /<br />
Suspended solids sampling stations location,<br />
August 2012<br />
Rivière Déception<br />
62°6'0"N<br />
Zone d'étude / Study area<br />
Infrastructures existantes / Existing Infrastructure<br />
Campement Inuit permanent /<br />
Inuit permanent camp<br />
Infrastructures portuaires / Wharf<br />
Route / Road<br />
Campement temporaire / Temporary camp<br />
74°40'0"W<br />
Chemin d'accès proposé /<br />
Proposed access road<br />
Site 4<br />
400<br />
300<br />
200<br />
74°35'0"W<br />
Emissaire /<br />
Pipeline<br />
100<br />
Source :<br />
0 300 600 900 m<br />
Projection : UTM, zone 18, NAD83<br />
Équidistance des courbes / Contour Interval : 50 pieds / feet<br />
Base : BNDT, 1 : 50 000, 1976 à 1995**, © Sa Majesté la Reine du<br />
Chef du Canada, reproduit avec la permission de RNCan<br />
Inventaires et cartographie / Surveys and mapping : GENIVAR<br />
Fichier / File : 101_53046_EIES_BD_c5_3_MES_121120.mxd<br />
Novembre / November 2012<br />
101-53046-02<br />
74°30'0"W<br />
62°6'0"N
In 2007, two distinct sampling methods were used to characterize the benthic<br />
diversity of sites Q1 and Q2. In July, video transects were conducted at site Q1. In a<br />
complementary operation, Ponar grabs (covering an area of 0.023 m 2 ) were<br />
deployed at seven stations distributed in this same sector. All this data made it<br />
possible to identify the benthic macrofauna found on the sediments (epibenthos),<br />
and in the sediments (endofauna) of the study zone. The Blue Mussel population<br />
present near sites Q1 and Q2 was also analyzed.<br />
Aquatic grass beds were inventoried between February and March 2008. Holes were<br />
bored in the ice with an auger to lower an underwater camera and take videos. The<br />
stations were distributed along isobaths of 2, 5, 12 and 20 m, determined from the<br />
marine charts of the Canadian Hydrographic Service (CHS). A complementary study<br />
was deposited in April 2008 (GENIVAR, 2008) to document these seagrass beds in<br />
the site Q3 sector.<br />
In 2011, the inventory was only conducted visually. From October 6 to 11, 2011, an<br />
underwater diving team proceeded with an inventory of marine fauna and flora at<br />
Q1 and Q2. Fifteen underwater videos were taken throughout the two sites.<br />
5.2.1.2 2012 Field Campaign – Benthic Fauna and Aquatic Grass Beds<br />
The August 2012 field campaign had the objective of collecting data to answer the<br />
questions raised after the 2011 ESIA was deposited. Most of these questions<br />
concerned the lack of quantitative faunal information (density and diversity). In the<br />
present case, given that the sea immersion option was abandoned, the benthic<br />
fauna was characterized only at sites Q1 and Q2.<br />
The field campaign was conducted on August 23 and 31 and divided into two distinct<br />
parts. In the first stage, eight video transects, four for each of the two sites, were<br />
conducted by underwater divers (Map 6.4). At each transect, a 30 cm x 30 cm<br />
quadrat was deposited six times. A distance of about 15 m separated the quadrats<br />
from each other. Transects 1 to 4 were characterized at site Q1 and Transects 5 to 8<br />
at site Q2 (Map 6.4).<br />
A stop motion video was taken for all quadrats. The divers thus were able to<br />
inventory the epibenthic fauna and the aquatic grass beds. The percentage coverage<br />
for each species composing the aquatic grass beds was noted.<br />
Once the analysis of the benthic fauna and flora was completed, a 2.4 L Ponar grab<br />
covering an area of 0.023 m 2 was deployed to collect a sample of the endobenthic<br />
fauna. The type of sediment present sometimes made grab sampling difficult. In the<br />
Canadian Royalties Inc.<br />
GENIVAR<br />
101-53046-02 November 2012<br />
43
24 attempts, eight refusals were encountered. A field technician immediately<br />
proceeded to sift the samples with a 0.5 mm mesh sieve. Stored in a formaldehyde<br />
solution buffered with seawater, the 16 samples then were sent to the benthic<br />
ecology laboratory of the Institut des Sciences de la mer de Rimouski (ISMER) to<br />
identify the collected organisms and estimate their density. The identification was<br />
performed with the greatest possible taxonomic precision.<br />
Data Entry and Analysis<br />
At the end of each work day, the divers entered the results regarding the grass beds<br />
and the epibenthic fauna directly in a database. Once validated, this database<br />
allowed production of Table 6.19 (subparagraph 6.2.1.2), which presents the grass<br />
bed coverage percentages.<br />
A similar method was performed for the epibenthic fauna. The divers thus entered<br />
the data as they observed it in order to produce Table 6.20 (subparagraph 6.2.1.2).<br />
Note that only occurrence data (presence or absence) is presented for this section.<br />
Concerning the endobenthic fauna, the ISMER laboratory was able to supply a<br />
database indicating all the species found and their respective densities. This data<br />
was converted into number of individuals /m 2 (Table 6.21; subparagraph 6.2.1.2).<br />
Diversity indices then were calculated on this database, via use of PRIMER 5<br />
statistical software (Primer-e-Ltd).<br />
5.2.2 Terrestrial Environment<br />
5.2.2.1 Special-Status Plant Species<br />
The plant inventories were conducted from July 20 to 25 and concerned site Q1,<br />
site Q2 and the terrestrial deposit sites 4 (including the route of the access road and<br />
of the drainage water outfall) and B (Map 1, Appendix 13), as well as Bombardier<br />
Beach from the existing camp site to the abandoned landing strip.<br />
All the sites listed above were inventoried, but the inventory effort mainly focused on<br />
site 4, the route of the access road and the route of the outfall. A total of 95 habitats<br />
distributed over 80 sites were inventoried. The main vegetation types were also<br />
characterized by 28 vegetation surveys.<br />
Canadian Royalties Inc.<br />
GENIVAR<br />
101-53046-02 November 2012<br />
44
5.3 Human Environment<br />
The data and information that served to describe the human environment was mainly<br />
taken from the ESIA and the sector reports produced in 2007 for the NNiP<br />
(GENIVAR, 2007a and 2007b). An update was produced, particularly based on the<br />
2011 Census data. In fall 2012, a failed attempt was made to update the data (by<br />
guided interviews) of the harvesting of Deception Bay resources by the Inuit of<br />
Salluit.<br />
Canadian Royalties Inc.<br />
GENIVAR<br />
101-53046-02 November 2012<br />
45
6. DESCRIPTION OF THE ENVIRONMENT<br />
6.1 Physical Environment<br />
6.1.1 Geology<br />
Regional Geological Framework<br />
The Deception Bay region overlaps two geological provinces: Hearne and Superior<br />
(Figure 6.1). Hearne Province is a craton 2 dating from the Archaean Eon<br />
(> 2.6 billion years [Ga]), which collided with Superior Province. This event is called<br />
the Trans-Hudson orogen and occurred about 1.6 Ga, at the end of the<br />
Paleoproterozoic Era (Landry and Mercier, 1992; Mouksil, 1996). Many overlap<br />
faults are thus present throughout the study region (Figure 6.2).<br />
Figure 6.1<br />
Geological provinces of Québec and tectonostratigraphic units<br />
(modified from GENIVAR, 2007 and Mouksil, 1996).<br />
2<br />
Ancient continental block<br />
Canadian Royalties Inc.<br />
GENIVAR<br />
101-53046-02 November 2012<br />
47
Figure 6.2 Lithology of the study site (modified from Lamothe, 2007).<br />
The region thus is divided into four main tectonostratigraphic units (Figure 6.1),<br />
namely, from south to north:<br />
1. autochthonous (preexisting) bedrock of Superior Province, mainly composed of<br />
igneous rocks;<br />
2. klippe forming the allochthonous lands of the Ungava Trough, i.e. the South and<br />
North Domains, mainly composed of sedimentary and volcanic rocks. The nickel<br />
and copper deposits are found in these units;<br />
3. the Kovic Antiform of the parautochthonous domain of Superior Province,<br />
meaning that the rocks of this zone were deformed but not displaced (overthrust)<br />
during the collision with Hearne Province;<br />
4. the Narsajuak Arc (or Terrane), composed of the bedrock of Hearne Province.<br />
Directly around Deception Bay, the overlap faults delimit the units of the Kovik<br />
Antiform to the south from the units belonging to the Narsajuaq Terrane farther north<br />
(Figure 6.2). The rocks found in the study zone belong to the Narsajuaq Terrane and<br />
are composed of metamorphic rocks, mainly gneiss and diorite, granodiorite and<br />
monzogranite intrusions (Figure 6.2).<br />
Seismicity<br />
The Deception Bay sector is located in a seismic zone 3, i.e. a zone where seismicity<br />
is of medium intensity. The peak ground acceleration (PGA), estimated for solid<br />
ground and for the rock, is presented in Table 6.1. PGA is a value expressed as a<br />
fraction of gravity (g) for foundation design (GENIVAR, 2007).<br />
Canadian Royalties Inc.<br />
GENIVAR<br />
101-53046-02 November 2012<br />
48
Table 6.1<br />
Design criteria chosen for infrastructure earthquake resistance<br />
Recurrence<br />
(years)<br />
Annual<br />
probability<br />
50-year<br />
probability<br />
PGA (solid ground)<br />
(g)<br />
PGA (rock)<br />
(g)<br />
100 0.01 0.40 0.022 0.16<br />
475 0.0021 0.10 0.066 0.048<br />
1,000 0.001 0.05 0.104 0.075<br />
2.475 0.0004 0.02 0.167 0.120<br />
6.1.2 Geomorphology<br />
6.1.2.1 Relief and Bathymetry<br />
Deception Bay is located in the James physiographic region in the vast natural<br />
region of the Ungava Plateau. This region’s coastline is dominated by the presence<br />
of imposing fjords 3 . Deception Bay is one of these deep valleys, 20 km long and<br />
opening into Hudson Strait (Map 6.1). The width of the bay varies, upstream to<br />
downstream, from 2 km to over 10 km. The bay is bounded by small rounded rocky<br />
hills peaking at 580 m of altitude. The slopes of these hills plunge almost directly into<br />
the bay, leaving little room for development of the shoreline, which generally is<br />
between 50 and 100 m wide. The bathymetric curves show that a steep talus slope<br />
surrounds Deception Bay. Finally, two major basins more than 80 m deep are<br />
separated by a sill less than 40 m deep (Map 6.1). These relief features are typical of<br />
the overdeepening of the valley’s bedrock by glacial flow.<br />
Directly in the study zone, the hills reach about 400 m (1,300’) of altitude (Map 6.1).<br />
The sector’s valleys are shallowly incised and have a relatively gentle slope.<br />
Completely upstream from the bay is the delta plain of the Deception River. In the<br />
port infrastructure implementation zone, the shoreline is hemmed in between two<br />
relatively steep hills. The valley between the two hills opens very close to site Q1<br />
and upland disposal site A. Finally, the slope between the shore and the road varies<br />
between 1:4 and 1:6.5 (GENIVAR, 2007a).<br />
The bathymetry in front of site Q1 shows a steep talus slope (1:10) to a depth of<br />
30 m (Map 6.1). Beyond this isobath, the slope becomes gentler. The talus seems to<br />
be incised by channels that could potentially convey sediments by gravity to the<br />
deep basins. Finally, the bathymetry in front of site Q1 shows the forms of the<br />
submarine slide that occurred in the summer of 2011 during the wharf construction<br />
work.<br />
3<br />
Deep U-shaped valleys, overdeepened by the passage of glaciers, their bottom filled with thick layers of<br />
glaciomarine deposits.<br />
Canadian Royalties Inc.<br />
GENIVAR<br />
101-53046-02 November 2012<br />
49
6.1.2.2 Stratigraphic Context and Surface Deposits<br />
The current rocky terrain of Deception Bay (both in the emerged and submerged<br />
environment) is mainly due to erosion of the bedrock over several glacial cycles. The<br />
loose deposits covering this rocky terrain are mainly the result of the last retreat of<br />
the Laurentide Ice Sheet and the invasion of the postglacial Iberville Sea. These<br />
latest phases of geological history left a relatively simple sequence of loose deposits.<br />
The sedimentary units identified by the core hole drilling campaigns conducted in<br />
front of sites Q1 and Q2 (Golder, 2007; Stantec, 2011; 2012) reflect these different<br />
phases.<br />
Table 6.2<br />
Typical sedimentary sequence of the Deception Bay region.<br />
Unit No.<br />
Sedimentary sequence<br />
4 Delta and shoreline deposits<br />
3 Distal glaciomarine deposits<br />
2 Proximal glaciomarine deposits<br />
1 Glacial deposits<br />
It should be noted that the processes that put in place the different sedimentary units<br />
identified in the core holes are regional in scope. The spatial range of these units is<br />
thus just as regional as the processes that led to their sedimentation. This is why all<br />
these units outcrop on the surface at clearly defined altitudes, as shown by the<br />
mapping of the surface deposits (Map 6.2).<br />
Glacial Deposits<br />
The oldest unit is till, a deposit left directly by the glaciers. This is a mixture of<br />
heterometric sediments that often includes boulders of metric size.<br />
Although till was not identified formally as a unit by Stantec (2011 and 2012)<br />
(Appendices 3 and 4), this unit nonetheless seems to appear at the base of certain<br />
core holes by the greater presence of boulders resting directly on the bedrock.<br />
Nonetheless, it is very likely that the latest glacial flows at the bottom of the fjord<br />
eroded the till layer.<br />
In the study zone, the mapping of the surface deposits shows that till covers the tops<br />
and slops of the hills (Map 6.2). The till layer is discontinuous, often allowing the<br />
rocky surface to appear. The places where the till is more than 1 m thick are more<br />
localized, and thin till is more frequently observed, even boulder fields resting directly<br />
on the rocky surface.<br />
Canadian Royalties Inc.<br />
GENIVAR<br />
101-53046-02 November 2012<br />
50
30<br />
74°45'0"W<br />
74°40'0"W<br />
74°35'0"W<br />
White Rock<br />
Projet Nunavik Nickel / Nunavik Nickel Project<br />
EIES pour l’aménagement d’infrastructures portuaires et<br />
la gestion des sédiments à la baie Déception /<br />
ESIA for the Deception Bay Wharf and Sediment Management<br />
Site 4<br />
Plage du<br />
Bombardier<br />
D<br />
C<br />
1300'<br />
E<br />
B<br />
1100'<br />
A<br />
Q2<br />
Q1<br />
Baie Déception /<br />
Deception Bay<br />
1050'<br />
Xstrata<br />
Nickel<br />
Baie<br />
Kangirsugaarjuk /<br />
Careenage Arm<br />
62°9'0"N<br />
Baie<br />
Kangirsugaarjuk /<br />
Careenage Arm<br />
Bathymétrie /<br />
Bathymetry (m)<br />
62°7'0"N<br />
0<br />
-10<br />
-20<br />
-30<br />
-40<br />
Pointe Théron<br />
Xstrata<br />
Nickel<br />
Q1<br />
A<br />
E<br />
Q2<br />
B<br />
C<br />
D<br />
Baie Déception /<br />
Deception Bay<br />
Plage du<br />
Bombardier<br />
62°9'0"N<br />
62°7'0"N<br />
Source :<br />
Base : BNDT, 1 : 50 000, 1976 à 1995**, © Sa Majesté la Reine du<br />
Chef du Canada, reproduit avec la permission de RNCan<br />
Inventaires et cartographie / Surveys and mapping : GENIVAR<br />
Fichier / File : 101_53046_EIES_BD_c6_1_relief_121120.mxd<br />
Novembre / November 2012<br />
101-53046-02<br />
Carte 6.1 / Map 6.1<br />
Relief et bathymétrie /<br />
Relief and Bathymetry<br />
Composantes du projet / Project Components<br />
Infrastructures portuaires projetées (variantes) /<br />
Proposed wharf (variants)<br />
Site de dépôt des sédiments (variantes) /<br />
Sediment disposal site (variants)<br />
Zone d'étude / Study area<br />
-50<br />
Infrastuctures existantes / Existing Infrastructure<br />
-60<br />
Campement Inuit permanent / Inuit permanent camp<br />
-70<br />
74°45'0"W -80<br />
0 0,8 1,6 km<br />
Projection : UTM, zone 18, NAD83<br />
74°40'0"W<br />
Équidistance des courbes / Contour Interval : 50 pieds / feet<br />
Site 4<br />
74°35'0"W<br />
Infrastructures portuaires / Wharf<br />
Route / Road<br />
Dépôt pétrolier /<br />
Fuel depot<br />
Aire utilisée pour le site de dépôt des sédiments /<br />
Area used for the sediment disposal site<br />
Étendue potentielle de la variante A /<br />
Potential area for site A<br />
Hall à concentré projeté /<br />
Proposed storage building<br />
Camp permanent futur /<br />
Future permanent camp<br />
50<br />
62°8'15"N<br />
30<br />
50<br />
60<br />
20<br />
10<br />
40<br />
Camp permanent futur /<br />
Future permanent camp<br />
Hall de concentré existant /<br />
Existing storage hall<br />
74°41'0"W<br />
Pont-barge /<br />
Bridge-barge<br />
Site<br />
Q1<br />
Cellule no. 1 /<br />
Sheet pile cell no. 1<br />
Système de défenses /<br />
Fendering system<br />
Barge<br />
Cellule no. 2/<br />
Sheet pile cell no. 2<br />
-30<br />
-15<br />
-10<br />
-20<br />
-5<br />
-25<br />
-30<br />
-35<br />
-40<br />
Baie Déception /<br />
Deception Bay<br />
74°40'0"W<br />
-40<br />
62°8'15"N<br />
70<br />
10<br />
Site Q1<br />
Bathymétrie /<br />
Bathymetry (m)<br />
40<br />
30<br />
40<br />
50<br />
20<br />
Site<br />
Q2<br />
Dépôt pétrolier /<br />
Fuel depot<br />
Site<br />
Q2<br />
-5<br />
-10<br />
-15<br />
-20<br />
-25<br />
-30<br />
-35<br />
-40<br />
Baie Déception /<br />
Deception Bay<br />
62°8'0"N<br />
0<br />
-5<br />
-10<br />
-15<br />
-20<br />
-25<br />
-30<br />
-35<br />
-40<br />
-45<br />
0 75 150 m<br />
Projection : UTM, zone 18, NAD83<br />
Équidistance des courbes / Contour Interval : 2 m<br />
Aire utilisée pour le site de dépôt des sédiments /<br />
Area used for the sediment disposal site<br />
74°41'0"W<br />
60<br />
70<br />
A<br />
10<br />
62°8'0"N<br />
74°40'0"W
400<br />
irsugaarjuk /<br />
nage Arm<br />
Xstrata<br />
Nickel<br />
600<br />
R<br />
Q1<br />
6R<br />
Q2<br />
74°40'0"W<br />
100<br />
200<br />
300<br />
400<br />
74°35'0"W<br />
500<br />
A<br />
R<br />
74°41'0"W<br />
Q1<br />
6R<br />
74°40'0"W<br />
Baie Déception /<br />
Deception Bay<br />
62°8'0"N<br />
62°6'0"N<br />
Dépôts de surface / Geological Surface Deposits<br />
8<br />
5A8<br />
3<br />
6R<br />
6A<br />
2<br />
5S<br />
5A<br />
1A<br />
R1A<br />
R<br />
AN<br />
Colluvial / Colluvial deposit<br />
Dépôt silto-argileux (colluvial) /<br />
Silty clay deposit (colluvial)<br />
Dépôt fluviatile / Fluvial deposit<br />
Dépôt littoral recent / Recent littoral deposit<br />
Dépôt littoral ancien / Ancient littoral deposit<br />
Paléodelta / Paleodelta<br />
Sable marin / Marine sand<br />
Dépôt silto-argileux / Silty clay deposit<br />
Till<br />
Till mince sur roc / Thin till<br />
Roc / Rock<br />
Anthropique / Anthropic<br />
Géomorphologie / Geomorphology<br />
Limite maximale de la mer postglaciaire d'Iberville /<br />
Maximal limit of the postglacial Iberville sea<br />
1A<br />
R<br />
R1A<br />
8<br />
R<br />
R1A<br />
1A<br />
R1A<br />
R<br />
R<br />
1200<br />
R<br />
R<br />
R<br />
R<br />
R<br />
A<br />
5A<br />
R<br />
8<br />
AN<br />
R<br />
R<br />
R1A<br />
8<br />
R<br />
1A<br />
6A6R<br />
R<br />
B<br />
R<br />
8<br />
Baie Déception /<br />
Deception Bay<br />
8<br />
C R R<br />
R<br />
R<br />
R1A 8<br />
6R<br />
8 R<br />
R<br />
8<br />
R<br />
8<br />
R1A<br />
R<br />
Plage du<br />
R<br />
R R<br />
2<br />
Bombardier<br />
E<br />
R<br />
R<br />
R<br />
8<br />
1A R<br />
R<br />
8<br />
D<br />
R<br />
R RR<br />
R<br />
R<br />
1A R1A<br />
8 R R<br />
R<br />
R<br />
1A<br />
R<br />
R<br />
1A R<br />
1A<br />
3<br />
8<br />
R<br />
R<br />
2<br />
1A<br />
8 2<br />
8<br />
2<br />
R1A<br />
R<br />
8<br />
6A<br />
2<br />
R R1A<br />
R<br />
2<br />
2<br />
5A8<br />
8<br />
2<br />
8<br />
3 5A<br />
8<br />
1A<br />
8<br />
8<br />
Chemin d'accès proposé /<br />
Proposed access road<br />
R1A<br />
6R<br />
R<br />
1A<br />
Campement<br />
temporaire /<br />
Temporary<br />
Camp<br />
R<br />
R<br />
5A<br />
R<br />
R<br />
5A<br />
R<br />
R<br />
R<br />
5A8<br />
8<br />
1A<br />
R<br />
R R<br />
R R<br />
R<br />
8<br />
R<br />
R<br />
5A<br />
R<br />
5A 8<br />
R<br />
Site 4<br />
R<br />
R<br />
R<br />
5S<br />
R<br />
R<br />
R<br />
6A<br />
Emissaire /<br />
Pipeline<br />
5A8<br />
R<br />
R<br />
R<br />
62°8'0"N<br />
R<br />
5A<br />
8<br />
R1A<br />
0 150 m<br />
R<br />
R1A<br />
74°41'0"W<br />
Ancien terrain d'aviation /<br />
Inactive Air Field<br />
3<br />
400<br />
5A<br />
AN<br />
1A<br />
R<br />
R<br />
R<br />
A<br />
8<br />
R<br />
Rivière Déception<br />
6A<br />
R<br />
Q2<br />
6R<br />
74°40'0"W<br />
62°8'0"N<br />
R<br />
62°8'0"N<br />
62°6'0"N<br />
Corridor d'avalanche de neige sèche /<br />
Avalanche area<br />
Corridor d'avalanche de neige humide /<br />
Sluch flow area<br />
Combe à neige / Snowbed<br />
400<br />
Projet Nunavik Nickel / Nunavik Nickel Project<br />
EIES pour l’aménagement d’infrastructures portuaires et<br />
la gestion des sédiments à la baie Déception /<br />
ESIA for the Deception Bay Wharf and Sediment Management<br />
Composantes du projet / Project Components<br />
Infrastructures portuaires projetées (variantes) /<br />
Proposed wharf (variants)<br />
1A<br />
Carte 6.2 / Map 6.2<br />
Dépôt de surface et géomorphologie /<br />
Surface deposits and geomorphology<br />
Site de dépôt des sédiments (variantes) /<br />
Sediment disposal site (variants)<br />
0 300 600 900 m<br />
Zone d'étude / Study area<br />
400<br />
Projection : UTM, zone 18, NAD83<br />
Équidistance des courbes / Contour Interval : 50 pieds / feet<br />
Infrastructures existantes / Existing Infrastructure<br />
Campement Inuit permanent /<br />
Inuit permanent camp<br />
Infrastructures portuaires / Wharf<br />
Route / Road<br />
74°40'0"W<br />
74°35'0"W<br />
Lac<br />
Duquet<br />
Source :<br />
Base : BNDT, 1 : 50 000, 1976 à 1995**, © Sa Majesté la Reine du<br />
Chef du Canada, reproduit avec la permission de RNCan<br />
400<br />
Inventaires et cartographie / Surveys and mapping : GENIVAR<br />
Fichier / File : 101_53046_EIES_BD_c6_2_depots_surf_121120.mxd<br />
Novembre / November 2012<br />
101-53046-02
Proximal Glaciomarine Deposits<br />
The core holes indicate a unit composed of silty sand with a proportion of 15 % to<br />
20 % gravel and boulders, resting discordantly on bedrock. The thickness of this unit<br />
ranges from 0.6 to 14 m (Stantec, 2011; 2012). This unit was sedimented at the very<br />
beginning of the marine invasion of the Iberville Sea, when the front of the ice sheet<br />
was located near Deception Bay, a little farther south of the study zone. This type of<br />
deposit does not outcrop on the surface of the study site.<br />
Distal Glaciomarine Deposits<br />
Distal glaciomarine deposits were sedimented from the time the level of the<br />
postglacial Iberville Sea reached its maximum altitude, i.e. 123 m relative to the<br />
current mean level, and thus less than 8,900 years BP 4 (Gray et al., 1993)<br />
(Map 6.2). These clayey silt deposits were sedimented in calm deep water. The core<br />
hole results also indicate that the thickness of this unit may reach 20 m<br />
(Stantec, 2012). According to the visual characterizations and the geotechnical tests<br />
conducted, these clays have a very soft consistency and no bearing capacity<br />
(Golder, 2007; Stantec, 2011; 2012).<br />
The glaciomarine clay unit generally outcrops on the surface of the seabed. The<br />
divers’ visual description, the description of the sediment core samples and the<br />
granulometric results show that the clay layer largely outcrops at sites Q1 and Q2<br />
(Appendix 4). On the terrestrial portion of the study zone, the glaciomarine clay<br />
appears completely east of the study zone in the Deception River Valley (Map 6.2).<br />
Delta and Shoreline Deposits<br />
The delta deposits are the deposits abandoned by the watercourses when they flow<br />
into the sea. They are mainly composed of sand and gravel. However, boulders of<br />
metric size may also be found there. These deposits are identified in the river valley<br />
of Bombardier Beach (Map 6.2). This delta, sedimented when the sea level was<br />
higher than at present, extends northwest of the Deception Bay shoreline (Map 6.2).<br />
It is divided by many terraces formed by downcutting of the river when the sea level<br />
fell. The presence of these terraces allows us to affirm that these deposits may be<br />
over twelve metres thick and cover the glaciomarine clay deposit units.<br />
4<br />
BP = Before Present<br />
Canadian Royalties Inc.<br />
GENIVAR<br />
101-53046-02 November 2012<br />
55
All long the shoreline, both in its emerged and submerged portions (-4 m deep), the<br />
glaciomarine clays are sometimes covered by a deposit unit composed of silt or<br />
sandy silt up to an average of 2 m thick, but up to 6 m in a few rare places<br />
(Stantec, 2011; 2012). This unit is also observed in the sediment core samples<br />
collected in front of sites Q1 and Q2 (Appendix 4). These deposits are associated<br />
with sedimentation in a shallow marine environment, i.e. when the Iberville Sea<br />
retreated gradually from the land, in response to glacio-isostatic uplift.<br />
The surface of this unit and the delta deposits of the Bombardier Beach River and<br />
especially those of the Deception River, were disturbed by the shoreline processes<br />
associated with the various sea levels. These former shoreline deposits are therefore<br />
elevated relative to the current sea level (Map 6.2).<br />
Colluvial Deposits<br />
All the surface deposits presented above have been subjected to different erosion<br />
agents since their placement. There are many of these colluvial deposits on the<br />
study site, mainly located on the hillsides or the talus slopes of the terraces<br />
(Map 6.2). They result from periglacial processes or mass movements resulting from<br />
the presence of mollisol. The processes that put the colluvial deposits in place are<br />
explained further in the next sections.<br />
6.1.2.3 Dynamic Terrestrial Geomorphology<br />
The presence of numerous colluvial deposits is evidence of the dynamics of the<br />
active processes in the study zone. The phenomena that could disturb the deposits<br />
are periglacial processes, hydrological processes and slope processes.<br />
Permafrost<br />
Deception Bay is in the continuous permafrost zone, meaning that the soil is frozen<br />
for a period of at least two consecutive years. The mean soil temperature remains<br />
lower than -5°C (Smith et al., 2004) and the ground is frozen to a depth of about<br />
500 m (Daigneault, 1997; Smith et al., 2004). The surface layer that thaws during the<br />
summer is called the “active layer” or mollisol. The thickness of the mollisol depends<br />
on the nature of the loose deposit. For example, according to Allard et al. (2004), the<br />
mollisol at Salluit reaches a thickness of 1.3 m in till, 2 to 3 m in fluvioglacial deposits<br />
and 0.6 to 1.1 m in clay. The soil drainage capacity is limited to this layer. In bedrock,<br />
the mollisol reaches a depth of 2.2 m (Lévesque et al., 1990). The forms associated<br />
with the periglacial phenomena in the region are boulder fields, ice lenses, frost<br />
cracks, sorted soils, ostioles and polygonal soils, as well as solifluction lobes (Gray<br />
and Seppälä, 1991). These forms are too small to be mapped.<br />
Canadian Royalties Inc.<br />
GENIVAR<br />
101-53046-02 November 2012<br />
56
Hydrography and Hydrology<br />
The rivers flowing directly into Deception Bay and located in the study zone are the<br />
Bombardier Beach River (Rivière de la Plage du Bombardier), a small torrent flowing<br />
in the Xstrata mine port infrastructure sector, a torrent flowing in the valley<br />
overlooking site Q1, and the Deception River. The biggest of these is the Deception<br />
River, which drains a watershed of 4,020 km 2 (Appendix 5).<br />
This river is subject to a regime typical of northern environments. The presence of<br />
permafrost and the sporadic and discontinuous presence of shrubby and<br />
arborescent vegetation favour surface water runoff instead of infiltration, thus<br />
causing accentuated flood peaks that dry up very quickly in the absence of rain<br />
(GENIVAR, 2007a). The annual streamflow regime is subject to the following<br />
conditions:<br />
• a very severe winter low-water period with streamflows of practically zero;<br />
• gradual melting of the snow cover between the beginning of June and the end of<br />
July;<br />
• a very severe summer low-water period occurring in August.<br />
In view of the very non-hilly terrain, the increase in streamflows translates more into<br />
widening of the flow section than a rising water level, which limits its sediment<br />
transport capacity. According to the streamflow characterization of the Deception<br />
River (Appendix 5), its annual mean streamflow would be 144 m 3 /s, while its 2, 10<br />
and 50-year flood recurrence is 246, 302 and 354 m 3 /s respectively. Its annual lowwater<br />
periods are especially severe, with a 2 and 10-year recurrence (value for<br />
seven consecutive days) of 1.3 and 0.7 m 3 /s respectively.<br />
Hydrogeology<br />
The interstitial water present in the rock fissures and in the surface deposits is frozen<br />
all year round, except during the seasonal thaw period, for a mollisol thickness<br />
limited to the first two metres. The thawed groundwater flows according to the paths<br />
of greatest permeability, especially in the sand and gravel interbeds and through<br />
boulders, in the interstices, regardless of whether they are filled with sand and<br />
gravel. Permafrost limits the percolation of water in the soil (RÉSÉ Nord, 2005),<br />
which favours surface drainage in the spring and early summer, and a lateral flow in<br />
the mollisol in midsummer and late summer (GENIVAR, 2007a).<br />
Canadian Royalties Inc.<br />
GENIVAR<br />
101-53046-02 November 2012<br />
57
Groundwater inflow mainly occurs during snowmelt and summer rainfall. At other<br />
times, the groundwater is frozen and immobile. The water inflow is conditioned by<br />
the nature of the soil. With rising spring temperatures, the snow cover becomes very<br />
permeable (minimal water retention) and much less resistant to heat transfer. The<br />
melt water percolates into the soil, and two situations then can be observed. When<br />
the snow cover rests on low permeability soil, an ice lens is formed at the base of the<br />
snow cover, which prevents direct percolation into the soil and favours interstitial<br />
lateral flow in the snow cover. This flow, which can be very rapid, given the high<br />
porosity of the mature snow cover, normally is towards watercourses and lakes.<br />
However in unsaturated permeable soils, the melt water percolates into the network<br />
of fissures and the pores, thus contributing to recharge the active layer. This water<br />
then flows laterally in contact with permafrost, depending on the permeability of the<br />
medium and the topography, to resurge at the base of slopes or into watercourse or<br />
lakes (GENIVAR, 2007a).<br />
In rainy periods, the water infiltrates until contact with permafrost and then flows<br />
laterally at resurges at the base of the talus slope. In the hollows, the water mainly<br />
flows on the surface, either on the saturated soils or accessorily under the surface. In<br />
the latter case, the water flows much more slowly via the network of sand and gravel<br />
veins and lenses (GENIVAR, 2007a).<br />
Slope Processes<br />
Slope processes depend on the climate conditions and terrain of the study zone. In<br />
this continuous permafrost region, dry snow avalanche, slush flow and mollisol<br />
rupture phenomena are especially active.<br />
In the study zone, three sectors are especially sensitive to avalanches. According to<br />
the NGI Sierra Neige report (2010), presented in Appendix 6, the most worrying<br />
sector due to its propensity for development of slush flow avalanches is located in<br />
the snow valley overlooking site Q1 (Map 6.2) . This type of avalanche, which is<br />
estimated to have a 100-year recurrence, is mainly triggered during spring thaws.<br />
The flows are known to be extremely erosive and have high sediment transport<br />
capacity. A destructive slush flow occurred very close to the Xstrata facilities in 2005<br />
(Figure 6.3).<br />
Canadian Royalties Inc.<br />
GENIVAR<br />
101-53046-02 November 2012<br />
58
Figure 6.3<br />
Debris cone from the 2005 slush flow, related to winter thaws<br />
(CEN, 2012).<br />
The other two sectors identified are more conducive to dry snow avalanches<br />
(Map 6.2). These avalanches, which have no sediment stripping and transport<br />
capacity, are by far less destructive and smaller in scale than slush flows. The<br />
recurrence periods are estimated at about 1,000 years (Appendix 6).<br />
Finally, mollisol ruptures mainly occur when the thaw reaches exceptional depths in<br />
the loose deposits, and especially in glaciomarine clayey silts. This type of deposit is<br />
particularly conducive to the growth of ice lenses. Since the permafrost ceiling is<br />
especially rich in ice, an enormous quantity of water that became liquid during the<br />
thaw period exerts a high interstitial pressure on the mollisol-permafrost interface,<br />
creating conditions favourable to mass movements. Mollisol ruptures could occur on<br />
slopes as shallow as 4° (L’Hérault, 2009). In the study zone, the aerial photographs<br />
taken in 2002 indicate that these processes are frequent, particularly on the<br />
southwest slope of the Deception River Valley, and along the terraces of the<br />
Bombardier Beach River paleodelta (Map 6.2).<br />
Canadian Royalties Inc.<br />
GENIVAR<br />
101-53046-02 November 2012<br />
59
6.1.3 Climate<br />
According to the Québec climate classification, the climate of the Deception Bay<br />
region is qualified as a semi-arid polar temperature climate with a very short growing<br />
season (Gerardin and McKenney, 2001). Very little climate data is available for<br />
Nunavik near the study zone. Data is collected daily at the Salluit village airport, but<br />
the recording periods are limited to airport operating hours and few parameters are<br />
measured. An EC station was already in operation at Deception Bay from 1963<br />
to 1973, but only precipitation and temperature were recorded. This data is 30 years<br />
old and probably does not reflect the current situation, due to climate change<br />
Nonetheless, it is presented and compared with data from neighbouring stations.<br />
6.1.3.1 Climate Means<br />
Air Temperature<br />
The annual mean temperature is -6.6 o C, while the mean minimum and maximum<br />
temperatures are -9.7 o C and -3.4 o C respectively (Table 6.3). The coldest month is<br />
February (-25.1 o C) and the warmest month is July (8.7 o C). These mean<br />
temperatures seem higher than those measured at Salluit (L’Héreault, 2009) and by<br />
interpolated data for the Iqualuit, Kuujjuaq and Quaqtaq stations, all estimated<br />
at -8.0 o C (Gray et al., 1988). Moreover, the temperatures measured at the Katinniq<br />
station (2000-2005) in the Raglan Mine region, give an annual mean of -9.5 o C<br />
(GENIVAR, 2007). However, the altitude of the mine region is 300 m higher than<br />
Salluit, which explains in part why its annual mean temperature is lower.<br />
Table 6.3<br />
Monthly and annual mean temperatures at Deception Bay from<br />
1963 to 1973.<br />
Air temperature<br />
Month<br />
(°C)<br />
Minimum Mean Maximum<br />
January -26.6 -23.3 -19.9<br />
February -28.5 -25.1 -21.7<br />
March -24.1 -19.9 -15.7<br />
April -14.3 -10.6 -6.9<br />
May -5.5 -2.4 0.7<br />
June 0.5 3.2 5.9<br />
July 4.6 8.7 12.7<br />
August 4.5 8 11.5<br />
September 0.8 3.4 5.9<br />
October -4.2 -2.1 0.0<br />
November -11.3 -8.7 -6.0<br />
December -20.5 -17.5 -14.5<br />
Annual -9.7 -6.6 -3.4<br />
Canadian Royalties Inc.<br />
GENIVAR<br />
101-53046-02 November 2012<br />
60
The number of degree-days at Iqaluit (Table 6.4), located at a latitude comparable to<br />
that of Deception Bay, indicates that the period favourable to vegetation growth is<br />
very short, limited to the period between late June and early September. The frostfree<br />
period is only 20 days (OPDQ, 1983 in FAPAQ, 2000).<br />
Table 6.4 Number of degree-days at Iqaluit (Climate normals 1971 to 2000).<br />
Month > 10°C > 5°C > 0°C < 0°C<br />
January 0 0 0 824.1<br />
February 0 0 0 792.5<br />
March 0 0 0 735.9<br />
April 0 0 0.5 443.5<br />
May 0 0 10.8 146.5<br />
June 1.4 21 112 4.8<br />
July 10.4 88.2 237.7 0<br />
August 5.5 64.1 210.9 0<br />
September 0 5.3 75.8 10.8<br />
October 0 0 5.7 156.7<br />
November 0 0 0.6 381.8<br />
December 0 0 0 700<br />
Precipitation<br />
Annual mean total precipitation in the Deception Bay region is 348.5 mm per year,<br />
including 129 mm of rain (37%) and 219.4 cm of snow (63%) (Table 6.5). The<br />
rainiest months are July and August. The snowfalls occurred from September to<br />
June, nearly every month of the year. Finally, the most abundant snowfalls occur in<br />
November, with a mean precipitation of 39.6 cm.<br />
Table 6.5 Mean precipitation at Deception Bay from 1963 to 1973.<br />
Month<br />
Rain<br />
Snow<br />
Total liquid precipitation<br />
(mm)<br />
(cm)<br />
(mm)<br />
January 0.0 15.5 15.5<br />
February 0.0 13.7 13.7<br />
March 0.0 18.4 18.4<br />
April 0.0 28.4 28.4<br />
May 2.7 14.4 17.1<br />
June 17.6 17.1 34.7<br />
July 39.8 0.0 39.8<br />
August 38.9 0.9 39.8<br />
September 22.9 13.7 36.6<br />
October 6.7 32.2 38.9<br />
November 0.5 39.6 40.1<br />
December 0.0 25.5 25.5<br />
Annual 129.1 219.4 348.5<br />
Canadian Royalties Inc.<br />
GENIVAR<br />
101-53046-02 November 2012<br />
61
The snow accumulations generally are disturbed by the wind and form compact. The<br />
snow accumulated on the exposed talus slopes and on the peaks is therefore blown<br />
to the more sheltered zones. The maximum thickness of the snow cover on the<br />
ground does not exceed one metre, on the average (FAPAQ, 2000).<br />
6.1.3.2 Wind Regime<br />
6.1.3.3 Sea Ice<br />
For the analysis of the wind regime, the data sources used come from the EC<br />
weather station at Salluit Airport and the Deception Bay data compiled from 1963<br />
to 1973 (Figure 6.4). The data available at Salluit is only diurnal (between 6 a.m. and<br />
8 p.m.) and often is deficient. However, this station is the one closest to Deception<br />
Bay and is located in a comparable environment (coastal bay). This is why the data<br />
coming from this station, although incomplete, is considered to be more<br />
representative than the data from other more remote stations located in different<br />
environments.<br />
The dominant winds come from the southwest, with a frequency of about 34 %, and<br />
a cumulative frequency of about 17 % for the west/southwest and south/southwest<br />
directions. They are followed by winds from the north/northeast, with a frequency of<br />
about 13 %. The dominant south/southwest component corresponds to what was<br />
evaluated for Deception Bay by Roche (1992) (Figure 6.4). However, the northwest<br />
and southwest components are more prominent in Deception Bay, probably due to<br />
the similar orientation of the bay, contrary to Salluit, which is oriented<br />
northeast/southwest.<br />
The Canadian Ice Service publishes charts presenting the average freeze-up and<br />
break-up dates for the Canadian North, and particularly for Hudson Strait. These<br />
charts use data for 1981-2010 and illustrate that the Deception Bay sector is subject<br />
to an ice regime for the average period between December 4 and July 2. In short,<br />
the sector is accessible by waterway for a period of about five months, except for<br />
icebreakers (Figure 6.5).<br />
Figure 6.6 presents the annual total accumulated ice coverage of Hudson Strait, i.e.<br />
the percentage representing the total surface of ice cover in relation to the total<br />
surface of the water body. The average percentage of the total accumulated ice<br />
coverage for Hudson Strait is about 50% for the last 41 years.<br />
Canadian Royalties Inc.<br />
GENIVAR<br />
101-53046-02 November 2012<br />
62
Figure 6.4<br />
Wind roses for Deception Bay and Salluit<br />
Canadian Royalties Inc.<br />
GENIVAR<br />
101-53046-02 November 2012<br />
63
Figure 6.5<br />
Freeze-up and break-up dates for the Arctic region (Environment<br />
Canada, 2012)<br />
Canadian Royalties Inc.<br />
GENIVAR<br />
101-53046-02 November 2012<br />
64
Figure 6.6<br />
History of the percentage of ice coverage in the Hudson Strait<br />
sector<br />
6.1.3.4 Climate Change and Outlooks<br />
Climate<br />
Seasonal temperature and precipitation changes in Nunavik have been estimated by<br />
the Ouranos Group for years 2020 and 2050. The temperature values and the rate of<br />
change of precipitation are projections drawn from several general circulation models<br />
for various greenhouse gas emission scenarios. According to the results of the<br />
modelling performed by Ouranos, the rise in mean temperatures on an annual basis<br />
would be 1 to 3°C and 5 to 6°C respectively for the years 2020 and 2050 (Table 6.6)<br />
(Ouranos, 2007). Winter, and to a lesser extent spring, are the seasons for which the<br />
temperature rises could be the most significant (Table 6.6). These values are<br />
comparable to the 2.85°C temperature rise calculated based on regression of the<br />
mean temperatures at the Inukjuak station during the 20 th century (Tremblay and<br />
Furgal, 2008). For precipitations, the projected mean variations are -2% to +19% and<br />
0 to +31% for the years 2020 and 2050, respectively (Table 6.7). Winter and spring<br />
are the seasons most likely to show the most significant variations in their<br />
precipitation (Table 6.7). Summer precipitation could be lower.<br />
Canadian Royalties Inc.<br />
GENIVAR<br />
101-53046-02 November 2012<br />
65
Table 6.6 Anticipated warming of temperatures in Nunavik for 2020 and 2050,<br />
relative to the data for the 1980s (modified from Ouranos, 2007).<br />
Years 2020 2050<br />
Warming<br />
( o C)<br />
Warming<br />
( o C)<br />
Winter +2 to +4 +4 to +10<br />
Spring 0 to +3 +1 to +5<br />
Summer +1 to +2 +2 to +4<br />
Fall +1 to +3 +2 to +4<br />
Annual +1 to +3 +5 to +6<br />
Table 6.7 Anticipated variation of precipitation in Nunavik for 2020 and 2050,<br />
in relation to the data for the 1980s (modified from Ouranos, 2007).<br />
Years 2020 2050<br />
Variations<br />
(%)<br />
Variations<br />
(%)<br />
Winter 0 to +25 0 to +50<br />
Spring 0 to +15 0 to +30<br />
Summer - 5 to +15 -5 to +20<br />
Fall 0 to +20 5 to +25<br />
Annual -2 to +19 0 to +31<br />
Modification of Geomorphological Processes<br />
In general, warming temperatures and snowfall and rainfall variations have multiple<br />
consequences for the dynamics of northern environments. These environments are<br />
considered to be especially sensitive, mainly due to the presence of permafrost, the<br />
melting of which is considered to activate many geomorphological processes.<br />
Permafrost melting is not only associated with rising air temperatures, but also with<br />
the growing availability of liquid phase water circulating in the soil and its thermal<br />
diffusion in frozen ground. In addition, due to its insulating power, the increase in<br />
snow accumulations on the ground or changes in distribution of the snow cover can<br />
alter the conditions of soil penetration by the frost front and cause local permafrost<br />
melting.<br />
Many studies show that climate warming is already making a sudden appearance in<br />
Nunavik, even in the very short term. For example, for the period from 1987 to 2004,<br />
the thickness of the mollisol at Salluit increased from 2.2 m (Lévesque et al., 1990)<br />
to about 3.05 m in the bedrock, and from 1.30 m to over 1.40 m in the till<br />
(L'Hérault, 2005). The most worrying phenomenon in the Salluit region is the<br />
increase in the thickness of the mollisol in the extremely ice-rich silty clay deposits of<br />
glaciomarine origin, which increased from 82 cm in 1992 to 107 cm in 2007<br />
(L’Hérault, 2009).<br />
Canadian Royalties Inc.<br />
GENIVAR<br />
101-53046-02 November 2012<br />
66
Warming on this scale leads to permafrost degradation, triggering differential<br />
subsidence in the ice-rich deposits and increasing the risks of landslides on the<br />
favourable slopes. Permafrost degradation represents significant risks for all<br />
infrastructures and establishments erected in permafrost zones. In the Salluit Valley,<br />
two landslides, occurring in 1998 and 2005, caused major damage to village’s<br />
establishments and infrastructures (L’Hérault, 2009).<br />
Finally, apart from the increased risk of landslides, climate change could cause<br />
overall alterations in the hydrological regime of the lakes and rivers, the freeze-up<br />
periods, the thinning of the ice, and earlier melting of the ice covering the water<br />
masses and the snow cover. These alterations will trigger changes in the<br />
hydrosedimentary and glacial processes.<br />
Climate warming could also trigger an increase in the frequency and intensity of<br />
other geomorphological processes, animated by more frequent winter thaw periods<br />
and alteration of the snow cover. Thus, the increase in the frequency and intensity of<br />
avalanche and slush flow phenomena becomes especially worrying. Slush flows are<br />
all the more likely to transport large quantities of sediments, because permafrost<br />
melting leads to the availability of enormous quantities of sediments mobilizable by<br />
such processes.<br />
Assessment of Eustatic Variation<br />
Since the early 1970s, the average sea level rise observed has been around ten<br />
centimetres, or about 2.5 mm/year (it should be noted that this rise is extremely<br />
variable depending on the geographical location. The IPCC projections<br />
(IPCC, 2007), according to various temperature increase scenarios by the<br />
2090-2099 horizon (from + 0.6 to + 4 o C), range from 0.18 m to 0.59 m (2 to<br />
6.5 mm/year). For the same time horizon, other models indicate higher mean annual<br />
rises (from 5.6 to 20.45 mm/year) and a greater rise range (from +0.5 to +1.8 m by<br />
the 2100 horizon). The rise would be sharper in the second half of the 21 st century.<br />
On the other hand, glacio-isostatic uplift in Nunavik, which is variable in intensity<br />
over time and which occurs in the very long term (thousands of years) would be<br />
around 6 to 14 mm/year (Beaulieu and Allard, 2003; Lavoie and Allard, 2008).<br />
Considering the sea level rise scenarios up to 2100, there is reason to believe that,<br />
in the decades ahead, the Nunavik shoreline will continue to emerge, greatly<br />
reducing the risks related to coastal erosion.<br />
Canadian Royalties Inc.<br />
GENIVAR<br />
101-53046-02 November 2012<br />
67
6.1.4 Physical Oceanography<br />
Two physical oceanographic survey campaigns were conducted in Deception Bay:<br />
August to September 2006 and August to September 2012. Tides and water levels,<br />
waves, flow and currents, physicochemistry and water quality were characterized for<br />
these two periods in order to describe the oceanographic conditions in Deception<br />
Bay.<br />
6.1.4.1 Tides and Water Level<br />
6.1.4.2 Waves<br />
There are few records of the water level in the Deception Bay region. The tidal<br />
characteristics established based on the water levels measured during the 2012<br />
survey campaign are used to describe the tide at the study site (Figure 6.7). The tide<br />
that enters Deception Bay is semi-diurnal, meaning that it presents two complete<br />
oscillations per day, i.e. two high waters (high tide) and two low waters (low tide).<br />
Each oscillation extends over an average period of 12 hours and 25 minutes.<br />
Tidal Characteristics<br />
Harmonic analysis of the water levels measured in 2012 (GENIVAR, 2012a) allows<br />
the establishment of a series of hourly values, which is used to establish the tidal<br />
characteristics (Table 6.8). The tidal range of 3.9 m for mean tides and 5.7 m for<br />
large tides is relatively large. The mean water level is 2.9 m and the higher high<br />
water large tide (HHWLT) is 5.8 m (Table 6.8).<br />
Storm Surge Observed in Deception Bay<br />
The analysis of the atmospheric component of the water levels measured indicates a<br />
mean variation of around 20 cm and a significant rise of the mean water level around<br />
mid-September 2012 (Figure 6.8). This rise of around 60 cm is due to the passage of<br />
a major depression. On September 13, the winds reached more than 30 km/h and<br />
the barometric pressure was below 98 kPa (Table 6.9). The combination of the<br />
passage of a depression associated with high winds and large tides causes extreme<br />
tidal events.<br />
The wave measurements taken in 2006 (Figures 6.9 and 6.10) show that the<br />
significant height (H s ) never exceeded 0.8 m. Assuming a Rayleigh distribution, it is<br />
possible to apply a conversion factor of 1.87 for H max /H s (Komar, 1998) in order to<br />
determine the maximum height of the waves. This was estimated at 1.5 m during the<br />
measuring period.<br />
Canadian Royalties Inc.<br />
GENIVAR<br />
101-53046-02 November 2012<br />
68
Figure 6.7 Water level measured in Deception Bay between August 8 and September 15, 2012 (CD). The red line shows<br />
the bay water level variation caused by the passage of atmospheric disturbances. The levels are all represented<br />
relative to the Chart Datums.
Table 6.8<br />
Deception Bay tide table<br />
Characteristic (m, CD) 1<br />
Higher high water large tide HHWLT 5.8<br />
Higher high water mean tide HHWMT 4.9<br />
Mean water level MWL 2.9<br />
Lower low water mean tide LLWMT 0.9<br />
Lower low water large tide LLWLT 0.1<br />
Mean tidal range 3.9<br />
Large tidal range 5.7<br />
Extreme high water 2 5.8<br />
Extreme low water 2 0.0<br />
1<br />
Values expressed relative to the Tide Gauge Bench Mark<br />
2<br />
Predicted values<br />
Table 6.9 Weather conditions observed at Salluit Airport on September 13<br />
and 14, 2012 (Environment Canada, 2012).<br />
Date and time<br />
Pressure<br />
Wind intensity Wind direction<br />
(kPa)<br />
(km/h)<br />
(°)<br />
2012-09-13 7 h 96.49 52 340<br />
2012-09-13 8 h 96.67 33 350<br />
2012-09-13 9 h 96.93 39 340<br />
2012-09-13 10 h 97.11 28 330<br />
2012-09-13 11 h 97.26 39 330<br />
2012-09-13 12 h 97.4 46 330<br />
2012-09-13 13 h 97.53 41 310<br />
2012-09-13 14 h 97.66 33 300<br />
2012-09-14 7 h 98.87 19 240<br />
2012-09-14 8 h 98.89 22 230<br />
2012-09-14 9 h 98.91 37 230<br />
2012-09-14 10 h 98.91 28 230<br />
2012-09-14 11 h 98.92 28 230<br />
2012-09-14 12 h 98.89 33 220<br />
2012-09-14 13 h 98.81 46 240<br />
2012-09-14 14 h 98.8 33 240<br />
These values are evidence of a period of violent winds from the southwest, which<br />
swept the bay at the beginning of September. These winds seem to have been<br />
constant on the coast of the Ungava Peninsula, because similar data was recorded<br />
at Salluit. Despite winds generally higher than 50 km/h, the waves were lower than<br />
2 m. Winds exceeding 40 km/h occur about 7% of the time at Deception Bay.<br />
Also according to the 2006 data, the wave period is generally less than 7 s, and only<br />
a few rare sequences showed wave periods exceeding 8 s (Figures 6.9 and 6.10).<br />
These short periods suggest that the waves are generated locally by the wind and<br />
are not the result of propagation of the swell formed at high water.<br />
Canadian Royalties Inc.<br />
GENIVAR<br />
101-53046-02 November 2012<br />
70
Figure 6.8 Variation of the water level in Deception Bay between September 6 and 16, 2012 (CD). The line<br />
represents the atmospheric component of the water levels measured.
Figure 6.9<br />
Recorded series of the significant height of waves, their period and<br />
the tide measured between September 5 and 22, 2006 (modified<br />
from GENIVAR, 2007a).<br />
Figure 6.10<br />
Recorded series of the significant height of the waves, their period<br />
and the tide measured between September 22 and 29, 2006<br />
(modified from GENIVAR, 2007a).
6.1.4.3 Flow and Currents<br />
A currentometric characterization of Deception Bay was conducted in 2012 and is<br />
the subject of the sector report presented in Appendix 7 (GENIVAR, 2012a).<br />
The flow variations of the water masses in Deception Bay are generally associated<br />
with the tidal effect, in addition to local effects near the shores, such as those<br />
associated with breaking waves. Finally, wind plays a significant role in the surface<br />
currents and in shallow zones.<br />
The mean current speeds are low (< 100 mm/s), at all depths (Figure 6.11). The<br />
maximum speeds recorded are generally less than 250 mm/s, except at ebb tide<br />
(falling tide), while the surface currents occasionally may reach speeds exceeding<br />
500 mm/s (Table 6.10). The highest speeds are associated with surface waters,<br />
although on one occasion, at the beginning of September, the current speed in the<br />
middle of the water column exceeded 250 mm/s.<br />
Table 6.10<br />
Descriptive statistics of current speed different depths in Deception<br />
Bay between September 5 and 29, 2006.<br />
Distance from the bottom<br />
(m)<br />
Mean speed<br />
(mm/s)<br />
Standard deviation<br />
(mm/s)<br />
Maximum speed<br />
(mm/s)<br />
10.5 97 74 853<br />
6.8 54 36 318<br />
3.0 43 27 253<br />
On August 1, 2 and 3, 2012, currentometric surveys were conducted with an ADCP<br />
(Acoustic Doppler Current Profiler) along two transects (Map 5.2) through Deception<br />
Bay, in order to measure the instantaneous speed of the currents (Figures 6.12<br />
and 6.13). The white zones are attributable to the low turbidity of the water and the<br />
low concentration of suspended particulate matter, from which the device measures<br />
the current speeds (Figure 6.12). A clear trend emerges for current speeds<br />
exceeding 0.4 m/s (Figure 6.12) near the right shore, in proximity to Pointe-Noire<br />
(Section T1, Map 5.2). This effect is attributed to local acceleration of current speed<br />
associated with the presence of a rocky notch to right of Pointe-Noire and the<br />
presence of a shoal downstream from the left shore. In short, a significant fraction of<br />
the flow associated with the tidal prism passes near Pointe-Noire. The currentometry<br />
in Section T2 seems more uniform through the section (Figure 6.13).<br />
Canadian Royalties Inc.<br />
GENIVAR<br />
101-53046-02 November 2012<br />
73
Figure 6.11 Current speeds measured between September 5 and 29, 2006 at station 1200 located at a depth of<br />
11 m. The bottom portion shows the speeds at 10.5 m, 6.8 m and 3.0 m.
Figure 6.12 Currentometric profile produced in Section T1, August 3, 2012<br />
Figure 6.13 Currentometric profile produced in Section T2 – August 2, 2012
Drifters<br />
During the campaign of August 1, 2 and 5, 2012, drifters fitted with a sheet metal<br />
cross brace located 1 m or 3 m below the surface of the water reacted the same<br />
way, except for the distances travelled. Indeed, the drifters placed 3 m below the<br />
surface of the water travelled shorter distances than those placed 1 m below the<br />
surface, because they snagged on the bottom (Map 6.3).<br />
In front of sites Q1 and Q2, the surveys of August 1 and 2 show northwest directions<br />
during ebb tide, while the directions during flood tide are south-southeast, the<br />
opposite direction (Map 6.3). The mean drift speed recorded during these days was<br />
53 mm/s, which is considered relatively low (Table 6.11). The wind conditions then<br />
were from the northwest, with a speed of less than 20 km/h.<br />
Table 6.11 Drifter displacement speeds near sites Q1 and Q2.<br />
August 1 August 2 August 5<br />
Maximum speed (mm/s) 260 102 277<br />
Mean speed (mm/s) 65 41 127<br />
Standard deviation (mm/s) 60 27 59<br />
However, the drift direction for August 5 was northwest or northeast during the flood<br />
tide. These directions are completely opposite those recorded during this tidal phase<br />
on the preceding days (Map 6.3). The mean speed recorded by the drifters on<br />
August 5 was 127 mm/s, more than double the mean speed recorded on August 1<br />
and 2 (Map 6.3; Table 6.11). The winds blew much stronger from the southsoutheast,<br />
contrary to the conditions on August 1 and 2. These results show that the<br />
wind can easily counter the influence of the tide and completely change the direction<br />
and speed of the currents, at least within the first three metres below the surface of<br />
the water in front of sites Q1 and Q2.<br />
The trajectories recorded on August 2 in front of the CRI temporary camp during ebb<br />
tide indicate a southerly direction, towards the shore (Map 6.3). At flood tide, the<br />
directions are either southeast (towards the shore), or east (towards the mouth of the<br />
Deception River) (Map 6.3). These results show that the tidal influence during ebb<br />
tide is weaker at this location in front of sites Q1 and Q2.<br />
Finally, the mean displacement speed of the drifters on August 2 offshore from the<br />
CRI temporary camp was 34 mm/s. The maximum speed recorded on that day was<br />
109 mm/s, during flood tide, which may indicate that the displacement speeds are<br />
slower at ebb tide (Table 6.12).<br />
Canadian Royalties Inc.<br />
GENIVAR<br />
101-53046-02 November 2012<br />
76
1 août 2012 74°41'0" / August 1, 2012<br />
Jusant / Ebb<br />
74°40'30"<br />
1 août 2012 74°41'0" / August 1, 2010 Flot / Flood<br />
74°40'30"<br />
62°8'20"<br />
Vent / Wind : NO - NNO<br />
Q1<br />
Baie Déception /<br />
Deception Bay<br />
62°8'20"<br />
62°8'20"<br />
Vent / Wind : NO - NNO<br />
Q1<br />
Baie Déception /<br />
Deception Bay<br />
62°8'20"<br />
Projet Nunavik Nickel / Nunavik Nickel Project<br />
EIES pour l’aménagement d’infrastructures portuaires et<br />
la gestion des sédiments à la baie Déception /<br />
ESIA for the Deception Bay Wharf and Sediment Management<br />
Carte 6.3 / Map 6.3<br />
Trajectoire des dériveurs les 1, 2 et 5 août 2012<br />
et aperçu des conditions hydrodynamiques /<br />
Trajectory of Drifters on August 1,2 and 5, 2012<br />
and Outlook of Hydrodynamic Conditions<br />
Projection : UTM, zone 18, NAD83<br />
62°8'10"<br />
74°41'0"<br />
Q2<br />
Baie Déception /<br />
Deception Bay<br />
74°40'30"<br />
2 août 2012 / August 2, 2012 Jusant / Ebb 74°40'0"<br />
74°37'0"<br />
2 août 2012 / August 74°37'0" 2, 2012 Flot / Flood<br />
62°8'10"<br />
Vent / Wind : S - O<br />
62°8'10"<br />
62°7'10"<br />
Baie Déception /<br />
Deception Bay<br />
62°8'10"<br />
62°8'10"<br />
0 60 m 0 60 m<br />
74°41'0"<br />
74°40'30"<br />
62°7'10"<br />
Campement temporaire /<br />
Temporary camp<br />
62°7'10"<br />
Baie Déception /<br />
Deception Bay<br />
Vent / Wind : S - O<br />
62°7'10"<br />
Campement temporaire /<br />
Temporary camp<br />
Xstrata<br />
Nickel<br />
Q1<br />
5 Août 2012 /<br />
August 5, 2012<br />
(Sites Q1-Q2)<br />
1 Août 2012 /<br />
August 1, 2012<br />
(Sites Q1-Q2)<br />
A<br />
2 Août 2012 /<br />
August 2, 2012<br />
(Sites Q1-Q2)<br />
B<br />
C<br />
E<br />
D<br />
Q2<br />
Baie Déception /<br />
Deception Bay<br />
62°8'10"<br />
2 Août 2012 /<br />
August 2, 2012<br />
(Campement / Camp)<br />
Source :<br />
Base : Photographies aériennes (1 : 10 000) / Aerial photographs (1:10 000)<br />
(Q02201-115 et Q02201-117)<br />
Inventaires et cartographie / Surveys and mapping : GENIVAR<br />
Fichier / File : 101_53046_EIES_BD_c6_3_derives_121120.mxd<br />
Novembre / November 2012<br />
101-53046-02<br />
Trajectoire et direction de la dérive /<br />
Trajectory and direction of drift<br />
Dérive 1 à 3 (1 m) / Drift 1 to 3 (1 m)<br />
Dérive 4 à 6 (3 m) / Drift 4 to 6 (1 m)<br />
Composante du projet / Project Component<br />
Infrastructures portuaires projetées (variantes) /<br />
Proposed wharf (variants)<br />
Site de dépôt des sédiments (variantes) /<br />
Sediment disposal site (variants)<br />
Zone d'étude / Study area<br />
Infrastuctures existantes / Existing Infrastructure<br />
Campement Inuit permanent /<br />
Inuit permanent camp<br />
0 60 m<br />
74°40'0"<br />
62°7'0"<br />
74°37'0"<br />
62°7'0"<br />
62°7'0"<br />
0 60 m 0 60 m<br />
74°37'0"<br />
62°7'0"<br />
0 800 m<br />
Infrastructures portuaires / Wharf<br />
Route / Road<br />
5 août 74°42'5" 2012 / August 5, 2012 Flot 74°41'40" / Stream<br />
74°41'15"<br />
74°40'50"<br />
Site 4<br />
Vent / Wind : Fort du SSE / Strong from SSE<br />
Xstrata<br />
Nickel<br />
Baie Déception /<br />
Deception Bay<br />
62°8'30"<br />
62°8'30"<br />
Graphique (a venir)<br />
Q1<br />
74°42'5"<br />
74°41'40"<br />
74°41'15"<br />
74°40'50"<br />
0 100 m
Table 6.12<br />
Displacement speeds of drifters offshore from the Canadian<br />
Royalties camp on August 2, 2012.<br />
6.1.4.4 Water Physicochemistry<br />
mm/s<br />
Maximum speed 109<br />
Mean speed 34<br />
Standard deviation 29<br />
Several vertical profiles of water physicochemistry were produced from August 1<br />
to 5, 2012 (Map 5.2). The results were compared with similar profiles produced in<br />
2006 in Deception Bay (GENIVAR, 2008). The profiles show that the influence of<br />
fresh water from the Deception River is variable from one location to another and<br />
that these variations also depend on seasonal wind and streamflow conditions. The<br />
sector facing sites Q1 and Q2 is visibly influenced by the arrival of fresh water from<br />
the river, and this plume can be noticed up to 5 km from the river mouth<br />
(GENIVAR, 2008).<br />
The result of this surface water layer from the river is to stratify the water column into<br />
three distinct layers: 1) the surface layer with warm temperatures (5.5°C) and slightly<br />
lower salinity (29 ppm); 2) the intermediate layer, where the temperature decreases<br />
and salinity increases more sharply; 3) the deep water layer, with the highest salinity<br />
values (31 to 33 ppm) and the lowest temperatures (nearly 3.5°C) (Table 6.13).<br />
Table 6.13 Temperature and salinity values of deep water layer of Transect 1<br />
(August 2012).<br />
Depth<br />
(m)<br />
Temperature<br />
(°C)<br />
Salinity<br />
(ppm)<br />
10.34 4.70 33.66<br />
12.76 4.50 33.67<br />
17.83 4.30 33.49<br />
17.83 4.30 33.49<br />
20.45 4.20 33.53<br />
20.45 4.20 33.53<br />
23.12 4.00 33.43<br />
27.95 3.40 33.03<br />
Stratification may vary during spring flood, when the river’s influence is much<br />
greater, or in fall due to stronger winds. This favours mixing of the surface layer with<br />
the intermediate layer.<br />
Canadian Royalties Inc.<br />
GENIVAR<br />
101-53046-02 November 2012<br />
79
The turbidity data indicates that there was very little variability during the 2012<br />
sampling campaign, with values practically at zero all along profiles. The visual<br />
observations also confirm the notable transparency of the water of Deception Bay.<br />
Suspended Particulate Matter<br />
Integrated water samples were collected: 20 offshore from sites Q1 and Q2, three at<br />
the mouth of the Deception River, and two in front of the CRI temporary camp<br />
(Map 5.3) (Table 6.14). All the surveys were conducted at a distance of less than<br />
200 m from the shore and at water depths of less than 15 m. In general, the SPM<br />
concentration for all stations ranged from 1 to 19 mg/L, with maximum values at the<br />
mouth of the Deception River (station BD12)<br />
Table 6.14<br />
Concentration of suspended particulate matter measured near sites<br />
Q1 and Q2, August 5, 2012.<br />
Station Site Date Time Tide<br />
Integrated SPM<br />
(mg/L)<br />
BD01 Q1 2012-08-05 09:44 Flood tide 10<br />
BD02 Q1 2012-08-05 09:47 Flood tide 11<br />
BD03 Q1 2012-08-05 09:53 Flood tide 17<br />
BD04 Q1 2012-08-05 10:00 Flood tide 13<br />
BD05 Q1 2012-08-05 10:05 Flood tide 10<br />
BD06 Q2 2012-08-05 10:19 Flood tide 11<br />
BD07 Q2 2012-08-05 10:23 Flood tide 11<br />
BD08 Q2 2012-08-05 10:44 Flood tide 12<br />
BD09 Q2 2012-08-05 10:49 Flood tide 10<br />
BD10 Q2 2012-08-05 10:52 Flood tide 11<br />
BD11 RIV 2012-08-05 11:46 Slack water 12<br />
BD12 RIV 2012-08-05 11:47 Slack water 19<br />
BD13 RIV 2012-08-05 11:50 Slack water 13<br />
BD14 Q1 2012-08-05 15:33 Ebb tide 15<br />
BD15 Q1 2012-08-05 15:36 Ebb tide 1<br />
BD16 Q1 2012-08-05 15:39 Ebb tide 2<br />
BD17 Q1 2012-08-05 15:41 Ebb tide 1<br />
BD18 Q1 2012-08-05 15:44 Ebb tide 2<br />
BD19 Q2 2012-08-05 16:06 Ebb tide 4<br />
BD20 Q2 2012-08-05 16:09 Ebb tide 2<br />
BD21 Q2 2012-08-05 16:12 Ebb tide 3<br />
BD22 Q2 2012-08-05 16:14 Ebb tide 6<br />
BD23 Q2 2012-08-05 16:16 Ebb tide 3<br />
BD24 CAMP 2012-08-05 16:50 Ebb tide 2<br />
BD25 CAMP 2012-08-05 16:53 Ebb tide 3<br />
The SPM concentration in the water column near sites Q1 and Q2 is greater during<br />
flood tide. The mean of 11.6 mg/L is three times greater than the mean value<br />
calculated during ebb tide (3.7 mg/L) (Table 6.15). However, the wind conditions<br />
were extremely variable during the day. Strong winds were blowing during the<br />
morning of August 5, which corresponds to the time when the highest SPM<br />
concentrations were observed.<br />
Canadian Royalties Inc.<br />
GENIVAR<br />
101-53046-02 November 2012<br />
80
Table 6.15<br />
Descriptive statistics on suspended particulate matter near sites Q1<br />
and Q2 (August 5, 2012)<br />
SPM values<br />
(mg/L)<br />
Flood tide<br />
Ebb tide<br />
Maximum 17 15<br />
Mean 11.6 3.7<br />
Standard deviation 2.1 3.8<br />
Under the influence of the wind, the waves suspended the shore sediments, which<br />
increased the SPM concentration. This phenomenon was observed throughout the<br />
water column, within 200 m of the shore and at water depths of less than 15 m.<br />
6.1.5 Sediment Quality<br />
Sediment Quality<br />
The physicochemical quality of the sediments in Deception Bay was analyzed in<br />
2006, 2007 and 2011 (Appendix 3) and 2012 (Appendix 4). The sediments of nine<br />
stations were analyzed respectively in 2006, 2007 and 2011, and 32 other stations<br />
were analyzed in 2012 (Map 5.1).<br />
In 2012, the sampling campaign was conducted by the Stantec team between<br />
July 18 and 26, 2012 from a barge-mounted drilling rig. The core holes recovered<br />
samples at different depths for the same station (n = 123). To ensure quality control,<br />
many duplicates were collected to assess intrastation variability, according to the EC<br />
Guidelines (2007), i.e. 10% of the total number of stations.<br />
Under the supervision of the CRI environment team, the samples were prepared and<br />
shipped to the Maxxam Analytics Inc. laboratory, where the granulometric and<br />
chemical analyses were performed.<br />
Sediment Analysis<br />
The quality of the sediments was analyzed according to the Canadian Sediment<br />
Quality Guidelines for the Protection of Aquatic Life (CCME 1999, revised in 2001)<br />
and the Critères pour l’évaluation de la qualité des sédiments au Québec (Québec<br />
sediment quality assessment criteria), as specified in the EC and MDDEP<br />
guide (2007).<br />
Canadian Royalties Inc.<br />
GENIVAR<br />
101-53046-02 November 2012<br />
81
From these two references, it is possible to define three chemical substance<br />
concentration ranges (Figure 6.14):<br />
• the lowest concentrations range, when the concentration does not exceed the<br />
threshold of the Interim Sediment Quality Guideline (ISQG), equivalent to the<br />
threshold effect level (TEL). In this range, harmful biological effects on organisms<br />
are rarely observed;<br />
• the possible effects range, located between the ISQG and the probable effect<br />
level (PEL). In this range, the occasional effect level (OEL) may be exceeded.<br />
This criterion represents the threshold beginning at which harmful effects are<br />
apprehended for several benthic species;<br />
• the probable effects range, i.e. when the concentration exceeds the PEL. In this<br />
range, harmful biological effects on living organisms are frequently observed.<br />
The parameters analyzed were chosen by considering the contaminants most likely<br />
to be produced within the context of the project and according to the<br />
recommendations of the government agencies. In 2006, 2007 and 2011, no<br />
exceedance of criteria was noted for petroleum hydrocarbons, polycyclic aromatic<br />
hydrocarbons, PCB congeners, and total organic carbon content. For the year 2012,<br />
only metals (Ag, As, Ba, Cd, Co, Cr, Cu, Hg, Mn, Mo, Ni, Pb, Se, Sn, Zn) were<br />
analyzed (Appendix 4).<br />
Table 6.16 presents the results of the physicochemical analyses performed on<br />
the 2012 samples. Nearly 39% of the analyses rendered undetected values, given<br />
their metal concentrations below the detection limit.<br />
The results indicate that 47% and 76% of the samples exceed the ISQG criterion for<br />
chromium and copper respectively, for all depths combined (from the surface of the<br />
seabed to 15 m into the sediments). Six of the samples exhibit values above the<br />
OEL. Copper and chromium are two metals present in the region’s geological<br />
formations. This region also has major deposits of copper and nickel ore, which is<br />
always associated with chromium (Ministère des Ressources naturelles et de la<br />
Faune [MRNF] 5 , 2012). The results obtained by the analyses are all under, or very<br />
close to, the background levels of the region’s soils, i.e. 50 mg/kg for copper and<br />
85 mg/kg for chromium (GENIVAR, 2008a). The six samples showing exceedances<br />
of the OEL criterion for chromium and copper were collected at the stations located<br />
near the shore, suggesting the terrigenous origin of these sediments. The Deception<br />
Bay seabed sediments (shoreline and glaciomarine) thus reflect the lithological<br />
composition of the neighbouring bedrock.<br />
5<br />
Ministère des Ressources naturelles (MRN) since September 2012.<br />
Canadian Royalties Inc.<br />
GENIVAR<br />
101-53046-02 November 2012<br />
82
Figure 6.14<br />
Canadian Sediment Quality Guidelines (CCME, 1999) Québec<br />
sediment quality criteria (taken from Environment Canada and<br />
MDDEP, 2007).<br />
Canadian Royalties Inc.<br />
GENIVAR<br />
101-53046-02 November 2012<br />
83
The zinc concentration at depth stratum 27’4’’-29’4’’ of station BH-109 shows a value<br />
(1,100 mg/kg) that exceeds the threshold of the frequent effect level (FEL) of<br />
430 mg/kg. Only one other station shows a zinc concentration exceedance, i.e.<br />
station BH-112, where the concentration of 180 mg/kg at stratum 3’-5’ exceeds the<br />
OEL while its duplicate shows a concentration of 320 mg/kg, indicating an<br />
exceedance of the PEL. These values are very point-source and difficult to explain.<br />
First of all, zinc is not recognized as being associated with one geological unit in<br />
particular, nor as a known component of a product or a process resulting from onshore<br />
human activities. Moreover, these exceedances of criteria are observed in<br />
strata as deep as 10 m in the sediments. However, two hypotheses can be stated to<br />
explain such levels.<br />
First of all, the two stations are located in the zone that suffered a rotational landslide<br />
in summer 2010 (Map 5.2). At this location, the sediments were deeply disturbed. It<br />
is possible that zinc contamination, highly localized on the surface, was disturbed<br />
and then buried more than 10 m deep. Rotational landslides are recognized for<br />
displacing masses of sediments without necessarily destructuring them.<br />
On the other hand, the hypothesis of contamination of the samples during laboratory<br />
analyses is also possible. However, no conclusion can be made, because no sample<br />
was retained for cross-checking.<br />
In light of the above results, the physicochemical quality of the sediments turns out<br />
not to have a limiting impact on aquatic life. For the three years of monitoring, only<br />
the copper and chromium concentrations exceed the sediment quality criteria<br />
adopted, and these exceedances are explained by natural background levels in the<br />
environment studied. These results also agree with those obtained during the 2004<br />
and 2005 inventories (Roche, 2005; 2006). For all the samples collected during<br />
these two years, the chromium and copper concentrations exceeded the threshold<br />
for protection of aquatic life.<br />
Since it is proposed to manage the dredged sediments in a terrestrial environment,<br />
the criteria of the Soil Protection and Contaminated Sites Rehabilitation Policy<br />
(MDDEP, 1998) were consulted (Table 6.16). In the study zone, the levels in force<br />
for Superior and Rae Provinces are applicable.<br />
As indicated in Table 6.16, the majority of the exceedances fall between ranges A<br />
and B. Thus, these metal contamination levels are not a problem for the land<br />
dedicated to sediment management, given its industrial vocation.<br />
Canadian Royalties Inc.<br />
GENIVAR<br />
101-53046-02 November 2012<br />
84
Parameters<br />
Units<br />
Station number<br />
Detection<br />
BH-114<br />
BH-106<br />
limit BH-114 BH-114 BH-114 DUP BH-106 BH-106 DUP BH-106A<br />
BH-106A<br />
Marine sediments quality criteria<br />
MDDEP Policy<br />
IRSQ 1 COE 2 CPE 3 CFE 4 DLR 5 A 6 B C<br />
4'-6' 8'-10' 17'10''-20'6'' 8'-10' 6'-8' 12'3''-14'3'' 12'3''-14'3'' 25'8''-27'8'' 31'3''-33'3''<br />
Metals<br />
Mercury (Hg)<br />
mg/kg 0,01
Parameters<br />
Units<br />
Detection<br />
limit<br />
Station number<br />
BH-113<br />
BH-113 BH-113 BH-113 DUP BH-102 BH-102 BH-102<br />
BH-102<br />
DUP<br />
IRSQ 1 COE 2<br />
Marine sediments quality criteria<br />
CPE 3 CFE 4 DLR 5<br />
MDDEP Policy<br />
A 6 B C<br />
2'-4' 16'3''-18'3'' 24'9''-26'9'' 2'-4' 0'-2' 9'-11' 15'7''-19'7'' 9'-11'<br />
Metals<br />
Mercury (Hg)<br />
mg/kg 0,01
Parameters<br />
Units<br />
Detection<br />
limit<br />
Station number<br />
BH-105<br />
BH-105 BH-105 BH-105 DUP BH-424 BH-424 BH-424<br />
BH-424<br />
DUP<br />
IRSQ 1<br />
Marine sediments quality criteria<br />
COE 2 CPE 3 CFE 4 DLR 5<br />
A 6<br />
MDDEP Policy<br />
B<br />
C<br />
8'-10'6" 19'7"-24'7" 35'2"-37'2" 19'7"-24'7 2'-4' 6'2"-8'2" 14'8"-16'8" 2'-4'<br />
Metals<br />
Mercury (Hg)<br />
mg/kg 0,01
Parameters<br />
Units<br />
Detection<br />
limit<br />
Station number<br />
BH-103<br />
BH-103 BH-103 BH-103 DUP BH-423 BH-423 BH-423<br />
BH-423<br />
DUP<br />
IRSQ 1<br />
Marine sediments quality criteria<br />
COE 2 CPE 3 CFE 4<br />
MDDEP Policy<br />
DLR 5 A 6 B<br />
C<br />
2'6"-4'6" 19'8"-21'8" 29'6"-31'6" 19'8"-21'8" 2'-4' 11'9"-13'9" 14'3"-16'1" 11'9"-13'9"<br />
Metals<br />
Mercury (Hg)<br />
mg/kg 0,01
Parameters<br />
Units<br />
Detection<br />
limit<br />
Station number<br />
BH-420 BH-420 BH-420 BH-108 BH-108 BH-108<br />
BH-108<br />
DUP<br />
Marine sediments quality criteria<br />
MDDEP Policy<br />
IRSQ 1 COE 2 CPE 3 CFE 4 DLR 5 A 6<br />
B<br />
C<br />
2'-4' 9'2"-11'2" 28'5"-30'5" 4'-7'10'' 7'10''-9'10'' 15'2''-17'2'' 7'10"-9'10"<br />
Metals<br />
Mercury (Hg)<br />
mg/kg 0,01
Parameters<br />
Units<br />
Detection<br />
limit<br />
Station number<br />
BH-415<br />
BH-415 BH-415 BH-415 DUP BH-110 BH-110 BH-110<br />
BH-110<br />
DUP<br />
IRSQ 1 COE 2<br />
Marine sediments quality criteria<br />
CPE 3 CFE 4 DLR 5<br />
MDDEP Policy<br />
A 6 B C<br />
0'-'1" 8'6"-10'5" 19'7"-21'7" 8'6"-10'5" 6'8"-8'9" 8,9"-10'9" 15'-17" 8'9"-10'9"<br />
Metals<br />
Mercury (Hg)<br />
mg/kg 0,01
Parameters<br />
Units<br />
Detection<br />
limit<br />
Station number<br />
BH-107<br />
BH-107 BH-107 BH-107 DUP BH-411 BH-411<br />
BH-411<br />
Marine sediments quality criteria<br />
IRSQ 1 COE 2 CPE 3 CFE 4<br />
DLR 5 A 6<br />
MDDEP Policy<br />
B<br />
C<br />
2'5"-4'5" 6'5"-8'5" 14'9"-16'9" 6'5"-8'5" 2'-4' 4'5"-8' 14'9"-17'<br />
Metals<br />
Mercury (Hg)<br />
mg/kg 0,01
Parameters<br />
Units<br />
Detection<br />
limit<br />
Station number<br />
BH-117<br />
BH-117 BH-117 BH-117 DUP BH-413 BH-413 BH-413<br />
BH-413<br />
DUP<br />
IRSQ 1<br />
Marine sediments quality criteria<br />
MDDEP Policy<br />
COE 2 CPE 3 CFE 4 DLR 5 A 6 B<br />
C<br />
7'6"-9'6" 15'10"-17'10" 35'5"-39'6" 35'5"-39'6" 2'8"-4'8" 9'11' 16'9"-18'9"<br />
Metals<br />
Mercury (Hg)<br />
mg/kg 0,01
Only the zinc concentration of sample BH-109 (stratum 27'4''-29'4'') has a<br />
contamination level between ranges B and C. However, this contamination is highly<br />
localized and very probably is located in the sediment layer. Moreover,<br />
this phenomenon has never been noted in the physicochemical analyses performed<br />
since 2006. Only one sample out of a total of about 170 samples analyzed<br />
between 2006 and 2012 shows such a concentration and this result is considered<br />
unrepresentative of the quality of the site Q1 sediments. Therefore, it is not<br />
considered in the interpretation of the results.<br />
6.1.6 Hydrosedimentary Dynamics<br />
In light of the data on all components of the physical environment, it appears that<br />
sediment transport is somewhat limited in Deception Bay, especially at sites Q1 and<br />
Q2. The shoreline of Deception Bay is relatively narrow and the type of coast is<br />
somewhat rocky, or sometimes veiled in sediments. The shoreline widens locally at<br />
the outfall of the rivers, where the debris cones accumulate, or form a better<br />
developed intertidal zone.<br />
Sediment Inflows in the Coastal System<br />
The sediment inflows in Deception Bay are very limited. The Deception River,<br />
despite its size, has a low sediment transport capacity. The coarsest sediments are<br />
deposited directly in the river delta, while the finer sediment load is decanted<br />
gradually and trapped in the basins more than 80 m deep at the back of Deception<br />
Bay. The sediment dynamics of the Bombardier Beach River is similar to those of the<br />
Deception River, with the coarsest sediments locally feeding Bombardier Beach.<br />
Slush Flows<br />
The torrents located completely to the northwest of the study zone do not seem,<br />
a priori, to transport large quantities of sediments to Deception Bay, based on the<br />
modest width of their respective deltas. However, the slush flows and the debris<br />
flows coming from them could contribute sporadically to the sediment balance of the<br />
Deception Bay shoreline. The debris cones at the valley outfalls are evidence of the<br />
large extent of these phenomena.<br />
Finally, shoreline erosion is not an especially worrying process, to the extent that<br />
glacio-isostatic uplift is currently occurring at a greater rate than sea level rise.<br />
Shoreline erosion thus is not likely to supply sediment to the coastal system.<br />
Moreover, the results of the suspended particulate matter analyses show that the<br />
sediment load of the waters flowing into Deception Bay is practically nil, except near<br />
the shores during high winds.<br />
Canadian Royalties Inc.<br />
GENIVAR<br />
101-53046-02 November 2012<br />
101
Coastal Dynamics<br />
Coastal sediment transport seems to be especially limited. No shoreline form is<br />
evidence of a marked process, or a dominant sediment transport direction.<br />
Moreover, the current speed measurements do not show the predominance of<br />
marked sediment transport episodes. Only suspended transport seems effective,<br />
while bedload transport could be sporadic, localized and limited to transport of the<br />
sandy silts present at certain locations on top of glaciomarine clays. Finally, the<br />
presence of boulders on the stand indicates a certain glacial transport activity.<br />
No other sedimentary facies associated with existing sediment transport has been<br />
identified formally in the sediment core samples analyzed. The proximity of<br />
glaciomarine clay outcropping at several locations and its omnipresence at sites Q1<br />
and Q2 are evidence that there have been very few sedimentation episodes in<br />
recent millennia.<br />
6.1.7 Marine Sound Environment<br />
A characterization of the underwater sound environment of Deception Bay was<br />
produced in 2012 (GENIVAR, 2012b). A series of surveys was conducted in the bay<br />
to measure the background noise of the sites (reference status) and determine the<br />
distances at which the noises generated by port infrastructures construction work<br />
could be a source of disturbance for marine mammals. A sector report presenting all<br />
the results can be found in Appendix 10.<br />
6.1.7.1 Ambient Noise<br />
During the measuring periods, the average ambient air was mainly affected by<br />
anthropogenic activities related to the traffic of small craft and the unloading of an oil<br />
tanker (the Havelstern) at the Xstrata Nickel facilities. Although relatively constant,<br />
the noise of the oil tanker’s compressors and pumps oscillated between 116.99 and<br />
126.81 dB re 1 µPa rms (Table 3 and Appendix 3). A relatively high sound pressure<br />
was recorded during the passage of an Xstrata Nickel zodiac, for which a value<br />
reaching 125.6 dB re 1 µPa rms was recorded when it circulated about 1,200 from the<br />
measuring instruments. In calm weather and during momentary interruptions of port<br />
activities, the ambient noise decreased to 102.15 dB re 1 µPa rms. Table 6.17<br />
presents the marine sound pressure levels measured and the dominant frequency<br />
bands.<br />
Canadian Royalties Inc.<br />
GENIVAR<br />
101-53046-02 November 2012<br />
102
Table 6.17<br />
Typical underwater sound pressure levels measured directly in<br />
Deception Bay on July 12, 2012.<br />
Sound pressure levels Dominant frequency bands<br />
<strong>Main</strong> source<br />
Maximum*<br />
dB re 1 µPa rms<br />
RMS**<br />
dB re 1 µPa rms<br />
Maximum*<br />
dB re 1 µPa rms<br />
Flat calm 96.45 102.15 (225-275)<br />
Oil tanker unloading 121.73 126.81 (225-275)<br />
Oil tanker unloading and sonar 114.71 116.99 (225-275; 25,000)<br />
Passage of a zodiac 119.44 125.61 (3,000-3,500)<br />
* Maximum instantaneous sound pressure measured<br />
** Effective sound pressure, calculated over a period of 100 ms<br />
The measurements established that the mean ambient sound during a nocturnal tidal<br />
cycle was 120.22 ± 0.48 dB re 1 µPa rms.<br />
6.1.7.2 Sound Attenuation<br />
Table 6.18 presents the sound attenuation values at sites Q1 and Q2 for the<br />
reference frequencies of 250 Hz to 16 kHz and at distances of 100 m, 500 m and<br />
1 000 m from the emission point.<br />
Table 6.18 Sound attenuation at sites Q1 and Q2.<br />
Distance from the emission point<br />
(m)<br />
Site Q1<br />
dB re 1 µPa rms<br />
Site Q2<br />
dB re 1 µPa rms<br />
100 41.6 ± 3.0 39.6 ± 3.7<br />
500 56.5 ± 4.4 53.5 ± 5.2<br />
1,000 62.9 ± 5.0 59.5 ± 5.8<br />
These variations are essentially explained by the relative position of the wharf<br />
location scenarios and the configuration of the bay along the different measuring<br />
axes. Thus, the fastest attenuation is observed to the northwest, towards the mouth<br />
of the bay from the Q1 location scenario, while the weakest is observed<br />
perpendicular to the bay, to the northeast, from Q2 location scenario.<br />
6.2 Biological Environment<br />
6.2.1 Marine Environment<br />
6.2.1.1 Aquatic Grass Beds<br />
The inventory of aquatic grass beds conducted by underwater diving allowed<br />
identification of seven different taxa, five of which are brown algae belonging to the<br />
Phaeophyceae class. Table 6.19 indicates the coverage rates of the species<br />
Canadian Royalties Inc.<br />
GENIVAR<br />
101-53046-02 November 2012<br />
103
inventoried in each quadrat (Map 6.4). The underwater photographs are available in<br />
Appendix 11. All of this data indicates a higher rate of grass bed coverage for the<br />
site Q2 transects than for site Q1. These results are explained, in particular, by the<br />
little vegetation found in the quadrats farthest from the shore (5 and 6) for the site Q1<br />
transects, compared to those of site Q2. Little or no vegetation was found in these<br />
site Q1 quadrats and the proportion does not exceed 15%. At site Q2, the coverage<br />
rates of quadrats 5 and 6 range from 15% to 100%.<br />
The analysis of the data from Table 6.19 and the underwater photographs taken in<br />
certain quadrats (Appendix 11) make it possible to see a clear dominance of the<br />
Fucaceae in the site Q2 transects, compared to site Q1.<br />
Regarding the laminaria, similar coverage was noted at both sites. At site Q1, the<br />
coverage rates range from 1% to 75%, while at site Q2, the values range between<br />
1% and 90%.<br />
6.2.1.2 Benthic Fauna<br />
Epibenthic Fauna<br />
A qualitative inventory of epibenthic fauna was conducted by the divers for each<br />
quadrat analyzed for the aquatic grass beds (Map 6.4). Table 6.20 lists the 25 taxa<br />
that were identified. The seabed of sites Q1 and Q2 is composed of several<br />
sediment types.<br />
Thus, the coarsest sediment, composed of boulders and gravel, explains the<br />
presence of sessile organisms using these structures to fasten themselves to them,<br />
such as the ascidians and the individuals belonging to the Balanidae class.<br />
Conversely, the presence of sand and silt explains the presence of organisms such<br />
as molluscs. In the analysis of the results, the average number of taxa found is<br />
higher at site Q2 (13.5) than at site Q1 (5.75).<br />
Endobenthic Fauna<br />
To characterize the endobenthic fauna communities, a taxonomic analysis of the<br />
16 grab samples was performed. Table 6.21 presents the densities of the taxa<br />
identified at each station (Map 6.4). The sampling made is possible to collect<br />
72 species at the two sites (Q1 and Q2). The identification of the genus and species<br />
for this year provides a much more precise picture compared to the previous field<br />
campaigns, for which the taxonomic level identified was the family.<br />
Canadian Royalties Inc.<br />
GENIVAR<br />
101-53046-02 November 2012<br />
104
-12<br />
A<br />
74°41'5"W<br />
74°41'0"W<br />
T1-5<br />
T1-6<br />
74°40'55"W<br />
Baie Déception /<br />
Deception Bay<br />
74°42'0"W<br />
74°41'0"W<br />
74°40'0"W<br />
74°39'0"W<br />
62°8'22"N<br />
T1-1<br />
T1-2<br />
T1-3<br />
T1-4<br />
T2-3<br />
T2-4<br />
T2-5<br />
T2-6<br />
T3-5<br />
T3-6<br />
62°8'22"N<br />
Xstrata<br />
Nickel<br />
Baie Déception /<br />
Deception Bay<br />
62°8'20"N<br />
T1<br />
T2<br />
T3<br />
T2-1<br />
T2-2<br />
T3-1<br />
T3-2<br />
T4-1<br />
T3-3<br />
T4-2<br />
T3-4<br />
T4-3<br />
T4-4<br />
T4-5<br />
Site Q1<br />
T4-6<br />
62°8'20"N<br />
62°8'30"N<br />
200<br />
A<br />
Q1<br />
100<br />
B<br />
Q2<br />
62°8'30"N<br />
62°8'18"N<br />
74°41'5"W<br />
74°41'0"W<br />
T4<br />
74°40'55"W<br />
62°8'18"N<br />
62°8'0"N<br />
500<br />
400<br />
300<br />
200<br />
A<br />
62°8'0"N<br />
B<br />
-4<br />
74°40'15"W<br />
74°40'10"W<br />
T5-6<br />
74°40'5"W<br />
Baie Déception /<br />
Deception Bay<br />
T5-5<br />
T5-4<br />
T6-6<br />
B<br />
62°8'8"N<br />
62°8'6"N<br />
Site Q2<br />
T5<br />
T5-1<br />
T6<br />
T5-3<br />
T6-5<br />
T5-2<br />
T6-4<br />
T7-6<br />
T6-3<br />
T7-5<br />
T6-2<br />
T7-4<br />
T6-1<br />
T7-3<br />
T8-5<br />
T7-2<br />
T8-4<br />
T7<br />
T7-1<br />
T8-3<br />
T8-2<br />
T8-1<br />
T8-6<br />
62°8'8"N<br />
62°8'6"N<br />
62°7'30"N<br />
550<br />
Échantillonnage / Sampling<br />
Benne complétée / Completed grab sampler<br />
Benne refusé / Refused grab sampler<br />
Quadrat quantitatif / Quantitative quadrat<br />
Transect vidéo / Video transect<br />
Isobathe / Isobath (m)<br />
Composantes du projet / Project Components<br />
Infrastructures portuaires projetées (variantes) /<br />
Proposed wharf (variants)<br />
Site de dépôt des sédiments (variantes) /<br />
Sediment disposal site (variants)<br />
Zone d'étude / Study area<br />
Infrastructures existantes / Existing Infrastructure<br />
E<br />
C<br />
D<br />
Projet Nunavik Nickel / Nunavik Nickel Project<br />
EIES pour l’aménagement d’infrastructures portuaires et<br />
la gestion des sédiments à la baie Déception /<br />
ESIA for the Deception Bay Wharf and Sediment Management<br />
Carte 6.4 / Map 6.4<br />
Localisation des stations de caractérisation du benthos et<br />
des herbiers aquatiques aux sites Q1 et Q2, août 2012 /<br />
Benthos and Aquatic-Grass Bed Characterization Stations<br />
Locations for Q1 and Q2 sites, August 2012<br />
Source :<br />
0 15 30 45 m<br />
Projection : UTM, zone 18, NAD83<br />
Équidistance des courbes / Contour Interval : 50 pieds / feet<br />
Base : BNDT, 1 : 50 000, 1976 à 1995**, © Sa Majesté la Reine du<br />
Chef du Canada, reproduit avec la permission de RNCan<br />
62°7'30"N<br />
62°8'4"N<br />
74°40'15"W<br />
74°40'10"W<br />
T8<br />
74°40'5"W<br />
62°8'4"N<br />
62°7'0"N<br />
Infrastructures portuaires / Wharf<br />
Route / Road<br />
74°42'0"W<br />
1200<br />
74°41'0"W<br />
74°40'0"W<br />
Inventaires et cartographie / Surveys and mapping : GENIVAR<br />
Fichier / File : 101_53046_EIES_BD_c6_4_benthos_121120.mxd<br />
Novembre / November 2012<br />
74°39'0"W<br />
101-53046-02<br />
62°7'0"N
Table 6.19 Inventory and recovery estimation (%) of aquatic plants found at sites Q1 and Q2.<br />
Q1<br />
Transect 1 Transect 2 Transect 3 Transect 4<br />
Phylum Class Order Family Genus Species Scientific name Quadrats 1 2 3 4 5 6 1 2 3 4 5 6 1 2 3 4 5 6 1 2 3 4 5 6<br />
Ochrophyta Phaeophyceae Laminariales Costariaceae Agarum cribrosum Agarum cribrosum 5 15<br />
Chlorophyta Ulvophyceae Cladophorales CladophoraceaeChaetomorpha melagonium Chaetomorpha melagonium<br />
Ochrophyta Phaeophyceae Laminariales Chordaceae Chorda filum Chorda filum 1 1 3 1 1 1<br />
Ochrophyta Phaeophyceae Fucales Fucaceae Fucus evanescens Fucus evanescens 5 50<br />
Ochrophyta Phaeophyceae Laminariales Laminariaceae Laminaria longicruris Laminaria longicruris 50 1 10 5 75 5<br />
Rhodophyta Florideophyceae Corallinales Corallinaceae Lithothamnium Lithothamnium 1<br />
Ochrophyta Phaeophyceae Phaeophyceae 20 40 5 15 10 95 80 5 10 60 10 25 25 5<br />
Q2<br />
Transect 5<br />
Transect 6 Transect 7 Transect 8<br />
Phylum Class Order Family Genus Species Scientific name Quadrats 1 2 3 4 5 6 1 2 3 4 5 6 1 2 3 4 5 6 1 2 3 4 5 6<br />
Ochrophyta Phaeophyceae Laminariales Costariaceae Agarum cribrosum Agarum cribrosum 3 15 3 5 10 ## 10 25 30<br />
Chlorophyta Ulvophyceae Cladophorales CladophoraceaeChaetomorpha melagonium Chaetomorpha melagonium 1<br />
Ochrophyta Phaeophyceae Laminariales Chordaceae Chorda filum Chorda filum 1<br />
Ochrophyta Phaeophyceae Fucales Fucaceae Fucus evanescens Fucus evanescens 3 20 95 15 75 80 15 60 5<br />
Ochrophyta Phaeophyceae Laminariales Laminariaceae Laminaria longicruris Laminaria longicruris 20 10 10 90 10 5 20 1 10<br />
Rhodophyta Florideophyceae Corallinales Corallinaceae Lithothamnium Lithothamnium 1<br />
Ochrophyta Phaeophyceae Phaeophyceae 25 70 25 5 70 5 15 5 50 5 5 5 5 65 5
Table 6.20 Epibenthic fauna inventory at sites Q1 and Q2.<br />
Q1<br />
Transect1 Transect 2 Transect 3 Transect 4<br />
Phylum Class Order Family Genus Species Scientific name Quadrats 1 2 3 4 5 6 1 2 3 4 5 6 1 2 3 4 5 6 1 2 3 4 5 6<br />
Chordata Ascidiacea<br />
Arthropoda Maxillopoda Sessilia Balanidae x x x<br />
Mollusca Bivalvia Pectinoida Pectinidae Chlamys islandica Chlamys islandica<br />
Mollusca Bivalvia Veneroida Cardiidae Clinocardium ciliatum Ciliatocardium ciliatum ciliatum<br />
Rhodophyta Florideophyceae Corallinales<br />
Arthropoda Malacostraca Decapoda x<br />
Mollusca Gastropoda Nudibranchia Flabellinidae Flabellina salmonacea Flabellina salmonacea<br />
Arthropoda Malacostraca Amphipoda Gammaridae Gammarus Gammarus sp. x x x x<br />
Chordata Ascidiacea Stolidobranchia Pyuridae Halocynthia pyriformis Halocynthia pyriformis<br />
Arthropoda Malacostraca Decapoda Oregoniidae Hyas araneus Hyas araneus<br />
Arthropoda Malacostraca Isopoda x<br />
Echinodermata Asteroidea Forcipulatida Asteriidae Leptasterias polaris Leptasterias (Hexasterias) polaris x<br />
Mollusca Gastropoda Littorinimorpha Littorinidae Littorina Littorina sp. x x x x x x x x x x x x<br />
Mollusca Gastropoda Littorinimorpha Naticidae Lunatia heros Lunatia heros x<br />
Mollusca Bivalvia Myoida Myidae Mya arenaria Mya arenaria<br />
Arthropoda Malacostraca Mysida Mysidae Mysis Mysis sp. x x x x x x x x x x x x x x x<br />
Mollusca Bivalvia Mytiloida Mytilidae Mytilus edulis Mytilus edulis x x x x x x x x<br />
Echinodermata Ophiuroidea Ophiurida Ophiuridae Ophiura sarsi Ophiura sarsii x x x<br />
Mollusca Gastropoda Patellidae Patella Patella sp. x<br />
Annelida Polychaeta Terebellida Pectinariidae Pectinaria gouldii Pectinaria gouldii<br />
Porifera<br />
Echinodermata Holothuroidea Dendrochirotida Psolidae Psolus fabricii Psolus fabricii<br />
Annelida Polychaeta Sabellida Sabellidae<br />
Mollusca Bivalvia Veneroida Cardiidae Serripes groenlandicusSerripes groenlandicus x<br />
Echinodermata Echinoidea Camarodonta StrongylocentrotidaStrongylocentrotus Strongylocentrotus sp.<br />
Q2<br />
Transect 5 Transect 6 Transect 7 Transect 8<br />
Phylum Class Order Family Genus Species Scientific name Quadrats 1 2 3 4 5 6 1 2 3 4 5 6 1 2 3 4 5 6 1 2 3 4 5 6<br />
Chordata Ascidiacea x x x x x x<br />
Arthropoda Maxillopoda Sessilia Balanidae x x x<br />
Mollusca Bivalvia Pectinoida Pectinidae Chlamys islandica Chlamys islandica x x x<br />
Mollusca Bivalvia Veneroida Cardiidae Clinocardium ciliatum Ciliatocardium ciliatum ciliatum x<br />
Rhodophyta Florideophyceae Corallinales x<br />
Arthropoda Malacostraca Decapoda x<br />
Mollusca Gastropoda Nudibranchia Flabellinidae Flabellina salmonacea Flabellina salmonacea x x x<br />
Arthropoda Malacostraca Amphipoda Gammaridae Gammarus Gammarus sp. x x x x x x x x<br />
Chordata Ascidiacea Stolidobranchia Pyuridae Halocynthia pyriformis Halocynthia pyriformis x x<br />
Arthropoda Malacostraca Decapoda Oregoniidae Hyas araneus Hyas araneus x x x x<br />
Arthropoda Malacostraca Isopoda x<br />
Echinodermata Asteroidea Forcipulatida Asteriidae Leptasterias polaris Leptasterias (Hexasterias) polaris<br />
Mollusca Gastropoda Littorinimorpha Littorinidae Littorina Littorina sp. x x x x x x x x x x x x x x x x x<br />
Mollusca Gastropoda Littorinimorpha Naticidae Lunatia heros Lunatia heros<br />
Mollusca Bivalvia Myoida Myidae Mya arenaria Mya arenaria x<br />
Arthropoda Malacostraca Mysida Mysidae Mysis Mysis sp. x x x x<br />
Mollusca Bivalvia Mytiloida Mytilidae Mytilus edulis Mytilus edulis x x x x x x x x x x x x x x x x x<br />
Echinodermata Ophiuroidea Ophiurida Ophiuridae Ophiura sarsi Ophiura sarsii x x x x<br />
Mollusca Gastropoda Patellidae Patella Patella sp. x x x x<br />
Annelida Polychaeta Terebellida Pectinariidae Pectinaria gouldii Pectinaria gouldii x<br />
Porifera<br />
x<br />
Echinodermata Holothuroidea Dendrochirotida Psolidae Psolus fabricii Psolus fabricii x x x<br />
Annelida Polychaeta Sabellida Sabellidae x x<br />
Mollusca Bivalvia Veneroida Cardiidae Serripes groenlandicusSerripes groenlandicus x x x x<br />
Echinodermata Echinoidea Camarodonta StrongylocentrotidaStrongylocentrotus Strongylocentrotus sp. x x<br />
X: presence of the taxon
Table 6.21 Endobenthic invertebrates densities (no. of orgamismes/m 2 ) measured at sites Q1 and Q2, August 2012.<br />
Q1<br />
Q2<br />
Phylum Class Order Family Genus Species Scientific name T1-1 T1-3 T2-5 T3-3 T3-5 T4-3 T5-1 T5-3 T5-5 T6-3 T7-1 T7-3 T7-5 T8-1 T8-3 T8-5<br />
Arthropoda Ostracoda Podocopida Trachyleberididae Acanthocytherdunelmensis Acanthocythereis dunelmensis 0 29 0 0 0 0 0 116 290 0 0 0 0 0 0 0<br />
Mollusca Gastropoda Acmaeidae Acmaea testudinalis Testudinalia testudinalis 0 29 0 58 0 0 0 0 0 0 0 0 232 0 0 0<br />
Annelida Polychaeta Terebellida Ampharetidae Ampharete Ampharete sp. 0 58 0 116 0 0 0 0 116 0 0 58 58 0 0 0<br />
Annelida Polychaeta Terebellida Ampharetidae 58 0 0 174 29 0 0 0 0 0 0 0 0 0 0 0<br />
Annelida Polychaeta Terebellida Terebellidae Amphitrite cirrata Amphitrite cirrata 0 0 0 0 0 0 0 0 0 0 0 0 58 0 0 0<br />
Arthropoda Malacostraca Amphipoda Uristidae Anonyx Anonyx sp. 0 0 0 0 0 0 0 0 0 0 0 0 0 0 0 116<br />
Annelida Polychaeta Paraonidae Aricidea hartmani Aricidea c.f. hartmani 0 58 0 58 0 0 0 0 406 116 0 0 0 0 754 58<br />
Annelida Polychaeta Paraonidae Aricidea nolani Aricidea nolani 0 0 0 58 0 0 0 464 0 174 0 58 58 0 0 0<br />
Annelida Polychaeta Paraonidae Aricidea Aricidea sp. 0 87 0 0 0 0 0 116 0 0 0 0 0 0 0 58<br />
Annelida Polychaeta Terebellida Ampharetidae Asabellides sibirica Asabellides sibirica 0 29 0 1 043 0 0 0 116 0 0 0 348 580 0 406 0<br />
Chordata Ascidiacea 0 0 0 0 0 0 0 0 0 29 29 0 0 0 0 0<br />
Chordata Ascidiacea Phlebobranch Ascidiidae Ascidiidae spp. 0 0 0 0 0 0 0 0 58 0 0 0 0 0 0 0<br />
Mollusca Bivalvia Carditoida Astartidae Astarte elliptica Astarte elliptica complexe 0 0 0 0 0 0 0 116 290 0 0 0 0 0 0 0<br />
Mollusca Bivalvia Carditoida Astartidae Astarte montagui Astarte montagui complexe 0 0 0 0 0 0 0 0 58 0 0 0 116 0 0 0<br />
Mollusca Bivalvia Carditoida Astartidae Astarte Astarte sp. 0 29 0 0 0 0 0 0 0 0 0 0 0 0 0 0<br />
Echinodermat Asteroidea 0 0 0 0 29 0 0 0 0 0 0 0 0 0 0 0<br />
Annelida Polychaeta Phyllodocida Syllidae 0 0 0 0 0 0 0 0 0 0 0 0 58 0 0 0<br />
Mollusca Bivalvia Lucinoida ThyasiridaeAxinopsida orbiculata Axinopsida orbiculata 0 0 29 0 0 0 0 0 0 0 0 0 464 0 0 0<br />
Annelida Polychaeta Phyllodocida Nephtyidae Bipalponephtyneotena Bipalponephtys neotena 58 0 145 116 58 0 0 0 116 0 0 0 0 0 0 0<br />
Mollusca Bivalvia 1 043 551 0 1 913 87 87 0 348 464 29 0 0 290 0 116 0<br />
Bryozoa 0 0 0 0 0 0 0 0 0 0 0 0 0 0 0 29<br />
Mollusca Gastropoda NeogastropodBuccinidae Buccinidae spp. 0 0 0 0 0 0 0 0 0 0 0 0 58 0 0 0<br />
Arthropoda Maxillopoda Calanoida 0 0 0 0 29 0 0 0 0 0 0 0 0 0 0 0<br />
Bryozoa Gymnolaemat CheilostomatidCalloporidae Callopora lineata Callopora lineata 0 0 0 0 0 0 0 0 0 0 0 0 29 0 0 0<br />
Cnidaria Hydrozoa Leptothecata Campanulariidae Campanulariidae spp. 0 29 0 0 0 0 0 0 0 0 0 0 0 0 0 0<br />
Annelida Polychaeta Capitellidae Capitella capitata Capitella capitata 406 319 0 812 0 3 333 29 116 232 377 1 333 58 0 87 116 0<br />
Annelida Polychaeta Capitellidae Capitella Capitella sp. A 0 493 0 986 0 0 0 0 58 87 0 0 0 0 0 0<br />
Annelida Polychaeta Capitellidae Capitellidae spp.A 348 29 0 116 0 0 0 232 0 319 0 174 0 0 290 58<br />
Arthropoda Malacostraca Amphipoda Caprellidae Caprella Caprella sp. 0 0 0 0 0 0 0 0 0 0 0 0 0 0 0 58<br />
Mollusca Bivalvia Veneroida Cardiidae Cardiidae spp. 0 0 0 58 87 0 0 0 0 0 0 0 0 0 0 0<br />
Bryozoa Gymnolaemat CheilostomatidCelleporidae Cellepora Cellepora sp. 0 29 0 29 0 0 0 0 0 0 0 0 0 0 0 0<br />
Bryozoa Gymnolaemat CheilostomatidCelleporidae Celleporidae spp. 0 0 29 0 0 0 0 0 0 0 0 0 0 0 0 0<br />
Annelida Polychaeta Terebellida Cirratulidae Chaetozone Chaetozone sp. 609 0 58 0 0 0 0 8 116 4 406 4 783 0 0 1 797 0 0 696<br />
Bryozoa Gymnolaemat Cheilostomatida Cheilostomatida 0 0 0 0 0 0 0 0 29 0 0 0 0 0 0 0<br />
Mollusca Bivalvia Veneroida Cardiidae Ciliatocardiumciliatum Ciliatocardium ciliatum 0 0 58 0 0 0 0 0 58 0 0 0 0 0 0 0<br />
Annelida Polychaeta Terebellida Cirratulidae Cirratulidae spp. 0 116 0 348 0 0 0 0 0 0 0 290 0 0 0 0<br />
Annelida Polychaeta Terebellida Pectinariidae Cistenides hyperborea Cistenides hyperborea 899 783 58 580 29 145 0 696 58 406 0 812 406 0 406 58<br />
Annelida Polychaeta Cossuridae Cossura Cossura sp. 0 0 0 0 0 0 0 116 0 0 0 0 58 0 0 0<br />
Mollusca Bivalvia Mytiloida Mytilidae Crenella faba Crenella faba 0 29 0 812 0 174 0 0 0 29 0 0 0 0 0 0<br />
Bryozoa Stenolaemata CyclostomatidCrisiidae Crisia Crisia sp. 0 0 0 0 0 0 0 0 0 0 0 0 29 0 0 0<br />
Arthropoda Malacostraca Cumacea 0 0 0 0 29 0 0 0 0 0 0 0 0 0 0 0<br />
Arthropoda Maxillopoda Cyclopoida 0 0 0 0 0 0 0 3 130 522 406 0 0 58 0 0 0<br />
Bryozoa Stenolaemata Cyclostomata 0 0 0 0 0 0 0 0 29 0 0 0 0 0 0 0<br />
Arthropoda Ostracoda Podocopida 841 174 0 232 0 87 0 1 275 1 913 29 0 696 638 0 116 0<br />
Echinodermat Holothuroidea 29 0 0 0 0 0 0 0 0 0 0 0 0 0 0 0<br />
Arthropoda Malacostraca Cumacea Diastylidae Diastylis rathkei Diastylis rathkei sarsi 0 0 0 0 29 0 0 0 0 0 0 0 0 0 0 0<br />
Annelida Polychaeta Phyllodocida Phyllodocidae Eteone Eteone sp.A 2 087 406 0 1 275 0 0 0 1 855 406 783 87 174 406 29 232 58<br />
Annelida Polychaeta Sabellida Sabellidae Euchone analis Euchone analis 174 0 0 464 0 0 0 232 0 58 0 4 754 0 0 406 0<br />
Annelida Polychaeta Sabellida Sabellidae Euchone incolor Euchone incolor 0 0 0 0 0 0 0 232 0 0 0 0 0 0 0 0<br />
Annelida Polychaeta Sabellida Sabellidae Euchone Euchone sp. 0 0 0 0 0 0 0 0 0 0 0 0 290 0 0 0<br />
Annelida Polychaeta Sabellida Sabellidae Sabellinae 377 0 0 0 0 0 0 580 0 58 0 0 0 0 522 0<br />
Foraminifera 725 464 319 116 116 0 0 464 4 000 0 0 290 3 362 0 58 0<br />
Annelida Polychaeta Sabellida Oweniidae Galathowenia Galathowenia sp. 0 0 0 0 0 0 0 116 0 0 0 0 0 0 0 0<br />
Arthropoda Malacostraca Amphipoda 0 58 29 58 29 0 29 232 0 58 0 174 116 29 406 58<br />
Arthropoda Malacostraca Amphipoda Gammaridae Gammarus Gammarus sp. 29 0 0 0 0 0 0 0 0 0 29 0 0 0 0 0<br />
Annelida Polychaeta Phyllodocida Polynoidae Gattyana cirrosa Gattyana cirrosa 0 0 0 0 0 0 0 232 0 0 0 0 0 0 0 0<br />
Annelida Polychaeta Phyllodocida Polynoidae Gattyana Gattyana sp. 0 0 0 58 0 0 0 0 0 0 0 0 0 0 0 0<br />
Arthropoda Malacostraca Amphipoda Dexaminidae Guernea nordenskioldi Guernea (Prinassus) c.f. nordenskioldi 0 29 0 0 0 29 0 232 522 0 0 0 58 0 58 0<br />
Cephalorhync Priapulida Priapulidae Halicryptus spinulosus Halicryptus c.f. spinulosus 0 0 0 0 0 0 0 0 0 0 0 0 0 29 0 0<br />
Annelida Polychaeta Phyllodocida Polynoidae Harmothoe Harmothoe sp. 0 29 0 116 0 0 0 0 0 0 0 0 58 0 0 58<br />
Arthropoda Maxillopoda Harpacticoida 464 29 0 3 652 29 0 0 116 0 58 0 406 0 0 580 58<br />
Mollusca Bivalvia [unassigned] EHiatellidae Hiatella arctica Hiatella arctica 0 58 87 928 29 0 0 0 58 0 0 0 174 0 0 58<br />
Bryozoa Gymnolaemat CheilostomatidHippothoidae Hippothoa hyalina Celleporella hyalina 0 0 0 0 0 29 0 29 0 29 0 0 0 0 0 0<br />
Cnidaria Hydrozoa 29 0 0 29 0 0 0 0 0 0 0 0 0 0 29 0<br />
Inconnu A 0 0 0 0 0 0 0 116 0 29 0 58 0 0 0 0<br />
Inconnu B 0 0 0 0 0 0 0 0 0 0 0 0 58 0 0 0
Table 6.21 Endobenthic invertebrates densities (no. of orgamismes/m2) measured at sites Q1 and Q2, August 2012. (continuation)<br />
Q1<br />
Q2<br />
Phylum Class Order Family Genus Species Scientific name T1-1 T1-3 T2-5 T3-3 T3-5 T4-3 T5-1 T5-3 T5-5 T6-3 T7-1 T7-3 T7-5 T8-1 T8-3 T8-5<br />
Arthropoda Malacostraca Cumacea Lampropidae Lamprops fuscatus Lamprops fuscatus 0 29 29 0 0 0 0 116 116 0 0 0 0 0 0 0<br />
Annelida Polychaeta Sabellida Sabellidae Laonome kroyeri Laonome kroyeri 0 0 0 0 0 0 0 0 0 0 0 0 0 0 290 0<br />
Annelida Polychaeta Terebellida Terebellidae Laphania boecki Laphania boecki 0 0 0 0 0 0 0 0 0 0 0 0 58 0 0 0<br />
Arthropoda Malacostraca Cumacea Leuconidae Leucon nasicoides Leucon (Leucon) nasicoides 0 0 0 0 0 0 0 0 116 0 0 0 0 0 0 0<br />
Bryozoa Stenolaemata CyclostomatidLichenoporidae Lichenoporidae spp. 0 29 0 0 0 0 0 0 0 29 0 0 0 0 0 0<br />
Mollusca Gastropoda LittorinimorphaLittorinidae Littorina obtusata Littorina obtusata 0 0 0 0 0 0 116 0 0 0 2 145 0 0 1 420 0 0<br />
Mollusca Gastropoda LittorinimorphaNaticidae Lunatia pallida Lunatia pallida 0 0 0 0 0 0 0 0 58 29 0 0 0 0 0 0<br />
Arthropoda Malacostraca Amphipoda Lysianassidae Lysianassidae spp. 290 29 0 0 29 29 0 0 0 406 0 58 0 0 0 0<br />
Annelida Polychaeta Terebellida Ampharetidae Lysippe fragilis Lysippe cf. fragilis 0 0 0 58 0 0 0 0 0 58 0 0 0 0 0 0<br />
Annelida Polychaeta Terebellida Ampharetidae Lysippe Lysippe sp. 29 0 0 0 0 0 0 0 116 0 0 0 58 0 0 174<br />
Mollusca Bivalvia Veneroida Tellinidae Macoma balthica Macoma balthica 0 0 0 0 0 0 0 0 0 0 116 0 0 29 0 0<br />
Mollusca Bivalvia Veneroida Tellinidae Macoma calcarea Macoma calcarea 0 0 0 116 0 0 0 116 116 0 0 0 58 0 0 0<br />
Annelida Polychaeta Maldanidae Maldanidae spp. 0 29 0 0 0 0 0 0 0 0 0 0 0 0 0 0<br />
Mollusca Gastropoda Turbinidae Margarites helicinus Margarites helicinus 0 0 0 638 0 116 0 0 0 58 0 0 0 0 0 0<br />
Mollusca Gastropoda Turbinidae Margarites Margarites sp.A 0 0 0 0 0 0 0 0 58 0 0 0 0 0 0 0<br />
Arthropoda Malacostraca Amphipoda Stenothoidae Mesometopa neglecta Mesotopa neglecta 0 0 0 0 0 0 0 0 0 0 0 0 116 0 0 0<br />
Mollusca Bivalvia Myoida Myidae Mya pseudoarenar Mya pseudoarenaria 203 58 29 174 87 0 0 0 174 0 0 116 116 0 1 275 0<br />
Annelida Polychaeta Phyllodocida Hesionidae Microphthalmus Microphthalmus sp.A 0 29 0 116 0 0 0 0 0 0 0 116 0 0 0 0<br />
Arthropoda Malacostraca Amphipoda Oedicerotidae Monoculodes borealis Monoculodes borealis 0 0 0 0 0 0 0 0 0 29 0 0 0 0 0 0<br />
Arthropoda Malacostraca Amphipoda Oedicerotidae Monoculodes norvegicus Monoculodes norvegicus 0 29 0 0 0 0 0 0 0 0 0 0 0 0 0 0<br />
Arthropoda Malacostraca Amphipoda Oedicerotidae Monoculopsis longicornis Monoculopsis longicornis 0 0 0 0 0 0 0 116 0 0 0 0 0 0 0 0<br />
Arthropoda Malacostraca Amphipoda Pontoporeiidae Monoporeia affinis Monoporeia affinis 0 0 0 0 0 0 0 0 0 29 0 0 0 0 0 0<br />
Mollusca Bivalvia Veneroida Montacutidae Montacutidae spp. 0 203 0 0 0 0 0 0 464 0 0 0 174 0 0 0<br />
Mollusca Bivalvia Mytiloida Mytilidae Mytilus Mytilus sp. 0 0 0 406 0 232 0 0 0 0 0 0 0 0 1 217 0<br />
Arthropoda Malacostraca Nebaliacea Nebaliidae Nebalia bipes Nebalia bipes 0 0 0 0 0 116 0 0 58 0 0 0 0 0 0 0<br />
Nematoda 1 101 1 594 58 11 768 0 290 1 014 8 812 4 348 3 159 232 16 000 2 841 29 9 507 6 377<br />
Annelida Polychaeta Eunicida Lumbrineridae Ninoe Ninoe sp. 29 0 0 0 0 0 0 0 0 0 0 0 0 0 0 0<br />
Mollusca Bivalvia Nuculida Nuculidae Nucula Nucula sp. 0 0 0 0 0 0 0 0 0 0 0 0 0 0 0 58<br />
Mollusca Gastropoda NeogastropodMangeliidae Oenopota arctica Propebela arctica 0 0 0 0 0 0 0 0 0 0 0 0 58 0 0 0<br />
Mollusca Gastropoda NeogastropodMangeliidae Oenopota bicarinata Oenopota c.f. bicarinata 0 0 0 0 0 0 0 0 58 0 0 0 0 0 0 0<br />
Annelida Clitellata 1 188 319 0 290 0 87 6 377 2 087 754 812 406 232 116 232 348 1 391<br />
Arthropoda Malacostraca Amphipoda Uristidae Onisimus litoralis Onisimus litoralis 0 0 0 0 0 0 0 0 0 29 0 0 0 0 58 0<br />
Annelida Polychaeta Opheliidae Ophelia limacina Ophelia limacina 29 174 0 116 0 0 0 0 0 58 0 174 0 0 9 391 0<br />
Annelida Polychaeta Orbinidae spp. 0 29 0 0 0 0 0 0 0 29 0 0 0 0 58 0<br />
Arthropoda Malacostraca Amphipoda Lysianassidae Orchomenella minuta Orchomenella minuta 0 0 0 116 0 0 0 0 58 58 0 174 0 0 464 0<br />
Annelida Polychaeta Sabellida Oweniidae Oweniidae spp. 0 0 0 0 0 0 0 0 116 0 0 0 0 0 0 0<br />
Annelida Polychaeta Paraonidae Paraonella nordica Paraonella nordica 0 290 0 0 0 0 0 696 1 333 0 0 0 1 623 0 0 1 565<br />
Arthropoda Malacostraca Amphipoda Oedicerotidae Paroediceros lynceus Paroediceros lynceus 0 0 0 0 0 0 0 0 116 0 0 0 0 0 58 0<br />
Annelida Polychaeta Terebellida Pectinariidae Pectinariidae spp. 58 0 0 0 0 0 0 0 58 0 0 0 0 0 0 0<br />
Mollusca Gastropoda CephalaspideaPhilinidae Philine Philine sp. 0 0 0 0 0 0 0 116 0 0 0 0 0 0 0 0<br />
Arthropoda Ostracoda Myodocopida Philomedidae Philomedes Philomedes sp. 0 29 0 0 0 0 0 464 174 0 0 0 754 0 0 58<br />
Annelida Polychaeta Phyllodocida Pholoidae Pholoe longa Pholoe longa 2 464 493 0 1 681 0 0 0 1 623 464 1 014 0 32 058 1 101 0 19 420 3 362<br />
Annelida Polychaeta Phyllodocida Pholoidae Pholoe Pholoe sp. 3 623 2 841 174 3 710 203 348 0 1 159 2 725 0 87 5 681 1 159 0 13 159 4 348<br />
Arthropoda Malacostraca Amphipoda Photidae Photidae spp. 0 0 0 0 0 0 0 0 58 0 0 0 0 0 0 0<br />
Annelida Polychaeta Phyllodocida Phyllodocidae Phyllodoce groenlandica Phyllodoce (Anaitides) groenlandica 29 29 0 0 0 0 0 116 116 0 0 58 0 0 0 0<br />
Annelida Polychaeta Terebellida Terebellidae Polycirrus Polycirrus sp. 0 0 0 0 0 0 0 0 0 0 0 0 58 0 0 0<br />
Arthropoda Malacostraca Amphipoda Pontogeneiidae Pontogeneia Pontogeneia sp. 0 0 0 0 0 0 0 0 0 58 0 0 0 0 58 0<br />
Arthropoda Malacostraca Amphipoda Pontoporeiidae Pontoporeia femorata Pontoporeia femorata 0 0 0 0 0 0 0 0 58 0 0 0 0 0 0 0<br />
Mollusca Bivalvia Nuculanoida Yoldiidae Portlandia arctica Portlandia arctica 0 0 0 0 0 0 0 0 0 0 0 0 58 0 0 0<br />
Annelida Polychaeta Maldanidae Praxillella praetermissa Praxillella praetermissa 0 0 0 0 0 0 0 232 0 87 0 58 0 0 0 116<br />
Annelida Polychaeta Maldanidae Praxillella Praxillella sp. 0 0 0 0 0 0 0 0 58 0 0 0 116 0 0 0<br />
Cephalorhync Priapulida Priapulidae Priapulus caudatus Priapulus caudatus 0 0 0 0 0 0 0 0 58 29 0 0 0 0 0 0<br />
Annelida Polychaeta Spionida Spionidae Prionospio Prionospio sp. 58 0 0 58 0 0 0 0 0 0 0 0 0 0 0 0<br />
Arthropoda Malacostraca Amphipoda Corophiidae Protomedeia fasciata Protomedeia fasciata 0 174 0 0 0 0 0 0 0 0 0 1 275 0 0 7 768 0<br />
Arthropoda Malacostraca Amphipoda Corophiidae Protomedeia grandimana Protomedeia c.f. grandimana 0 0 0 0 0 0 0 0 58 0 0 0 0 0 0 0<br />
Arthropoda Malacostraca Amphipoda Corophiidae Protomedeia Protomedeia sp. 0 0 0 0 0 0 0 0 58 0 0 0 0 0 0 0<br />
Mollusca Gastropoda CephalaspideaRetusidae Retusa obtusa Retusa obtusa 0 29 0 0 0 0 0 0 0 29 0 0 0 0 0 0<br />
Chordata Ascidiacea Stolidobranch Molgulidae Rhizomolgula globularis Rhizomolgula globularis 0 0 0 0 0 0 0 0 0 0 0 58 0 0 0 0<br />
Annelida Polychaeta Sabellida Sabellidae Sabellidae spp. 0 0 0 0 0 0 0 0 0 0 0 58 0 0 58 0<br />
Arthropoda Ostracoda Podocopida Cytherideidae Sarsicytheridea Sarsicytheridea sp. 0 29 29 0 0 0 0 4 290 5 565 174 29 58 1 043 0 0 0<br />
Annelida Polychaeta Scalibregmatidae Scalibregma inflatum Scalibregma inflatum 58 0 0 0 0 0 0 116 0 0 0 0 348 0 58 58<br />
Bryozoa Gymnolaemat CheilostomatidSchizoporellidae Schizoporella costata Schizoporella c.f. costata 0 0 0 0 0 0 0 0 29 0 0 0 0 0 0 0<br />
Annelida Polychaeta Eunicida Lumbrineridae Lumbrineris fragilis Lumbrineris c.f. fragilis 0 29 87 0 29 0 0 0 348 0 0 0 58 0 0 58<br />
Annelida Polychaeta Eunicida Lumbrineridae Scoletoma impatiens Scoletoma c.f. impatiens 29 0 0 0 29 0 0 116 0 0 0 0 0 0 0 0<br />
Annelida Polychaeta Eunicida Lumbrineridae Scoletoma Scoletoma sp. 0 0 0 0 0 0 0 0 290 0 0 0 0 0 0 0<br />
Annelida Polychaeta Orbiniidae Scoloplos armiger Scoloplos (Scoloplos) armiger 3 188 1 101 0 116 0 0 0 2 319 1 739 783 0 870 1 391 0 986 522<br />
Annelida Polychaeta Orbiniidae Scoloplos Scoloplos sp. 0 0 29 0 0 0 0 0 0 0 0 0 0 0 0 0<br />
Bryozoa Gymnolaemat CheilostomatidCandidae Scrupocellariascabra Scrupocellaria scabra 0 0 0 0 0 0 0 0 0 0 0 0 29 0 0 0
Table 6.21 Endobenthic invertebrates densities (no. of orgamismes/m2) measured at sites Q1 and Q2, August 2012. (continuation)<br />
Q1<br />
Q2<br />
Phylum Class Order Family Genus Species Scientific name T1-1 T1-3 T2-5 T3-3 T3-5 T4-3 T5-1 T5-3 T5-5 T6-3 T7-1 T7-3 T7-5 T8-1 T8-3 T8-5<br />
Bryozoa Gymnolaemat CheilostomatidScrupocellariidae 0 0 0 0 0 0 0 0 0 0 0 0 29 0 0 0<br />
Mollusca Bivalvia Veneroida Cardiidae Serripes groenlandicus Serripes groenlandicus 0 0 0 0 0 0 0 116 58 0 0 0 0 0 0 0<br />
Bryozoa Gymnolaemat CheilostomatidSmittinidae Smittinidae spp. 0 29 0 0 0 0 0 0 0 0 0 0 0 0 0 0<br />
Annelida Polychaeta Spionida Spionidae Spionidae spp. 0 0 0 0 29 0 0 0 0 0 0 0 0 0 0 0<br />
Annelida Polychaeta Sabellida Serpulidae Spirorbis Spirorbis sp. 29 0 29 0 0 29 0 0 0 29 0 0 58 0 0 58<br />
Echinodermat Ophiuroidea Ophiurida Ophiuridae Stegophiura nodosa Stegophiura nodosa 0 0 0 0 0 0 0 0 0 0 0 0 0 0 0 58<br />
Annelida Polychaeta Phyllodocida Syllidae Streptospinigera Streptospinigera sp. 0 0 0 0 0 0 0 348 0 0 0 0 0 0 0 0<br />
Mollusca Gastropoda [unassigned] CTurritellidae Tachyrhynchuerosus Tachyrhynchus erosus 0 0 0 0 0 0 0 0 58 0 0 0 0 0 0 0<br />
Mollusca Bivalvia Veneroida Tellinidae Tellinidae spp. 0 0 0 0 0 0 0 0 58 0 0 0 0 0 0 0<br />
Annelida Polychaeta Terebellida Trichobranchidae Terebellides stroemi Terebellides stroemii 0 29 0 0 0 0 0 0 58 0 0 0 0 0 0 0<br />
Annelida Polychaeta Terebellida 0 0 0 0 0 0 0 0 116 0 0 0 0 0 0 0<br />
Mollusca Bivalvia Lucinoida Thyasiridae Thyasira gouldi Thyasira gouldi 0 0 0 0 0 0 0 0 58 0 0 0 0 0 0 0<br />
Mollusca Bivalvia Lucinoida Thyasiridae Thyasira Thyasira sp. A 0 58 0 116 0 0 0 116 290 0 0 0 232 0 0 58<br />
Arthropoda Ostracoda Podocopida Trachyleberididae Trachyleberididae spp. 0 0 29 0 0 0 0 0 0 0 0 0 0 0 0 0<br />
Annelida Polychaeta Terebellida Trichobranchidae Trichobranchuglacialis Trichobranchus glacialis 0 0 0 0 0 0 0 0 58 0 0 0 0 0 0 0<br />
Mollusca Gastropoda Trochidae Trochidae spp. 0 0 0 0 0 0 0 0 406 0 0 0 0 0 0 0<br />
Bryozoa Stenolaemata CyclostomatidTubuliporidae Tubuliporidae spp. 0 29 0 0 0 0 0 29 0 0 0 0 29 0 0 0<br />
Mollusca Gastropoda NeogastropodTurridae Turridae spp. 0 29 0 0 0 0 0 0 0 0 0 0 0 0 0 174<br />
20 580 11 710 1 304 33 681 1 014 5 130 7 565 42 493 35 159 14 841 4 493 65 391 21 188 1 884 68 667 19 855<br />
Average Q1 12 237<br />
Average Q2 28 154
According to Figures 6.15 and 6.16, the proportion of the phyla composing the<br />
samples is similar between the two sites. In both cases, the annelids occupy more<br />
than half the samples, i.e. 56% and 61% for Q1 and Q2 respectively. The proportion<br />
of nematodes is almost identical at the two sites (20% and 19%). We should note<br />
that a small proportion of bryozoans, cnidaria and echinoderms were collected in the<br />
study zone (Table 6.21). The low abundance rates compared to the other phyla do<br />
not allow them to be distinguished in Figures 6.22 and 6.23.<br />
The total density of organisms varies greatly from one site to another. The mean<br />
density of 28,154 organisms/m 2 found at site Q2 is more than double the mean<br />
density of 12,237 organisms/m 2 collected at site Q1. We should note that the mean<br />
density at site Q1 is in the same order of magnitude as the one during the 2007<br />
campaign regarding the site of the future port facilities (19,057 organisms/m 2 ).<br />
Statistical analyses were applied to the data. The results of these analyses are<br />
indicated in Table 6.22. The specific richness (S) made it possible to count the<br />
species present at each station. The Shannon-Wiener index (H’) was used to<br />
express the diversity of the sampled stations. This index allows the number and<br />
abundance of species to be taken into account for the same station. Finally, Pielou’s<br />
evenness index (J’), allows calculation of the ratio of the observed diversity to the<br />
maximum diversity.<br />
The number of different taxa identified in the 16 samples ranges from five (T5-1) to<br />
62 (T5-5) (Table 6.22). The stations closest to the shore contain a lesser number of<br />
species that the stations farther away. Pielou’s index ranges from 0.323 (T5-1) to<br />
0.912 (T3-5). In the analysis of these results, station T3-5 shows a good distribution<br />
of abundance rates among species collected, while station T5-1 shows an<br />
abundance rate exceeding 80% for oligochaetes.<br />
The highest values for the Shannon-Wiener diversity index are found at stations<br />
T7-5 (3.034), T5-5 (2.969) and T1-3 (2.859). Stations T8-1 (0.934) and T5-1 (0.520)<br />
recorded the lowest values. For the majority of the stations, for the same transect,<br />
the highest Shannon-Wiener index is found at the station farthest from the shore,<br />
namely at the stations with the greatest depth.<br />
The mean specific richness values (S) for sites Q1 and Q2 respectively indicate a<br />
similar number of identified taxa (29 and 34). However, the mean Shannon-Wiener<br />
diversity index is higher at site Q1. Moreover, the highest value for the Pielou index<br />
shows a better distribution of the sampled species compared to site Q2.<br />
Canadian Royalties Inc.<br />
GENIVAR<br />
101-53046-02 November 2012<br />
117
Figure 6.15 Proportions of phyla collected at site Q1, August 2012.<br />
Figure 6.16 Proportions of phyla collected at site Q21, August 2012.<br />
Canadian Royalties Inc.<br />
GENIVAR<br />
101-53046-02 November 2012<br />
118
Table 6.22<br />
Diversity indices for the 16 stations sampled at sites Q1 and Q2 in<br />
Deception Bay, August 2012.<br />
Site Station S J' H'<br />
T1-1 32 0.767 2.660<br />
T1-3 51 0.727 2.859<br />
Q1<br />
T2-5 18 0.876 2.533<br />
T3-3 41 0.680 2.526<br />
T3-5 19 0.912 2.686<br />
T4-3 15 0.545 1.476<br />
Mean -- 29.33 0.750 2.460<br />
T5-1 5 0.323 0.520<br />
T5-3 45 0.724 2.756<br />
T5-5 62 0.719 2.969<br />
T6-3 40 0.650 2.398<br />
Q2<br />
T7-1 10 0.620 1.428<br />
T7-3 30 0.478 1.625<br />
T7-5 50 0.776 3.034<br />
T8-1 8 0.449 0.934<br />
T8-3 32 0.615 2.130<br />
T8-5 29 0.606 2.040<br />
Mean -- 34 0.600 1.980<br />
S : specific richness<br />
J’ : Pielou’s evenness index<br />
H’: Shannon-Wiener index<br />
6.2.1.3 Ichthyofauna<br />
According to the previous information obtained from Inuit fishermen, sport fishermen<br />
working at the Raglan Mine and scientific fishing conducted in Deception Bay<br />
(Therrien et al., 2008), the Arctic Char (Salvelinus alpinus), the Greenland Cod<br />
(Gadus ogac), the Arctic Cod (Boreogadus saida), sculpins and sticklebacks are the<br />
main fish species present in the bay. Among these, the Arctic Char, sticklebacks and<br />
sculpins are the most likely to use the coastline for their feeding and breeding<br />
activities (spawning, rearing) (Scott and Scott, 1988).<br />
The Arctic Char is also associated with the pelagic zone, near the surface, and uses<br />
the bay only for summer feeding and migration. Its breeding occurs in fresh water.<br />
The Arctic Cod (or Arctic Tomcod) is mainly associated with the deeper pelagic<br />
zones. For the Greenland Cod, the information in the literature is too incomplete to<br />
document its use of coastal habitats (GENIVAR, 2008). However, the site Q1 habitat<br />
is not unique and is found elsewhere around Deception Bay.<br />
The species captured during the September 2007 sampling operations contribute to<br />
improving the knowledge level of the fish populations of Deception Bay<br />
(GENIVAR, 2008). Some of these species could frequent shallower zones, such as<br />
Canadian Royalties Inc.<br />
GENIVAR<br />
101-53046-02 November 2012<br />
119
those near site Q1. They are the Shorthorn Sculpin, the Daubed Shanny (Lumpenus<br />
maculatus) and the Grubby. The Arctic Eelpout (Lycodes reticulatus), the Canadian<br />
Plaice (Hippoglossoides platessoides) and the Atlantic Cod (Gadus morhua) were<br />
also harvested in September 2007.<br />
Table 6.23 presents a description of the fish species frequenting Deception Bay. This<br />
information is taken from Scott and Scott (1988) and the Fishbase website at<br />
http://www.fishbase.org/.<br />
6.2.1.4 Marine Mammals<br />
About ten marine mammal species can be found in Deception Bay, depending on<br />
their range (GENIVAR, 2007). Table 6.24 presents the list and summarizes the<br />
information gathered from the Inuit. Among these species, six are particularly of<br />
interest due to their abundance, their status and, above all, their use by the Inuit.<br />
They are the Beluga, the Minke Whale, the Ringed Seal the Harp Seal, the Bearded<br />
Seal and the Bowhead Whale.<br />
The species observed during the acoustic pressure measuring work in Deception<br />
Bay in July 2012 are highlighted in grey in Table 6.24. One seal was observed on<br />
July 13, 2012 (Lat.: 62°14'9,359" N; Long.: 74°46'49,710"W), but its species could<br />
not be identified.<br />
Marine mammals are defined in two main groups: whales and pinnipeds. Whales<br />
spend their entire lives in the water, while pinnipeds may share their life cycle<br />
between land and sea.<br />
Whales are divided into two suborders:<br />
• the Odontoceti, or toothed whales, such s the Beluga and the Killer Whale;<br />
• the Mysticeti, or baleen whales, such as the Minke Whale or the Bowhead<br />
Whale.<br />
The pinnipeds are divided directly into several families, such as:<br />
• the Phocidae, including the seals;<br />
• the Odobenidae, including the walruses.<br />
Canadian Royalties Inc.<br />
GENIVAR<br />
101-53046-02 November 2012<br />
120
Table 6.23 <strong>Main</strong> fish species present in Deception Bay, likely to use the study zone.<br />
Species Descriptions taken from Scott and Scott (1988)<br />
Fourhorn Sculpin<br />
(Myoxocephalus quadricornis)<br />
Shorthorn Sculpin<br />
(Myoxocephalus scorpius)<br />
Grubby<br />
(Myoxocephalus aeneus)<br />
Three-spined Stickleback<br />
(Gasterosteus aculeatus)<br />
Ninespine Stickleback<br />
(Pungitius pungitius)<br />
Daubed Shanny<br />
(Leptoclinus maculatus)<br />
Arctic Eelpout<br />
(Lycodes reticulatus)<br />
Arctic Cod<br />
(Boreogadus saida)<br />
Atlantic Cod<br />
(Gadus morhua)<br />
In general, this species is typical of shallow Arctic and sub-Arctic waters (estuarine coastal waters). It rarely descends to depths<br />
below 15 to 20 m and sometimes frequents rivers. Spawning occurs in late fall or in winter and an incubation period of 2 to 3 months<br />
is necessary to hatch the eggs (97 days at 1.5°C and 74 days at 2°C). The nest is made by digging a hole in soft algae masses or in<br />
a muddy bottom.<br />
This species frequents shallow fresh waters (generally shallower than 37 m) and is often captured near wharfs, while looking for food.<br />
It spawns on rocky bottoms between 6 and 11 m deep. In Newfoundland, spawning occurs in early winter, and thus probably earlier<br />
in Deception Bay.<br />
The Grubby is found in coastal waters and tolerates temperatures ranging from 0 to 21.1°C, as well as a wide variation in salinity. In<br />
protected areas, it is found at depths of less than one metre on muddy, sandy, or gravelly bottoms, but between 5 and 15 m along<br />
exposed (unprotected) coasts on rocky bottoms. It is abundant throughout the eelgrass and probably spawns in winter.<br />
This stickleback species frequents the shallow zones located near the coasts, especially in brackish water. It prefers temperate<br />
waters to Arctic waters. When it is offshore, it often stays among the floating algae. Spawning, which occurs in fresh or brackish<br />
water, occurs from April to September, depending on the latitude. In the case of Deception Bay, it thus probably occurs around the<br />
month of September.<br />
This stickleback is found in salt water or brackish water, generally confined near the coasts. It likes habitats with a lot of vegetation<br />
that lets it protect itself from predators. For this species this is also a hospitable environment for making a nest. Spawning occurs<br />
during the summer, and thus probable around the month of August in Deception Bay, in fresh or brackish water.<br />
The Daubed Shanny is present in shallow waters, from about 2 m below the low tide mark up to over 100 m. Offshore from Labrador,<br />
it has been captured at depths from 27 to 110 m on muddy, sandy or rocky bottoms. Spawning occurs in winter in shallow waters.<br />
The Arctic Eelpout generally frequents shallow waters. It mainly feeds on epibenthos.<br />
A pelagic species that lives in the upper part of the water column, the Arctic Cod is often found on the surface and near floating ice. It<br />
mainly feeds on plankton, and adults occasionally may eat the young of their own species. Spawning occurs under the ice cover,<br />
from December to March. The Arctic Cod is the prey of several marine mammal, seabird and fish species.<br />
The Atlantic Cod lives in the coastal zone, up to the edge of the continental shelf, in cold waters (up to about 10 o C). The juveniles<br />
prefer shallow waters in protected areas. The Atlantic Cod is an omnivorous species that feeds at the seabed. It can breed in the<br />
Arctic beginning in February, and later to the south. Spawning occurs in a wide variety of habitats.
Table 6.23 <strong>Main</strong> fish species present in Deception Bay, likely to use the study zone (continued).<br />
Arctic Char<br />
(Salvelinus alpinus)<br />
Greenland Cod<br />
(Gadus ogac)<br />
Species Descriptions taken from Scott and Scott (1988)<br />
Canadian Plaice<br />
(Hippoglossoides platessoides)<br />
The Arctic Char is an anadromous species feeding in the sea. The young individuals spend several years in a lake or river before<br />
going to sea. The downstream migration generally occurs in the spring, a little before or during the ice break-up, or in early summer.<br />
The return to the river estuaries occurs in August. Spawning occurs in September and October in fresh water, on gravelly bottoms of<br />
lakes or river troughs, at depths of 1 to 4 m. The eggs take all winter to develop. The Arctic Char is carnivorous and feeds on a wide<br />
variety of fish. Apart from seals, the Arctic Char has few predators.<br />
This species is more common near the coasts than offshore and tolerates water that is low in salt. It is a coldwater fish that likes<br />
coastal waters (Fontaine, 2006). The Greenland Cod spawns between February and March, along the coasts or in brackish water.<br />
The species is found from the Arctic, along the coasts of Labrador, around Newfoundland and in the Gulf of St. Lawrence, at least as<br />
far as Les Escoumins.<br />
The Canadian Plaice is a bottom fish and lives in cold, deep waters (generally from 90 to 250 m). It feeds on invertebrates and small<br />
fish. It breeds in spring at great depths.<br />
Arctic Shanny<br />
(Stichaeus punctatus)<br />
A benthic species present in cold, deep waters, the Arctic Shanny has been observed up to 55 m deep in Hudson Bay. The juveniles,<br />
observed in Newfoundland, live on pebble and gravel bottoms. The species is territorial. The adults prefer rocky substrates, where<br />
they hide under rocks and in crevasses. Breeding occurs from February to March. A female may contain thousands of eggs. The<br />
planktonic larvae develop from June to August between depths of 10 and 110 m. The juveniles’ food essentially consists of copepods<br />
and amphipods, while the adults feed on polychaetes and different groups of crustaceans. This species cohabits with several cottid<br />
species.
Table 6.24<br />
French name English name<br />
Béluga 1<br />
Narval 1<br />
White<br />
Whale, or<br />
Beluga<br />
Narwhal<br />
Marine mammals likely to use Deception Bay<br />
Latin name<br />
Delphinapterus<br />
leucas<br />
Monodon<br />
monoceros<br />
Relative<br />
abundance 2<br />
Medium<br />
Rare<br />
Épaulard Killer Whale Orcinus orca Low<br />
Petit rorqual Minke Whale Balaenoptera<br />
acutorostrata<br />
Baleine<br />
boréale 1<br />
Morse<br />
Bowhead<br />
Whale<br />
Walrus<br />
Balaena<br />
mysticetus<br />
Odobenus<br />
rosmarus<br />
Medium<br />
Rare<br />
Rare or<br />
absent<br />
Remark<br />
The Beluga is hunted in Deception Bay<br />
by the Inuit of Salluit.<br />
Observed more often in the past.<br />
Observed more often in Deception Bay in<br />
the past few years. Variable presence from<br />
year to year. The Killer Whale is not<br />
hunted by the Inuit.<br />
Often observed in Deception Bay.<br />
Occasionally frequents Deception Bay. A<br />
few individuals are observed there each<br />
year.<br />
Not observed in Deception Bay.<br />
Phoque<br />
Species most hunted by the Inuit and<br />
Ringed Seal Phoca hispida High<br />
annelé<br />
appears along the coasts all year long.<br />
Phoque du<br />
Pagophilus<br />
Species hunted by the Inuit, especially in<br />
Harp Seal<br />
Unknown<br />
Groenland<br />
groenlandicus<br />
the fall.<br />
Phoque barbu Bearded Seal Erignathus<br />
Stable population according to the Inuit<br />
Unknown<br />
barbatus<br />
interviewed. Species hunted by the Inuit.<br />
Phoque<br />
Rare or Species not reported by the Inuit<br />
Harbour Seal Phoca vitulina<br />
commun<br />
absent interviewed.<br />
1 Species at risk (Québec: species with a precarious status)<br />
2 According to the testimony of the Inuit interviewed (GENIVAR, 2007).<br />
Table 6.25 summarizes the characteristics of the main marine mammals likely to<br />
frequent Deception Bay.<br />
Beluga<br />
The Beluga populations live mainly in the High Arctic region between latitudes 50°<br />
and 80° N (Perrin et al., 2002). They live in icy waters, especially within polynyas<br />
and leads present in the ice cover they use to breathe. The Beluga has an irregular<br />
distribution around the Arctic Circle (Rice, 1998). This species migrates seasonally<br />
according to the limits of the ice shelf, as it retreats northward or expands southward.<br />
The Beluga populations likely to use Deception Bay are those of western and<br />
eastern Hudson Bay, and the Ungava Bay population. The last two are designated<br />
as endangered.<br />
The Ungava Bay population has never been large (1,000 Belugas in 1870; Beaulieu,<br />
1992 in GENIVAR, 2007b). Decimated by commercial exploitation and subsistence<br />
hunting, its abundance is now estimated at fewer than 100 individuals (Environment<br />
Canada, 2004). The population of eastern Hudson Bay is mainly concentrated in the<br />
Canadian Royalties Inc.<br />
GENIVAR<br />
101-53046-02 November 2012
estuaries of the Nastapoka River and the Little Whale River during the summer. This<br />
population includes about 2,000 to 3,000 Belugas, but is in sharp regression<br />
(COSEWIC 6 , 2004a). Indeed, this population declined from about 4,200 individuals<br />
in 1985 to 3,100 in 2004 (Hammill and Stenson, 2005). The western Hudson Bay<br />
population includes about 22,000 to 23,000 individuals (COSEWIC, 2004a). The<br />
Belugas of these three populations migrate in the fall to Hudson Strait, where they<br />
will spend the winter. Some of these Belugas are likely to use Deception Bay, which<br />
is confirmed by Inuit hunters (Don Cameron, Nuvumiut Developments Inc., pers.<br />
comm., 2007), but their number is indeterminate and probably very low, because<br />
these three populations make a winter migration to Hudson Strait, while some<br />
individuals would spend the summer in the bay instead of returning to their<br />
respective place of origin.<br />
During breeding (mating), the Belugas reach their summer territory: bays, estuaries<br />
and other shallow waters. The female Belugas calve from mid-March west of<br />
Greenland to late August in Hudson Bay, after a gestation period of 12 to 14 months.<br />
The females breed every two or three years (Lentifer, 1988).<br />
The females and their young prefer the calm and shallow waters along the edges of<br />
reefs and near islands and large bays. The surface water is warmer at these<br />
locations, free of ice in summer, which reduces heat losses in the young and favours<br />
moulting. The adults and the weaned young instead favour areas where the depth<br />
varies and where the surface water is maintained at a cold temperature. Sandy,<br />
gravelly or muddy bottoms are rich in molluscs, crustaceans and demersal fish on<br />
which the Belugas feed (DFO, 2007a).<br />
Before the winter ice forms, the Belugas begin their fall migration, moving along the<br />
coastal zones of the bays to head out to sea. Most then go as far as the progression<br />
of the ice shelf, ending up in the leads and polynyas. Their movements are then<br />
determined by the presence of ice and the quantity of fish. According to a satellite<br />
telemetry study conducted by Pierre Richard (DFO, 2007b), Belugas migrate over<br />
distances much greater than were believed. Instead of staying near the coasts in<br />
zones of open water and detached ice, Belugas often travel hundreds of kilometres<br />
under the ice shelf. Thus, some groups remain under the ice, surviving thanks to<br />
unfrozen areas of the ice shelf that allow them to breathe, or thanks to air pockets<br />
trapped under the ice. Belugas are thus able to find zones by echolocation where the<br />
ice is so thin that they can break it to breathe on the surface, whereas more than<br />
95% of the ice shelf is too thick to allow this.<br />
6<br />
Comittee on on the Status Endangered Wildlife in Canada.<br />
Canadian Royalties Inc.<br />
GENIVAR<br />
101-53046-02 November 2012<br />
124
Table 6.25<br />
Characteristics of the main marine mammals likely to frequent Deception Bay (GENIVAR, 2007b).<br />
Species Population Special status<br />
Period of frequentation of<br />
Deception Bay<br />
Summer: feeding,<br />
Indeterminate, but probably a very<br />
moulting, resting young.<br />
Beluga<br />
small percentage of the Hudson Bay<br />
Endangered<br />
(east and east) and Ungava Bay<br />
Winter: incursion into the bay<br />
(COSEWIC, May 2004).<br />
populations, which total about<br />
according to hunters<br />
25,000 individuals.<br />
(Don Cameron, pers.<br />
comm., 2007)<br />
6,000 west of Greenland (North<br />
Minke Whale Atlantic population) (COSEWIC,<br />
In open water.<br />
2002)<br />
Bowhead Whale 11,000 In open water.<br />
Breeding: moulting and resting on<br />
the ice shelf in May.<br />
Ringed Seal Indeterminate.<br />
Feeding: in July and August, near<br />
Mid priority species<br />
the shore.<br />
(Group 2) COSEWIC<br />
Migration: September to October.<br />
Breeding period Preferred habitat Special sensitivity Acoustics Hunted by the Inuit<br />
Mating: late winter, early spring<br />
(COSEWIC, 2004).<br />
Calving: once every 3 years,<br />
between April and June<br />
(Environment Canada, 2004).<br />
Mating: December to May<br />
Calving: November to March<br />
In summer: bays and near the<br />
shores.<br />
In winter: polynyas, floes,<br />
coastal ice shelf.<br />
Echolocation: from 30 to<br />
In summer: bays, estuaries shallow<br />
130 k Hz and higher.<br />
waters, reefs and islands, sandy, Masking effect by low-frequency<br />
gravelly and muddy bottoms. sounds on the high-frequency<br />
Yes; main threat of extinction,<br />
Communication:<br />
sounds used for communication<br />
(Environment Canada, 2004).<br />
Frequency of 1 to 20 kHz;<br />
In winter: leads and polynyas, Hudson and echolocation.<br />
intensity of 100 to 180 dB<br />
Strait (Environment Canada, 2004).<br />
(re 1 µPa at 1 m).<br />
Curious whale that easily<br />
Coastal zones.<br />
approaches boats.<br />
Moves slowly (7 km/h) and is<br />
Bays, straits and estuaries; near<br />
more susceptible to collide with<br />
floating ice.<br />
boats.<br />
Communication:<br />
frequency of 80 Hz to No<br />
20 kHz.<br />
Object of small-scale and very<br />
Communication: 0.02 –<br />
well-managed subsistence<br />
0.9 kHz (WDCS, 2004).<br />
hunting.<br />
Auditory sensitivity ~ 2,000 captures/year in the<br />
< 1 kHz. Auditory system Labrador region. By far the most<br />
Calving: from mid-March to mid-<br />
adapted to air and water.. hunted marine mammal and the<br />
April on the ice shelf.<br />
Communication ranges: most important in terms of food<br />
100 Hz to 15 kHz. Cries, and the economy for the Inuit of<br />
barks, whistles. Deception Bay.<br />
Wintering sites: along the coasts<br />
Harp Seal<br />
Northwest Atlantic population (from<br />
Newfoundland).<br />
Low priority species<br />
(Group 3) COSEWIC<br />
March to April: calving, resting and<br />
weaning young.<br />
Summer: feeding, resting and<br />
moulting.<br />
Late March to early April:<br />
Drift ice.<br />
Mating: from mid-March to late March<br />
on the ice shelf.<br />
Calving: late February and early<br />
March on the ice shelf.<br />
Little hunted.<br />
Summer: feeding, resting and<br />
Bearded Seal<br />
Population little studied, minimal<br />
moulting.<br />
Fall: strong currents at the outlet of<br />
the bay.<br />
In summer: feeds in rivers at high<br />
tide.<br />
Mating: in April and May on drift ice.<br />
In fall, near the coasts and within<br />
the bays.
The Belugas are toothed whales, with very well developed hearing. They are<br />
capable of echolocating, i.e. emitting a series of sounds resembling clicks, which<br />
bounce off fish and other submerged objects, allowing them to reconstitute an<br />
accurate image of their surroundings (DFO, 2007a). This type of sound is emitted at<br />
30 to 130 kHz or more (Richardson et al., 1995). Most of the sounds serving as a<br />
means of communication within a group are emitted at frequencies of 1 to 20 kHz<br />
and intensities of 100 to 180 dB (re: 1 µPa at 1 m, see subparagraph 5.1.1.1). These<br />
sounds are often associated with a specific behaviour (DFO, 2007a). This natural<br />
sonar is essential to a species that lives a large part of its life in the dark ocean<br />
waters. Belugas make frequent dives of several hundred metres to depths where<br />
there is no light. This low visibility may be similar to certain conditions in shallower<br />
water, particularly silt runoff into river estuaries or ice cover and short polar winter<br />
days.<br />
Minke Whale<br />
The Minke Whale is found in every ocean in the world, from the tropics to the polar<br />
seas, in coastal and extracoastal waters. The Minke Whale population frequenting<br />
Deception Bay belongs to the North Atlantic population (COSEWIC, 2002). The total<br />
population is said to be around 15,000 individuals, including 6,000 west of<br />
Greenland, 1,000 in the Gulf of St. Lawrence, 3,000 on the Nova Scotia Shelf, and<br />
probably at least 5,000 in Newfoundland and Labrador. Mortality attributable to<br />
human activities, primarily hunting, does not currently exceed the population<br />
replacement threshold (COSEWIC, 2006).<br />
The Minke Whale is a relatively coastal species living in most seas, feeding on krill<br />
and small fish. It is a baleen whale that does not need to echolocate, because it<br />
feeds on small organisms that are everywhere in the water. However, the Minke<br />
Whale can produce very varied sounds ranging from 80 Hz to over 20 kHz, similar to<br />
low-frequency “grunting”. It is a curious whale and easily approaches boats. Mating<br />
occurs between December and May; the females generally give birth once a year or<br />
every two years; they calve from November to March and look after their young for<br />
four to five months (Sergeant, 1963 and Stewart and Leatherwood, 1985 in<br />
Biorex Inc., 1999).<br />
Very few details are known about the Minke Whale’s seasonal movements<br />
(DFO, 1999). At the beginning of 2000, several individuals were observed by the<br />
Inuit in Deception Bay (GENIVAR, 2007b).<br />
Canadian Royalties Inc.<br />
GENIVAR<br />
101-53046-02 November 2012<br />
127
Bowhead Whale<br />
Bowhead Whales are found in the Western and Eastern Arctic. The population is<br />
estimated at about 11,000 individuals. According to recent information from the Inuit<br />
and aerial surveys, the Bowhead Whale population is increasing and they<br />
occasionally frequent Deception Bay (GENIVAR, 2007b).<br />
During the summer, the Western population is found in the Beaufort Sea and the<br />
Arctic Ocean. Between fall and spring, the Bowhead Whales migrate to Alaska. The<br />
groups migrate north and south, following the drift ice. Bowhead Whales prefer bays,<br />
straits and estuaries and generally do not stay very far from floating ice plates.<br />
Bowhead Whales are well adapted to the Arctic climate and are among the noisiest<br />
in their category. During their migration, they may travel in groups of fifteen<br />
individuals and are capable of communicating over an area of 25 to 50 km 2 to<br />
maintain contact with each other. Their acoustic capabilities also let them use the<br />
reverberations of their calls to help gauge the thickness of the floating ice plates<br />
(Environment Canada, 2004). They are able to break thick Arctic ice layers to create<br />
breathing holes.<br />
According to a COSEWIC report (2005), Bowhead Whales are sexually active a<br />
large part of the year, although the study of fetuses shows that most conceptions<br />
happen in late winter or early spring (e.g. Koski et al., 1993). Gestation lasts 13 to<br />
14 months (e.g. Nerini et al., 1984) or 12 to 16 months (e.g. Tarpley et al., 1988).<br />
The females give birth to only one calf per pregnancy. Calving generally occurs<br />
during the spring migration, between April and early June (e.g. Koski et al., 1993),<br />
and culminate in May (e.g. Nerini et al., 1984).<br />
Nowadays, well-managed small-scale subsistence hunting is practiced, posing no<br />
risk for this population. In the past, the Arctic Bowhead Whale population was<br />
decimated by commercial overfishing. In 1915, Canada banned large-scale whale<br />
hunting and the species had been designated as endangered by COSEWIC in the<br />
early 1980s. In 1991, the Eastern Arctic Bowhead Whale population was estimated<br />
at fewer than 1,000 individuals. About 350 Bowhead Whales remain in the Baffin<br />
Island sectors, a marked decline relative to the 11,000 individuals counted in the<br />
1800s. According to recent information from the Inuit and aerial surveys, the<br />
Bowhead Whale population increased in the past few years.<br />
Today, increased marine traffic threatens this species, because it is a source of<br />
collisions with slow-moving Bowhead Whales (7 km/h). Noise pollution also chases<br />
frightened whales far from their feeding area (Environment Canada, 2004).<br />
Canadian Royalties Inc.<br />
GENIVAR<br />
101-53046-02 November 2012<br />
128
Bowhead Whales occupy a relatively narrow niche in the upper latitudes of the<br />
extreme Arctic and can be disturbed by certain anthropogenic factors, such as<br />
underwater noise, and by climate change that could melt the ice shelf, thereby<br />
reducing the refuges against predation by Killer Whales even further<br />
(COSEWIC, 2005).<br />
Seals<br />
The three pinniped species that use Deception Bay for one of the phases of their life<br />
cycle and whose abundance induces the Inuit to hunt them are the Ringed Seal, the<br />
Harp Seal and the Bearded Seal.<br />
Seals living in the Arctic region are particularly vulnerable to changes in the<br />
characteristics of this environment, because they largely depend on the ice shelf to<br />
feed, breed, moult and rest (Canadian Food Inspection Agency [CFIA], 2005). Seals<br />
mainly use Deception Bay during the summer period to feed along the coasts<br />
(GENIVAR, 2007b). Some species, such as the Bearded Seal, swim up the rivers at<br />
high tide in search of fish. In winter, the seals move and search for their food in the<br />
water, but must return to a solid platform to breed. They then use two types of ice:<br />
the coastal ice shelf, normally attached to land and which remains in place all winter,<br />
and drifting pack ice, which forms in high water zones or along land before<br />
separating from it.<br />
The two species most frequently observed and hunted in Deception Bay are the<br />
Ringed Seal and the Harp Seal. They belong to the list of candidate threatened or<br />
vulnerable species defined by COSEWIC (June 14, 2007) and are ranked<br />
respectively as mid priority species (Group 2) and low priority species (Group 3)<br />
(COSEWIC, 2006).<br />
Ringed Seal<br />
The Ringed Seal is the principal marine mammal frequenting Deception Bay. It<br />
represents the most abundant species in the Arctic by far. Although no estimate of<br />
the size of the Ringed Seal population in Canada has been established, the density<br />
of this species seems to remain stable, despite the fluctuations of hunting intensity<br />
and the growth of industrial activity. In the past few years, no more than 2,000<br />
individuals have been harvested annually by hunting in the Labrador region<br />
(COSEWIC, 2002).<br />
These seals essentially feed on amphipods and fish (CFIA, 2005). They are very well<br />
adapted to the Arctic, because they are able to maintain breathing holes in the thick<br />
ice layer. Ringed Seals therefore can occupy zones inaccessible to most other<br />
species.<br />
Canadian Royalties Inc.<br />
GENIVAR<br />
101-53046-02 November 2012<br />
129
In May, the Ringed Seal uses the ice shelf exclusively to breed, moult and rest. In<br />
July and August, the groups disperse to the bays to feed near the shore. Then they<br />
regroup in September and October, heading to wintering sites along the coasts<br />
(Roche, 1992c).<br />
Polynyas, floes and ice shelf edges then provide precious habitats for seals. Despite<br />
their small size, Ringed Seals survive extreme thermal conditions by digging lairs in<br />
the snow, directly on the ice shelf. They need moderately rough ice, which creates<br />
fairly large snow banks for the females to dig a lair (CFIA, 2005). They give birth in<br />
these lairs between mid-March and mid-April. Since the only access is underwater,<br />
this niche serves as refuge for the newborn pups against bad weather and predators<br />
(GENIVAR, 2007b). According to some authors (Smith and Hammill, 1980; 1981),<br />
the ice cover is shared so that individuals are associated with a small number of lairs<br />
and air holes under the snow, and so that the range of their movements is limited by<br />
the establishment of their respective territory.<br />
Ringed Seals, because of their number, their nutritional quality and their economic<br />
interest, are the most important marine mammal species for the Inuit communities<br />
hunting in Deception Bay.<br />
Harp Seal<br />
The Harp Seal is a highly gregarious and migratory species. The global population is<br />
7 million individuals (Lavigne, 2002 in FCIA, 2005). The species is divided into three<br />
distinct populations, including one that breeds near Newfoundland (Northwest<br />
Atlantic). Part of this population breeds on the ice cover drifting southward, off the<br />
coast of southern Labrador.<br />
The adults mainly feed on small fish, such as capelan, herring or cod, but also on<br />
krill and amphipods. Harp Seals are present in great numbers on the waterways in<br />
summer. In each region, the groups generally concentrate on the ice shelf in two<br />
calving areas measuring 20 to 200 km and including up to 2,000 adult females per<br />
kilometre. Harp Seals always breed on the ice shelf. Towards late February or early<br />
March, the females give birth. Then they nurse their young and mate from middle to<br />
late March. The pups grow rapidly after birth, increasing in weight from about 10 kg<br />
at birth to 30 kg after 12 to 14 days (Bowen, 2006).<br />
The survival of the newborn depends on the stability of the habitat during their first<br />
weeks of existence. In the Deception Bay region, this stability is assured up to late<br />
March or early April by maintenance of the Arctic ice. The females take advantage of<br />
Canadian Royalties Inc.<br />
GENIVAR<br />
101-53046-02 November 2012<br />
130
these stable zones, where they can nurse their young or rest after weaning, before<br />
starting to swim (CEMAM 7 , 2006). This stability can also be found on the drifting<br />
pack ice, where the Harp Seals are generally gathered.<br />
Bearded Seal<br />
The Bearded Seal has a circumpolar range. No reliable estimate exists of Arctic<br />
Bearded Seal populations (GENIVAR, 2007b). However, they are much less<br />
abundant than Ringed Seals and Harp Seals.<br />
The Bearded Seal also knows how to maintain breathing holes in the ice shelf. It<br />
breeds (mates) in April and May on ice drifting along the coasts, but occasionally<br />
may come to land during the summer. Thus, no specific location can be identified for<br />
its breeding.<br />
In July and August, Bearded Seals mainly enter at high tide into rivers such as the<br />
Wakeham River and the southeast arm of Douglas Harbour (Roche, 1992c) to feed<br />
mostly on Arctic Char, but also on molluscs and other invertebrates living in shallow<br />
water (CFIA, 2005).<br />
The groups move offshore or into the bays, all summer long, depending on the ice<br />
conditions. Bays such as Deception Bay or Whitley Bay are thus a particular<br />
concentration area for seals, which rest and moult there (Roche, 1992c).<br />
Bearded Seals gather in the fall in sectors where marine currents are strong<br />
(Roche, 1992c), such as the outlet of Deception Bay. The migrations resume and the<br />
seals rest on the newly formed ice in Hudson Strait. Hunting occurs during this<br />
period, near the coasts within the bays.<br />
6.2.1.5 Special-Status Species<br />
Among the species listed in Table 6.27, the Beluga is designated as endangered by<br />
the Species at Risk Act (S.C. 2002 ch-29). In Québec, the Beluga populations of<br />
eastern Hudson Strait and Ungava Bay have the status of species likely to be<br />
designated threatened or vulnerable.<br />
Moreover, COSEWIC (2011) has granted the status of species of special concern to<br />
the Killer Whale, the Bowhead Whale, the Walrus and the Narwhal. These statues<br />
are only COSEWIC recommendations and are not an official designation granted by<br />
Appendix 1 of the Species at Risk Act. However, it is important to take them into<br />
consideration in this environmental assessment.<br />
7<br />
Centre of Experise in Marine Mammology<br />
Canadian Royalties Inc.<br />
GENIVAR<br />
101-53046-02 November 2012<br />
131
Finally, the Ringed Seal and the Harp Seal are species suspected of being at risk<br />
and thus are on the COSEWIC list of candidate species. They necessitate the<br />
production of status reports.<br />
A request for information was filed with the Centre de données sur le patrimoine<br />
naturel du Québec (CDPNQ) on October 20, 2011 (Appendix 12) to verify the<br />
existence of data on the presence of threatened or vulnerable wildlife species, or<br />
species likely to be so designated, or species that are rare in the Deception Bay<br />
sector. The CDPNQ does not possess such data.<br />
6.2.2 Terrestrial Environment<br />
6.2.2.1 Flora<br />
The plant communities identified during the inventory of threatened or vulnerable<br />
vascular species (Appendix 13) are: marine shoreline, shrubland, wet meadow,<br />
snowbed, mesic meadow, dry tundra, rocky tundra and ponds (shallows). The other<br />
environments are anthropogenic environments and sectors that are apparently still<br />
snow-covered at the end of the summer (Lauriol et al, 1984). The mapping of these<br />
communities is illustrated in Map 1 of Appendix 13. The following descriptions are<br />
extracted from that same Appendix.<br />
Marine Shoreline<br />
The marine shoreline contains two environments: sand-gravelly shoreline and salt<br />
marsh. Sand-gravelly shoreline appears as a more or less open meadow, dominated<br />
by Sea Lyme-grass (Leymus mollis) and marking the mean high level of the current<br />
marine shoreline. Salt marsh, regularly submerged by the tide, is a wet shortgrass<br />
meadow colonizing fine deposits and mainly consisting of graminoids, especially<br />
Creeping Alkaligrass (Puccinellia phryganodes).<br />
Shrubland<br />
Shrubland is dominated by herbaceous plants, but shrubs are also found there,<br />
mainly willows (Salix glauca, S. planifolia), which can reach heights of 1 or 2 m. This<br />
plant formation is most often linear and is observed along some watercourses, in<br />
sheltered sites benefiting from good winter snow cover.<br />
Canadian Royalties Inc.<br />
GENIVAR<br />
101-53046-02 November 2012<br />
132
Wet Meadow<br />
Wet meadow colonizes fine deposits more or less saturated with water. This<br />
meadow is dominated by sedges (Carex aquatilis, C. rariflora), cotton grasses<br />
(Eriophorum angustifolium, E. scheuchzeri) and graminoids (Arctagrostis latifolia,<br />
Dupontia fisheri). This meadow is encountered in valley bottoms and at the base of<br />
snowbeds. Most of the plants associated with wetlands are found in this<br />
environment.<br />
Snowbed<br />
Snowbeds are a special environment. Generally located in the face of the prevailing<br />
winds, snowbeds occupy topographical sites that not only favour a large<br />
accumulation of windblown snow (Payette and Lajeunesse, 1980; Lauriol et<br />
al, 1984), but an increase in this snow’s density (Payette et al, 1973). Consequently,<br />
the plants colonizing this environment benefit from snow cover, but snow removal<br />
delays considerably reduce the length of the growing season. Snowbeds harbour a<br />
number of chionophilic species, meaning that they are adapted to heavy snow<br />
conditions, such as Snow Buttercup (Ranunculus nivalis), Pygmy Buttercup (R.<br />
pygmaeus), Lapland Dandelion (Taraxacum lapponicum) and Twotipped Sedge<br />
(Carex lachenalii). In the study zone, the snowbeds observed are located at low<br />
altitude and are generally site-specific or small in area. These snowbeds are not<br />
mapped. They are distributed on the east or northeast slopes, most of them at the<br />
boundary line between mesic meadow and wet meadow. At higher altitudes,<br />
between mesic meadow and dry tundra, other snowbeds are found that seem to<br />
remain snow covered at the end of the summer (Lauriol et al, 1984). These more<br />
extensive snowbeds are mapped.<br />
Mesic meadow<br />
Mesic meadow colonizes the vast majority of the loose deposits of the sites that are<br />
not too wet or too exposed. Mesic meadow is dominated by graminoid plants, such<br />
as Bigelow’s Sedge (C. bigelowii), Alpine Sweetgrass (Anthoxanthum monticola ssp.<br />
alpinum) and Arctic Bluegrass (Poa arctica), through which a wide diversity of<br />
plantlife is found. Mesic meadow is located above wet meadow and colonizes all the<br />
slopes covered with loose deposits.<br />
Canadian Royalties Inc.<br />
GENIVAR<br />
101-53046-02 November 2012<br />
133
Dry Tundra<br />
Dry tundra is an open formation colonizing loose deposit sites that are very well<br />
drained and generally exposed. The vegetation is disseminated and particularly<br />
includes very rustic graminoid plants, such as Northern Woodrush (Luzula confusa)<br />
and cushion plant species, such as Moss Campion (Silene acaulis) or Pincushion<br />
Plant (Diapensia lapponica).<br />
Rocky Tundra<br />
Rocky tundra, which can include any mineral habitat with little or no vegetation,<br />
mainly consists of bedrock outcrops. Essentially the same type of vegetation is found<br />
there as in dry tundra.<br />
Ponds<br />
Ponds or shallows include the few water bodies supporting some kind of aquatic<br />
vegetation. The most frequent species, although providing negligible coverage, are<br />
Vernal Water-stanwort (Callitriche palustris) and High Northern Buttercup<br />
(Ranunculus hyperboreus).<br />
Anthropogenic Environments<br />
Although often disturbed recently, the anthropogenic environments can support<br />
several plant species, which shows the capacity of several Arctic plant species to<br />
play a pioneering role.<br />
Special-Status Species<br />
Four plants of interest were inventoried in the study zone selected for the inventory<br />
of threatened or vulnerable vascular species (Appendix 13). These plants are likely<br />
to be designated threatened or vulnerable species in Québec (CDPNQ, 2008;<br />
Québec, 2012). They are Smooth Northern-Rockcress (Braya glabella ssp. glabella),<br />
Dwarf Hairgrass (Deschampsia sukatschewii), Bluff Cinquefoil (Potentilla arenosa<br />
ssp. chamissonis) and Vahl’s Cinquefoil (Potentilla vahliana). These plants share the<br />
characteristic of being at the southern limit of their range.<br />
Canadian Royalties Inc.<br />
GENIVAR<br />
101-53046-02 November 2012<br />
134
6.2.2.2 Mammals<br />
According to the observations made during the 2006 field campaign (Therrien et al.,<br />
2007), only burrows of small rodents, probably Ungava Lemming (Dicrostonyx<br />
hudsonius), were observed near site Q1. However, according to other observations<br />
performed nearby, several other wildlife species might use the disposal site sector.<br />
This is particularly the case for Arctic Fox (Alopex lagopus) and Caribou<br />
(Rangifer tarandus), which both have been noticed near the former outfitting<br />
establishment (Kanguq) and which are common species in the region. This outfitting<br />
establishment, which no longer exists, was located about 2 km upstream from the<br />
mouth of the Deception River.<br />
More specifically, concerning Caribou, the Deception Bay sector is frequented by a<br />
subgroup of the Rivière-aux-Feuilles herd. This herd’s population is said to be<br />
declining (Serge Couturier, pers. comm., 2012). The Deception Bay sector is very<br />
important for this subgroup. It is located within the migration area, but not within the<br />
calving area, which is farther south near the Raglan Mine.<br />
In addition, the impact study (GENIVAR, 2007a) reports 12 land mammal species<br />
that potentially could frequent this region. These species are listed in Table 6.26.<br />
Table 6.26<br />
Land mammals likely to be present in the Deception Bay sector<br />
French name Latin name English name Relative abundance<br />
Lemming d’Ungava Dicrostonyx hudsonius Ungava Lemming Low to high 2<br />
Campagnol des champs Microtus pennsylvanicus Meadow Vole Low to high 2<br />
Lièvre arctique Lepus arcticus Arctic Hare Low to medium<br />
Caribou Rangifer tarandus Caribou Low to high 3<br />
Boeuf musqué Ovibos moschatus Muskox Low<br />
Carcajou 1 Gulo gulo Wolverine Rare<br />
Hermine Mustela erminea Ermine Medium<br />
Belette pygmée 1 Mustela nivalis Least Weasel Low<br />
Renard arctique Alopex lagopus Arctic Fox Low to medum 2<br />
Renard roux Vulpes vulpes Red Fox Low<br />
Loup Canis lupus Wolf Low<br />
Ours blanc 1 Ursus maritimus Polar Bear Low<br />
Source: GENIVAR, 2007a.<br />
1 Special-status species.<br />
2 The abundance of the species varies according to a cycle of about 3 to 5 years.<br />
3 The abundance of Caribou varies according to the season.<br />
Canadian Royalties Inc.<br />
GENIVAR<br />
101-53046-02 November 2012<br />
135
6.2.2.3 Avifauna<br />
Appendix 14 presents the complete results of the avian fauna inventories conducted<br />
in 2012 in Deception Bay and the terrestrial environment near the projected<br />
structures.<br />
A total of 41 bird species were observed within the study zone, including the<br />
Peregrine Falcon (subparagraph 6.2.2.4). The presence of 19 waterfowl and aquatic<br />
bird species was surveyed (10 Anatidae species, three loon species, five gull<br />
species and the Black Guillemot), five bird of prey species, 12 terrestrial species and<br />
five shorebird species.<br />
The most abundant species were:<br />
• the Canada Goose and the Common Eider among aquatic birds;<br />
• the Lapland Longspur, the American Pipit, the White-crowned Sparrow, the<br />
Horned Lark and the Savannah Sparrow among terrestrial birds.<br />
Table 6.27 presents the list of observed species. Breeding was confirmed for<br />
27 species, while it was considered possible or probable for 9 others.<br />
6.2.2.4 Special-Status Species<br />
A request for information was submitted to the CDPNQ on October 20, 2011<br />
(Appendix 12) to verify the existence of data on the presence of threatened or<br />
vulnerable wildlife species or those likely to be so designated, or rare species in the<br />
Deception Bay sector. The CDPNQ does not have data for this sector.<br />
Land Mammals<br />
Among the land mammal species listed in Table 6.26, the Wolverine is on the List of<br />
Threatened or Vulnerable Wildlife Species in Québec (MRN, 2012), in addition to<br />
being considered “endangered in Canada” (COSEWIC, 2006). The Least Weasel<br />
and the Polar Bear are on the List of Wildlife Species Likely to be Designated<br />
Threatened or Vulnerable in Québec (MRN, 2012) and the Polar Bear is also<br />
considered to be a species “of special concern” by COSEWIC (2006).<br />
Canadian Royalties Inc.<br />
GENIVAR<br />
101-53046-02 November 2012<br />
136
Table 6.27<br />
List of bird species observed in the study zone<br />
French name Scientific name English name Breeding status<br />
Alouette hausse-col Eremophila alpestris Horned Lark Confirmed<br />
Bécasseau à croupion blanc Calidris fuscicollis White-rumped Sandpiper Non-breeding<br />
Bécasseau de Baird Calidris bairdii Baird's Sandpiper Non-breeding<br />
Bécasseau semipalmé Calidris pusilla Semipalmated Sandpiper Confirmed<br />
Bécasseau variable Calidris alpina Dunlin Non-breeding<br />
Bernache de Hutchins Branta hutchinsii Cackling Goose Possible<br />
Bernache du Canada Branta canadensis Canada Goose Confirmed<br />
Bruant à couronne blanche Zonotrichia leucophrys White-crowned Sparrow Confirmed<br />
Bruant des prés Passerculus sandwichensis Savannah Sparrow Confirmed<br />
Buse pattue Buteo lagopus Rough-legged Hawk Probable<br />
Canard noir Anas rubripes American Black Duck Possible<br />
Canard pilet Anas acuta Northern Pintail Confirmed<br />
Cygne siffleur Cygnus columbianus Tundra Swan Confirmed<br />
Eider à duvet Somateria mollissima Common Eider Confirmed<br />
Eider à tête grise Somateria spectabilis King Eider Confirmed<br />
Faucon gerfaut Falco rusticolus Gyrfalcon Possible<br />
Faucon pèlerin Falco peregrinus Peregrine Falcon Confirmed<br />
Goéland arctique Larus glaucoides Iceland Gull Confirmed<br />
Goéland argenté Larus argentatus Herring Gull Confirmed<br />
Goéland bourgmestre Larus hyperboreus Glaucous Gull Probable<br />
Goéland brun Larus fuscus Lesser Black-backed Gull Non-breeding<br />
Goéland marin Larus marinus Great Black-backed Gull Confirmed<br />
Grand Corbeau Corvus corax Common Raven Confirmed<br />
Guillemot à miroir Cepphus grylle Black Guillemot Confirmed<br />
Harelde kakawi Clangula hyemalis Long-tailed Duck Confirmed<br />
Harle huppé Mergus serrator Red-breasted Merganser Possible<br />
Junco ardoisé Junco hyemalis Dark-eyed Junco Confirmed<br />
Lagopède alpin Lagopus muta Rock Ptarmigan Confirmed<br />
Merle d’Amérique Turdus migratorius American Robin Confirmed<br />
Oie des neiges Chen caerulescens Snow Goose Possible<br />
Phalarope à bec étroit Phalaropus lobatus Red-necked Phalarope Non-breeding<br />
Pipit d’Amérique Anthus rubescens American Pipit Confirmed<br />
Plectrophane des neiges Plectrophenax nivalis Snow Bunting Confirmed<br />
Plectrophane lapon Calcarius lapponicus Lapland Longspur Confirmed<br />
Plongeon catmarin Gavia stellata Red-throated Loon Confirmed<br />
Plongeon du Pacifique Gavia pacifica Pacific Loon Probable<br />
Plongeon huart Gavia immer Common Loon Possible<br />
Pluvier semipalmé Charadrius semipalmatus Semipalmated Plover Confirmed<br />
Sizerin blanchâtre Acanthis hornemanni Hoary Redpoll Confirmed<br />
Sizerin flammé Acanthis flammea Common Redpoll Confirmed<br />
Traquet motteux Oenanthe oenanthe Northern Wheatear Confirmed<br />
Canadian Royalties Inc.<br />
GENIVAR<br />
101-53046-02 November 2012<br />
137
Avian Fauna<br />
Seven species are potentially present in the study zone (Table 6.28). However, only<br />
three of them are likely to breed there. Among these three species, only the<br />
Peregrine Falcon and the Golden Eagle find their breeding habitat there (cliffs).<br />
Breeding of the Peregrine Falcon has also been confirmed by observation of two<br />
nests (one containing two nestlings and a second probable nest where two adults<br />
were perched). There are no rivers turbulent enough for the Harlequin Duck in the<br />
study zone.<br />
Table 6.28<br />
List of special-status bird species likely to frequent the study area<br />
1<br />
2<br />
3<br />
4<br />
5<br />
Species<br />
Provincial status<br />
Federal status<br />
QATVS 1 COSEWIC 2 SARA 3<br />
Golden Eagle Vulnerable - -<br />
Harlequin Duck Vulnerable Special concern Special concern<br />
Eskimo Curlew - Endangered 5 Endangered 5<br />
Red Knot Rufa Likely 4 Endangered 5 Endangered 5<br />
Buff-breasted Sandpiper - Special concern -<br />
Arctic Peregrine Falcon Likely 4 Special concern Special concern<br />
Ivory Gull - Endangered 5 Endangered 5<br />
QATVS: Quebec Act respecting threatened or vulnerable species<br />
COSEWIC: Committee on the Status of Endangered Wildlife in Canada<br />
SARA: Species at Risk Act<br />
Likely to be designated threatened or vulnerable<br />
Endangered<br />
6.3 Human Environment<br />
6.3.1 General<br />
The projected port infrastructures and terrestrial sediment disposal site are located<br />
on the southwest shore of Deception Bay. The Village of Salluit is found about fifty<br />
kilometres to the west. The Inuit community of Kangigsujuaq, some of whose<br />
members are likely to frequent Deception Bay, but to a lesser extent than the Salluit<br />
community, is located 170 km to the southeast.<br />
There is no permanent Inuit community as such at Deception Bay. However, the<br />
following infrastructures are found there:<br />
• a road running along the west shore of the bay and connecting mining facilities of<br />
the Raglan sector to the Xstrata wharf;<br />
• the Xstrata facilities, which mainly include a jetty, a wharf, an ore concentrate hall<br />
and a petroleum depot;<br />
• the CRI petroleum depot located near site Q1;<br />
Canadian Royalties Inc.<br />
GENIVAR<br />
101-53046-02 November 2012<br />
138
• a temporary workers’ camp at Bombardier Beach;<br />
• a permanent Inuit camp at Bombardier Beach;<br />
• a former airfield located in the Deception River estuary.<br />
The Raglan - Deception Bay road is used both to transport ore extracted from the<br />
Raglan Mine and to transport merchandise, equipment and petroleum products to<br />
the Raglan Mine and the CRI facilities in Raglan-sud. About 15 to 20 concentrate<br />
transport trucks drive this road every day.<br />
The next sections present a few sociodemographic traits of the Salluit and<br />
Kangiqsujuaq communities.<br />
6.3.2 Sociopolitical and Institutional Frameworks<br />
The administrative structure of Nunavik is the outcome of the JBNQA (signed in<br />
1975), and the Act respecting Northern villages and the Kativik Regional<br />
Government. The signing of this Agreement allowed the creation of Makivik<br />
Corporation, the landholding corporations, the KSB, and the Nunavik Regional Board<br />
of Health and Social Services (NRBHSS) (Gouvernement du Québec, 2012a;<br />
Makivik Corporation, 2012). The Act respecting Northern villages and the Kativik<br />
Regional Government provided for the creation of the KRG, a supramunicipal entity,<br />
and the creation of the Northern villages of Nunavik, while specifying the powers<br />
granted to each of these bodies (Gouvernement du Québec, 2012b).<br />
6.3.2.1 Kativik Regional Government<br />
The KRG was created in 1978, following the adoption of the Act respecting Northern<br />
villages and the Kativik Regional Government (Kativik Act) and the signing of the<br />
JBNQA, for the purpose of providing public services to the Nunavimmiut.<br />
The KRG exercises its powers over all Québec territory located north of the<br />
55 th parallel, excluding Category IA and IB lands awarded to the Cree community of<br />
Whapmagoostui.<br />
The majority of the KRG’s responsibilities are set out in the Kativik Act. The KRG<br />
currently offers services in the following sectors:<br />
• administration;<br />
• communications;<br />
• legal services and municipal management;<br />
Canadian Royalties Inc.<br />
GENIVAR<br />
101-53046-02 November 2012<br />
139
• employment, training, income support and childcare;<br />
• public security (police and civil protection);<br />
• municipal public works;<br />
• renewable resources, environment and land development;<br />
• research and economic development;<br />
• transportation;<br />
• recreation;<br />
• financial services.<br />
The KRG is responsible for providing technical assistance to the 14 Northern<br />
villages, especially in the following fields: legal affairs, management and municipal<br />
accounting, town planning and land development, engineering and public<br />
transportation.<br />
The KRG’s decision-making structure is directed by a Council composed of<br />
17 municipal elected representatives, named by each of the Northern villages and by<br />
the Naskapi Nation of Kawawachikamach. The KRG councillors appoint among<br />
themselves the five members forming the Executive Committee of the KRG. The<br />
Executive Committee is responsible for the administration of the KRG’s business and<br />
ensures that the decisions of the Council are executed (KRG, 2012 and 2010).<br />
In 2010, the KRG had 10 departments and nearly 400 employees, nearly 62% of<br />
whom were Inuit beneficiaries 8 . The head office is located in Kuujjuaq, and the<br />
employees are divided among the different offices owned by the KRG in each of the<br />
14 Northern villages of Nunavik.<br />
6.3.2.2 Makivik Corporation<br />
Makivik Corporation was created in 1978. This institution is responsible for collecting<br />
and managing the compensation money intended for the Inuit, paid under the<br />
JBNQA, to ensure compliance with this Agreement and to guarantee its integrity.<br />
In addition of management of the funds granted by the JBNQA, this Corporation has<br />
the mandate:<br />
• to relieve poverty, and to promote the welfare, advancement and education of<br />
the Inuit;<br />
8<br />
The term beneficiary refers to the Aboriginal peoples who benefit from the JBNQA, while non-Aboriginals<br />
encompass people who are not included in the JBNQA.<br />
Canadian Royalties Inc.<br />
GENIVAR<br />
101-53046-02 November 2012<br />
140
• to foster, promote, protect and assist in preserving the Inuit way of life, values<br />
and traditions;<br />
• to exercise the functions vested in it by other Acts or the JBNQA;<br />
• to develop and improve the Inuit communities and improve their means of action<br />
(Makivik Corporation, 2012).<br />
In Nunavik, Makivik Corporation is a major partner in social, economic and cultural<br />
development. Its fields of activity cover the fields of air transportation, fisheries and<br />
caribou marketing, as well as research and development in processing of Northern<br />
products.<br />
This Corporation holds several wholly-owned subsidiaries (e.g. First Air, Air Inuit,<br />
Nunavik Creations, Nunavik Furs, Halutik Enterprises, Biosciences Nunavut Inc.)<br />
and joint ventures (e.g. Cruise North Expeditions, NEAS Inc., UNAAQ Fisheries, Pan<br />
Arctic Inuit Logistics).<br />
6.3.2.3 Northern Villages and Municipal Councils<br />
Nunavik includes 14 Northern villages. The villages are several hundred kilometres<br />
apart and are located on the shore of Hudson Bay, Hudson Strait and Ungava Bay.<br />
According to the Kativik Act, it is incumbent on the 14 Nunavik villages to offer<br />
essential public services. Also this Act, the municipal councils of the Northern<br />
villages are responsible for management of municipal services and municipal and<br />
community administration (Gouvernement du Québec, 2012b).<br />
Municipal services include public security, public health and hygiene, town planning<br />
and land development, public services (water supply, lighting, heating, municipal<br />
roads, traffic and transportation), recreation and culture. The municipal council of<br />
each village is composed of a mayor and councillors, elected or appointed. The<br />
mayor is the head of the council and the chief executive of the municipal<br />
administration.<br />
6.3.2.4 Landholding Corporations<br />
The landholding corporations arise from the JBNQA. Each Nunavik village has its<br />
own landholding corporation, which holds the territory of the village and its<br />
immediate vicinity and is responsible for administering the Category I and II lands 9 .<br />
Since 2002, the landholding corporations have combined to form the Nunavik<br />
Landholding Corporations Association (Nunavik Landholding Corporations<br />
Association, 2012).<br />
9<br />
The land regime in Nunavik is summarized in paragraph 6.3.5.<br />
Canadian Royalties Inc.<br />
GENIVAR<br />
101-53046-02 November 2012<br />
141
6.3.2.5 Kativik School Board<br />
The KSB was created after the signing of the JBNQA to enable the Inuit to take<br />
charge of their own education. Its mission is to provide the people of Nunavik with<br />
educational services that will guide and enable all learners to develop the qualities,<br />
skills and abilities that are necessary to achieve their well-being and selfactualization<br />
(KSB, 2012).<br />
The KSB has exclusive jurisdiction in Nunavik regarding preschool, elementary,<br />
secondary and adult education. It is also responsible for developing programs and<br />
teaching material in Inuktitut, English and French, training the teaching staff in<br />
accordance with provincial standards, and promoting, organizing and supervising<br />
postsecondary education. The KSB is required to follow the directives of the<br />
Ministère de l’Éducation. However, it has the leeway to regulate the teaching of<br />
Inuktitut and Inuit culture (KSB, 2012).<br />
In Nunavik, Inuktitut, the mother tongue of the Inuit, is taught starting in kindergarten.<br />
Since the 2004-2005 school year, Inuktitut has been instituted in Grade 3 to<br />
reinforce learning of the language (GENIVAR, 2007). Thus, half of elementary<br />
teaching is in Inuktitut and the other half in the second language. Starting in Grade 4,<br />
the classes are taught only in the second language; the parents have the choice of<br />
having their children educated in French or in English.<br />
Each village has a school that offers teaching at the elementary and secondary<br />
levels. The curriculum is adapted to local needs and emphasizes preservation of<br />
culture.<br />
6.3.2.6 NRBHSS and Health Centres<br />
The NRBHSS, based in Kuujjuaq, is a stakeholder of the Québec network of<br />
agencies and institutions dedicated to public health and welfare (NRBHSS, 2012). It<br />
is the Board that manages the supply of health services and social services to the<br />
Inuit population.<br />
The Board manages and operates different federal programs and the two main<br />
regional health institutions that serve Nunavik, the Ungava Tulattavik Health Centre,<br />
located in Kuujjuaq, and the Inuulitsivik Health Centre, in Puvirnituq. The Innuulitsivik<br />
Health Centre manages the villages located on the coast of Hudson Bay, while the<br />
Tulattavik Health Centre manages the villages located on the coast of Ungava Bay.<br />
These two centres offer several services to the population, such as common<br />
preventive or curative health services and social services, physical rehabilitation<br />
services or social reintegration services.<br />
Canadian Royalties Inc.<br />
GENIVAR<br />
101-53046-02 November 2012<br />
142
Apart from the Puvirnituq and Kuujjuaq Health Centres, points of service reporting to<br />
these two Health Centres are located in each of the 14 Nunavik villages. In case of<br />
an intervention necessitating specialized care, the patients generally are transferred<br />
to one of the Montréal referral hospitals, on a regular flight or by air ambulance.<br />
6.3.2.7 Other Bodies<br />
The Kativik Regional Development Council (KRDC), the Kativik Local Development<br />
Centre (KLDC) and the Kativik Municipal Housing Bureau (KMHB) are also part of<br />
the Nunavik organizational structure. These bodies offer the Nunavimmiut all the<br />
services usually related to the social and economic development of Québec<br />
communities.<br />
6.3.3 Agreements<br />
6.3.3.1 Sanarrutik and Sivunirmut Agreements<br />
Several agreements have been made among the Gouvernement du Québec,<br />
Makivik Corporation and the KRG since 1998. These agreements have created<br />
opportunities for the Inuit to promote their economic and community development<br />
(Secrétariat aux affaires autochtones, 2012).<br />
On April 9, 2002, Makivik Corporation, the KRG and the Gouvernement du Québec<br />
signed a partnership agreement with the objective “to establish a new nation-tonation<br />
relationship and to put forward a common vision” in order to accelerate the<br />
economic and community development of Nunavik (Makivik Corporation, KRG and<br />
Gouvernement du Québec, 2008). The Sanarrutik Agreement has a 25-year<br />
term; Sanarrutik means “development tool” in Inuktitut. Two years later, on<br />
March 31, 2004, the Gouvernement du Québec and the KRG signed the Sivunirmut<br />
Agreement on block funding of the KRG; Sivunirmut means “towards the future” in<br />
Inuktitut. The purpose of this last agreement is to amalgamate all public funding into<br />
a single block funding envelope (Observation by the public administration, 2012).<br />
6.3.3.2 Nunavik Inuit Land Claims Agreement<br />
This Agreement was signed on December 1, 2006 by the Governments of<br />
Canada and Nunavut, and by Makivik Corporation (AANDC, 2012). The NILCA<br />
concerns the use and ownership of Nunavut’s lands and resources in James Bay,<br />
Hudson Bay, Hudson Strait and Ungava Bay, a portion of northern Labrador and a<br />
zone off the coast of Labrador.<br />
Canadian Royalties Inc.<br />
GENIVAR<br />
101-53046-02 November 2012<br />
143
The region covered by the settlement with the Nunavik Inuit is composed of two<br />
sectors:<br />
• the Nunavik Marine Region, which includes the Nunavut offshore islands<br />
adjacent to Québec and the intervening waters and lands (including ice);<br />
• the Labrador portion of the Nunavik Inuit Settlement Area, which covers an<br />
offshore area adjacent to Labrador, from Killinik Island to just north of Hebron,<br />
and an onshore portion in northern Labrador, consistent with the boundaries of<br />
the Torngat Mountains National Park Reserve.<br />
Under this Agreement, the Nunavik Inuit henceforth hold 80% of the total areas of<br />
the island of the Nunavik Marine Region (which previously belonged to Nunavut),<br />
i.e., about 5,100 km 2 , and the land and subsoil rights to this territory. In addition, a<br />
fraction of this region, about 400 km 2 , will be shared with the Eeyou Istchee Crees.<br />
The lands acquired by the Nunavik Inuit also include all the lands above the ordinary<br />
high water mark, as well as the mines and minerals found on these lands or in the<br />
subsoil.<br />
The NILCA also provides for the creation of the Nunavik Marine Region Wildlife<br />
Board (NMRWB) as an institution of public government. The NMRWB, the first<br />
meeting of which was held in March 2009, is thus responsible for management of<br />
wildlife resources for the Nunavik Marine Region and regulation of access to<br />
resources in the region. Under the NILCA, the Nunavik Inuit have the right to harvest<br />
all the wildlife species of the Nunavik Marine Region to satisfy all their economic,<br />
social and cultural needs, unless the Council has established a limit consistent with<br />
the provisions of the Agreement.<br />
6.3.3.3 Nunavik Nickel Agreement<br />
In April 2008, an Agreement was made among Makivik Corporation, Nunaturlik<br />
Landholding Corporation of Kangiqsujuaq, Qarqalik Landholding Corporation of<br />
Salluit, the Village of Puvirnituq and CRI. This Agreement constitutes a formal<br />
commitment on the part of CRI to generate local and regional economic spinoffs<br />
resulting from its activities in the region. In addition to Inuit participation in the<br />
available jobs and the opportunities for training and contracts, this Agreement<br />
guarantees the sharing of royalties with Makivik Corporation and the communities for<br />
the duration of the project (Makivik Corporation, 2011).<br />
Canadian Royalties Inc.<br />
GENIVAR<br />
101-53046-02 November 2012<br />
144
6.3.4 Sociodemographic Framework<br />
6.3.4.1 Demographic Situation<br />
Population and Age Structure<br />
In 2011, Salluit and Kangiqsujuaq respectively had populations of 1,347 and 696.<br />
Between 2006 and 2011, population growth was far greater than for Québec as a<br />
whole (respectively 8.5% and 15.0% for Salluit and Kangiqsujuaq, compared to 4.7%<br />
for Québec) (Statistics Canada, 2012). Moreover, in these villages, the population is<br />
much younger than in the rest of Québec; in 2011, the median age was 21.1 years in<br />
Salluit and 22.4 years in Kangiqsujuaq, compared to 41.9 years for Québec as a<br />
whole (Table 6.29).<br />
Table 6.29<br />
Sociodemographic data for Salluit and Kangiqsujuaq in comparison<br />
with Québec as a whole in 2011 and 2006<br />
Sociodemographic data Salluit Kangiqsujuaq Québec<br />
Area (village) (km 2 ) 14.39 12.56 1,356,547.02<br />
Area (Inuit land) (km 2 ) 596.84 572.62<br />
Population (2011) 1,347 696 7,903,001<br />
Male (2011) 690 340 3,875,860<br />
Female (2011) 660 355 4,027,140<br />
Population (2006) 1,241 605 7,546,131<br />
Population growth in 2006-2011 (%) 8.5 15.0 4.7<br />
Population between ages 0 and 24 years (%)<br />
(2011)<br />
57.8 54.3 28.3<br />
Population age 15 years and over (%) (2011) 61.5 67.0 84.1<br />
Median age of the population (2011) 21.1 22.4 41.9<br />
Number of private dwellings (2011) 315 174 3,685,926<br />
Dwellings leased (%) (2006) 99.6 100 39.76<br />
Number of private households (2006) 255 140 3,189,345<br />
One-parent families (%) (2006) 40 36.67 16.31<br />
Mean household size (2006) 4.9 4.3 2.3<br />
Median income of private households in 2005<br />
(2005 constant $)<br />
67,840 69,888 46,419<br />
Activity rate (%) (2006) 69.9 66.2 64.9<br />
Unemployment rate (%) (2006) 28.0 13.7 7.0<br />
Sources: Statistics Canada, 2012 and 2007.<br />
According to the 2006 census results, Inuktitut is the mother tongue of 93% of the<br />
Salluit population and 94% of the Kangiqsujuaq population. English is the most<br />
commonly used second language, followed by French (Anctil, 2008).<br />
Canadian Royalties Inc.<br />
GENIVAR<br />
101-53046-02 November 2012<br />
145
Education<br />
6.3.4.2 Health<br />
According to the 2006 census results, the percentage of the population age 15 and<br />
over not holding any university certificate, diploma or degree was 64.3% in Salluit<br />
and 64.9% in Kangiqsujuaq, compared to 25.0% for Québec as a whole. In the 15-34<br />
age category, only 13.6% of the Salluit population and 8.5% of the Kangiqsujuaq<br />
population held a Diploma of Secondary Studies or equivalent, compared to 44.7%<br />
for Québec as a whole. Finally, in both villages, the 35-64 age category includes the<br />
highest proportion of the population who obtained a college or university diploma<br />
(Statistics Canada, 2007).<br />
Fertility<br />
The Nunavik population growth rate is mainly explained by high fertility. Since 1984,<br />
the synthetic fertility index in Nunavik has never been lower than 3.4 children per<br />
woman (compared to about 1.4 children per woman for Québec as a whole during<br />
the same period) (Duhaime, 2008).<br />
Life Expectancy<br />
Over the past few decades, life expectancy at birth increased in Nunavik up to the<br />
1990-1994 period and then went into regression, while it has been in constant<br />
progression in Québec as a whole. For the 2000-2003 period, life expectancy at<br />
birth was 16 years lower in Nunavik (63.3 years) than in Québec (79.4 years)<br />
(INSP, 2006).<br />
Mortality Rate<br />
Although social and medical services are much improved in Nunavik over the past<br />
few decades, this region remains disadvantaged compared to the rest of Québec, in<br />
view of the high infant mortality rate recorded in Nunavik relative to the province as a<br />
whole (KRG, 1998). According to the Institut de la statistique du Québec (2006), the<br />
infant mortality rate for the period from 1999 to 2003 was 16.5% in Nunavik, whereas<br />
it was 4.7% in Québec. The mortality rates for people age 0-64 are also higher in<br />
Nunavik than in the other regions of Québec (CSF, 2005).<br />
Physical Health Status<br />
In 2004, the NRBHSS initiated a wide-ranging survey of the health of the Nunavik<br />
Inuit population. This study, conducted by the Institut national de santé publique<br />
(INSPQ), highlighted the main issues related to the health and welfare of this<br />
population.<br />
Canadian Royalties Inc.<br />
GENIVAR<br />
101-53046-02 November 2012<br />
146
According to the INSPQ study (2004), the Inuit up to now have been well protected<br />
against cardiovascular diseases, especially due to nutrition that integrates high<br />
consumption of fish and marine mammals (Anctil, 2008). However, the significant<br />
increase in risk factors for cardiovascular diseases (glucose intolerance, smoking<br />
and obesity) gives reason to anticipate a future increase in problems. The obesity<br />
rates observed among the Inuit appear to give ever-greater cause for concern:<br />
nearly six out of ten adults were overweight (30%) or obese (28%), and nearly four<br />
out of ten persons (37%) had a waistline indicative of an increased risk of health<br />
problems, compared to 23% in 1992 (Anctil, 2008).<br />
Regarding sexually transmitted diseases, in 2007, the combined Aboriginal<br />
populations of Terres-Cries-de-la-Baie-James and Nunavik reported a chlamydiosis<br />
and gonococcal infection rate respectively 12 and 16 times higher than the average<br />
rate for the other regions of Québec. In 2007, HIV/AIDS was not detected in any<br />
resident of Nunavik (MSSS, 2008).<br />
Nutrition<br />
The Nunavik Inuit consume traditional foods (obtained from hunting, fishing and<br />
gathering) an average of five times a week. In 2004, these foods provided them with<br />
16% of their energy intake, compared to 21% in 1992, which represents a net<br />
decline in the importance of traditional food (Anctil, 2008). The elders consume more<br />
game and marine mammals than the younger generations (Martin, 2003;<br />
Roche, 1993).<br />
The Inuit diet, rich in fish and marine mammals, does not only have health benefits,<br />
however. Indeed, this diet exposes them to several toxic substances (metals and<br />
persistent organic pollutants) bioaccumulated in the Arctic food chain, and brought<br />
from the south by ocean and atmospheric currents. Although the blood<br />
concentrations observed in the Inuit for metals (cadmium, mercury and lead)<br />
decreased significantly between 1992 and 2004, a significant proportion of<br />
individuals continue to show concentrations exceeding acceptable levels, according<br />
to Health Canada (Anctil, 2008).<br />
Lifestyle<br />
The INSPQ survey showed that the Nunavik Inuit smoked cigarettes more than in<br />
the rest of Québec (77% of the Inuit smoke daily or occasionally, compared to 27%<br />
elsewhere in Québec), and that 24% of casual drinkers had high alcohol<br />
consumption (five or more drinks on the same occasion) at least once a week during<br />
Canadian Royalties Inc.<br />
GENIVAR<br />
101-53046-02 November 2012<br />
147
the past year, a percentage three times greater than in the rest of Québec (7.5%)<br />
(Anctil, 2008). Finally, 60% of the respondents also affirm that they consumed drugs<br />
during the year preceding the survey, a proportion four times greater than the one<br />
observed in the rest of Canada (Anctil, 2008).<br />
In 2004, a lower percentage of the Nunavik Inuit population seemed to participate in<br />
games of chance than among the rest of the Québec population. Nonetheless, the<br />
amounts spent on gambling were much higher among the Inuit than among other<br />
Quebecers: 62% of the Inuit declared that they spent more than $520 on games of<br />
chance per year, while this proportion was 9% in the rest of Québec (Anctil, 2008).<br />
Psychosocial Health Status<br />
In 2004, 13% of the Nunavik Inuit population exhibited a high level of psychological<br />
distress or were considered likely to develop depression or other mental health<br />
problems (Anctil, 2008). This distress appears to be associated with alcohol or drug<br />
consumption, as well as a history of sexual violence or exposure to physical violence<br />
in a family or conjugal context.<br />
According to the results of the health survey of Nunavik Inuit, conducted in 2004 by<br />
the INSPQ, the probability of being a victim of violence is very high in Nunavik: more<br />
than half the adults interviewed (54%) reported that they had been subjected to one<br />
or more forms of physical violence during their lifetime (Anctil, 2008). Nunavik is also<br />
faced with a major problem of sexual violence. In 2004, one in three adults (32%)<br />
affirmed they had been victims of sexual assault or attempted sexual assault during<br />
childhood or adolescence, and one in five adults (20%) affirmed they had<br />
encountered the same problem during adulthood (Anctil, 2008). The Institut national<br />
de la santé publique du Québec (2001) also recognized that the suicide rate in the<br />
Nunavik region was more than 3.5 times higher than the rate recorded in Québec,<br />
and that the suicide rate in Nunavik was more than 6.5 times higher among men<br />
than among women (Penney et al., 2009).<br />
6.3.4.3 Housing<br />
Over 90% of the Nunavik housing stock is composed of social housing, which<br />
translates into very high percentages of rented dwellings in Salluit and Kangisujuaq,<br />
99.6% and 100%, respectively (Statistics Canada, 2007). Given the climate<br />
constraints and the high construction costs, the current real estate market in Nunavik<br />
has not been able to meet the growing housing needs of Inuit families, who have<br />
Canadian Royalties Inc.<br />
GENIVAR<br />
101-53046-02 November 2012<br />
148
faced a housing crisis for the past few years (KRG and Makivik Corporation, 2011;<br />
Dutil, 2010). This situation often obliges several families to live in the same dwelling<br />
and explains, in particular, why the average household size is almost double in<br />
Salluit (4.9 persons per household) and in Kangiqsujuaq (4.3 persons per<br />
household) relative to the rest of Québec (2.3 persons per household) (Statistics<br />
Canada, 2007). Multifamily households represent 31% of Nunavik households<br />
(a proportion that only reaches 1% in the rest of Québec) (Duhaime, 2008).<br />
6.3.4.4 Transportation<br />
No road connects the communities to each other, or Nunavik to southern Québec.<br />
The Nunavik villages thus have a limited road network. Currently, there are only two<br />
villages with paved roads, Kuujjuaq and Ivujivik. All the other villages have gravel<br />
roads. However, the KRG has undertaken, through a subsidy program, to pave<br />
several roads in the villages within a few years (KRG, 2009). Outside the villages,<br />
there is only a single road, which connects the Port of Deception Bay to the Raglan<br />
Mine.<br />
Only air transportation can serve the Nunavik communities year round. In view of the<br />
great distances separating the 14 villages, the airplane is often the most efficient<br />
means of transportation to travel between villages. Today, all the villages are<br />
equipped with airport infrastructures.<br />
Marine transportation is important in Nunavik because it allows heavy or bulky<br />
merchandise to be shipped at a more affordable price than air transportation allows.<br />
However, marine transportation is possible only between July and October. The lack<br />
of adequate marine facilities contributes to increase the cost of marine transportation<br />
and results in difficulties of supply for the region (Makivik Corporation, 2012).<br />
Automobiles and pick-ups are used for trips within the villages. Outside the<br />
communities, the Nunavimmiut generally travel by snowmobile in winter and by allterrain<br />
vehicle (ATV) or boat in summer. Consequently, a network of very real links<br />
exists between the villages and the different areas of practice of subsistence<br />
activities (hunting, fishing, trapping and gathering).<br />
Communications<br />
The Nunavik villages are all served by the main telecommunications services, i.e.<br />
telephone, radio broadcasting, television broadcasting and the Internet. Each<br />
community is equipped with a fixed satellite telephone so that it can communicate<br />
with the outside world at any time, regardless of the temperature. A community radio<br />
station also broadcasts local and regional programs, mainly in Inuktitut. This radio<br />
station represents an essential means of communication in the villages.<br />
Canadian Royalties Inc.<br />
GENIVAR<br />
101-53046-02 November 2012<br />
149
6.3.4.5 Economic Context<br />
Economic Sector<br />
Government activities are the leading source of employment in Nunavik. Its economy<br />
is strongly influenced by the importance of employment in the public administration<br />
sector. According to Duhaime (2004), government activities alone account for more<br />
than 50% of the regional domestic product, while government services represent<br />
about 7% of the Québec domestic product.<br />
Apart from the government sector, which provides most of the jobs in Nunavik, the<br />
region’s other sources of economic activity are harvesting of wildlife resources,<br />
mineral exploration and mining, construction, retail, transportation and tourism.<br />
Primary Sector<br />
In Nunavik, the primary sector accounts for about 20% of all economic activity, while<br />
it represents only 2% of the province’s economic activity (Duhaime and<br />
Robichaud, 2010). This sector essentially depends on mineral exploration and<br />
mining activities and, to a lesser extent, on activities related to harvesting of wildlife<br />
and plants.<br />
Hunting, Fishing, Trapping and Gathering<br />
Hunting, fishing, trapping and gathering today play a significant role in Nunavik’s<br />
economy. Indeed, until the 50s, the Inuit essentially lived off these activities. Today,<br />
they still practice them to feed themselves, and sometimes for commercial purposes.<br />
Thus, it is estimated that cynegetic activities currently account for about 10% of<br />
Nunavik’s economy (Martin, 2003). This proportion has decreased significantly<br />
since 1969, the year when hunting activities represented about 63.3% of the Inuit<br />
population’s total income (Martin, 2003).<br />
Secondary Sector<br />
The secondary sector proportionally is much less important in Nunavik than in the<br />
rest of Québec. This sector only accounts for 4% of the economy, compared to 27%<br />
for Québec as a whole (Duhaime and Robichaud, 2010). This situation is explained<br />
by the fact that the manufacturing industry, which nonetheless exists in this Northern<br />
region, does not involve a large number of establishments or any large-scale<br />
establishments.<br />
Canadian Royalties Inc.<br />
GENIVAR<br />
101-53046-02 November 2012<br />
150
In Nunavik, secondary sector jobs are concentrated almost primarily in the<br />
construction industry (GENIVAR, 2007a). Since the 1950s, production of art and<br />
craft objects by the Inuit, using materials such as ivory, bone, steatite and pelts, is<br />
also a monetary income source. To date, however, no data is available to quantify<br />
the importance of this activity in Nunavik villages.<br />
Tertiary Sector<br />
Comparable to what is observed in Québec as a whole, the tertiary sector represents<br />
more than 70% of all economic activity in Nunavik (Duhaime, 2008). According to<br />
Duhaime and Robichaud (2010), this high tertiarization, common to both economies,<br />
masks significant structural differences. Thus, the tertiary sector is much less<br />
diversified in Nunavik than in the province as a whole. In Québec, public<br />
administration occupies nearly 20% of this sector, while other industries, such as<br />
services and finance, report an almost comparable size. In Nunavik, the tertiary<br />
sector is highly structured by public administration, which alone represents 53% of all<br />
regional economic activity, by far exceeding all other activities (retail, services,<br />
transportation, tourism).<br />
6.3.4.6 Economically Active Population and Labour Market<br />
The activity rates 10 observed in 2001 and 2006 for the villages of Salluit and<br />
Kangiqsujuaq were slightly higher than those recorded in Québec. Between<br />
2001 and 2006, the activity rate rose from 65.9% to 69.9% in Salluit, and fell from<br />
73.4% to 66.2% to Kangiqsujuaq.<br />
During the same period, the employment rate 11 remained relatively stable in Salluit,<br />
at about 50.5%, while it declined from 60.9% to 55.8% in Kangiqsujuaq. In 2006, the<br />
unemployment rate observed in Salluit (28.0%) was more than triple the<br />
unemployment rate reported in Québec as a whole (8.0%); in Kangiqsujuaq, this rate<br />
was nearly double the provincial rate. Between 2001 and 2006, the unemployment<br />
rate 12 increased in Salluit (from 23.5% to 28%), while it decreased in Kangiqsujuaq<br />
(from 17.1% to 13.7%).<br />
Between 1993 and 2005, the number of jobs rose from 125 to 203 for the Salluit<br />
community, and from 55 to 107 for Kangiqsujuaq. In these two communities, it is<br />
observed that the number of full-time jobs nearly doubled. However, it is important to<br />
10<br />
11<br />
12<br />
The activity rate is defined as the percentage of hte economically active population relative to the number of<br />
persons age 15 years and over.<br />
The employment rate is defined as the percentage of the employed population relative to the percentage of the<br />
population age 15 years and over.<br />
The unemployment rate is defined as the percentage of the unemployed population relative to the economically<br />
active population.<br />
Canadian Royalties Inc.<br />
GENIVAR<br />
101-53046-02 November 2012<br />
151
note that most of these jobs are held by non-beneficiaries. Indeed, although they<br />
represent less than 10% of the Nunavik population, non-beneficiaries monopolize<br />
more than 50% of the region’s monetary income (ETISCCD, 2006; Gouvernement<br />
du Québec, 2008).<br />
6.3.5 Use of Land and Resources<br />
6.3.5.1 Land and Resource Management and Development<br />
After the signing of the JBNQA, the territory of Nunavik was divided into Category I,<br />
II and III lands (AANDC, 2010). Almost the entire study zone (Map 3.1) is located on<br />
Category II lands. The Inuit hold exclusive hunting, fishing and trapping rights on<br />
these lands. Category II lands are in the public domain, but the Aboriginal decisionmaking<br />
bodies participate in their management concerning these activities and the<br />
development of tourism and forestry. The Inuit also have the right to collect steatite,<br />
a stone used for sculpture, but do not have exclusive rights to the mineral subsoil.<br />
Nonetheless, in the event that a mineral resource is developed, the MRN must give<br />
advance notice to the landholding corporation concerned, which is entitled, in this<br />
case, to compensation either in the form of an indemnity, replacement of the lands,<br />
or a combination of the two (KRG, 1998).<br />
6.3.5.2 Inuit Use of the Territory<br />
Until the early 1950s, the Inuit, a hunter-gatherer people, essentially lived off hunting,<br />
fishing and gathering and travelled in small family groups within a regional hunting<br />
territory.<br />
The 1950s were the starting point of accelerated changes for the Nunavik Inuit<br />
population. The establishment of federal and provincial government services<br />
transformed almost every aspect of the Inuit lifestyle: residence, land use, health,<br />
education, language and infrastructure, as well as governance and intercommunity<br />
relations. During this period, the Inuit people moved from a nomadic lifestyle based<br />
on hunting, fishing, gathering and harvesting of wildlife and marine resources, to a<br />
mixed economy, both traditional and modern, associated with greater sedentarity<br />
and the introduction of wage labour.<br />
Although transformed, the practice of traditional activities, including hunting, trapping<br />
and fishing, has remained important in the view of the Inuit communities. Moreover,<br />
the practice of these activities has an important identity component (KRG, 1998).<br />
These traditional activities have contributed to maintain the vigour of the social<br />
Canadian Royalties Inc.<br />
GENIVAR<br />
101-53046-02 November 2012<br />
152
onds and solidarity of family members and the community. However, economic<br />
difficulties and the increasingly high costs of hunting and fishing activities<br />
(equipment, petroleum products, etc.) exert considerable pressure on traditional<br />
activities and on the relationships of solidarity that accompany them. However, the<br />
Inuit were able to adapt some of their practices to these new realities by negotiating<br />
the adaptation of certain assistance programs for traditional hunting and fishing<br />
activities, the conditions of which were negotiated to correspond better to their reality<br />
and their objectives. The adoption of the “community freezer” program and the<br />
financial assistance that the sale of community game provides for hunting and fishing<br />
activities is an original Inuit solution. It supports both traditional activities and the<br />
family and community sharing system that has always been the basis of social<br />
organization (Martin, 2003).<br />
Food consumption from hunting and fishing was still important in 2004 and<br />
accounted for 16% of the energy intake (versus 21% in 1992). However, this<br />
consumption proved to be greater among older Inuit (Anctil, 2008). According to the<br />
data collected during this survey, nearly half (45%) of the respondents affirmed that<br />
they participate in hunting activities once a week or more, for at least two seasons. A<br />
smaller number of persons said that they also participate frequently in fishing<br />
activities (33%). Half the population (nearly 48%) affirmed that they participate in<br />
picking berries at least once a month when they are in season.<br />
Deception Bay Essential Subsistence Area<br />
Deception Bay is located in the northeast portion of the hunting and fishing sector of<br />
the Village of Salluit (Kativik Environmental Quality Commission, [KEQC] 2008).<br />
According to the KRG Master Plan for Land Use (1998), it is considered an essential<br />
subsistence area for the Salluit community (Map 6.5). The KRG Master Plan<br />
specifies that these areas are “pantries” for the communities, to some extent,<br />
because hunting, trapping and fishing are practiced there by the majority of the<br />
population for subsistence purposes, year round, on a seasonal basis. These<br />
essential areas consist of very biologically productive habitats, such as spawning<br />
grounds, caribou calving areas, breeding areas or migration corridors, and are<br />
indispensable for maintenance of wildlife species. These areas generally contain<br />
temporary or permanent campsites, sectors of ecological and esthetic interest, and<br />
several known archeological sites.<br />
Canadian Royalties Inc.<br />
GENIVAR<br />
101-53046-02 November 2012<br />
153
Frequentation of the Deception Bay Sector<br />
The Inuit schemes for use of the territory are partially determined by proximity and<br />
travel time. Consequently, Category I lands are generally used on a daily basis by<br />
the Inuit, in view of their immediate proximity to the villages. Since Category II lands<br />
are more distant, they are frequented more occasionally. Often, temporary camps<br />
used on a seasonal basis are found there.<br />
The studies conducted by GENIVAR (2007a and 2007b, 2011) show that Deception<br />
Bay is still an environment prized by the Inuit of the region, mostly those of Salluit. It<br />
is frequented mainly for fishing, seal and beluga hunting, and gathering Blue<br />
Mussels. Given its easy access by watercourses and its proximity, Deception Bay<br />
may also be frequented by people from Kangiqsujuaq, but it seems that this is more<br />
occasional.<br />
Camps and Movement Axes<br />
In the early 1990s (Roche and Canartic, 1993 in GENIVAR, 2007a), a camp had<br />
been inventoried on a west shore of Deception Bay, south of the future CRI port<br />
facilities. Two other campsites had also been located on the east shore of Deception<br />
Bay and north of Lac Duquet. A few preferred trails allowing access to and<br />
circulation on the bay had also been identified, as well as seal hunting areas. They<br />
were still used in 2007 (Don Cameron, Nuvumiut Developments Inc., pers. comm. in<br />
GENIVAR, 2007b) (Map 6.6).<br />
The permanent Inuit camp is still in place and is occupied on a seasonal basis by<br />
about twenty people (É. Normandeau, GENIVAR, pers. comm., 2012) (Map 6.6).<br />
Another fishing camp is located on the east shore, not far from the mouth of the bay.<br />
The Inuit also frequent a fishing area located between Lac Duquet and the Deception<br />
River. The campsite located during the 1990s north of Lac Duquet is still in place and<br />
is used mainly for fishing activities.<br />
Traditional Hunting and Fishing<br />
No precise statistics or up-to-date (or historical) data exist that could allow a<br />
complete profile of the hunted species or the harvested volumes.<br />
In general, the communities harvest up to four wildlife groups: marine mammals,<br />
land mammals, birds and fish (Table 6.30).<br />
Canadian Royalties Inc.<br />
GENIVAR<br />
101-53046-02 November 2012<br />
154
76°0'0"W<br />
74°0'0"W<br />
72°0'0"W<br />
Charles Island<br />
Détroit d'Hudson /<br />
Hudson Strait<br />
Projet Nunavik Nickel / Nunavik Nickel Project<br />
EIES pour l’aménagement d’infrastructures portuaires et<br />
la gestion des sédiments à la baie Déception /<br />
ESIA for the Deception Bay Wharf and Sediment Management<br />
Carte 6.5 / Map 6.5<br />
Utilisation du territoire à des fins traditionnelles /<br />
Traditional Land Use<br />
Salluit<br />
Baie Déception /<br />
Deception Bay<br />
0 9 18 27 km<br />
Projection : UTM, zone 18, NAD83<br />
Sources :<br />
Base : BDGA, 1 : 250 000, MRNF Québec, 2002<br />
Données-cadres 1 : 1 000 000 / National Scale Frameworks, RNCAN<br />
Administration régionale Kativik. 1998. Plan directeur d'aménagement des terres<br />
de la région de Kativik. Les grandes orientations d'aménagement et les affections<br />
du territoire. Service de l'environnement et de l'aménagement du territoire. 67 p.<br />
(www.geoportal.krg.ca) Page consultée / Page consulted<br />
Inventaires et cartographie / Surveys and mapping : GENIVAR<br />
Fichier / File : 101_53046_EIES_BD_c6_5_util_terr_121120.mxd<br />
Novembre / November 2012<br />
101-53046-02<br />
62°0'0"N<br />
Havre Douglas /<br />
Douglas Harbour<br />
62°0'0"N<br />
Kangiqsujuaq<br />
Parc des Pingualuit /<br />
Pingualuit Park<br />
Aires de subsistance / Subsistence areas<br />
Aire essentielle / Essential area<br />
Aire importante / Important area<br />
Puvirnituq<br />
Délimitation approximative des secteurs de chasse et de pêche /<br />
Approximate delimitation of hunting and fishing sectors<br />
61°0'0"N<br />
Dépôt / Deposit<br />
Salluit<br />
Kangiqsujuaq<br />
61°0'0"N<br />
Dépôt de stéatite / Soap stone deposit<br />
Composante du projet / Project Component<br />
Zone d'étude / Study area<br />
76°0'0"W<br />
74°0'0"W<br />
72°0'0"W
Table 6.30<br />
List of the main wildlife species harvested by the Salluit and<br />
Kangiqsujuaq communities (Thiffault 2007, GENIVAR, 2007 and<br />
2007b).<br />
• Arctic Char<br />
• Brook Trout<br />
• Fourhorn Sculpin<br />
• Touladi (Lake Trout)<br />
• Icelandic Scallop<br />
• Blue Mussel<br />
• Harp Seal<br />
• Ringed Seal<br />
• Bearded Seal<br />
• Harbour Seal<br />
• Beluga<br />
• Polar Bear<br />
• Snow Goose<br />
• Canada Goose<br />
• Common Eider<br />
• Black Guillemot<br />
• Rock Ptarmigan<br />
• Caribou<br />
• Fox<br />
• Wolf<br />
Fish and halieutic resources<br />
Marine mammals<br />
Birds<br />
Land mammals<br />
Beluga<br />
The Salluit and Kangiqsujuaq populations traditionally hunt Belugas belonging to the<br />
eastern Hudson Bay and Ungava Bay populations. This hunting occurs mainly in the<br />
spring and fall, when the Belugas enter or leave Hudson Strait. For 2012, the<br />
Nunavik Marine Region Wildlife Board (NMRWB) set the hunting quota for this<br />
marine mammal at 105 individuals for the four Hudson Strait communities (Quaqtaq,<br />
Kangiqsujuaq, Salluit and Ivujivik).<br />
DFO researchers compiled data on Beluga capture by the Inuit of Salluit from the<br />
years 2005 to 2008, but this data does not specify the capture sites. It shows<br />
23 Belugas captured in 2005, 19 in 2006, 33 in 2007 and 8 in 2008.<br />
Canadian Royalties Inc.<br />
GENIVAR<br />
101-53046-02 November 2012<br />
157
Seals<br />
The consultations conducted in 2006 for the NNiP indicated that Deception Bay is a<br />
preferred sector for seal hunting (GENIVAR, 2007a). The main species hunted is the<br />
Ringed Seal, which is the most important marine mammal by far in food and<br />
economic terms for the Inuit of Salluit (GENIVAR, 2007 – RS navigation). In addition<br />
to Ringed Seals, Harp Seals, Bearded Seals and sometimes Harbour Seals are<br />
captured in small numbers by the Inuit (GENIVAR, 2007a). The main ice hunting<br />
sectors are located near the mouth of the bay and were still used in 2007 (Don<br />
Cameron, Nuvumiut Developments Inc., pers. comm. in GENIVAR, 2007b). These<br />
sectors are illustrated in Map 6.6.<br />
Bowhead Whale<br />
The Bowhead Whale is the object of large-scale subsistence hunting, but no<br />
information allows us to specify whether this happens in Deception Bay.<br />
Fish and Molluscs<br />
The Arctic Char, the anadromous Brook Trout and the Fourhorn Sculpin are the main<br />
fish species harvested in Deception Bay. The Inuit also harvest the Blue Mussel in<br />
the intertidal zone. However, the available data does not allow us to localize the<br />
harvested zones or specify the size of the harvests. This gathering mainly happens<br />
in winter when these molluscs reach their maximum size.<br />
Picking Berries and Plants<br />
During the consultations conducted in 2006 (GENIVAR, 2007a), it was reported that<br />
people from Salluit picked berries on the shores of Deception Bay. The main species<br />
picked in summer and early fall were blackberries, cranberries, cloudberries and<br />
blueberries. In general, the traditional picking activities occur near communities or<br />
camps.<br />
6.3.6 Archeological Potential<br />
Within the context of the NNiP, the Deception Bay sector was prospected to identify<br />
the archeological potential of the different sites studied for the variants and the<br />
construction sites. The sector report prepared by Artefactuel presents the<br />
prospecting campaigns conducted in the summer of 2012 (Appendix 15).<br />
Canadian Royalties Inc.<br />
GENIVAR<br />
101-53046-02 November 2012<br />
158
Détroit d' Hudson Hudson Strait<br />
74°50'0"W<br />
Arctic<br />
Island<br />
74°40'0"W<br />
74°30'0"W<br />
Neptune<br />
Island<br />
62°13'0"N<br />
Pointe Noire<br />
62°13'0"N<br />
Promontoire<br />
Maurepas<br />
False<br />
Cove<br />
Egg Rock<br />
Moosehead<br />
Islands<br />
Mont de<br />
la Table<br />
White<br />
Rock<br />
Pointe Théron<br />
62°9'0"N<br />
Baie Kangirsugaarjuk /<br />
Careenage Arm<br />
Xstrata<br />
Nickel<br />
Q1<br />
A<br />
B<br />
E C<br />
Q2<br />
D<br />
Baie Déception /<br />
Deception Bay<br />
Plage du<br />
Bombardier<br />
62°9'0"N<br />
Ancien terrain d'aviation /<br />
Inactive Air Field<br />
Navigation<br />
Itinéraire approximatif des navires /<br />
Approximative route for ships<br />
Utilisation du territoire / Land Use<br />
Campement<br />
temporaire /<br />
Temporary<br />
camp<br />
Site 4<br />
Rivière Déception<br />
62°5'0"N<br />
Route principale / <strong>Main</strong> route<br />
Sentier d'accès / Access trail<br />
Sentier d'accès hivernal /<br />
Winter access trail<br />
Sentier secondaire / Alternate trail<br />
Ancienne pourvoirie /<br />
Inactive Outfitter<br />
(camp Kanguq)<br />
Lac<br />
Duquet<br />
62°5'0"N<br />
Chasse aux phoques aux trous de respiration /<br />
Sealing at breathing holes<br />
Campement / Campsite<br />
62°1'0"N<br />
Composantes du projet / Project Components<br />
Infrastructures portuaires projetées (variantes) /<br />
Proposed wharf (variants)<br />
Site de dépôt des sédiments (variantes) /<br />
Sediment disposal site (variants)<br />
Zone d'étude / Study area<br />
Infrastructures existantes / Existing Infrastructure<br />
Campement Inuit permanent / Inuit permanent camp<br />
Infrastructures portuaires / Wharf<br />
Route / Road<br />
Projet Nunavik Nickel / Nunavik Nickel Project<br />
EIES pour l’aménagement d’infrastructures portuaires et<br />
la gestion des sédiments à la baie Déception /<br />
ESIA for the Deception Bay Wharf and Sediment Management<br />
Carte 6.6 / Map 6.6<br />
Milieu humain / Human Environment<br />
0 1,2 2,4 3,6 km<br />
Projection : UTM, zone 18, NAD83<br />
Équidistance des courbes / Contour Interval : 50 pieds / feet<br />
Sources :<br />
Base : BNDT, 1 : 50 000, 1976 à 1995**, © Sa Majesté la Reine du<br />
Chef du Canada, reproduit avec la permission de RNCan ;<br />
Utilisation du territoire / Land Use : ROCHE et/and Canarctic, 1993<br />
Mise à jour / Update : GENIVAR, 2012<br />
62°1'0"N<br />
Autre / Other<br />
Limite approximative du couvert de glace annuelle /<br />
Landfast sea-ice 74°50'0"W edge (approximate)<br />
74°40'0"W<br />
Inventaires et cartographie / Surveys and mapping : GENIVAR<br />
Fichier / File : 101_53046_EIES_BD_c6_6_mil_hum_121120.mxd<br />
Novembre / November 2012<br />
101-53046-02<br />
74°30'0"W<br />
101-53046-02
These prospecting operations, in particular, covered the site of the petroleum depot,<br />
the archeological site designated as Ka-Fi-1, which was assessed in the summer<br />
of 2008. Following this assessment, an Artefactuel team conducted inventories of<br />
five tent circles and five secondary structures in two separate areas. The surveys<br />
conducted in the first area exposed very little archeological material. It does not<br />
present any interesting archeological or scientific potential (Artefactuel, 2008). The<br />
surveys conducted in the second area exposed archeological material that allowed<br />
two times of occupancy to be identified, dating from at least the Dorset period to the<br />
recent or contemporary historical period.<br />
In August 2012, a prospecting campaign conducted by Artefactuel covered the entire<br />
site of terrestrial sediment disposal site 4, as well as the projected access road and<br />
diversion channel (Map 1; Artefactuel, 2012). Sectors peripheral to the places<br />
targeted by the work that seemed promising were also prospected. This field<br />
campaign also made it possible to prospect a series of plateaus on the north slope of<br />
the hill where the variants of terrestrial sediment disposal sites C, D and E are<br />
located. No archeological site was exposed during prospecting of these sites.<br />
6.3.7 Landscape<br />
A visual environment integration study was conducted and is presented in Appendix<br />
16. This study includes a description of the landscape of the study zone, a<br />
delimitation of the landscape units, a visual analysis, visual simulations of the<br />
projected wharf and terrestrial sediment disposal site, and an assessment of the<br />
visual impacts of these developments<br />
The landscape units of the study zone are:<br />
• bay and water body;<br />
• archeological site;<br />
• road surface;<br />
• industrial sector;<br />
• hill;<br />
• anthropogenic environment and camps;<br />
• valley;<br />
• island;<br />
• plain.<br />
Canadian Royalties Inc.<br />
GENIVAR<br />
101-53046-02 November 2012<br />
160
Table 1 of the integration study (Appendix 16) presents a description of each of<br />
these units.<br />
Two portions of the study zone are part of the industrial sector unit. The first is<br />
located at Bombardier Beach, where the CRI temporary camp is found, in particular.<br />
The second extends on both sides of the road located on the south side of Deception<br />
Bay, from the CRI petroleum depot to the Xstrata facilities. The wharf and the<br />
terrestrial sediment disposal site will be inserted in this second portion.<br />
Canadian Royalties Inc.<br />
GENIVAR<br />
101-53046-02 November 2012<br />
161
7. PROJECT DESCRIPTION<br />
The volume of sediment to be dredged for the wharf construction at Deception Bay<br />
has raised many questions and comments from the majority of people involved in the<br />
project analysis, since the landslide at the Q1 site in 2010. In order to minimize<br />
dredging and other environmental issues related to the development of wharf<br />
infrastructures, CRI has conducted a comprehensive review of the concept. This<br />
revision main objective was to find a solution to build a wharf that can withstand ice<br />
movement by minimizing the volume of sediment to dredge and the structures<br />
footprint.<br />
This section describes the structures and the project activities, as well as the work<br />
related to their construction, operation and maintenance. These structures and<br />
activities are:<br />
• permanent and temporary wharf;<br />
• ore transshipment;<br />
• navigation required for transportation ore as well as the supply of goods and<br />
materials;<br />
• disposal site in terrestrial environment of the dredged sediment;<br />
• transportation of dredged sediment to the land disposal site.<br />
This section also presents the proposed construction methods, the schedule,<br />
dimensions and areas of various structures as well as plans.<br />
Map 7.1 shows the general layout of the project.<br />
7.1 Wharf infrastructures<br />
7.1.1 Location<br />
Wharf infrastructures will be built at the site Q1, as authorized in the global certificate<br />
of authorization issued in May 2008. The central geographical coordinates at Q1 are:<br />
• 62°08'20'' North latitude<br />
• 74°40'49'' West longitude<br />
The UTM coordinates (NAD 83 datum, Zone 18 N) of the same area, are as follow:<br />
• X = 516661 mE<br />
• Y = 6889720 mN
7.1.2 Permanent wharf<br />
The proposed concept consists in building a floating wharf including the following<br />
structures (Map 7.2):<br />
• two circular cells (cell 1 - north and cell 2 - south) consisting of sheet piles filled<br />
with crushed stone;<br />
• two riprap to protect these cells;<br />
• a bridge maintained on piles and equipped with an access ramp;<br />
• a floating barge docked to the shore and to the cells by means of cables;<br />
• an abutment on the shore outside of the limit of higher high water large tide<br />
(HHWLT)<br />
For each cells, the layer of clay sediment will be previously excavated<br />
(plans 506117-7000-41-DK-0003 and 506117-7000-41-DK-0004; Appendix 17.1).<br />
A volume of approximately 43,000 m 3 will be dredged until the silty sand layer is<br />
reached. The working method is described in section 7.1.5.<br />
A template will be used for their installation. Il will be slid over eight piles previously<br />
driven at specific locations uniformly distributed on the inner periphery of the<br />
template. The sheet piles making up the cell walls will be therefore attached to the<br />
template, which will be left in place within the filling of crushed stone. The base of the<br />
cells of sheet piles will be anchored in the unexcavated layer of silty sand. The sheet<br />
piles will be pushed into the ground by vibration.<br />
The interior of the cells will be filled with rocks of diameter varying between 100 and<br />
300 mm. These rocks will come from excavated rock produced in summer 2011 for<br />
the development of the storage hall and stacked temporarily near the oil depot.<br />
Each cell will be equipped with a concrete slab at its surface. In order to increase the<br />
stability of the structures exposed to ices movement, rock backfill will be disposed<br />
around each of the cells sheet piles (plans 506117-7000-41-DK-0005 and 506117-<br />
7000-41-DK-0006; Appendix 17.2).<br />
The cells will include an icebreaking system on their face, ship side. This system is<br />
based on the heating of the cell walls via heated steel rods placed in the concrete.<br />
Thus, when the system is operating, ice will not adhere to the cell wall.<br />
In order to weaken the ice near the sheet piles cells, an air bubble system could also<br />
be implemented. The principle is to install a system generating bubbles directly at<br />
the bottom, around structures to protect. As they rise, the bubbles carry water from<br />
Canadian Royalties Inc.<br />
GENIVAR<br />
101-53046-02 November 2012<br />
164
A<br />
74°41'0"W<br />
74°40'30"W<br />
74°40'0"W<br />
74°42'0"W<br />
74°40'0"W<br />
Site<br />
Q1<br />
Aménagement du quai permanent /<br />
Permanent wharf layout<br />
40<br />
Aménagement du quai temporaire /<br />
Temporary wharf layout<br />
Baie Déception /<br />
Deception Bay<br />
Camp permanent futur /<br />
Future permanent camp<br />
50<br />
62°8'15"N<br />
60<br />
62°8'15"N<br />
62°9'0"N<br />
62°9'0"N<br />
Xstrata<br />
Nickel<br />
A<br />
Q1<br />
Baie Déception /<br />
Deception Bay<br />
62°8'0"N<br />
500<br />
100<br />
A<br />
Q2<br />
62°8'0"N<br />
0 400 800 m<br />
550<br />
Équidistance des courbes /<br />
Contour Interval : 50 pieds 74°42'0"W<br />
/ feet<br />
B<br />
74°40'0"W<br />
C<br />
Hall de concentré existant /<br />
Existing storage hall<br />
70<br />
Déflecteur contre les<br />
coulées de neige humides /<br />
Slush flow deflector<br />
10<br />
20<br />
30<br />
40<br />
Q2<br />
50<br />
60<br />
Dépôt pétrolier /<br />
Fuel depot<br />
A<br />
Projet Nunavik Nickel / Nunavik Nickel Project<br />
EIES pour l’aménagement d’infrastructures portuaires et<br />
la gestion des sédiments à la baie Déception /<br />
ESIA for the Deception Bay Wharf and Sediment Management<br />
62°8'0"N<br />
Composantes du projet / Project Components<br />
Infrastructures portuaires projetées (variantes) /<br />
Proposed wharf (variants)<br />
Site de dépôt des sédiments (variantes) /<br />
Sediment disposal site (variants)<br />
Aire utilisée pour le site de dépôt des sédiments /<br />
Area used for the sediment disposal site<br />
Carte 7.1 / Map 7.1<br />
Aménagement général /<br />
General Layout<br />
0 40 80 120 m<br />
Projection : UTM, zone 18, NAD83<br />
Équidistance des courbes / Contour Interval : 2 m<br />
62°8'0"N<br />
Zone d'étude / Study area<br />
Infrastructures existantes / Existing Infrastructure<br />
Infrastructures portuaires / Wharf<br />
Source :<br />
Base : BNDT, 1 : 50 000, 1976 à 1995**, © Sa Majesté la Reine du<br />
Chef du Canada, reproduit avec la permission de RNCan<br />
Inventaires et cartographie / Surveys and mapping : GENIVAR<br />
Fichier / File : 101_53046_EIES_BD_c7_1_amen_121120.mxd<br />
Route / Road<br />
74°41'0"W<br />
74°40'30"W<br />
74°40'0"W<br />
Novembre / November 2012<br />
101-53046-02
A<br />
74°41'15"W<br />
74°41'0"W<br />
74°40'45"W<br />
74°40'30"W<br />
74°42'0"W<br />
74°40'0"W<br />
62°8'25"N<br />
62°9'0"N<br />
62°9'0"N<br />
Baie Déception /<br />
Deception Bay<br />
Xstrata<br />
Nickel<br />
Baie Déception /<br />
Deception Bay<br />
62°8'25"N<br />
Ancrage au sol /<br />
Shore anchor<br />
Amarre chaîne /<br />
Stud link chain<br />
Amarre cordage /<br />
Mooring softline<br />
Cellule no. 1 /<br />
Sheet pile cell no. 1<br />
Site<br />
Q1<br />
62°8'0"N<br />
500<br />
A<br />
Q1<br />
A<br />
Q2<br />
62°8'0"N<br />
Barge<br />
Système de défenses /<br />
Fendering system<br />
0 400 800 m<br />
550<br />
Équidistance des courbes /<br />
Contour Interval : 50 pieds 74°42'0"W<br />
/ feet<br />
B<br />
74°40'0"W<br />
C<br />
62°8'20"N<br />
Cellule no. 2/<br />
Sheet pile cell no. 2<br />
62°8'20"N<br />
40<br />
Pont-barge /<br />
Bridge-barge<br />
Aménagement du quai temporaire /<br />
Temporary wharf layout<br />
Camp permanent futur /<br />
Future permanent camp<br />
Réservoir diésel /<br />
Diesel tank<br />
62°8'15"N<br />
60<br />
Groupe électrogène /<br />
Generator<br />
50<br />
Appentis / Shed<br />
Rampe d'accès /<br />
Access ramp Cordes /<br />
Culée /<br />
Abutment<br />
Mooring softline<br />
Ancrage au sol /<br />
Shore anchor<br />
62°8'15"N<br />
Hall de concentré existant /<br />
Existing storage hall<br />
62°8'10"N<br />
Composantes du projet / Project Components<br />
Infrastructures portuaires projetées (variantes) /<br />
Proposed wharf (variants)<br />
Trajet des camions / Trucks path<br />
Site de dépôt des sédiments (variantes) /<br />
Sediment disposal site (variants)<br />
Déflecteur contre les<br />
coulées de neige humides /<br />
Slush flow deflector<br />
20<br />
30<br />
10<br />
Ponceau /<br />
Culvert<br />
Projet Nunavik Nickel / Nunavik Nickel Project<br />
EIES pour l’aménagement d’infrastructures portuaires et<br />
la gestion des sédiments à la baie Déception /<br />
ESIA for the Deception Bay Wharf and Sediment Management<br />
Carte 7.2 / Map 7.2<br />
Concept d'aménagement du quai permanent /<br />
Permanent Wharf Layout Concept<br />
0 25 50 75 m<br />
Projection : UTM, zone 18, NAD83<br />
Équidistance des courbes / Contour Interval : 2 m<br />
62°8'10"N<br />
Zone d'étude / Study area<br />
Infrastructures existantes / Existing Infrastructure<br />
Infrastructures portuaires / Wharf<br />
40<br />
Source :<br />
Base : BNDT, 1 : 50 000, 1976 à 1995**, © Sa Majesté la Reine du<br />
Chef du Canada, reproduit avec la permission de RNCan<br />
Inventaires et cartographie / Surveys and mapping : GENIVAR<br />
Fichier / File : 101_53046_EIES_BD_c7_2_quai_perm_121120.mxd<br />
Route / Road<br />
74°41'15"W<br />
74°41'0"W<br />
74°40'45"W<br />
A<br />
74°40'30"W<br />
Novembre / November 2012<br />
101-53046-02
the bottom (usually warmer) to the surface, limiting the formation of thick ice. Given<br />
arctic conditions in Deception Bay, it is possible that a thin layer of ice will form on<br />
top of the water (or slightly above by water vapor condensation which freezes), but<br />
the system will still weaken the ice and prevent damage to the structure. If this<br />
technique is chosen, the compressors would be installed on the shore, in insulated<br />
containers.<br />
The bubble system, like the activation of the propellers when the vessels are moving,<br />
may cause the resuspending of sediment. The physico-chemical analysis performed<br />
on the sediment since 2006 showed that the sediment at the Q1 site is not<br />
contaminated with heavy metals or hydrocarbons. In addition, no asbestos was<br />
detected in the sediment. In light of these results, sediment resuspension would not<br />
lead to a temporary increase in turbidity and will not contaminate the water in the<br />
bay.<br />
Before proceeding to the riprap around cell 2 (south), four permanent piles having a<br />
diameter of 1.2 m with 254-mm thick walls will be driven down to rock. Concrete will<br />
then be applied to the entire interior. These piles will be used to maintain the bridge<br />
which will link cell 2 to the shore, 2 m above the HHWLT limit. The two pillars located<br />
near cell 2 will be in riprap while the other two located on the shore side will be<br />
drilled into the material in place. Riprap will be built around these between the<br />
natural ground surface up to an elevation of 5.6 m which is, the elevation of HHWLT.<br />
This structure will be able to push back ice during winter.<br />
The bridge, built of steel, will measure approximately 76 m long and 22 m wide. It will<br />
have a height of 4.6 m, including a guard with a minimum height of 1 m. The bridge<br />
consists of a barge equipped with a jackup system. This system is composed of four<br />
anchor piles (spud leg) with a diameter of 1.37 m. Each anchor pile is equipped with<br />
a hydraulic power unit.<br />
The barge bridge will float into position and will be hoisted with the hydraulic system<br />
to the required elevation, approximately 2 m above the limit of HHWLT, and fixed to<br />
the four pillars. Once the bridge will be fixed, the hydraulic systems, including the<br />
four anchor piles, will be removed. The bridge will be connected to the shore and to<br />
cell 2 with steel ramps of a capacity of 85 Mt. On shore, an abutment made of<br />
concrete backfill with rock will be built outside the HHWLT limit.<br />
The 20 m long and 5.5 m wide ramp will be fixed to the bridge and will rest on the<br />
abutment and its backfill. On the side of cell 2, a first steel ramp will provide access<br />
to the cell. A second 20 m length steel ramp will provide access to the barge. This<br />
ramp will be attached to the barge by means of hinges in a manner to allow<br />
movement depending on tides, while the base will slide on the surface of cell 2.
As shown on the general development plan, ships will be docking in a barge. This<br />
barge, very massive, is designed according to Lloyds of the icebreakers ships which<br />
can withstand ices forces and take waves. The dimensions of the barge will be<br />
approximately 150 m x 25 m. It will be held in place by means of mooring cables<br />
attached to the bollards located on the sheet piles cells, as well as the shore<br />
(plan 506117-7000-41-DK-0007; Appendix 17.3). It will serve as floating dock, the<br />
bow will be in the direction of cell 1, while cell 2 will be on the port side of the barge.<br />
Stationary defense systems made of rubber or flexible polyvinyl chloride (PVC) cells<br />
will be installed at the contact points. Ships will dock to the starboard side of the<br />
barge, which will be equipped with approximately six air defenses of 3.3 m diameter<br />
and 10.6 m long. Pneumatic floating defenses are a proven alternative to the<br />
stationary defenses and are primarily used in the event of boat to boat docking for<br />
transhipment at sea or in ports with high tides.<br />
According to this concept, the proposed wharf can significantly reduce the footprint<br />
of the port infrastructure, as well as the required dredged volume. Table 7.1 shows<br />
the comparison of the different concepts studied since 2008.<br />
Table 7.1<br />
Comparison of the different wharf concepts<br />
Concept Date Footprint Dredged volume<br />
Q1 site 2008 12,118 m 2 35,000 m 3<br />
Q2 site December 2011 52,200 m 2 250,000 m 3<br />
Q2 revised site May 2012 19,300 m 2 55,000 m 3<br />
Q1 revised site October 2012 9,350 m 2 43,000 m 3<br />
7.1.3 Temporary wharf<br />
To allow the loading of vessels with the copper and nickel concentrates stored in the<br />
storage hall during winter 2013, a temporary wharf will be built in July 2013<br />
(Map 7.3).<br />
Although this structure will not be in use until summer 2013, it will allow a safe<br />
loading of the ore before the construction of the permanent wharf is completed. The<br />
temporary wharf is designed to be quickly installed and quickly dismantled. It is<br />
estimated that a seven-day period is required for its deployment. This temporary<br />
wharf could not withstand the rigors of the Arctic winter, but will be very stable and<br />
reliable during the summer season.<br />
The proposed design for the floating dock includes a temporary barge and a bridge<br />
held out of the water by means of six anchoring piles equipped with a hydraulic lift<br />
system. The barge will be held in place using these piles. Access to the bridge will<br />
Canadian Royalties Inc.<br />
GENIVAR<br />
101-53046-02 November 2012<br />
170
A<br />
74°41'15"W<br />
74°41'0"W<br />
74°40'45"W<br />
74°40'30"W<br />
74°42'0"W<br />
74°40'0"W<br />
62°8'25"N<br />
62°9'0"N<br />
62°9'0"N<br />
Baie Déception /<br />
Deception Bay<br />
Xstrata<br />
Nickel<br />
Baie Déception /<br />
Deception Bay<br />
62°8'25"N<br />
Ancrage au sol /<br />
Shore anchor<br />
Amarre chaîne /<br />
Stud link chain<br />
Amarre cordage /<br />
Mooring softline<br />
Aménagement du quai permanent /<br />
Permanent wharf layout<br />
Site<br />
Q1<br />
62°8'0"N<br />
0 400 800 m<br />
550<br />
500<br />
Équidistance des courbes /<br />
Contour Interval : 50 pieds 74°42'0"W<br />
/ feet<br />
A<br />
Q1<br />
A<br />
Q2<br />
B<br />
74°40'0"W<br />
C<br />
62°8'0"N<br />
62°8'20"N<br />
40<br />
Pont / Bridge<br />
Rampe d'accès et jetée hydraulique /<br />
Shore ramp and jackup jetty<br />
Barge<br />
Système de défenses /<br />
Fendering system<br />
62°8'20"N<br />
Camp permanent futur /<br />
Future permanent camp<br />
Réservoir diésel /<br />
Diesel tank<br />
Groupe électrogène /<br />
Generator<br />
50<br />
62°8'15"N<br />
60<br />
Appentis / Shed<br />
Amarre cordage /<br />
Mooring softline<br />
62°8'15"N<br />
Hall de concentré existant /<br />
Existing storage hall<br />
62°8'10"N<br />
Composantes du projet / Project Components<br />
Infrastructures portuaires projetées (variantes) /<br />
Proposed wharf (variants)<br />
Trajet des camions / Trucks path<br />
Site de dépôt des sédiments (variantes) /<br />
Sediment disposal site (variants)<br />
Déflecteur contre les<br />
coulées de neige humides /<br />
Slush flow deflector<br />
20<br />
30<br />
10<br />
Ponceau /<br />
Culvert<br />
Ancrage au sol /<br />
Shore anchor<br />
Projet Nunavik Nickel / Nunavik Nickel Project<br />
EIES pour l’aménagement d’infrastructures portuaires et<br />
la gestion des sédiments à la baie Déception /<br />
ESIA for the Deception Bay Wharf and Sediment Management<br />
Carte 7.3 / Map 7.3<br />
Concept d'aménagement du quai temporaire /<br />
Temporary Wharf Layout Concept<br />
0 25 50 75 m<br />
Projection : UTM, zone 18, NAD83<br />
Équidistance des courbes / Contour Interval : 2 m<br />
62°8'10"N<br />
Zone d'étude / Study area<br />
Infrastructures existantes / Existing Infrastructure<br />
Infrastructures portuaires / Wharf<br />
40<br />
Source :<br />
Base : BNDT, 1 : 50 000, 1976 à 1995**, © Sa Majesté la Reine du<br />
Chef du Canada, reproduit avec la permission de RNCan<br />
Inventaires et cartographie / Surveys and mapping : GENIVAR<br />
Fichier / File : 101_53046_EIES_BD_c7_3_quai_temp_121120.mxd<br />
Route / Road<br />
74°41'15"W<br />
74°41'0"W<br />
74°40'45"W<br />
A<br />
74°40'30"W<br />
Novembre / November 2012<br />
101-53046-02
e provided by two ramps arranged at each end of the bridge. Plans 533079-<br />
8301-0001 and 0002 (Appendix 17.4) illustrate in plan and section the structures<br />
composing the temporary wharf.<br />
The barge used as a temporary wharf will serve as the bridge in the permanent<br />
wharf concept, thus the dimensions are identical. During periods of strong winds, the<br />
barge will be raised above the water level with the hydraulic automatic lift. The four<br />
anchor piles will be driven to bedrock. Unlike the barge in the permanent wharf<br />
concept, the barge is not designed to withstand waves and ice. Under heavy wind<br />
conditions, it is more advantageous and safe to use the automatic lift system to hoist<br />
the barge above the waves than moving it offshore to avoid breakage risk.<br />
The temporary bridge will be constructed of steel and will have a total length of<br />
approximately 45.7 m, a width of 12.2 mm and a height of 2.1 m (plans 533079-<br />
8301-0001 and 0002, appendix 17.4). It will consist of an assemblage of the<br />
following units:<br />
• 9 units of 12.2 m x 3 m x 2.1 m;<br />
• 6 units of 6.1 m x 3 m x 2.1 m.<br />
The temporary bridge will also be equipped with an automatic lift system. This<br />
system is composed of six hollow anchoring piles with a diameter of 0.97 m and with<br />
three hydraulic power units for hoisting the structure to the required elevation, 2 m<br />
above the HHWLT limit. All piles will be driven to bedrock. The barge-bridge will float<br />
to its position and will be raised with the hydraulic system.<br />
Two steel ramps with a capacity of 85 Mt and of approximately 12.5 m long by 5.5 m<br />
wide will connect the shore to the bridge, and the bridge to the barge. The ramp<br />
connecting the bridge to the barge will be mobile in order to follow vertical<br />
displacement of the dock.<br />
7.1.4 Piles driving<br />
As mentioned in section 7.1.2, the construction of sheet piles cells, the set up and<br />
maintenance of the barge bridge will require piles driving. The piles will be set up in<br />
place by vibrodriving in the surficial materials and hammered in the rock section.<br />
It is estimated that the construction of the two sheet piles cells by means of<br />
templates will require eight piles per cell. These piles will be driven into the rock to a<br />
depth of approximately 2 m. The rock will then be fractionated by the interior of the<br />
pile.
For the permanent bridge, a total of eight piles will be drilled; four piles will serve as<br />
pillars and four anchor piles will be used to raise the barge to the required elevation.<br />
The temporary wharf requires six anchoring piles for the maintenance of the bridge<br />
above the water and four other to lift the barge above water during storm conditions.<br />
7.1.5 Dredging<br />
7.1.5.1 Description of the work<br />
Prior to the set-up of the sheet piles cells, the clay sediment layer will be dredged.<br />
The installation of cell 1 (north) requires the dredging of approximately 23,000 m 3 ,<br />
while for cell 2 (south) a dredged volume of approximately 20,000 m 3 is estimated.<br />
Thus, a total volume of approximately 43,000 m 3 will be dredged. Spreadsheets<br />
used to determine the dredged volumes are in Appendix 18.<br />
In the tidal zone, dredging will be carried out using an excavator. Excavated<br />
sediment will be deposited directly into the bin of an off-road truck and will be<br />
transported to the sediment disposal site. Transportation is described in<br />
section 7.3.1.<br />
As for the work in open waters, dredging will be carried out using a clamshell dredge.<br />
The clamshell dredge has a capacity of 10 m 3 . Sediment will be deposited at first on<br />
another barge. Once the barge is full, it will be moved by a tug until it is leaning<br />
against the shore or against a small working platform built on the shore. An<br />
excavator will then transfer sediment into trucks.<br />
It is expected that sediment dredging will be carried out over a period of<br />
approximately 16 hours per day. It is possible to dredge approximately 100 m 3 /hour,<br />
if weather conditions allow it. An estimated volume of 43,000 m 3 has to be<br />
excavated, a little less than 30 days would be required for dredging.<br />
The work would be carried out from mid-June to mid-July 2013, and considering that<br />
the mitigation measures described in the environmental impact assessment form<br />
(section 8) will be strictly enforced.<br />
7.1.5.2 Sediment dispersion<br />
Modeling of the sediment dispersion plume was conducted to predict the impacts of<br />
dredging on the water quality in Deception Bay. The results of these simulations are<br />
presented in the hydrodynamics modeling of Deception Bay sector report<br />
(Appendix 7). The following paragraphs are taken from this report.<br />
Canadian Royalties Inc.<br />
GENIVAR<br />
101-53046-02 November 2012<br />
174
First, considering only the tide effect, the simulations indicate that after 25 days of<br />
dredging, suspended solids (SS) concentrations near the work area and on the<br />
opposite shore could reach values higher than 100 mg/L or even 300 mg/L.<br />
However, at the center of the bay, simulations suggest concentrations ranging<br />
between 3 and 30 mg/L, which meets the surface water quality criterion for aquatic<br />
life protection set by the MDDEP (2012), this is 25 mg/L over the natural<br />
concentration observed which is 5 mg/L. This phenomenon is explained by low flow<br />
rates in Deception Bay, and by the fact that this flow is reversed to the tide.<br />
Simulations were also performed to account for currents induced by wind and tide.<br />
The simulations were initially performed for south-west winds, and then for northwest<br />
winds (prevailing winds in Deception Bay during the construction period). In<br />
both cases, the simulations were performed considering sustained winds of 30 km/h<br />
over a period of 1.5 to 3 days.<br />
The results show a significant effect of wind on the sediment dispersion. Indeed,<br />
winds generate unidirectional currents much larger than the weak oscillatory currents<br />
associated with tides only, which tend to spread the sediment plume in directions<br />
more defined. A wind from the north-west carries the dispersion plume toward the<br />
Bombardier Beach and to the Deception River mouth, while a wind from the southwest<br />
sends the plume towards the mouth of the bay (Figure 29, Appendix 7).<br />
Given the different assumptions adopted for the realization of these models, the<br />
results should be interpreted with caution and discernment. Nevertheless, they<br />
provide a better understanding of the expected progression of the sediment plume. It<br />
appears that it is strongly influenced by the direction and strength of wind, tidal<br />
influence being minor.<br />
It is impossible to predict the weather conditions at the moment of the work.<br />
However, considering that the wind forces could vary between 17.6 and 27.3 km/h<br />
approximately 50% of the time at Deception Bay during the construction period<br />
(section 6.1.3.2), the strict application of all mitigation measures during dredging<br />
should limit the resuspension of sediment and their dispersion in Deception Bay.<br />
These measures are presented in the environmental impact assessment forms<br />
(section 8).<br />
Finally, the use of a sediment curtain or a bubbles curtain was considered to confine<br />
the suspended sediment and limit their dispersion in Deception Bay. However, the<br />
effectiveness of these methods is greatly reduced in an environment where tides are<br />
higher than 3 m and where wind events are important, which is the case in<br />
Deception Bay (Bray, RN – Editor, 2008). Thus, it was decided not to use such<br />
methods of containment.
7.1.6 Riprap<br />
Excavated material outside the sheet piles cells will be replaced by riprap. The cells<br />
top will be equipped with a concrete slab and the wall heating system will be<br />
embedded in concrete. The residual volume inside these cells will be filled with<br />
rocks.<br />
Riprap will be placed around both pillars of permanent wharf located near the shore<br />
in order to ensure protection against ice.<br />
The abutment built on the shore will consists of concrete and riprap.<br />
Table 7.2 presents the estimated volumes of riprap required and the structures<br />
areas.<br />
Table 7.2<br />
Estimated volumes of riprap and structures areas<br />
Location<br />
<strong>Volume</strong><br />
(m 3 )<br />
Area<br />
(m 2 )<br />
Cell 1 (north)<br />
• interior 8,900 470<br />
• exterior 23,000 4,430<br />
Cell 2 (south)<br />
• interior 8,200 470<br />
• exterior 19,500 3,800<br />
Abutment 400 270<br />
Pillars 500 160<br />
Total 60,500 9,600<br />
Geochemical tests were carried out on the rocks which will be used and stored on<br />
the future sediment disposal site. The results show that these are not acid<br />
generating. Certificates of analysis are available in Appendix 19.<br />
7.1.7 <strong>Main</strong>tenance<br />
Besides a visual inspection of the structures put in place, the concept of the<br />
proposed wharf requires no maintenance. As shown by the hydrodynamic modeling<br />
(GENIVAR, 2012a), the development of wharf has little influence on the current<br />
measurements due to its configuration which allows free passage of water along the<br />
shore. This configuration also helps maintain the litoral driff of the sediment<br />
transported by the currents induced by waves (sediment load transient along the<br />
shore), which should result in little or no additional accumulation of sediment near<br />
the wharf. <strong>Main</strong>tenance dredging is thus not anticipated.<br />
Canadian Royalties Inc.<br />
GENIVAR<br />
101-53046-02 November 2012<br />
176
7.1.8 Geotechnical considerations<br />
Stantec was selected to assess the overall stability of the wharf concept built by<br />
means of sheet pile cells.<br />
Stability of both cells was analyzed under two scenarios:<br />
• no dredging and sheet piles cells supported by driven piles to bedrock;<br />
• dredging the silty clay layer at the cells location and setting up riprap.<br />
For these two scenarios, a stability analysis was performed considering, firstly, the<br />
ice pressure in order to assess the risk of slipping towards the shore and, thereafter,<br />
without the strength of ice to verify potential sliding seawards. All stability analyzes<br />
were performed using the software SLOPE / W developed by the company GEO-<br />
SLOPE International.<br />
For all analyzes, the safety factor of several surfaces with rupture potential was<br />
calculated in order to determine the minimum safety factor. The safety factor is<br />
defined as the ratio of the stabilizing forces in relation to the driving forces tending to<br />
cause rupture. Safety factors obtained for the eight simulations are presented in<br />
Table 7.3.<br />
Table 7.3<br />
Summary of safety factors<br />
Cell Dredging Ice load<br />
Expected sliding<br />
direction<br />
Safety factor<br />
Yes 0 Seawards 2.12<br />
Cell 1 (north)<br />
Yes 275 kN/m Toward the shore 9.36<br />
No 0 Seawards 2.46<br />
No 275 kN/m Toward the shore >100<br />
Cell 2 (south)<br />
Yes 0 Seawards 1.83<br />
Yes 1940 kN/m Toward the shore 2.25<br />
No 0 Seawards 1.91<br />
No 1940 kN/m Toward the shore 3.91<br />
In all cases, safety factors obtained are higher than 1.5, which is acceptable.<br />
It is important to note that for the dredging scenarios, it was assumed that the<br />
excavation at cells location will be stable on a slope of 3H:1V.<br />
The safety factor against tipping under the action of ice loads applied was also<br />
examined. For cell 1, the safety factor against toppling is approximately 10 for both<br />
options (with and without dredging). For cell 2, which is subjected to higher ice loads,<br />
the safety factor against toppling is 1.9 for both options. This is also considered<br />
acceptable.
The risks that a slide occurs during the development of the wharf are minimized due<br />
to a better knowledge of the environment and a more favorable cells positioning<br />
made possible due to their small numbers.<br />
7.2 Transshipment of ore<br />
The first conveyor (conveyor No. 1) is installed in a shed, in a building section<br />
constructed below the storage hall, and then directed to a second conveyor<br />
(conveyor No. 2), by which the concentrate will be forwarded to the ship loader<br />
(Figure 7.1).<br />
Conveyor No. 2 will be located in a tubular conduit, half of the section will be used for<br />
the conveyor and the other half will include an access platform. Each conveyor<br />
possesses a nominal capacity of 500 t/h. At the end of conveyor No. 2, the<br />
concentrate will be confined in a completely closed telescopic vertical drop which will<br />
descend to the floating wharf height (Figure 7.2).<br />
The ship loader is a third conveyor, but with variable geometry to accommodate<br />
different sizes of ships and tides. This conveyor installed on the floating wharf will<br />
also be completely closed.<br />
At the end of the third conveyor, the concentrate will be confined to a telescopic<br />
vertical drop which will descend to the boat deck height (Figure 7.2). The loader arm<br />
will pivot vertically and horizontally to effectively reach the holds of the ship and<br />
minimize the effects of free falling materials.<br />
It is important to note that although the concentrate is damp and that risks of dust<br />
generation are minimal, dust collectors will be installed at all transfer points between<br />
conveyor sections (Figures 7.2 and 7.3).<br />
The preventive measures in place, such as the development of conveyors in closed<br />
structures, maintaining the concentrate to a moisture content of 6-8%, and the<br />
implementation of dust collectors will minimize the risk dispersion of dust into the<br />
atmosphere.<br />
In the summer of 2013, when ore transshipment will take place from the temporary<br />
wharf, conveyor No. 2 will be extended and will run along the shore to connect the<br />
storage hall exiting point to the bridge of the temporary wharf (Figure 7.4). The<br />
concept of permanent wharf expects that the second part of the conveyor will be<br />
straight between the hall and the wharf.<br />
It is expected that four days will be required for loading an ore carrier.<br />
Canadian Royalties Inc.<br />
GENIVAR<br />
101-53046-02 November 2012<br />
178
Figure 7.1 – Permanent Dock Facility Concept<br />
Telescopic chutes<br />
with dust collector<br />
Fichier : 101_53046_EIES_BD_Fig7_1_EN_121030.fh9<br />
Conveyor no. 3<br />
Conveyor no. 2<br />
101-53046-02
Figure 7.2 – Permanent Dock Facility Concept<br />
Fichier : 101_53046_EIES_BD_Fig7_2_EN_121030.fh9<br />
Example of a<br />
dust collector<br />
Example of a<br />
telescopic chute<br />
101-53046-02
Figure 7.3 – Transfer points<br />
Example of a dust collector<br />
connected to a transfer point<br />
Fichier : 101_53046_EIES_BD_Fig7_3_EN_121030.fh9<br />
Example of an<br />
enclosed transfer point<br />
101-53046-02
Figure 7.4 – Temporary Dock Facility Concept<br />
Transfer points with<br />
dust collector<br />
Conveyor no. 2<br />
Fichier : 101_53046_EIES_BD_Fig7_4_EN_121030.fh9<br />
Telescopic chutes<br />
with dust collector<br />
Conveyor no. 3<br />
101-53046-02
A<br />
74°40'45"W<br />
10<br />
Ponceau /<br />
Culvert<br />
74°40'30"W<br />
74°40'15"W<br />
62°9'0"N<br />
74°40'0"W<br />
74°42'0"W<br />
200<br />
74°40'0"W<br />
62°9'0"N<br />
Xstrata<br />
Nickel<br />
62°8'10"N<br />
20<br />
30<br />
Q1<br />
Baie Déception /<br />
Deception Bay<br />
62°8'10"N<br />
40<br />
Q2<br />
62°8'0"N<br />
500<br />
A<br />
A<br />
Q2<br />
62°8'0"N<br />
50<br />
B<br />
0 400 800 m<br />
550<br />
Équidistance des courbes /<br />
Contour Interval : 50 pieds 74°42'0"W<br />
/ feet<br />
74°40'0"W<br />
C<br />
62°8'5"N<br />
60<br />
62°8'5"N<br />
Baie Déception /<br />
Deception Bay<br />
A<br />
70<br />
Dépôt pétrolier /<br />
Fuel depot<br />
62°8'0"N<br />
62°8'0"N<br />
10<br />
62°7'55"N<br />
Composantes du projet / Project Components<br />
Infrastructures portuaires projetées (variantes) /<br />
Proposed wharf (variants)<br />
Site de dépôt des sédiments (variantes) /<br />
Sediment disposal site (variants)<br />
Zone d'étude / Study area<br />
Infrastructures existantes / Existing Infrastructure<br />
Infrastructures portuaires / Wharf<br />
Aire utilisée pour le site de dépôt des sédiments /<br />
Area used for the sediment disposal site<br />
50<br />
40<br />
30<br />
20<br />
Projet Nunavik Nickel / Nunavik Nickel Project<br />
EIES pour l’aménagement d’infrastructures portuaires et<br />
la gestion des sédiments à la baie Déception /<br />
ESIA for the Deception Bay Wharf and Sediment Management<br />
Source :<br />
Carte 7.4 / Map 7.4<br />
Site de dépôt des sédiments /<br />
Sediment Disposal Site<br />
0 25 50 75 m<br />
Projection : UTM, zone 18, NAD83<br />
Équidistance des courbes / Contour Interval : 2 m<br />
Base : BNDT, 1 : 50 000, 1976 à 1995**, © Sa Majesté la Reine du<br />
Chef du Canada, reproduit avec la permission de RNCan<br />
Inventaires et cartographie / Surveys and mapping : GENIVAR<br />
Fichier / File : 101_53046_EIES_BD_c7_4_site_sed_121120.mxd<br />
62°7'55"N<br />
Route / Road<br />
74°40'45"W<br />
74°40'30"W<br />
74°40'15"W<br />
74°40'0"W<br />
Novembre / November 2012<br />
101-53046-02
7.3 Navigation<br />
The ore carriers used will have a maximum capacity of 25,000 t and a length of<br />
approximately 190 m. During the first three years of mining, production will be at its<br />
maximum, CRI plans to transport 185,000 t of concentrates using vessels with a<br />
capacity of about 25,000 t. Ore carriers should execute approximately seven to eight<br />
trips 13 during the nine months of navigation agreed with Inuits. In addition, there are<br />
two ships to transport fuel and one for goods and materials. This brings the annual<br />
traffic density to approximately 11 ships.<br />
Materials and fuel will be transported by sea, as much as possible during the period<br />
when the bay is ice-free (between June and November). Ships similar to those of the<br />
company FEDNAV will be used in summer. These boats have a length of 220 m and<br />
a transport capacity of 25,000 t or less. For winter transport, a Class 4 Arctic<br />
icebreaker with a maximum capacity of 25,000 t be used. These boats can withstand<br />
contact with second-year ice (photo 1, Appendix 20).<br />
The ships itinerary is showed on Map 7.5. It will be the same route as Xstrata’s<br />
ships, with the same limitations, guided by the landmarks placed on the ground to<br />
identify the safe navigation path. Circulating in ice-free waters, vessels will take<br />
approximately two hours to make the trip from the mouth of Deception Bay to the<br />
pier. When ice is present, it takes at least eight hours to make the same route.<br />
Considering 11 trips per year, including two with ice cover, the movement of ships in<br />
the bay will totalize approximately 80 hours annually on behalf of CRI.<br />
In accordance with the certificate of authorization issued in 2008 by the MDDEP for<br />
PNNI, CRI will not perform transportation in Deception Bay between mid-March and<br />
mid-June, unless an emergency situation arising from unexpected events which<br />
cannot be resolved by other means than by maritime transport.<br />
The operation area of ships carrying the concentrate was estimated based on the<br />
following assumptions:<br />
• the dimensions in plan of the ship will be 27 m x 190 m;<br />
• the wharf will have a length of 150 m;<br />
• a first approach to the pier will be made at a distance equivalent to the width of<br />
the ship;<br />
• the distance from wharf can reach 6 m;<br />
• during ore transshipment, the ship’s bow or stern may extend approximately<br />
95 m beyond the end of the dock (half of its length), to ensure a good distribution<br />
of the concentrate in all holds.<br />
13<br />
Each trip includes two trips in Deception Bay, there and back.
Thus, the width of the manoeuvring area perpendicular to the wharf is estimated at<br />
60 m, twice the width of the boat to which the distance away from the wharf is added.<br />
The length of the manoeuvring area totalizes 340 m ((95 x 2) + 150). The area is<br />
thus of approximately 20,400 m 2 . However, considering that the ship does not<br />
always approach perfectly parallel to the wharf, it is conservative to increase this<br />
value by a factor of 50%. Based on these assumptions, the size of the manoeuvring<br />
area would be approximately 30,000 m 2 .<br />
It should be noted that in a safe manner, assuming a first approach to the wharf at a<br />
distance equivalent to the width of the ship was considered. However, this distance<br />
may be reduced by half (Tom Grandy, a captain of the Arctic docking at pier, Xstrata,<br />
pers. comm., 2012). The width of the manoeuvring area would then be 47 m,<br />
reducing its area to 24,000 m 2 .<br />
7.3.1 Ballast water and invasion of foreign species<br />
Vessels navigating in Canada are required by Ballast Water Control and<br />
Management Regulations of Canada (DORS/2011-237) to conduct a mid-ocean<br />
exchange of ballast water, to avoid potential internal Canadian waters contamination<br />
by bacteria and other microorganisms, microalgae, aquatic plants and animals<br />
abroad. Ship’s ballast water chartered by CRI will be replaced, if any, by salty water<br />
drawn from the middle of the Atlantic Ocean, thus avoiding contamination of<br />
Deception Bay by foreign species.<br />
Wastewater from ships will be processed and stored on board. They will be disposed<br />
of in accordance with international rules, and always outside the Canadian Arctic<br />
waters.<br />
In addition, Transport Canada (TC) is developing regulations aimed at preventing<br />
undesirable invasive aquatic species which stick to the ships hulls. Risks that such<br />
species are imported in Deception Bay by ships are very low due to the temperature<br />
of its waters, which are much colder than the ships departure ports or seas through<br />
which they pass. CRI will require that ship owners comply with Canadian regulations<br />
and international conventions existing on the ballast water management, as well as<br />
those adopted or which will come into force in the coming years.<br />
7.4 Disposal site for the dredged sediment<br />
As mentioned above, the estimated dredged volume is 43,000 m 3 . For the design of<br />
dredged sediment disposal site, the required landfill volume was set to 50,000 m 3 .<br />
This volume was estimated from the calculated volume added to a safety factor to<br />
account for the swelling factor.<br />
Canadian Royalties Inc.<br />
GENIVAR<br />
101-53046-02 November 2012<br />
186
Détroit d' Hudson Hudson Strait<br />
62°13'0"N<br />
Promontoire<br />
Maurepas<br />
74°50'0"W<br />
False<br />
Cove<br />
Neptune<br />
Island<br />
Egg Rock<br />
Arctic<br />
Island<br />
Pointe Noire<br />
74°40'0"W<br />
Navigation<br />
Itinéraire approximatif des navires /<br />
Approximative route for ships<br />
Composantes du projet / Project Components<br />
Infrastructures portuaires projetées (variantes) /<br />
Proposed wharf (variants)<br />
Site de dépôt des sédiments (variantes) /<br />
Sediment disposal site (variants)<br />
Zone d'étude / Study area<br />
Infrastructures existantes / Existing Infrastructure<br />
74°30'0"W<br />
62°13'0"N<br />
Moosehead<br />
Islands<br />
Campement Inuit permanent / Inuit permanent camp<br />
Infrastructures portuaires / Wharf<br />
Mont de<br />
la Table<br />
Route / Road<br />
White<br />
Rock<br />
Pointe Théron<br />
62°9'0"N<br />
Baie Kangirsugaarjuk /<br />
Careenage Arm<br />
Xstrata<br />
Nickel<br />
Q1<br />
A<br />
62°9'0"N<br />
Q2<br />
A<br />
B<br />
E C<br />
D<br />
Baie Déception /<br />
Deception Bay<br />
Plage du<br />
Bombardier<br />
Ancien terrain d'aviation /<br />
Inactive Air Field<br />
Campement<br />
temporaire /<br />
Temporary<br />
camp<br />
Site 4<br />
Rivière Déception<br />
62°5'0"N<br />
A<br />
74°41'0"W<br />
74°40'0"W<br />
Ancienne pourvoirie /<br />
Inactive Outfitter<br />
(camp Kanguq)<br />
Lac<br />
Duquet<br />
62°5'0"N<br />
Baie Déception /<br />
Deception Bay<br />
62°8'30"N<br />
62°8'30"N<br />
Projet Nunavik Nickel / Nunavik Nickel Project<br />
EIES pour l’aménagement d’infrastructures portuaires et<br />
la gestion des sédiments à la baie Déception /<br />
ESIA for the Deception Bay Wharf and Sediment Management<br />
Carte 7.5 / Map 7.5<br />
62°1'0"N<br />
40<br />
60<br />
50<br />
Site<br />
Q1<br />
Itinéraire des navires / Ships Path<br />
0 1,2 2,4 3,6 km<br />
Projection : UTM, zone 18, NAD83<br />
Équidistance des courbes / Contour Interval : 50 pieds / feet<br />
Sources :<br />
Base : BNDT, 1 : 50 000, 1976 à 1995**, © Sa Majesté la Reine du<br />
Chef du Canada, reproduit avec la permission de RNCan ;<br />
Utilisation du territoire / Land Use : ROCHE et/and Canarctic, 1993<br />
Mise à jour / Update : GENIVAR, 2012<br />
62°1'0"N<br />
0 120 240 m<br />
Équidistance des courbes /<br />
Contour Interval : 10 m<br />
74°41'0"W<br />
74°50'0"W<br />
10<br />
20<br />
30<br />
40<br />
74°40'0"W<br />
74°40'0"W<br />
Q2<br />
Inventaires et cartographie / Surveys and mapping : GENIVAR<br />
Fichier / File : 101_53046_EIES_BD_c7_5_itin_navires_121120.mxd<br />
Novembre / November 2012<br />
101-53046-02<br />
74°30'0"W<br />
101-53046-02
The sediment disposal site will be built on land, in front of the oil depot, on the other<br />
side of the road, at the bottom of the hill (Map 7.4). During blasting carried out in the<br />
summer of 2011, the excavated rocks were stored for future use during the wharf<br />
construction. The volume of stored rock is estimated at 262,000 m 3 .<br />
Briefly, the sediment management site development involves digging a pond in the<br />
pile of rocks, thus avoiding the additional rock blasting (plan 101-5304602_F01:<br />
Appendix 17). The preliminary design of the pond is described as follows:<br />
• side slope: 2H:1V;<br />
• plateau at the top of the dike: 1 m;<br />
• elevation of the dike: 30 m;<br />
• freeboard: 1 m;<br />
• excavated material: 182,900 m 3 ;<br />
• backfill: 6,000 m 3 ;<br />
• access ramp slope: 8 to 10%;<br />
• pond capacity: 51,000 m 3 ;<br />
• total pond area including turning area: 17,900 m 2 .<br />
The berm will be composed of the rock currently stored. The inner wall may be<br />
covered with a separation geotextile if the particle size of the material in place<br />
requires it (plan 101-53046-02_F02: Appendix 17).<br />
In a safe manner, the dike slopes were established to 2H:1V. However, a<br />
geotechnical analysis including the determination of the stored rocks friction<br />
coefficient will decide on the final slope. Slopes can then be accentuated. This data<br />
will be defined later in the context of the application for a certificate of authorization.<br />
An estimated residual rock volume of approximately 177,000 m 3 remains available. A<br />
portion of this volume will be used for the wharf construction. The rest will be stored<br />
to the north of wet snow avalanches deflector for future use (road maintenance).<br />
As mentioned in the sector report on the hydrodynamics of Deception Bay<br />
(GENIVAR, 2012a), current sedimentation rates at the site and projected at site Q1<br />
are considered low, and the establishment of a maintenance dredging program is not<br />
anticipated. However, if a landslide or an avalanche occurs, requiring emergency<br />
dredging, the site chosen for the construction of sediment deposition (site A)<br />
provides sufficient storage capacity for its expansion.<br />
Canadian Royalties Inc.<br />
GENIVAR<br />
101-53046-02 November 2012<br />
188
7.4.1 Dredged sediment transportation<br />
Sediment will be transported by 40-t off-road truck, between the wharf and the<br />
disposal site over a distance of approximately 850 m.<br />
The off-road truck’s bins will be equipped with a tailgate allowing to close them. It is<br />
possible that this equipment cannot ensure perfect sealing of the bin, a small amount<br />
of water contained in the sediment could flow out of the bin, but will not let the clay<br />
sediment out.<br />
The trucking estimate generated by sediment transport was conducted based on the<br />
following assumptions:<br />
• an excavator can handle about 160 m 3 /h;<br />
• a truck takes about 30 minutes to complete a round trip (loading, moving,<br />
unloading, returning);<br />
• a truck can carry approximately 20 m 3 ; therefore truck transports 40 m 3 /h.<br />
Based on these assumptions, four trucks will be required to meet the excavator<br />
production. Consequently, the traffic between the wharf and the sediment<br />
management site will be increased by four trucks / hour during the period of<br />
dredging.<br />
7.4.2 Water management<br />
Ditch will be built at the bottom of the hill, along the disposal site (plan 101-<br />
53046-02_F01: Appendix 17). This ditch will intercept runoff from the hill and cliff,<br />
and deflect outwards from the disposal site. A ditch will also be constructed at the<br />
bottom of the dike to capture water that may percolate through the berm. Being not<br />
contaminated, leaching water from the sediment may be returned to Deception Bay<br />
without treatment. A breach will be installed in the upper portion of the berm to<br />
create an outlet for the settling water at the sediment surface. A sediment barrier will<br />
be installed to capture fine particles that could potentially be there. Water contained<br />
in the sediment will gradually and returned by gravity to Deception Bay.<br />
It should be noted that the dredged sediment will be deposited directly on the rock.<br />
There is no risk of soil contamination by saline water given that the sediments will<br />
not be in contact with them, and the leached water will be collected by ditches and<br />
returned via the Deception Bay existing drainage system. On the other side of the<br />
road, it is most likely that a portion of the site is already affected by the bay salt water<br />
due to its proximity.
A sampling point, before the culvert inlet, will allow sampling and analysis of the<br />
surface waters quality before they cross the road (plan 101-53046-02_F01). If<br />
required, sediment retention structures may be constructed in the ditch to reduce the<br />
concentrations of suspended solids (sediment barrier, filter berm or other structure to<br />
in order to meet the surface waters quality criteria).<br />
7.5 Closing and decommissioning<br />
7.5.1 Wharf<br />
At the end of its activities, CRI wishes to transfer the wharf to the regional<br />
government. If an agreement was not possible, it will be dismantled and demolition<br />
materials managed under the procedure in place:<br />
• sorting of materials;<br />
• transportation of the recyclable materials toward the south;<br />
• packaging and transportation of hazardous waste toward the south;<br />
• transportation of non-recyclable materials to the Expo site: combustible materials<br />
will be burned, and non-combustible materials as well as the ashes will be<br />
buried in the landfill in the northern environment.<br />
7.5.2 Management sediment site<br />
As soon as the sediment will be sufficiently dried or frozen to allow the machinery to<br />
roll on its surface, it will be covered with granular materials. The platform thus formed<br />
will serve as a storage area during the period of wharf operation. At the end of<br />
operations, the site will be liberated, the only remaining infrastructure will be a<br />
platform equipped with an access which could be used as a bay observation point.<br />
7.6 Completion schedule<br />
Tables 7.4 and 7.5 present the delivery schedule proposed for the development of<br />
permanent and temporary wharves. Work will begin in mid-June, as soon as the<br />
weather conditions allow it, and should be completed by mid-November for the<br />
permanent wharf and in mid-August for the temporary wharf.<br />
7.7 Costs of the work<br />
The wharf project cost is estimated at $70 million.<br />
Canadian Royalties Inc.<br />
GENIVAR<br />
101-53046-02 November 2012<br />
190
Table 7.4 Permanent Wharf<br />
Activities<br />
Foundations of the abutment<br />
Access roads to work sites<br />
Sediment disposal site<br />
Dredging<br />
Piles driving<br />
Construction of the sheet piles cells<br />
Installation of the metallic structures<br />
Backfill around the cells<br />
Installation of the floating wharf<br />
Installation of the conveyors and of the<br />
boat loader (permanent)<br />
First trip for the ore carrier<br />
Table 7.5 Temporary Wharf<br />
Activities<br />
Approach lane<br />
Access roads to work sites<br />
Anchor piles driving<br />
Installation of the metallic structures<br />
Installation of the floating wharf<br />
Installation of the conveyors and of the<br />
boat loader (temporary)<br />
First trip for the ore carrier<br />
2013<br />
June July August September October November Décember<br />
2 9 16 23 30 7 14 21 28 4 11 18 25 1 8 15 22 29 6 13 20 27 3 10 17 24 1 8 15 22 29<br />
between June 20 and July 15 no drilling, blasting and driving of sheet piles. Only backfilling and<br />
dredging are allowed.<br />
2013<br />
June July August September<br />
2 9 16 23 30 7 14 21 28 4 11 18 25 1 8 15 22 29<br />
between June 20 and July 15 no drilling, blasting and<br />
driving of sheet piles. Only backfilling and dredging are<br />
allowed.
7.8 Required equipment<br />
It should be noted that all operational equipment necessary for the development of<br />
port facilities at Deception Bay will respect Quebec regulations in force, and the<br />
machinery and other equipments will be installed on land or water depending on the<br />
nature of the work to achieve.<br />
Table 7.6 lists the equipment that will be potentially required.<br />
7.9 Estimation of required personal<br />
A preliminary estimation of the number of workers required for the construction of the<br />
wharf was completed. Table 7.7 presents the estimated number of workers for each<br />
of the tasks to be completed.<br />
Table 7.6<br />
Machinery and equipment<br />
Terrestrial<br />
Drills<br />
Trucks (off-road and on-road)<br />
Bulldozers<br />
Loaders<br />
Graders<br />
Compressors<br />
Excavators<br />
Tanker truck with fuel<br />
and biodegradable lubricant<br />
Off-road trucks<br />
Cranes<br />
Bus<br />
Vans<br />
Mixer for mixing<br />
dry components of the concrete<br />
Concrete mixers<br />
Concrete pump<br />
On water<br />
Barges<br />
Tugboats<br />
Clam bucket<br />
Crane 220T<br />
Vibrator for sheet pile driving<br />
Compressors<br />
Concrete hopper<br />
Hammer drill tubular piles<br />
Table 7.7<br />
Estimated number of workers<br />
Task<br />
Number of workers<br />
Dredging 20<br />
Vibratory pile driving 20<br />
Riprap 10<br />
Concreting 20<br />
Site operation 10<br />
Cut / fill of the sediment basin 10<br />
Supervision (contractor and CRI) 10<br />
Total 100<br />
Canadian Royalties Inc.<br />
GENIVAR<br />
101-53046-02 November 2012<br />
192
8. ASSESSMENT OF ENVIRONMENTAL EFFECTS<br />
8.1 Method for identifying and assessing environmental effects<br />
The methodological approach to assessing environmental effects involves two broad<br />
stages, that is, the identification and assessment of effects.<br />
The identification of effects consists of establishing the components of the physical,<br />
biological and human environments likely to be impacted by project activities. Effects<br />
assessment then consists in defining the magnitude of the effects associated with<br />
doing the project. The effect's magnitude for an environmental component is a<br />
function of three parameters: intensity, duration and extent.<br />
The first step in determining an effect's magnitude involves relating an environmental<br />
component's environmental value to the degree of disturbance anticipated, which<br />
makes it possible to identify the effect's intensity. The second step consists in<br />
evaluating the effect's duration, so as to create a duration-intensity index. The third<br />
step leads to an assessment of the magnitude of the effect, by introducing its extent.<br />
Lastly, the significance of residual effects is evaluated by factoring in the use of<br />
mitigation measures.<br />
8.1.1 Determining the magnitude of an environmental effect<br />
8.1.1.1 Intensity of the effect<br />
The first step in determining an effect's magnitude involves evaluating the effect's<br />
intensity by relating the environmental component's environmental value to the<br />
degree of disturbance expected.<br />
Value of environmental components<br />
A component's value is determined according to its ecosystem and/or sociocultural<br />
and economic importance. In some cases, no rating is assigned to any of these<br />
values.<br />
Canadian Royalties Inc.<br />
GENIVAR<br />
101-53046-02 November 2012<br />
193
Ecosystem value<br />
A component's ecosystem value is determined solely for the components of a<br />
biological environment. This value expresses a component's relative importance in<br />
terms of its interest to the ecosystem, factoring in its characteristics (sensitivity,<br />
integrity, resilience), its role and its function. It also includes notions such as<br />
representativeness, distribution, diversity, sustainability, scarcity and uniqueness. Its<br />
value can be high, moderate or low.<br />
High:<br />
The component has an important role in the ecosystem, is of substantial<br />
interest in terms of biodiversity, and has extraordinary attributes on<br />
which there is a consensus among the scientific community with respect<br />
to conservation and/or protection.<br />
Moderate: The component is of strong interest and has recognized attributes for<br />
which conservation and protection are a concern, though there is no<br />
consensus.<br />
Low:<br />
The component's interest and attributes are not of much concern in<br />
terms of conservation and protection.<br />
Sociocultural and economic value<br />
An environmental component's sociocultural and economic value considers its<br />
importance to the local or regional population, interest groups, managers and<br />
specialists. Among other things, it expresses a public or political desire or will to<br />
conserve the integrity or original character of a component. It is considered:<br />
High:<br />
When the component is covered by legal or regulatory protection<br />
measures (endangered or vulnerable species, known wildlife habitats,<br />
conservation parks, etc.) or it provides ecoservices (such as a wetland<br />
that filters water), or is essential to human activities (potable water,<br />
listed archaeological sites).<br />
Moderate: When a component is a valued environmental component socially,<br />
economically or culturally, or it is used by a substantial portion of the<br />
population affected but not subject to legal protection.<br />
Low:<br />
When a component is rarely or never valued or used by the population.<br />
Canadian Royalties Inc.<br />
GENIVAR<br />
101-53046-02 November 2012<br />
194
Overall environmental value<br />
When a component's importance factors in its ecosystem value as well as its<br />
sociocultural and economic value, it is determined according to the stronger of the<br />
two values (table 8.1).<br />
Table 8.1<br />
Grid for evaluating the importance of components of the biological<br />
and human environments<br />
Sociocultural and economic value<br />
Ecosystem value<br />
High Moderate Low<br />
High High High High<br />
Moderate High Moderate Moderate<br />
Low High Moderate Low<br />
8.1.1.2 Degree of disturbance<br />
The degree of disturbance measures the magnitude of negative changes made to<br />
the structural and functional attributes of the component affected by the project.<br />
Three levels of disturbance are used to characterize the changes:<br />
High:<br />
When the intervention leads to the loss or modification of all or the key<br />
attributes specific to the affected component so that there is a risk that it<br />
will lose its integrity.<br />
Moderate: When the intervention leads to the loss or modification of some<br />
attributes specific to the affected component which could diminish its<br />
attributes without necessarily compromising its integrity.<br />
Low:<br />
When the intervention does not significantly modify the attributes<br />
specific to the affected component so that it will retain its integrity<br />
without too much erosion of its attributes.<br />
8.1.1.3 Intensity<br />
Associating environmental value with the degree of disturbance yields the first<br />
parameter used in assessing an impact's importance, intensity. Intensity ranges<br />
from high to low, based on the valuation grid in table 8.2.<br />
Table 8.2<br />
Grid for assessing an impact's intensity<br />
Degree of disturbance<br />
Environmental value<br />
High Moderate Low<br />
High High Moderate Moderate<br />
Moderate High Moderate Low<br />
Low Moderate Low Low<br />
Canadian Royalties Inc.<br />
GENIVAR<br />
101-53046-02 November 2012<br />
195
8.1.2 Duration/intensity association<br />
The second step in establishing an impact's importance involves associating the<br />
impact's duration with its intensity, to create a duration/intensity index.<br />
8.1.2.1 Duration of the effect<br />
Duration specifies the effect's time aspect. It describes, in relative terms, the period<br />
of time over which the component affected will feel an intervention's repercussions.<br />
The terms "permanent", "temporary," and "momentary" are used to describe this<br />
time period.<br />
Permanent:<br />
Temporary:<br />
Momentary:<br />
The impact has consequences for the infrastructure's lifespan or the<br />
impacts are irreversible.<br />
The impact is felt during a project activity or, at most, during project<br />
execution.<br />
The effect dissipates promptly (that is, less than one week in this<br />
project's framework).<br />
8.1.2.2 Duration / intensity index<br />
Associating the effect's duration and previously identified intensity yields the second<br />
parameter used in assessing an impact's importance, the duration - intensity<br />
index. It ranges from high to low, based on the valuation grid in table 8.3.<br />
Table 8.3<br />
Grid for assessing the duration - intensity index<br />
Duration<br />
Intensity<br />
High Moderate Low<br />
Permanent: High High Moderate<br />
Temporary High Moderate Low<br />
Ephemeral Moderate Low Low<br />
8.1.3 Magnitude of the effect<br />
The third and final step in establishing an effect's magnitude involves association the<br />
effect's extent with the duration/intensity index.<br />
Canadian Royalties Inc.<br />
GENIVAR<br />
101-53046-02 November 2012<br />
196
8.1.3.1 Extent of the effect<br />
Extent characterizes the spatial aspect of the effect generated by an intervention in<br />
the environment. It refers to the distance or area over which the disturbance will be<br />
felt. The terms "regional," "local" and "point" are used to characterize extent:<br />
Regional:<br />
Local:<br />
Point:<br />
The extent is regional when the intervention has repercussions for<br />
one or more environmental components located at a substantial<br />
distance from the project, or when the intervention affects the<br />
"regional" environment.<br />
The extent is local when the intervention affects a relatively limited<br />
area or a number of similar components located close to the<br />
project, or when a "local" environment is affected.<br />
The extent is characterized as a "point" extent when the<br />
intervention only affects an environmental component located close<br />
to the project, or when the disturbance is felt in a limited, welldefined<br />
area on the project site or neighbouring sector.<br />
8.1.3.2 Extent/duration/intensity relationship<br />
Associating the effect's extent with the duration/intensity index established previously<br />
pinpoints the significance of the environmental effect. It is characterized as "major",<br />
"moderate" or "minor":<br />
Major:<br />
Moderate:<br />
Major significance means the effect is permanent and affects the<br />
component's integrity, diversity and sustainability. Such an effect<br />
markedly or irreversibly alters the quality of the environment.<br />
Moderate significance involves material repercussions for the<br />
component affected, leading to a partial alteration of its nature and<br />
use, without jeopardizing its survival.<br />
Minor: Minor significance involves limited repercussions for the<br />
component affected, leading to a minor alteration of its nature and<br />
use.<br />
The significance of the effect is established using the valuation grid shown in<br />
table 8.4.<br />
Canadian Royalties Inc.<br />
GENIVAR<br />
101-53046-02 November 2012<br />
197
Table 8.4 Grid for assessing the effect's significance<br />
Extent<br />
Duration - intensity index<br />
High Moderate Low<br />
Regional Major Major Moderate<br />
Local Moderate Moderate Minor<br />
Point Moderate Minor Minor<br />
8.1.4 Mitigation measures and residual environmental effects<br />
Once the environmental effects have been identified and valued, mitigation<br />
measures are identified to reduce the significance of the effects. The measures are<br />
intended to mitigate or correct negative effects to provide for better integration of the<br />
project into the environment.<br />
Using mitigation measures then makes it possible to reassess the environmental<br />
effects, which then become residual environmental effects, that is, the effect that<br />
persists after mitigation measures have been applied. The two types of residual<br />
effects that may persist subsequent to the use of mitigation measures are<br />
characterized as "major" and "minor."<br />
Minor residual effect:<br />
Major residual effect:<br />
Means that the residual effect is deemed to have<br />
moderate to minor significance, based on the grid<br />
in table 8.4.<br />
Means that despite the use of mitigation measures,<br />
the residual effect is still substantial according to<br />
the grid in table 8.4.<br />
8.2 Analysis of environmental effects<br />
The assessment of environmental effects is presented in three parts. The first part<br />
covers the permanent port infrastructures and the second covers the deposit of land<br />
sediment. The effects of the temporary port infrastructures are not assessed<br />
separately, since their construction and operation will have the same effects as those<br />
caused by the permanent infrastructures. A third part presents a summary of the<br />
project’s effects on two high-value environmental components (issues)—marine<br />
mammals and land use by the Inuit for traditional purposes.<br />
The potential environmental effects are identified using a matrix showing the<br />
relationship between the project components of the construction and operation<br />
phases (impact sources) and the environmental components. Two series of data<br />
Canadian Royalties Inc.<br />
GENIVAR<br />
101-53046-02 November 2012<br />
198
sheets, one for port infrastructures (temporary and permanent) and one for the<br />
dumping of land sediment, present the analysis of each potential environmental<br />
effect. For certain project components, a single data sheet for the construction and<br />
operation phases is presented, since the potential effects are the same.<br />
The modification phase (work that would include, for example, the addition of a cell<br />
or enlargement of a structure) is not covered by a separate assessment. The same<br />
effects as those expected in the construction phase are likely to occur, since the<br />
same activities and work are likely to be performed.<br />
Lastly, the project will have positive effects on several socioeconomic components of<br />
the setting. No significance has been attributed to these effects, but they are<br />
nonetheless described in the data sheets.<br />
The assessment data sheets include:<br />
• the ecosystemic, sociocultural and economic values;<br />
• a justification of the ecosystemic, sociocultural and economic values accorded to<br />
each environmental component (if applicable);<br />
• the source(s) of the potential effects;<br />
• a brief description of the potential effects;<br />
• the determination of the significance environmental effect according to the<br />
method presented in section 8.1, before the application of attenuation measures;<br />
• the proposed attenuation measures for reducing the significance of the effects.<br />
These measures will be monitored to ensure their implementation. A list of<br />
standard attenuation measures for the work and regular activities is presented in<br />
Appendix 21.<br />
• if required, explanatory or justification notes to support assessment of the effects;<br />
• the significance of the residual effect;<br />
• the follow-up, if deemed relevant to do so.<br />
Canadian Royalties Inc.<br />
GENIVAR<br />
101-53046-02 November 2012<br />
199
The structure of the data sheets is presented below. Their numbering is entered in<br />
the interaction matrices.<br />
Environmental component:<br />
Ecosystemic value:<br />
Sociocultural and economic values:<br />
Source(s) of the effect<br />
Phase(s):<br />
Activity(ies):<br />
Description of the potential effects<br />
Degree of disturbance: Intensity of the effect: Duration of the effect:<br />
Duration-intensity index: Scope of the effect:<br />
Significance of the effect:<br />
Attenuation measures/Monitoring<br />
Notes<br />
Follow-up<br />
Significance of the residual effect:<br />
8.2.1 Port infrastructures<br />
In the construction phase, the sources of the effects include dredging and the<br />
following activities: pile and sheet-pile driving by vibro-driving and piling, placement<br />
of cell protection ballast and placement of various dock structures (access ramps,<br />
barges, etc.). No blasting is required.<br />
In the operation phase, the sources of the effects include the transshipment of ore<br />
concentrate from the concentrate hall to the ore carriers and movement of the latter<br />
within Deception Bay. Navigation also includes the movement of supply ships<br />
carrying materials and petroleum products. Aside from a visual inspection of the<br />
infrastructures, no major maintenance work (such as dredging) likely to cause<br />
significant environmental effects is foreseen.<br />
Canadian Royalties Inc.<br />
GENIVAR<br />
101-53046-02 November 2012<br />
200
The sources of the effects for the construction and operation of the temporary port<br />
infrastructures are limited to pile driving, the use of heavy machinery, ore<br />
transshipment and navigation.<br />
Table 8.5 shows the relationship between the potential effects of the port<br />
infrastructures and those of the environment. The assessment data sheets can be<br />
found on the following pages.<br />
Canadian Royalties Inc.<br />
GENIVAR<br />
101-53046-02 November 2012<br />
201
Table 8.5 Identification of potential effects matrix - Temporary and permanent port infrastructures<br />
Nature of potential impacts<br />
PI-x / B Negative impact<br />
PI-x / ■ Positive impact<br />
Sources of potential effects<br />
Implementation phases<br />
Construction Operation Modification*<br />
Decommissioning<br />
and closure<br />
Environmental components<br />
Biological setting<br />
Physical setting<br />
Dredging<br />
Activities related to the<br />
construction of the port<br />
infrastructures*<br />
Ore transshipment<br />
Navigation<br />
<strong>Main</strong>tenance<br />
Sediment stability and bathymetry PI-1 - - - - PI-1<br />
Hydraulic and sedimentological conditions - PI-2 - - - PI-2<br />
Sediment quality PI-3 PI-3 - - PI-3<br />
Surface water quality PI-4 PI-4 - - PI-4<br />
Air quality PI-5 PI-5 - PI-5 B/J<br />
Ice regime See components 14 and 15 of the human setting<br />
Marine plankton community PI-6 - - -<br />
-<br />
PI-6<br />
Marine invertebrates PI-7 - - - - PI-7 J<br />
-<br />
Aquatic vegetation PI-8 - - -<br />
PI-8<br />
Marine piscifauna and fish habitat PI-9 - - - PI-9 J<br />
Marine mammals<br />
-<br />
-<br />
Species of fauna with special status PI-10<br />
- PI-19<br />
-<br />
PI-10<br />
Avian fauna (wildfowl) PI-11 - - - PI-11
Table 8.5 Identification of potential effects matrix - Temporary and permanent port infrastructures (cont.)<br />
Nature of potential impacts<br />
Sources of potential effects<br />
PI-x / B Negative impact<br />
Implementation phases<br />
PI-x / ■ Positive impact<br />
Decommissioning<br />
Construction Operation Modification**<br />
and closure<br />
Environmental components<br />
Human setting<br />
Dredging<br />
Activities related to the<br />
construction of the port<br />
infrastructures**<br />
Ore transshipment<br />
Navigation<br />
<strong>Main</strong>tenance<br />
Ambient noise PI-12 PI-12 - - PI-12 B/J<br />
Economy PI-13 PI-13 - - PI-13<br />
Jobs PI-14 PI-14 - - PI-14<br />
Health PI-15 PI-15 - J<br />
- PI-15<br />
Land for use by the Inuit for traditional<br />
PI-16 - PI-20 - PI-16 J<br />
purposes<br />
Navigation PI-17 - PI-21 - PI-17 J<br />
Landscape PI-18 -<br />
* Including the temporary dock. These activities are mainly pile and sheet-pile driving, the assembly of various structures and the placement of cell protection ballast.<br />
** According to the type of modifications. The same impacts as those expected in the construction phase are likely to occur in the modification phase, since the same<br />
activities and work are likely to be performed.
Data sheet PI-1<br />
Environmental component<br />
Sediment stability and bathymetry<br />
Ecosystemic value: Average<br />
The stability of the seabed permits the long-term development of a diversified flora and fauna<br />
(Gray and Elliott, 2009).<br />
Sociocultural and economic value: N/A<br />
Sources of the effect<br />
Phases: Construction/Modification<br />
Activity: Dredging<br />
Description of the potential effects<br />
• Risk of slippage of undersea sediment if the excavation slopes are unsuitable.<br />
• Modification of the bathymetric profile<br />
Degree of disturbance: High Intensity of the effect: Average Duration of the effect:<br />
Permanent<br />
Duration-intensity index: High Scope of the effect: Occasional<br />
Significance of the effect: Average<br />
Attenuation measures/Monitoring<br />
• Ensure that the excavation slopes in the dredging area are 3H:1V to ensure the stability of<br />
adjoining sediment.<br />
• Restrict the dredging area to a minimum.<br />
• Use the grab positioning system in real time to avoid over-dredging.<br />
• Ensure the bathymetric measurements are achieved.<br />
• Conduct a bathymetry of the dredged area after the dredging to confirm that the slopes<br />
respect the design plans and drawings.<br />
Notes<br />
Significance of the residual effect: Not significant<br />
Follow-up<br />
A follow-up is not necessary.<br />
Canadian Royalties Inc.<br />
GENIVAR<br />
101-53046-02 November 2012<br />
204
Data sheet PI-2<br />
Environmental component<br />
Hydraulic and sedimentological conditions<br />
Ecosystemic value: Large<br />
The hydraulic and sedimentological conditions encompass various parameters designating<br />
the flow characteristics (water depth, flow speed, etc.) and sediment movement in the<br />
intervention area. They create a balance between coastal erosion and sedimentary deposit<br />
that prevents this erosion (Herbich, 1992; Bray et al., 1997; Bray, 2008).<br />
Sociocultural and economic value: N/A<br />
Sources of the effect<br />
Phases: Construction/Modification<br />
Activity: Work related to the construction of the port infrastructures<br />
Description of the potential effects<br />
• Modification of the natural sedimentary dynamic on the coast (Bray et al., 1997).<br />
Degree of disturbance: Low Intensity of the effect: Average Duration of the effect:<br />
Permanent<br />
Duration-intensity index: Scope of the effect: Occasional<br />
High<br />
Significance of the effect: Average<br />
Attenuation measures/Monitoring<br />
• None<br />
Notes<br />
• The design of the port infrastructures was completed while keeping to a minimum the<br />
submerged structures that could alter flow patterns and the sedimentary dynamic. This<br />
design allows free passage of water along the shore.<br />
• The natural sedimentary deposit is low in comparison to the size of Deception Bay, which<br />
means there is very little matter in suspension.<br />
• In a similar manner to Deception Bay overall, site Q1 is not a setting that has significant<br />
sedimentary movement. The sedimentation rate is estimated at ± 3 mm/year (GENIVAR,<br />
2012a).<br />
Significance of the residual effect: Not significant<br />
Follow-up<br />
A follow-up is not necessary.<br />
Canadian Royalties Inc.<br />
GENIVAR<br />
101-53046-02 November 2012<br />
205
Data sheet PI-3<br />
Environmental component<br />
Sediment quality<br />
Ecosystemic value: Large<br />
Permits the development of a diversified flora and fauna (Gray and Elliott, 2009).<br />
Sociocultural and economic value: N/A<br />
Sources of the effect<br />
Phases: Construction/Operation/Modification<br />
Activities: Dredging/Work related to the construction of the port infrastructures/Ore<br />
transshipment<br />
Description of the potential effects<br />
• Risk of sediment contamination from:<br />
o An accidental leak or spill of oil or other contaminants from heavy machinery or<br />
construction equipment;<br />
o A loss of ore during its transshipment from the concentrate hall to the carrier.<br />
Degree of disturbance: Low Intensity of the effect: Average Duration of the effect:<br />
Temporary<br />
Duration-intensity index: Scope of the effect: Occasional<br />
Average<br />
Significance of the effect: Minor<br />
Attenuation measures/Monitoring<br />
• Standard measures 1 to 9.<br />
Notes<br />
• The ore conveyors will be installed inside enclosed structures.<br />
Follow-up<br />
A follow-up is not necessary.<br />
Significance of the residual effect: Not significant<br />
Canadian Royalties Inc.<br />
GENIVAR<br />
101-53046-02 November 2012<br />
206
Data sheet PI-4<br />
Environmental component<br />
Surface water quality<br />
Ecosystemic value: Large<br />
Assure optimal conditions for the development of marine flora and fauna (Gray and Elliott,<br />
2009).<br />
Sociocultural and economic value: N/A<br />
Sources of the effect<br />
Phases: Construction/Operation/Modification<br />
Activities: Dredging/Work related to the construction of the port infrastructures/Ore<br />
transshipment<br />
Description of the potential effects<br />
• Increase in SS (suspended solids) concentrations during dredging of the work site and<br />
formation of a dispersion plume. The SS concentrations close to the work area and on the<br />
opposite shore could reach values above 100 mg/L, or even 300 mg/L.<br />
• Depending on the weather conditions (wind strength and direction), the SS concentrations<br />
could increase in other sectors of Deception Bay.<br />
• Risk of water contamination from an accidental leak or spill of oil or other contaminants from<br />
the machinery used for the site work.<br />
• Risk of water contamination from a loss of ore during its transshipment from the concentrate<br />
hall to the carrier.<br />
• The air bubble system used to break up the ice could stir up contaminated sediments into<br />
suspension.<br />
• The ship maneuvers could stir up contaminated sediment into suspension.<br />
Degree of disturbance: High Intensity of the effect: High Duration of the effect:<br />
Temporary<br />
Duration-intensity index: High Scope of the effect: Local<br />
Significance of the effect: Average<br />
Attenuation measures/Monitoring<br />
The renewed suspension and dispersion of dredged sediment can be substantially curtailed by<br />
closely managing the work, the type of equipment used and the operational behaviours; the<br />
following measures are recommended:<br />
Work management<br />
• Restrict the dredging area to a minimum.<br />
• Use a grab positioning system in real time to avoid over-dredging.<br />
• Halt the dredging work during periods of bad weather (e.g. storms, strong winds).<br />
Canadian Royalties Inc.<br />
GENIVAR<br />
101-53046-02 November 2012<br />
207
Equipment<br />
• Use an environmental clamshell dredge which is more watertight than conventional models.<br />
• Only use one dredge at a time.<br />
Operational behaviours<br />
• Maneuver the sediment carefully so that it remains as cohesive as possible.<br />
• The clamshell raising and lowering speed must be slow and controlled.<br />
• The dredge operators must be made aware of the importance of paying special attention to<br />
the maneuvers, especially avoiding abrupt movements or when leveling the seabed with a<br />
dredge or a power shovel.<br />
• Check the clamshell watertightness throughout the operations.<br />
• Check the barge compartment watertightness throughout the operations.<br />
• Do not overload the barge or use it during harsh weather conditions.<br />
• Limit the speed of the dredge and the barge in shallow water.<br />
• Do not overload the embankment or the area close to shore so as to reduce the risk of land<br />
slip or sediment stripping.<br />
• Standard measures 1 to 9.<br />
Notes<br />
• The ore conveyors will be installed inside enclosed structures.<br />
• Dust extractors will be installed at all transfer points on the conveyor system.<br />
• The transshipped ore is wet.<br />
• None of the physical-chemical analyses conducted on sediments since 2006 show any<br />
contamination (hydrocarbons, heavy metals, PCBs, PAHs, asbestos).<br />
Significance of the residual effect: Not significant<br />
Follow-up<br />
• Monitoring of SS concentrations will be conducted during the dredging work and for some<br />
time after the work in order to check the behaviour of the dispersion plume (Section 9).<br />
Canadian Royalties Inc.<br />
GENIVAR<br />
101-53046-02 November 2012<br />
208
Data sheet PI-5<br />
Environmental component<br />
Air quality<br />
Ecosystemic value: N/A<br />
Sociocultural and economic value: Large<br />
Air quality is an element deemed to be important since the work will be conducted in a natural<br />
setting relatively undisturbed by human activity.<br />
Sources of the effect<br />
Phases: Construction/Operation/Modification<br />
Activities: Dredging/Work related to the construction of the port infrastructures/Ore<br />
transshipment<br />
Description of the potential effects<br />
• Emission of atmospheric pollutants and dust from the movement of trucks, the operation of<br />
heavy machinery, construction equipment and power generator sets.<br />
• Risk of dust emissions when transshipping the ore.<br />
Degree of disturbance: High Intensity of the effect: High Duration of the effect:<br />
Temporary<br />
Duration-intensity index: Scope of the effect: Occasional<br />
High<br />
Significance of the effect: Average<br />
Attenuation measures/Monitoring<br />
• Standard measures 12 to 17.<br />
• Use of Arctic diesel.<br />
Notes<br />
• The ore conveyors will be installed inside enclosed structures.<br />
• Dust extractors will be installed at all transfer points on the conveyor system.<br />
• The transshipped ore is wet.<br />
Significance of the residual effect: Not significant<br />
Follow-up<br />
A follow-up is not necessary.<br />
Canadian Royalties Inc.<br />
GENIVAR<br />
101-53046-02 November 2012<br />
209
Data sheet PI-6<br />
Environmental component<br />
Marine plankton community<br />
Ecosystemic value: Large<br />
Base of the marine trophic chain.<br />
Sociocultural and economic value: Average<br />
Sociocultural and economic: Limited interest and not used by the population (GENIVAR,<br />
2007). According to Kumar (2010), the nutrients cycle in a coastal ecosystem where the<br />
marine phytoplankton renders an ecological service to humankind is evaluated at between<br />
$170 and $30,451/ha/year.<br />
Sources of the effect<br />
Phases: Construction/Modification<br />
Activity: Dredging<br />
Description of the potential effects<br />
• The increase in SS concentrations generated by the dredging activities risks affecting<br />
certain biological functions of the zooplankton in the immediate area of the work and within<br />
the dispersion plume.<br />
• A large volume of sediment stirred up into suspension could disturb filter feeding organisms<br />
(Morton, 1977).<br />
Degree of disturbance: High Intensity of the effect: High Duration of the effect:<br />
Temporary<br />
Duration-intensity index: High Scope of the effect: Local<br />
Significance of the effect: Average<br />
Attenuation measures/Monitoring<br />
The renewed suspension and dispersion of dredged sediment can be substantially curtailed by<br />
closely managing the work, the type of equipment used and the operational behaviours; the<br />
following measures are recommended:<br />
Work management<br />
• Restrict the dredging area to a minimum.<br />
• Use a grab positioning system in real time to avoid over-dredging.<br />
• Halt the dredging work during periods of bad weather (e.g. storms, strong winds).<br />
Equipment<br />
• Use an environmental clamshell dredge which is more watertight than conventional models.<br />
• Only use one dredge at a time.<br />
Canadian Royalties Inc.<br />
GENIVAR<br />
101-53046-02 November 2012<br />
210
Operational behaviours<br />
• Maneuver the sediment carefully so that it remains as cohesive as possible.<br />
• The clamshell raising and lowering speed must be slow and controlled.<br />
• The dredge operators must be made aware of the importance of paying special attention to<br />
the maneuvers, especially avoiding abrupt movements or when leveling the seabed with a<br />
dredge or a power shovel.<br />
• Check the clamshell watertightness throughout the operations.<br />
• Check the barge compartment watertightness throughout the operations.<br />
• Do not overload the barge or use it during harsh weather conditions.<br />
• Limit the speed of the dredge and the barge in shallow water.<br />
• Do not overload the embankment or the area close to shore so as to reduce the risk of land<br />
slip or sediment stripping.<br />
Notes<br />
Follow-up<br />
A follow-up is not necessary.<br />
Significance of the residual effect: Not significant<br />
Canadian Royalties Inc.<br />
GENIVAR<br />
101-53046-02 November 2012<br />
211
Data sheet PI-7<br />
Environmental component<br />
Marine invertebrates<br />
Ecosystemic value: Large<br />
Important elements in the marine trophic chain (Gray and Elliott, 2009).<br />
Sociocultural and economic value: Average<br />
Several species are harvested by the population (e.g. blue mussel) (GENIVAR, 2007b).<br />
Source of the effect<br />
Phases: Construction/Modification<br />
Activity: Dredging<br />
Description of the potential effects<br />
• The dredging work will destroy the benthic fauna in the dredged area over a surface area of<br />
9,350 m 2 , which corresponds to the surface area of two sheet pile cells and their stone<br />
ballast.<br />
• Burial of the benthic fauna in the sectors most affected by sedimentation, specifically in the<br />
immediate area of the work and along the coast of Deception Bay in the dispersion plume<br />
diffusion area.<br />
• The suspended matter, from the stirring up of significant volumes of sediment, has a lower<br />
food density than that observed in matter stirred up into suspension during natural<br />
phenomena (turbulence, storms). Saila et al. (1972) say that the low food density included<br />
in the matter stirred up into suspension affects the organisms depending on this food (filter<br />
feeders and detritus feeders).<br />
Degree of disturbance: High Intensity of the effect: High Duration of the effect:<br />
Temporary<br />
Duration-intensity index: Scope of the effect: Local<br />
High<br />
Significance of the effect: Average<br />
Attenuation measures/Monitoring<br />
The renewed suspension and dispersion of dredged sediment can be substantially curtailed by<br />
closely managing the work, the type of equipment used and the operational behaviours; the<br />
following measures are recommended:<br />
Work management<br />
• Restrict the dredging area to a minimum.<br />
• Use a grab positioning system in real time to avoid over-dredging.<br />
• Halt the dredging work during periods of bad weather (e.g. storms, strong winds).<br />
Canadian Royalties Inc.<br />
GENIVAR<br />
101-53046-02 November 2012<br />
212
Equipment<br />
• Use an environmental clamshell dredge which is more watertight than conventional models.<br />
• Only use one dredge at a time.<br />
Operational behaviours<br />
• Maneuver the sediment carefully so that it remains as cohesive as possible.<br />
• The clamshell raising and lowering speed must be slow and controlled.<br />
• The dredge operators must be made aware of the importance of paying special attention to<br />
the maneuvers, especially avoiding abrupt movements or when leveling the seabed with a<br />
dredge or a power shovel.<br />
• Check the clamshell watertightness throughout the operations.<br />
• Check the barge compartment watertightness throughout the operations.<br />
• Do not overload the barge or use it during harsh weather conditions.<br />
• Limit the speed of the dredge and the barge in shallow water.<br />
• Do not overload the embankment or the area close to shore so as to reduce the risk of land<br />
slip or sediment stripping.<br />
Notes<br />
• The cell protection stone ballast will be colonized by epibenthos. The species will differ from<br />
those found in the soft bottom in the Q1 sector, thereby helping create a broader diversity of<br />
aquatic habitat.<br />
Significance of the residual effect: Not significant<br />
Follow-ups (Section 9)<br />
• Monitoring of SS concentrations will be conducted during the dredging work and for some<br />
time after the work in order to check the behaviour of the dispersion plume.<br />
• A follow-up will be conducted of benthic habitats having been affected by the dispersion<br />
plume and sedimentation.<br />
• A follow-up will be conducted to check the colonization of epibenthos on the stone ballast.<br />
Canadian Royalties Inc.<br />
GENIVAR<br />
101-53046-02 November 2012<br />
213
Data sheet PI-8<br />
Environmental component<br />
Aquatic vegetation<br />
Ecosystemic value: Large<br />
The aquatic vegetation creates a heterogeneity and complexity of habitats conducive to<br />
benthic invertebrates and fish (shelter, growth and food) (Skilleter, 1994; Turner et al., 1999;<br />
Lindholm, 1999).<br />
Sociocultural and economic value: Average<br />
Ecological “nursery” service for benthic organisms and fish evaluated at between $77 and<br />
$164/ha/year (Kumar, 2010).<br />
Source of the effect<br />
Phases: Construction/Modification<br />
Activity: Dredging<br />
Description of the potential effects<br />
• Destruction of aquatic vegetation in the area to be dredged over a surface area of 9,350 m 2 .<br />
• Burial of the aquatic vegetation in the sectors most affected by sedimentation, specifically in<br />
the immediate area of the dredging work and along the coast of Deception Bay in the<br />
dispersion plume diffusion area.<br />
Degree of disturbance: High Intensity of the effect: High Duration of the effect:<br />
Temporary<br />
Duration-intensity index: Scope of the effect: Local<br />
High<br />
Significance of the effect: Average<br />
Canadian Royalties Inc.<br />
GENIVAR<br />
101-53046-02 November 2012<br />
214
Attenuation measures/Monitoring<br />
The renewed suspension and dispersion of dredged sediment can be substantially curtailed by<br />
closely managing the work, the type of equipment used and the operational behaviours; the<br />
following measures are recommended:<br />
Work management<br />
• Restrict the dredging area to a minimum.<br />
• Use a grab positioning system in real time to avoid over-dredging.<br />
• Halt the dredging work during periods of bad weather (e.g. storms, strong winds).<br />
Equipment<br />
• Use an environmental clamshell dredge which is more watertight than conventional models.<br />
• Only use one dredge at a time.<br />
Operational behaviours<br />
• Maneuver the sediment carefully so that it remains as cohesive as possible.<br />
• The clamshell raising and lowering speed must be slow and controlled.<br />
• The dredge operators must be made aware of the importance of paying special attention to<br />
the maneuvers, especially avoiding abrupt movements or when levelling the seabed with a<br />
dredge or a power shovel.<br />
• Check the clamshell watertightness throughout the operations.<br />
• Check the barge compartment watertightness throughout the operations.<br />
• Do not overload the barge or use it during harsh weather conditions.<br />
• Limit the speed of the dredge and the barge in shallow water.<br />
• Do not overload the embankment or the area close to shore so as to reduce the risk of land<br />
slip or sediment stripping.<br />
Notes<br />
• The cell protection stone ballast will be colonized by aquatic vegetation that needs a fixed<br />
substrate on which to grow. The species will differ from those found in the soft bottom,<br />
thereby helping create a broader diversity of aquatic habitat.<br />
Significance of the residual effect: Not significant<br />
Follow-ups (Section 9)<br />
• Monitoring of SS concentrations will be conducted during the dredging work and for some<br />
time after the work in order to check the behaviour of the dispersion plume.<br />
• A follow-up will be conducted of benthic habitats having been affected by the dispersion<br />
plume and sedimentation.<br />
• A follow-up will be conducted to check the colonization of aquatic vegetation on the<br />
protective stone ballast.<br />
Canadian Royalties Inc.<br />
GENIVAR<br />
101-53046-02 November 2012<br />
215
Data sheet PI-9<br />
Environmental component<br />
Piscifauna and fish habitat<br />
Ecosystemic value: Large<br />
Important element of the marine trophic chain.<br />
Sociocultural and economic values: Large<br />
The Inuit fish for several different species, which represent a major food source for the<br />
Nunavik communities. Fishing is an integral part of their way of life (GENIVAR, 2007b).<br />
According to Kumar (2010), the ecological service rendered by a coastal ecosystem in terms<br />
of providing food is evaluated at $7,549/ha/year.<br />
Sources of the effect<br />
Phase: Construction/Modification<br />
Activities: Dredging/Work related to the construction of the port infrastructures<br />
Description of the potential effects<br />
• The increase in SS concentrations generated by the dredging activities is likely to affect fish<br />
directly (blocking of gills, abrasion of membranes, effects on egg and larvae growth and<br />
survival, effects on the food regime, reproduction and migration) or indirectly through the<br />
deterioration of habitat (Rieussec, 2008).<br />
• Burial of the benthic habitat used by fish in the sectors most affected by sedimentation,<br />
specifically in the immediate area of the work and along the coast of Deception Bay in the<br />
dispersion plume diffusion area.<br />
• The noise caused by the work disturbs the fish and causes them to move away.<br />
• Destruction of fish habitat below the sheet-pile cells and in the portion of stone ballast in<br />
cell 2 to above the HHWMT level: surface area of 1,430 m 2 .<br />
Degree of disturbance: High Intensity of the effect: High Duration of the effect:<br />
Temporary/Permanent<br />
Duration-intensity index: Scope of the effect: Local<br />
High<br />
Significance of the effect: Average<br />
Attenuation measures/Monitoring<br />
The renewed suspension and dispersion of dredged sediment can be substantially curtailed by<br />
closely managing the work, the type of equipment used and the operational behaviours; the<br />
following measures are recommended:<br />
Work management<br />
• Restrict the dredging area to a minimum.<br />
• Use a grab positioning system in real time to avoid over-dredging.<br />
• Halt the dredging work during periods of bad weather (e.g. storms, strong winds).<br />
Canadian Royalties Inc.<br />
GENIVAR<br />
101-53046-02 November 2012<br />
216
Equipment<br />
• Use an environmental clamshell dredge which is more watertight than conventional models.<br />
• Only use one dredge at a time.<br />
Operational behaviours<br />
• Maneuver the sediment carefully so that it remains as cohesive as possible.<br />
• The clamshell raising and lowering speed must be slow and controlled.<br />
• The dredge operators must be made aware of the importance of paying special attention to<br />
the maneuvers, especially avoiding abrupt movements or when leveling the seabed with a<br />
dredge or a power shovel.<br />
• Check the clamshell watertightness throughout the operations.<br />
• Check the barge compartment watertightness throughout the operations.<br />
• Do not overload the barge or use it during harsh weather conditions.<br />
• Limit the speed of the dredge and the barge in shallow water.<br />
• Do not overload the embankment or the area close to shore so as to reduce the risk of land<br />
slip or sediment stripping.<br />
Notes<br />
• The dredging effects will be temporary.<br />
• The disturbance of fish biological functions will be temporary and limited to the period of<br />
work.<br />
• The fish are able to move away from the disturbed areas.<br />
• In general, fish can tolerate high SS concentrations (Rieussec, 2008) or avoid areas with<br />
high SS concentrations.<br />
• The design retained for the port infrastructures minimizes encroachment on the aquatic<br />
setting.<br />
• The loss of fish habitat by encroachment is permanent. A compensation project will be<br />
implemented that meets the requirements of Fisheries and Oceans Canada (Section 8.6).<br />
• The cell protective stone ballast will create new fish habitats (approximate surface area of<br />
9,260 m 2 ).<br />
Significance of the residual effect: Not significant<br />
Follow-up (Section 9)<br />
• A follow-up will be conducted to check the colonization of epibenthos on the protective<br />
stone ballast.<br />
Canadian Royalties Inc.<br />
GENIVAR<br />
101-53046-02 November 2012<br />
217
Data sheet PI-10<br />
Environmental components<br />
Marine mammals/Species with special status<br />
Ecosystemic value: Large<br />
Important element of the marine trophic chain. Some species have been designated as<br />
species at risk.<br />
Sociocultural and economic value: Large<br />
Numerous species of marine mammals represent a source of food and income source for the<br />
Inuit. Hunting is an integral part of their way of life (GENIVAR, 2007b). The ecological service<br />
rendered by a coastal ecosystem in terms of providing food is evaluated at $7,549/ha/year<br />
(Kumar, 2010).<br />
Sources of the effect<br />
Phases: Construction/Modification<br />
Activities: Dredging/Work related to the construction of the port infrastructures<br />
Description of the potential effects<br />
• Implementation of the work risks disturbing the marine mammals by undersea noise<br />
(Richardson et al., 1995; Ford, 1977 in Richardson et al., 1995; and Fraker, 1977 in<br />
Richardson et al., 1995). Several observers have noted that belugas reacted less to a<br />
stationary dredge than to the movement of barges for transporting sediment. However,<br />
DESSAU Inc. (2010b) mentions the presence of belugas at 20 m from the clamshell dredge<br />
in Rivière-du-Loup, which caused a complete halt of work for 30 minutes.<br />
• The sectorial report Caractérisation de l’environnement sonore sous-marin de la baie<br />
Déception [Characterization of the undersea noise environment in Deception Bay]<br />
(GENIVAR, 2012b) (Appendix 10) covers the effects of higher noise levels on marine<br />
mammals.<br />
• The increases in SS concentrations could disturb marine mammals.<br />
• There is a risk of collision between the dredge or barges and marine mammals.<br />
Degree of disturbance: High Intensity of the effect: High Duration of the effect:<br />
Temporary<br />
Duration-intensity index: Scope of the effect: Local<br />
High<br />
Significance of the effect: Average<br />
Attenuation measures/Monitoring<br />
Dredging<br />
• Ensure the mandatory presence of qualified marine mammal monitors on the shoreline<br />
during dredging work.<br />
• Commence monitoring at least 30 minutes before the start of work.<br />
Canadian Royalties Inc.<br />
GENIVAR<br />
101-53046-02 November 2012<br />
218
• Stop the dredging work if there are belugas or other marine mammals present within 400 m<br />
of the dredge.<br />
A monitoring report will be produced.<br />
Pile and sheet-pile driving<br />
The following approach is proposed for performing the work independently of conditions<br />
conducive to traditional visual monitoring: The work would only be halted during a period when<br />
marine mammals or, if applicable, any other animal deemed sensitive, is actually found within a<br />
security perimeter of 1,200 m;<br />
• Schedule the noisiest work for after July 15, i.e. during the period when the belugas’<br />
essential biological activities are lower;<br />
• Start monitoring for cetaceans at least 30 minutes before the start of blasting work or piledriving;<br />
• Start the pile-driving operations gradually over a period of 20-30 minutes to enable any<br />
cetaceans present to move away from the source of the noise;<br />
• Implement a passive program to monitor for the presence of marine mammals that listens<br />
for their sounds using hydrophones or electronic detection using sonar;<br />
• Implement an intensive visual monitoring program from the start of work until a general<br />
balance can be established between passive observations (acoustic or sonar) and active<br />
observations (visual), which will facilitate subsequent identification of organisms observed<br />
passively; then, the visual monitoring equipment would only be used to confirm “ambiguous”<br />
passive observations;<br />
• Implement, from the start of work, an acoustic monitoring program for noise emitted by the<br />
site activities, in order to define in real time the security perimeter (threshold of 160 dB re<br />
1 µParms), modulate the functioning of site equipment and thus limit the emission of<br />
potentially disturbing noise, and assess the actual need to use additional attenuation<br />
measures (bubble screen, Styrofoam sheathing, etc.).<br />
A monitoring report will be produced.<br />
Notes<br />
Follow-up<br />
• A follow-up is not necessary.<br />
Significance of the residual effect: Not significant<br />
Canadian Royalties Inc.<br />
GENIVAR<br />
101-53046-02 November 2012<br />
219
Environmental component<br />
Avian fauna (wildfowl)<br />
Data sheet PI-11<br />
Ecosystemic value: Average<br />
Wildfowl play a role in the Arctic trophic chain.<br />
Sociocultural and economic value: Large<br />
Wildfowl represent a food source for the Inuit. Hunting is an integral part of their way of life.<br />
The ecological service rendered by a coastal ecosystem in terms of providing food is<br />
evaluated at $7,549/ha/year (Kumar, 2010).<br />
Sources of the effect<br />
Phase: Construction/Modification<br />
Activities: Dredging/Work related to the construction of the port infrastructures<br />
Description of the potential effects<br />
• The noise generated by the construction equipment (e.g. the dredge) may constitute a<br />
source of disturbance for avian fauna.<br />
Degree of disturbance: Low Intensity of the effect: Average Duration of the effect:<br />
Temporary<br />
Duration-intensity index: Scope of the effect: Occasional<br />
Average<br />
Significance of the effect: Minor<br />
Attenuation measures/Monitoring<br />
• None<br />
Notes<br />
• In general, seabirds seem to very quickly become accustomed to the presence of<br />
equipment, their comings and goings, and the noise caused by machinery (Environment<br />
Canada, 1994).<br />
Significance of the residual effect: Not significant<br />
Follow-up<br />
• A follow-up is not necessary.<br />
Canadian Royalties Inc.<br />
GENIVAR<br />
101-53046-02 November 2012<br />
220
Data sheet PI-12<br />
Environmental component<br />
Ambient noise<br />
Ecosystemic value: N/A<br />
Sociocultural and economic value: Large<br />
Ambient noise includes all noise generated by human activity taking place in Deception Bay.<br />
The natural aspect of Deception Bay is sensitive to the noise level (large northern space).<br />
Sources of the effect<br />
Phases: Construction/Operation/Modification<br />
Activities: Dredging/Work related to the construction of the port infrastructures/Ore<br />
transshipment<br />
Description of the potential effects<br />
• Increase in noise levels on the periphery of the worksite associated with the operation of<br />
heavy machinery, construction equipment, the conveyor system and generator sets, which<br />
will add to ambient noise levels.<br />
Degree of disturbance: Intensity of the effect: High Duration of the effect:<br />
Average<br />
Temporary<br />
Duration-intensity index: Scope of the effect: Local<br />
High<br />
Significance of the effect: Average<br />
Attenuation measures/Monitoring<br />
• The machinery and equipment will be subject to regular scheduled inspections to ensure<br />
that the exhaust systems are in good condition, so as to limit noise emissions.<br />
• The movement of machinery will be restricted to the work areas.<br />
• When possible, the main noise sources will be insulated with sound absorbent material.<br />
• All workers subjected to long periods of noise exceeding 85 dB(A) will be obliged to wear<br />
hearing protective equipment (provided) at all times.<br />
Notes<br />
• The generator sets are installed in soundproof containers. The noise emissions will meet<br />
the current standard of 70 dB.<br />
Follow-up<br />
• A follow-up is not necessary.<br />
Significance of the residual effect: Not significant<br />
Canadian Royalties Inc.<br />
GENIVAR<br />
101-53046-02 November 2012<br />
221
Data sheet PI-13<br />
Environmental component<br />
Economy<br />
Ecosystemic value: N/A<br />
Sociocultural and economic value: Large<br />
Sources of the effect<br />
Phases: Construction/Modification<br />
Activities: Dredging/Work related to the construction of the port infrastructures<br />
Description of the potential effects<br />
• Overall, the port infrastructure layout project is likely to have positive economic spinoffs for<br />
the Inuit communities through the awarding of contracts to Inuit companies.<br />
Degree of disturbance: N/A Intensity of the effect: N/A Duration of the effect: N/A<br />
Duration-intensity index: N/A Scope of the effect: N/A<br />
Significance of the effect: N/A<br />
Attenuation measures/Monitoring<br />
N/A<br />
Notes<br />
• Section 6 of the Nunavik Nickel agreement sets out a framework for the awarding of<br />
contracts to Inuit companies working in various fields (transportation, construction, goods<br />
and services, etc.). Construction of the port infrastructures is a component of the NNIP<br />
included in the agreement.<br />
Significance of the residual effect: N/A<br />
Follow-up<br />
• A follow-up is not necessary.<br />
Canadian Royalties Inc.<br />
GENIVAR<br />
101-53046-02 November 2012<br />
222
Data sheet PI-14<br />
Environmental component<br />
Jobs<br />
Ecosystemic value: N/A<br />
Sociocultural and economic value: Large<br />
Sources of the effect<br />
Phases: Construction/Modification<br />
Activities: Dredging/Work related to the construction of the port infrastructures<br />
Description of the potential effects<br />
• Overall, the port infrastructure layout project is likely to create job opportunities for the<br />
neighbouring communities (Salluit, Kangiqsujuaq and Puvirnituq) and for the Nunavik Inuit<br />
in general.<br />
Degree of disturbance: N/A Intensity of the effect: N/A Duration of the effect: N/A<br />
Duration-intensity index: N/A Scope of the effect: N/A<br />
Significance of the effect: N/A<br />
Attenuation measures/Monitoring<br />
N/A<br />
Notes<br />
• Section 5 of the Nunavik Nickel agreement sets out a framework aimed at promoting CRI<br />
hiring of Inuit employees for implementation of the NNIP. The agreement also stipulates the<br />
establishment of training programs to improve Inuit employability, in cooperation with the<br />
Kativik regional administration and the Kativik school board.<br />
• A program will be set up to orient and inform the Inuit about job possibilities in the mining<br />
industry and for the NNIP.<br />
• During the operation phase, at least five Inuit hired as permanent employees will participate<br />
in a training program.<br />
• The awarding of contracts to Inuit companies will generate jobs.<br />
Significance of the residual effect: N/A<br />
Follow-up<br />
• A follow-up is not necessary.<br />
Canadian Royalties Inc.<br />
GENIVAR<br />
101-53046-02 November 2012<br />
223
Data sheet PI-15<br />
Environmental component<br />
Health<br />
Ecosystemic value: N/A<br />
Sociocultural and economic value: Large<br />
The health and safety of workers and users of the Deception Bay highway is important. Every<br />
accident generates costs in materials, intervention time and healthcare.<br />
Sources of the effect<br />
Phases: Construction/Operation/Modification<br />
Activities: Dredging/Work related to the construction of the port infrastructures/Ore<br />
transshipment<br />
Description of the potential effects<br />
• Risk of accidents involving workers.<br />
• Risk of road collisions.<br />
Degree of disturbance: Low Intensity of the effect: Average Duration of the effect:<br />
Temporary<br />
Duration-intensity index: Scope of the effect: Occasional<br />
Average<br />
Significance of the effect: Minor<br />
Attenuation measures/Monitoring<br />
• CRI will implement the occupational health and safety program.<br />
• The workers will receive awareness-raising and training sessions regarding health and<br />
safety at work.<br />
• Suitable highway signage will be erected before the start of the construction work to inform<br />
other road users of the increased presence of trucks.<br />
• Driving speeds will be limited.<br />
• The vehicles and construction equipment will be subject to regular scheduled inspections to<br />
ensure they are in good working order.<br />
Notes<br />
• Every new worker will receive training on the health and safety procedures upon arrival at<br />
the work camp. A personal meeting with the nursing staff is mandatory to fill out the<br />
worker’s “health form.”<br />
Significance of the residual effect: Not significant<br />
Follow-up<br />
• A follow-up is not necessary.<br />
Canadian Royalties Inc.<br />
GENIVAR<br />
101-53046-02 November 2012<br />
224
Data sheet PI-16<br />
Environmental component<br />
Land use by the Inuit for traditional purposes<br />
Ecosystemic value: N/A<br />
Sociocultural and economic value: Large<br />
Exploitation of the flora and fauna is a crucial activity for the Inuit population and Deception<br />
Bay is an essential subsistence area for the Salluit Inuit (ARK, 1998). The communities’ way<br />
of life, culture and economy are focused on hunting, fishing and trapping. From an economic<br />
viewpoint, the products from exploiting the flora and fauna help meet the communities' needs.<br />
Sources of the effect<br />
Phase: Construction<br />
Activities: Dredging/Work related to the construction of the port infrastructures<br />
Description of the potential effects<br />
• Possible disruption of the Inuit’s flora and fauna exploitation activities.<br />
• Loss of subsistence areas.<br />
Degree of disturbance: Intensity of the effect: High Duration of the effect:<br />
Average<br />
Temporary<br />
Duration-intensity index: Scope of the effect: Occasional<br />
High<br />
Significance of the effect: Average<br />
Attenuation measures/Monitoring<br />
• To minimize disruption in their traditional activities, the Inuit will be informed of the<br />
implementation and period of work.<br />
Notes<br />
• The sector affected by the port infrastructures is small in size and not intensively exploited<br />
by the Inuit.<br />
• The design retained minimizes encroachment on the aquatic setting and the consequences<br />
on aquatic resources.<br />
Significance of the residual effect: Not significant<br />
Follow-up<br />
• A follow-up is not necessary.<br />
Canadian Royalties Inc.<br />
GENIVAR<br />
101-53046-02 November 2012<br />
225
Data sheet PI-17<br />
Environmental component<br />
Navigation<br />
Ecosystemic value: N/A<br />
Sociocultural and economic value: Large<br />
Commercial shipping is a very important factor in remote areas, especially for the provision of<br />
equipment, healthcare and sea rescue operations. Deception Bay is a hub for the movement<br />
of ore from mines currently being worked in the region. The Inuit use the Bay to move<br />
around, and to exploit its fauna resources.<br />
Sources of the effect<br />
Phases: Construction/Modification<br />
Activities: Dredging/Navigation<br />
Description of the potential effects<br />
• Risk of accident (collisions) at the port infrastructure site due to the presence of the dredge<br />
and barges.<br />
Degree of disturbance: Low Intensity of the effect: Average Duration of the effect:<br />
Temporary<br />
Duration-intensity index: Scope of the effect: Occasional<br />
Average<br />
Significance of the effect: Minor<br />
Attenuation measures/Monitoring<br />
• Notify shipping and users of Deception Bay of the port infrastructure construction schedule.<br />
• <strong>Main</strong>tain a shipping exclusion zone of 500 m around the work sector.<br />
Notes<br />
Follow-up<br />
• A follow-up is not necessary.<br />
Significance of the residual effect: Not significant<br />
Canadian Royalties Inc.<br />
GENIVAR<br />
101-53046-02 November 2012<br />
226
Data sheet PI-18<br />
Environmental component<br />
Landscape<br />
Ecosystemic value: N/A<br />
Sociocultural and economic value: Large<br />
Sources of the effect<br />
Phases: Construction/Operation<br />
Activities: N/A<br />
Description of the potential effects<br />
• The presence of port infrastructures alters the landscape of Deception Bay.<br />
Degree of disturbance: Intensity of the effect: High Duration of the effect:<br />
Average<br />
Permanent<br />
Duration-intensity index: Scope of the effect: Occasional<br />
High<br />
Significance of the effect: Average<br />
Attenuation measures/Monitoring<br />
• Respect the natural topography of the landscape by not dumping materials outside the<br />
industrial sector.<br />
Notes<br />
• The port infrastructures will be integrated into a landscape unit defined as an industrial<br />
sector.<br />
Follow-up<br />
A follow-up is not necessary.<br />
Significance of the residual effect: Not significant<br />
Canadian Royalties Inc.<br />
GENIVAR<br />
101-53046-02 November 2012<br />
227
Data sheet PI-19<br />
Environmental component<br />
Marine mammals and species with special status<br />
Ecosystemic value: Large<br />
Several species of marine mammals, some of which have special status, can be found in<br />
Deception Bay. These animals perform several biological functions in the Bay, including<br />
feeding and resting. Seals calve, raise their young and moult on the ice during the spring.<br />
Sociocultural and economic value: Large<br />
The Inuit hunt the marine mammals for food and clothing.<br />
Source of the effect<br />
Phase: Operation<br />
Activity: Navigation<br />
Description of the potential effects<br />
• Disruption due to the increased level in undersea noise.<br />
• Risk of collisions.<br />
• Possible disturbance of habitat essential to the seals through a breakup of the ice<br />
cover caused by the movement of ships during the ice period.<br />
Degree of disturbance: Intensity of the effect: High Duration of the effect:<br />
Average<br />
Temporary<br />
Duration-intensity index: High Scope of the effect: Local<br />
Significance of the effect: Average<br />
Attenuation measures/Monitoring<br />
• The ships will always use the same route, for entering and leaving, i.e. the same as<br />
that used by the Xstrata ships.<br />
• A shipping exclusion period extends from mid-March to mid-June to avoid the<br />
critical period for seal calving, suckling and raising their young.<br />
• The number of ore carrier trips will be limited to three between December 1 and<br />
March 15.<br />
• The maximum ship speed will not exceed 7 knots.<br />
• During the winter, the ships will always use the same channel. This maneuver is<br />
intended to reduce the impact on the stability of the ice in Deception Bay.<br />
Notes<br />
• The total number of scheduled trips is 22 per year (11 return trips).<br />
Canadian Royalties Inc.<br />
GENIVAR<br />
101-53046-02 November 2012<br />
228
Follow-up<br />
Significance of the residual effect: Not significant<br />
• A follow-up on shipping in Deception Bay includes the collection of marine mammal<br />
observations. This follow-up is required as part of the NNIP authorizations<br />
(Section 9).<br />
Canadian Royalties Inc.<br />
GENIVAR<br />
101-53046-02 November 2012<br />
229
Data sheet PI-20<br />
Environmental component<br />
Land use by the Inuit for traditional purposes<br />
Ecosystemic value: N/A<br />
Sociocultural and economic value: Large<br />
Deception Bay is deemed to be an essential subsistence area for the Salluit community<br />
(ARK, 1998). The Inuit exploit several species of fauna to be found in Deception Bay. In<br />
winter, they use a network of snowmobile trails across the Bay to get to their traditional<br />
hunting and fishing grounds. Ice stability and strength is important for the safety of these<br />
trips.<br />
Source of the effect<br />
Phase: Operation<br />
Activity: Navigation<br />
Description of the potential effects<br />
• The passage of ships during the ice period can temporarily compromise access to<br />
certain hunting and fishing grounds, by breaking up the ice and carving out a<br />
channel that cuts the trails used by the snowmobiles.<br />
• In spring, shipping could cause an early ice break-up in certain areas of the Bay.<br />
• The passage of ships, during the ice period, could disturb the seal habitat, cause<br />
some of them to flee and thus reduce the success of Inuit hunting.<br />
Degree of disturbance: Intensity of the effect: High Duration of the effect:<br />
Average<br />
Temporary<br />
Duration-intensity index: High Scope of the effect: Local<br />
Significance of the effect: Average<br />
Attenuation measures/Monitoring<br />
• A shipping exclusion period extends from mid-March to mid-June.<br />
• Except in case of emergency stemming from unforeseen, significant events that<br />
can only be resolved by sea transportation, no trips will be made during the period<br />
between mid-March and mid-June.<br />
• The number of ore carrier trips will be limited to three between December 1 and<br />
March 15.<br />
• The maximum ship speed will not exceed 7 knots.<br />
• The ships will follow an “S” shaped route.<br />
• The shipping routes will be coordinated with those used by Xstrata. The two<br />
companies will exchange shipping schedules.<br />
Canadian Royalties Inc.<br />
GENIVAR<br />
101-53046-02 November 2012<br />
230
• The ships will always use the same route, for entering and leaving, i.e. the same as<br />
that used by the Xstrata ships.<br />
• During the winter, the ships will always use the same channel. This maneuver is<br />
intended to reduce the impact on the stability of the ice in Deception Bay.<br />
• Inform the Salluit community in order to reduce the risk related to opening the ice<br />
cover, and minimize the potential consequences on hunting and fishing activities.<br />
The communication methods will include satellite phone calls to the Salluit hunting<br />
and fishing association manager, provision of a shipping schedule to the<br />
appropriate Salluit authorities and access to a link on the Canadian Royalties<br />
website.<br />
• <strong>Main</strong>tain, as needed, a second ice bridge further upstream, at Pointe-Noire, that will<br />
greatly reduce the detour for snowmobilers. This bridge will be maintained by<br />
qualified Inuit personnel. Signage panels will be erected to identify the area before<br />
and after the ice bridge.<br />
Notes<br />
• The anticipated effects will be infrequent and of short duration.<br />
• From January to April, the ice cover in Deception Bay takes approximately three<br />
hours to reform after the passage of a ship (Don Cameron, Nuvumiut<br />
Developments Inc., pers. comm., 2006; Tom Paterson, FEDNAV shipping line,<br />
pers. comm., 2006.)<br />
Follow-up<br />
Significance of the residual effect: Not significant<br />
• A follow-up on shipping in Deception Bay addresses the issue of traditional Inuit<br />
activities. This follow-up is required as part of the NNIP authorizations (Section 9).<br />
Canadian Royalties Inc.<br />
GENIVAR<br />
101-53046-02 November 2012<br />
231
Data sheet PI-21<br />
Environmental component<br />
Navigation<br />
Ecosystemic value: N/A<br />
Sociocultural and economic value: Large<br />
Commercial shipping is a very important factor in remote areas, specifically for re-supply.<br />
Deception Bay is a transit hub for ore from mines currently being worked in the region. The<br />
Inuit use the Bay to move around, and to exploit its fauna resources.<br />
Sources of the effect<br />
Phases: Operation<br />
Activity: Navigation<br />
Description of the potential effects<br />
• Risk of accident (collisions) at the port infrastructure site and in Deception Bay<br />
during the passage of ore carriers, cargo ships and oil tankers.<br />
Degree of disturbance: Low Intensity of the effect: Average Duration of the effect:<br />
Temporary<br />
Duration-intensity index: Scope of the effect: Occasional<br />
Average<br />
Significance of the effect: Minor<br />
Attenuation measures/Monitoring<br />
• Issue warnings to shipping and inform the Salluit Inuit of planned ship movements<br />
to ensure the safety of other shipping.<br />
• The maximum ship speed will not exceed 7 knots.<br />
Notes<br />
Follow-up<br />
• A follow-up is not necessary.<br />
Significance of the residual effect: Not significant<br />
Canadian Royalties Inc.<br />
GENIVAR<br />
101-53046-02 November 2012<br />
232
8.2.2 Sediment dump<br />
During the construction phase, the sources of effects include the transportation of<br />
excavated earth, formation of the dump and layout of the runoff and decantation<br />
water collection ditch network.<br />
In the operation phase, the sources of effects include the transportation of dredged<br />
sediment to the dump and placement on the dump.<br />
The sediment dump will be laid out directly on the shot rock dump from the blasting<br />
work conducted at the concentrate hall site. No enlargement or additional<br />
encroachment into the natural surroundings, thereby significantly limiting the<br />
potential effects on the various components of the land environment. The current<br />
access will be used.<br />
No effect is anticipated during the layout of the land dump site on the soil, land<br />
vegetation, species with special status or archaeological heritage of the adjacent<br />
setting. Similarly, aside from the disturbance caused by the work and the risk of<br />
collision during the transportation of sediment, no impact is anticipated on the land<br />
mammals and avian fauna.<br />
Table 8.6 shows the relationship between the potential effects of the land sediment<br />
dump in the various project components and those of the environment. The<br />
assessment forms can be found on the following pages.<br />
Canadian Royalties Inc.<br />
GENIVAR<br />
101-53046-02 November 2012<br />
233
Table 8.6 Identification of potential effects matrix of the land sediment dump.<br />
Nature of potential impacts<br />
DT-x / B Negative impact<br />
DT-x / ■ Positive impact<br />
Sources of potential effects<br />
Implementation phases<br />
Construction Operation Modification*<br />
Decommissioning<br />
and closure<br />
Environmental components<br />
Human setting<br />
Physical and biological<br />
settings<br />
Layout of the<br />
dump site<br />
Transportation of<br />
sediment<br />
Surface water quality DT-1 - DT-1 - DT-1 J<br />
Air quality DT-2 - DT-2 B/J<br />
Land mammals DT-3 - - DT-3 J<br />
Avian fauna (land) DT-4 - - - DT-4 J<br />
Ambient noise DT-5 - DT-5<br />
Health DT-6 - DT-6<br />
Economy DT-7 - DT-7<br />
Jobs DT-8 - DT-8<br />
Dumping<br />
<strong>Main</strong>tenance<br />
J<br />
Landscape ∗ According to the type of modifications. The same impacts as those expected in the construction phase are likely to occur in the modification phase, since the same<br />
DT-9 - - - DT-9<br />
activities and work are likely to be performed.
Data sheet DT-1<br />
Environmental component<br />
Surface water quality<br />
Ecosystemic value: Large<br />
Quality surface water will ensure optimal conditions for flora and fauna development.<br />
Sociocultural and economic values: N/A<br />
Sources of the effect<br />
Phases: Construction/Operation/Modification<br />
Activities: Layout of the dump site/Dumping of the dredged sediment<br />
Description of the potential effects<br />
• Contamination of surface water by hydrocarbons (construction equipment and<br />
trucks).<br />
• The water contained in the dredged sediment could contaminate land surface water<br />
with a lower salinity than that contained in the sediment.<br />
• Concentration of SS at the decantation water discharge point higher than the<br />
established criterion.<br />
Degree of disturbance: Low Intensity of the effect: Average Duration of the effect:<br />
Temporary<br />
Duration-intensity index: Scope of the effect: Occasional<br />
Average<br />
Significance of the effect: Minor<br />
Attenuation measures/Monitoring<br />
• A network of ditches will be laid out around the dump to capture and redirect the<br />
runoff and decantation water to the existing ditches. The water will be returned via<br />
the latter to Deception Bay.<br />
• A sediment barrier will be installed in a gap created directly in the dump berm to<br />
capture fine particles.<br />
• Various sampling points will make it possible to take samples for surface water<br />
quality analyses.<br />
Notes<br />
Significance of the residual effect: Not significant<br />
Follow-up<br />
A follow-up will be conducted (Section 9).<br />
Canadian Royalties Inc.<br />
GENIVAR<br />
101-53046-02 November 2012<br />
235
Data sheet DT-2<br />
Environmental component<br />
Air quality<br />
Ecosystemic value: N/A<br />
Sociocultural and economic value: Large<br />
Air quality is an element deemed to be important since the work will be conducted in a<br />
natural setting relatively undisturbed by human activity.<br />
Sources of the effect<br />
Phases: Construction/Operation/Modification<br />
Activities: Layout of the dump site/Transportation and dumping of the dredged<br />
sediment<br />
Description of the potential effects<br />
• Emission of atmospheric pollutants and dust from the movement of trucks and the<br />
operation of heavy machinery and construction equipment.<br />
Degree of disturbance: Intensity of the effect: High Duration of the effect:<br />
Average<br />
Temporary<br />
Duration-intensity index: High Scope of the effect: Local<br />
Significance of the effect: Average<br />
Attenuation measures/Monitoring<br />
• Standard measures 12 to 17.<br />
• Use of Arctic diesel.<br />
Notes<br />
•<br />
Follow-up<br />
A follow-up is not necessary.<br />
Significance of the residual effect: Not significant<br />
Canadian Royalties Inc.<br />
GENIVAR<br />
101-53046-02 November 2012<br />
236
Environmental component<br />
Land mammals<br />
Ecosystemic value: Average<br />
Data sheet DT-3<br />
Sociocultural and economic value: Large<br />
Some species of land mammals represent a source of food and income for the Inuit. Hunting<br />
is an integral part of their way of life.<br />
Sources of the effect<br />
Phases: Construction/Operation/Modification<br />
Activities: Dump site layout/Transportation of sediment<br />
Description of the potential effects<br />
• The noise generated by the construction equipment (e.g. the dredge) may<br />
constitute a source of disturbance for land mammals.<br />
• Risk of collisions.<br />
Degree of disturbance: Low Intensity of the effect: Average Duration of the effect:<br />
Temporary<br />
Duration-intensity index: Scope of the effect: Local<br />
Average<br />
Significance of the effect: Average<br />
Attenuation measures/Monitoring<br />
• Accurately define the work areas.<br />
• The movement of machinery will be restricted to the work areas.<br />
• Dump truck speeds will be limited.<br />
Notes<br />
• The sediment will be dumped directly above the existing excavated earth dump. No<br />
enlargement or additional encroachment is planned in the surrounding area,<br />
thereby eliminating the risk of habitat being destroyed.<br />
Follow-up<br />
A follow-up is not necessary.<br />
Significance of the residual effect: Not significant<br />
Canadian Royalties Inc.<br />
GENIVAR<br />
101-53046-02 November 2012<br />
237
Environmental component<br />
Avian fauna<br />
Data sheet DT-4<br />
Ecosystemic value: Average<br />
Sociocultural and economic value: Low<br />
Limited interest and use by the Inuit.<br />
Sources of the effect<br />
Phase: Construction/Modification<br />
Activity: Layout of the dump site<br />
Description of the potential effects<br />
• The noise generated by the construction equipment (e.g. the dredge) may<br />
constitute a source of disturbance for avian fauna.<br />
• The encroachment of the dump into the natural setting could destroy habitat and<br />
nests.<br />
Degree of disturbance: Low Intensity of the effect: Average Duration of the effect:<br />
Temporary<br />
Duration-intensity index: Scope of the effect: Occasional<br />
Average<br />
Significance of the effect: Minor<br />
Attenuation measures/Monitoring<br />
• Accurately define the work areas.<br />
• The movement of machinery will be restricted to the work areas.<br />
Notes<br />
• The sediment will be dumped directly on the shot rock from the blasting work at the<br />
ore concentrate hall site. No enlargement or additional encroachment is planned in<br />
the surrounding area, thereby eliminating the risk of habitat or nests being<br />
destroyed.<br />
Follow-up<br />
A follow-up is not necessary.<br />
Significance of the residual effect: Not significant<br />
Canadian Royalties Inc.<br />
GENIVAR<br />
101-53046-02 November 2012<br />
238
Environmental component<br />
Ambient noise<br />
Data sheet DT-5<br />
Ecosystemic value: N/A<br />
Sociocultural and economic value: Large<br />
Ambient noise includes all noise generated by human activity taking place in Deception Bay.<br />
The natural aspect of Deception Bay is sensitive to the noise level (large northern space)<br />
Sources of the effect<br />
Phases: Construction/Operation/Modification<br />
Activities: Layout of the dump site/Transportation and dumping of the dredged<br />
sediment<br />
Description of the potential effects<br />
• Increase in noise levels on the periphery of the worksite associated with the<br />
operation of heavy machinery and construction equipment, which will add to<br />
ambient noise levels.<br />
Degree of disturbance: Intensity of the effect: High Duration of the effect:<br />
Average<br />
Temporary<br />
Duration-intensity index: High Scope of the effect: Local<br />
Significance of the effect: Average<br />
Attenuation measures/Monitoring<br />
• The machinery and equipment will be subject to regular scheduled inspections to<br />
ensure that the exhaust systems are in good condition, so as to limit noise<br />
emissions.<br />
• The movement of machinery will be restricted to the work areas.<br />
• When possible, the main noise sources will be insulated with sound absorbent<br />
material.<br />
• All workers subjected to long periods of noise exceeding 85 dB(A) will be obliged to<br />
wear hearing protective equipment (provided) at all times.<br />
Notes<br />
Follow-up<br />
A follow-up is not necessary.<br />
Significance of the residual effect: Not significant<br />
Canadian Royalties Inc.<br />
GENIVAR<br />
101-53046-02 November 2012<br />
239
Data sheet DT-6<br />
Environmental component<br />
Health<br />
Ecosystemic value: N/A<br />
Sociocultural and economic value: Large<br />
The health and safety of workers and users of the Deception Bay highway is important. Every<br />
accident generates costs in materials, intervention time and healthcare.<br />
Sources of the effect<br />
Phases: Construction/Operation/Modification<br />
Activities: Layout of the dump site/Transportation and dumping of the dredged<br />
sediment<br />
Description of the potential effects<br />
• Risk of accidents involving workers.<br />
• Risk of road collisions.<br />
Degree of disturbance: Low Intensity of the effect: Average Duration of the effect:<br />
Temporary<br />
Duration-intensity index: Scope of the effect: Local<br />
Average<br />
Significance of the effect: Average<br />
Attenuation measures/Monitoring<br />
• The occupational health and safety program will be implemented.<br />
• The workers will receive awareness-raising and training sessions regarding health<br />
and safety at work.<br />
• Erection of suitable highway signage before the start of construction work to inform<br />
other road users of the increased presence of trucks.<br />
• Truck speeds will be limited.<br />
• The vehicles and construction equipment will be subject to regular scheduled<br />
inspections to ensure they are in good working order.<br />
Notes<br />
• Every new worker will receive training on the health and safety procedures upon<br />
arrival at the work camp. A personal meeting with the nursing staff is mandatory to<br />
fill out the worker’s “health form.”<br />
Follow-up<br />
A follow-up is not necessary.<br />
Significance of the residual effect: Not significant<br />
Canadian Royalties Inc.<br />
GENIVAR<br />
101-53046-02 November 2012<br />
240
Data sheet DT-7<br />
Environmental component<br />
Economy<br />
Ecosystemic value: N/A<br />
Sociocultural and economic value: Large<br />
Sources of the effect<br />
Phases: Construction/Operation/Modification<br />
Activities: Layout of the dump site/Transportation and dumping of the dredged<br />
sediment<br />
Description of the potential effects<br />
• Overall, the port infrastructure layout project is likely to have positive economic<br />
spinoffs for the Inuit communities through the awarding of contracts to Inuit<br />
companies.<br />
Degree of disturbance: N/A Intensity of the effect: N/A Duration of the effect: N/A<br />
Duration-intensity index: N/A Scope of the effect: N/A<br />
Significance of the effect: N/A<br />
Attenuation measures/Monitoring<br />
N/A<br />
Notes<br />
• Section 6 of the Nunavik Nickel agreement sets out a framework for the awarding of<br />
contracts to Inuit companies working in various fields (transportation, construction,<br />
goods and services, etc.). Construction of the port infrastructures is a component of<br />
the NNIP included in the agreement.<br />
Follow-up<br />
A follow-up is not necessary.<br />
Significance of the residual effect: N/A<br />
Canadian Royalties Inc.<br />
GENIVAR<br />
101-53046-02 November 2012<br />
241
Data sheet DT-8<br />
Environmental component<br />
Labour<br />
Ecosystemic value: N/A<br />
Sociocultural and economic value: Large<br />
Sources of the effect<br />
Phases: Construction/Operation/Modification<br />
Activities: Layout of the dump site/Transportation and dumping of the dredged<br />
sediment<br />
Description of the potential effects<br />
• Overall, the port infrastructure layout project is likely to create job opportunities for<br />
the neighbouring communities (Salluit, Kangiqsujuaq and Puvirnituq) and for the<br />
Nunavik Inuit in general.<br />
Degree of disturbance: N/A Intensity of the effect: N/A Duration of the effect: N/A<br />
Duration-intensity index: N/A Scope of the effect: N/A<br />
Significance of the effect: N/A<br />
Attenuation measures/Monitoring<br />
N/A<br />
Notes<br />
• Section 5 of the Nunavik Nickel agreement sets out a framework aimed at<br />
promoting the CRI hiring of Inuit employees for implementation of the project. The<br />
agreement also stipulates the establishment of training programs to improve Inuit<br />
employability, in cooperation with the Kativik regional administration and the Kativik<br />
school board.<br />
• The awarding of contracts to Inuit companies will generate jobs.<br />
Follow-up<br />
A follow-up is not necessary.<br />
Significance of the residual effect: N/A<br />
Canadian Royalties Inc.<br />
GENIVAR<br />
101-53046-02 November 2012<br />
242
Data sheet DT-9<br />
Environmental component<br />
Landscape<br />
Ecosystemic value: N/A<br />
Sociocultural and economic value: Large<br />
Sources of the effect<br />
Phases: Construction/Operation<br />
Activities: N/A<br />
Description of the potential effects<br />
• The presence of the sediment dump could alter the landscape of Deception Bay.<br />
Degree of disturbance: Low Intensity of the effect: High Duration of the effect:<br />
Permanent<br />
Duration-intensity index: High Scope of the effect: Occasional<br />
Significance of the effect: Average<br />
Attenuation measures/Monitoring<br />
• Respect the natural topography of the landscape by not dumping materials outside<br />
the industrial sector.<br />
Notes<br />
• The sediment will be dumped directly on the existing shot rock dump located in a<br />
landscape unit defined as an industrial sector.<br />
Follow-up<br />
A follow-up is not necessary.<br />
Significance of the residual effect: Not significant<br />
Canadian Royalties Inc.<br />
GENIVAR<br />
101-53046-02 November 2012<br />
243
8.3 Principal issues<br />
In this project, two issues require close attention due to the sensitivity and value of<br />
the environmental components affected. To be chosen as a valued environmental<br />
component (VEC), an environmental component must:<br />
• Be highly valued by the populations involved or specialists<br />
• Be likely to be changed or affected by the project<br />
The selected VECs are marine mammals and traditional land use by the Inuit.<br />
8.3.1 Marine Mammals<br />
Several species of mammal use Deception Bay and carry out a number of critical<br />
biological functions there (parturition, suckling, raising offspring, etc.)<br />
(section 6.2.1.4). A few of these species have a special status due to such things as<br />
reduced population numbers, or habitat scarcity or fragility. These include the beluga<br />
and bowhead whale. Human activity that disrupts, changes or destroys these<br />
mammals' habitats could put additional pressure on their survival.<br />
The project's impacts on marine mammals will primarily be felt during construction,<br />
when dredging is performed and the piles for the two wharf cells are inserted using<br />
vibration drilling and driving. These activities increase underwater noise levels. The<br />
work period overlaps the summer season, a period of intense beluga use of<br />
Deception Bay, for feeding, raising offspring, moulting and rest of juveniles,<br />
biological activities that are essential to survival.<br />
Two sector reports describe the project's potential impacts on marine mammals. The<br />
first (GENIVAR, 2012B; Appendix 10) sets out the hydroacoustical data gathered in<br />
the summer of 2012 and describes Deception Bay's sound environment., The report<br />
also sets out the known effects of noise from drilling activities on marine mammals<br />
and fish, and their sensitivity to this phenomenon. Lastly, it describes an exclusion<br />
zone and puts forward a marine mammal monitoring strategy to minimize the effects<br />
on these animals of the noise generated by the work.<br />
The report states that the distance required to get the noise pressure below<br />
established safety thresholds is equivalent to noise pressures of 160 dB re 1 µPa rms<br />
for cetaceans (a group to which the beluga belongs) and 180 dB re 1 µPa rms for<br />
pinnipeds (seals). - Above these thresholds, physiological damage may occur if<br />
individuals are exposed to these noise levels. Below these levels, the impacts are<br />
limited to behavioural changes.<br />
Canadian Royalties Inc.<br />
GENIVAR<br />
101-53046-02 November 2012<br />
244
The second report (GENIVAR, 2007, Appendix 22) reports potential effects from<br />
navigation on marine mammals that use Deception Bay. It assesses the effects and<br />
proposes mitigation measures.<br />
The ensuing discussion is based on these two reports.<br />
8.3.1.1 Dredging<br />
Dredging generates noise of average intensity (noise pressure at the source of 150<br />
to 162 dB re 1 μPa) over relatively long periods (16 hours/day). Dredging work is<br />
expected to last about 30 days.<br />
The increased noise level around the dredging zone could disrupt the flow of the<br />
beluga's biological activities, make them avoid the noisy area or adjust their<br />
vocalizations, without causing harmful physiological effects or hearing loss to the<br />
beluga. The beluga could also collide with the dredge or barges during manoeuvres<br />
or travel.<br />
A 400 m exclusion zone will be established around the dredging area to reduce the<br />
risks of such occurrences (map 8.1). A qualified monitoring person on the shoreline<br />
will handle detection of the presence of belugas or any other marine mammal. As<br />
soon as one or more mammals are spotted within this 400 m radius, work will be<br />
suspended immediately until they depart. Work will also be suspended during poor<br />
weather in which visibility is reduced.<br />
8.3.1.2 Drilling of piles and sheet piles<br />
Source sound pressure for drilling of piles will be around 210 dB re 1 µPa rms . At this<br />
pressure, according to the sound mitigation measures carried out in Deception Bay<br />
in 2012, an exclusion zone of 1,200 m is prescribed. Within the zone, as mentioned<br />
above, safety thresholds for cetaceans and seals are exceeded. Marine mammals<br />
present during the work could be subject to physiological damage.<br />
To provide for maximum protection of belugas likely to be in the work sector, the<br />
DFO has prescribed an exclusion period for work involving the propagation of<br />
underwater noise; it runs from June 20 to July 15 inclusively (GENIVAR, 2008b).<br />
However, this does not cover dredging and backfilling. The exclusion period will be<br />
respected.<br />
Canadian Royalties Inc.<br />
GENIVAR<br />
101-53046-02 November 2012<br />
245
Moosehead<br />
Islands<br />
74°40'0"W<br />
Projet Nunavik Nickel / Nunavik Nickel Project<br />
EIES pour l’aménagement d’infrastructures portuaires et<br />
la gestion des sédiments à la baie Déception /<br />
ESIA for the Deception Bay Wharf and Sediment Management<br />
White Rock<br />
Carte 8.1 / Map 8.1<br />
Zones de surveillance des<br />
mammifères marins proposées /<br />
Proposed Marine Mammal Monitoring Area<br />
0 0,5 1 1,5 km<br />
Projection : UTM, zone 18, NAD83<br />
Équidistance des courbes / Contour Interval : 50 pieds / feet<br />
Source :<br />
Base : BNDT, 1 : 50 000, 1976 à 1995**, © Sa Majesté la Reine du<br />
Chef du Canada, reproduit avec la permission de RNCan<br />
Inventaires et cartographie / Surveys and mapping : GENIVAR<br />
Fichier / File : 101_53046_EIES_BD_c8_1_surveil_121120.mxd<br />
Pointe Théron<br />
Novembre / November 2012<br />
101-53046-02<br />
62°9'0"N<br />
Baie<br />
Kangirsugaarjuk /<br />
Careenage Arm<br />
Rayon / Radius : 1 200 m<br />
Xstrata<br />
Nickel<br />
62°9'0"N<br />
Rayon / Radius : 400 m<br />
Q1<br />
Q2<br />
A<br />
Baie Déception /<br />
Deception Bay<br />
B<br />
E<br />
C<br />
Plage du<br />
Bombardier<br />
Campement<br />
temporaire /<br />
Temporary<br />
Camp<br />
D<br />
Zones de surveillance des mammifères marins proposées /<br />
Proposed Marine Mammal Monitoring Area<br />
Scénario au site Q1 / Scenario at site Q1<br />
Composantes du projet / Project Components<br />
Infrastructures portuaires projetées (variantes) /<br />
Proposed wharf (variants)<br />
Site de dépôt des sédiments (variantes) /<br />
Sediment disposal site (variants)<br />
Site 4<br />
Zone d'étude / Study area<br />
Infrastuctures existantes / Existing Infrastructure<br />
Campement Inuit permanent / Inuit permanent camp<br />
62°5'0"N<br />
Infrastructures portuaires / Wharf<br />
Route / Road<br />
74°40'0"W<br />
62°5'0"N
During drilling work, marine mammals will be monitored over the 1,200 m exclusion<br />
zone. An optimized monitoring strategy will be implemented to allow work to be done<br />
whether or not conditions are conducive to traditional visual monitoring. Work would<br />
only be interrupted during the period in which marine mammals or, if applicable, any<br />
other sensitive animals are actually within the 1,200 m safety perimeter. The strategy<br />
is based on the following:<br />
• Start monitoring cetaceans at least 30 minutes before the onset of drilling work.<br />
• Start drilling operations gradually and continuously over a period of 20 to 30<br />
minutes to allow any cetaceans in the area to move away from the noise source.<br />
• Institute a passive marine mammal monitoring program that uses hydrophones to<br />
listen for their sounds and electronic detection using sonar.<br />
• Institute an intensive visual monitoring program as of the onset of work, so as to<br />
establish a general match between passive observations (acoustic and sonar)<br />
and active observations (visual), which would then facilitate the identification of<br />
passively observed organisms. Subsequently, visual monitoring equipment would<br />
only be used to validate "ambiguous" passive observations.<br />
• As soon as work begins, set up an acoustic monitoring program for noise emitted<br />
by site activities so as to obtain a real-time definition of the safety perimeter<br />
(threshold of 160 dB re 1 µParms), moderate how site equipment operates so as<br />
to limit the emission of potentially disturbing noise, and assess the real need to<br />
resort to additional mitigation measures.<br />
Any incident or event involving a marine mammal that occurs during dredging or<br />
drilling work will be reported immediately to the site supervisor and CRI environment<br />
officer. They will make the necessary adjustments to keep such an incident or event<br />
from recurring.<br />
By applying the mitigation and monitoring measures recommended above, the<br />
residual effects of the construction of port infrastructures on marine mammals should<br />
not be substantial.<br />
8.3.1.3 Navigation<br />
At most 11 trips a year will be needed to ensure NNiP operations run smoothly. As<br />
stated in section 7.3, the navigation season will run from June 15 to March 15, with a<br />
maximum of three trips between December 1 and March 15. In all, about 80 hours of<br />
navigation per year will be done on behalf of CRI. Ships travelling in Deception Bay<br />
will be limited to a maximum speed of 7 knots.<br />
Canadian Royalties Inc.<br />
GENIVAR<br />
101-53046-02 November 2012<br />
247
Ship travel in the bay is likely to cause three types of impacts on marine mammals:<br />
disturbance due to the noise emitted by props and engines, collisions with marine<br />
mammals and disruption of seal calving habitat.<br />
Noise<br />
Noise emitted by ships is primarily likely to affect echolocation and communication<br />
among individuals, and can become a real source of disturbance if the individuals<br />
are subject to long or intense exposure (i.e., by several ships at the same time in the<br />
same sector). Marine traffic associated with the NNiP will slightly increase the<br />
frequency of disturbances to marine mammals' echolocation and communication,<br />
and to their biological activities. However, given the small number of ships and their<br />
speed limit, the disturbance will be minor and short, therefore not important.<br />
Fragmentation of ice cover<br />
Ships transiting during the ice cover period break the ice by chewing it up or<br />
fragmenting it. This impact is greater in the spring, when it takes longer for ice to<br />
reform. Ongoing ice cover is essential for the ringed seal, which uses the ice cover<br />
as a habitat for calving, nursing and weaning newborns, moulting and pupping. No<br />
ship will transit from March 15 to June 15, the critical period for these activities, and<br />
only three trips are slated for the winter period. Moreover, ships will use the same<br />
track as Xstrata ships, keeping the ice from being chewed up over overly large<br />
expanses. The measures will limit the impact of ship travel on the bay's ice cover.<br />
Collisions<br />
There is a risk of collision between ships and marine mammals. The risk is greater<br />
during the open water period, as more marine mammal species may use the bay. It<br />
is recognized that most serious or fatal injuries are caused by ships at least 80 m<br />
long, which makes them less manoeuvrable, or ships moving at a speed of at least<br />
14 knots (Laist et al. 2001). Usually, it is the most streamlined marine mammals, like<br />
rorqual whales, that are hit by a ship's bow (GENIVAR, 2007b). For seals, collisions<br />
are more likely during the winter at the entrance to Deception Bay, in areas with<br />
uneven ice, where ringed seals prefer to make their dens.<br />
Ships using Deception Bay will move at a maximum speed of 7 knots during the<br />
open water period, substantially reducing the risk of collisions. Collisions will also be<br />
reduced for the ringed seal given the restriction period, which runs from March 15 to<br />
June 15. Ships will use the same track as Xstrata ships, keeping the collision risk<br />
from extending to a greater area. These measures seem to have proven their<br />
effectiveness, as no mention of a collision has been recorded to date in Deception<br />
Bay after fifteen years of marine activity in the Raglan project.<br />
Canadian Royalties Inc.<br />
GENIVAR<br />
101-53046-02 November 2012<br />
248
8.3.1.4 Inuit use of the land for traditional purposes<br />
Deception Bay is used intensively by Salluit Inuit, who engage in hunting and fishing<br />
throughout the year (GENIVAR, 2007b). They hunt seal, beluga and, more rarely,<br />
walrus, and fish for several species, including Arctic char. During the winter, they<br />
gather blue mussel.<br />
Transiting ships during the ice-up could temporarily compromise access to some<br />
hunting and fishing grounds, by cutting a trench that would intersect snowmobile<br />
trails. Moreover, the passage of ships can change the natural dynamic of ice<br />
fracturing, triggering early breakup of the ice cover during the melt period. Note,<br />
however, that only three trips are slated for the winter period. In the open water<br />
period, the impacts of navigation on traditional Inuit activities are limited to noise and<br />
temporary disturbance of the wildlife.<br />
Several mitigation measures are planned to minimize the impact on Inuit travel. The<br />
measures are contained in the Nunavik Nickel agreement, or were imposed in the<br />
context of the NNiP authorization certificate issued by the MDDEP. For example,<br />
marine transportation will be prohibited from March 15 to June 15 so as not to<br />
impede Inuit hunting activities and avoid disturbing the seals that are on the ice.<br />
During this period, trips could be necessary in emergency situations and, if<br />
necessary, an agreement would be reached with the Inuit. The mitigation measures<br />
also include, if necessary, maintenance of a second ice bridge at the Pointe-Noire<br />
level. <strong>Main</strong>tenance would be performed by qualified Inuit staff. Signage panels would<br />
be installed.<br />
CRI also plans to set up a protocol for warning of ice breaker travel in Deception<br />
Bay, to minimize the risks to the safety of snowmobilers. The protocol will factor in<br />
the condition of the ice cover in Deception Bay and time needed for it to reform<br />
(about three hours from January to April; Don Cameron, Nuvumiut Developments<br />
Inc., pers. comm, 2006; Tom Paterson, FEDNAV owner, pers. comm., 2006).<br />
Given that traditional activities can continue even during ship travel in Deception<br />
Bay, that the main nuisance is associated with a temporary cut in some snowmobile<br />
trails between December and mid-March, and given the mitigation measures to be<br />
implemented, the impact of navigation on use of the territory for traditional purposes<br />
are deemed to be minor.<br />
Moreover, the activities to build port infrastructures and dispose of sediment, the<br />
operation of the facilities and navigation are unlikely to reduce the abundance of the<br />
main animal resources that the Inuit hunt and fish, whether beluga, seals, Arctic char<br />
Canadian Royalties Inc.<br />
GENIVAR<br />
101-53046-02 November 2012<br />
249
or caribou. With the proposed mitigation measures, the project is unlikely to affect or<br />
significantly disrupt these animals' essential biological activities or their habitats.<br />
According to testimony, Raglan mine transportation activities in Deception Bay do<br />
not seem to be creating any substantial impact on the wildlife in the bay.<br />
All in all, the project is not likely to have major negative impacts on the flow of<br />
traditional Inuit activities.<br />
Finally, note that NNIP nuisances, including marine activities on Inuit hunting and<br />
fishing, will be offset by the sharing of NNiP benefits stipulated in the Nunavik Nickel<br />
agreement.<br />
8.4 Fish habitat<br />
The two sheet piling cells and their protective ballast will modify fish habitat. About<br />
1,430 m 2 of these structures will be above the HHWMT height 14 : 940 m 2 for the two<br />
cells and 480 m 2 for the ballast of casing 2 (south) (table 8.7). Moreover, the total<br />
surface area of ballast below the HHWMT height (in the tidal range) is estimated at<br />
about 9,260 m 2 , to all practical surfaces equivalent to the dredged area (9,350 m 2 ).<br />
The ballasts should be colonized by aquatic vegetation and epibenthos, create<br />
feeding habitats for fish and form shelters from predation or rest areas, thanks to the<br />
interstices between the rocks. Moreover, these habitats (on a hard substrate) will<br />
enrich and diversify Deception Bay's ecosystem, which is dominated by soft bottom<br />
habitats, by attracting organisms that prefer this type of habitat.<br />
Follow-up will be done to check that the ballasts are in fact creating fish habitats<br />
(section 9).<br />
Table 8.7<br />
Surface areas of affected fish habitat<br />
Surface area<br />
(m 2 )<br />
Casing 1 Casing 2 Total<br />
Dredging (footprint) 4,675 4,675 9,350<br />
Casing (footprint) 470 470 940 (A)<br />
Ballast above high high water mean tide (HHWMT)<br />
(4.9m)<br />
0 480 480 (B)<br />
Ballast: below lower low water large tide (LLWLT) 5,375 1,635 7,010 (C)<br />
Ballast: between HHWMT and LLWLT 0 2,250 2,250 (D)<br />
Summary m 2<br />
Destruction (A + B) 1 430<br />
Potential habitat below HHWMT 9.260<br />
14<br />
Higher high water mean tide.<br />
Canadian Royalties Inc.<br />
GENIVAR<br />
101-53046-02 November 2012<br />
250
Under section 35(2) of the Fisheries Act (R.S.C., 1985, c. F-14), destruction of fish<br />
habitat is subject to authorization. CRI will take the required steps to obtain<br />
authorization.<br />
8.5 Environmental impacts on the project<br />
This section briefly deals with potential environmental effects on the project. Natural<br />
events could jeopardize the integrity of port infrastructures.<br />
8.5.1 Earthquakes<br />
8.5.2 Ice<br />
The Deception Bay sector is in an area with low level seismic activity<br />
(section 6.1.3.3). Port infrastructures, especially the cells, meet the design criteria for<br />
earthquake resistance. An earthquake is unlikely to jeopardize the integrity of the<br />
infrastructures.<br />
Port infrastructures, particularly cells and ballast, will be subject to ice pressure.<br />
Facility design has factored in the forces of the ice (section 7.1.8). A stability study<br />
was done factoring in the thrust of the ice so as to assess the risks of creep toward<br />
the shore. The safety factors calculated for several potential surfaces of rupture are<br />
all acceptable.<br />
8.5.3 Avalanche<br />
Dry snow and wet snow (slushflow) avalanches are particularly active in the<br />
Deception Bay area (section 6.1.2.3). Slushflows are more erosive and have a very<br />
high capacity for transporting sediment, as shown by the 2005 avalanche close to<br />
the Xstrata facilities (6.1.2.3). Site Q1 is adjacent to a slushflow corridor, just back (to<br />
the northwest) of the avalanche's trajectory. However, depending on the event's<br />
magnitude, the alluvial fan could reach Q1 and jeopardize the physical integrity of<br />
port infrastructures. The size and behaviour of an alluvial fan are impossible to<br />
predict. To minimize any slowfush damage, a deflector will be built and positioned to<br />
redirect the snow and sediment (map 7.2).<br />
Dry snow avalanches, which are much less destructive, are not likely to jeopardize<br />
infrastructure integrity. No risk corridor is next to Q1.<br />
Canadian Royalties Inc.<br />
GENIVAR<br />
101-53046-02 November 2012<br />
251
8.6 Cumulative effects<br />
8.6.1 Legal framework and general<br />
The method for evaluating the project's cumulative effects draws on the method<br />
recommended in the Canadian Environmental Assessment Agency's Cumulative<br />
Effects Assessment Practitioners' Guide (Hegmann et al., 1999). As shown in this<br />
guide, the concept of cumulative effects refers to the possibility that the permanent<br />
residual effects generated by a project combine with those of prior, present or future<br />
projects or interventions in the same sector or close by to produce greater impacts<br />
on the receiving environment.<br />
8.6.2 Scope of the study<br />
8.6.2.1 Study area and period covered<br />
The study area selected for the analysis of cumulative effects is Deception Bay and<br />
its shores (map 3.1). The period covers 1995 to 2030. The period runs from the<br />
return to port activities at the Xstrata wharf for Raglan mine construction work to the<br />
end of work to shut down the Expo mining complex, about two years after the end to<br />
mining operations, scheduled for 2028.<br />
8.6.2.2 Valued environmental components<br />
The VECs selected for analysis of the cumulative effects are marine mammals,<br />
traditional use of the land by the Inuit and fish habitat.<br />
8.6.2.3 Past, present and future activities, projects and events<br />
Table 8.8 provides a list of past, present and future activities, projects and events<br />
likely to have affected or to affect VECs in the study area. The future activities,<br />
projects and events are either planned or likely. The land-based sediment deposit is<br />
not included in the cumulative effects study, as it will be built within an existing rock<br />
deposit and in no way further encroach on the natural environment.<br />
Table 8.8 also identifies the most likely effects that actions, projects and events may<br />
have caused to VECs.<br />
Canadian Royalties Inc.<br />
GENIVAR<br />
101-53046-02 November 2012<br />
252
Table 8.8 Summary of present and future activities, projects and events likely to have affected or affect VECs<br />
VECs and potential effects<br />
Activity, project, event<br />
Past<br />
Present<br />
Future<br />
Marine mammals Fish habitat<br />
Inuit use of the land for<br />
traditional purposes<br />
Existing port infrastructures<br />
(Xstrata, Plage du Bombardier) x x x<br />
Loss / change<br />
to coastal habitat<br />
Loss of a potential shellfish<br />
harvesting area<br />
Canadian Royalties Inc.* port<br />
infrastructures<br />
x x<br />
Loss / change<br />
to coastal habitat<br />
Loss of a potential shellfish<br />
harvesting area<br />
Circulation of large ships in<br />
Deception Bay (bulk ore, bulk oil,<br />
freight)<br />
x x x<br />
Circulation of small ships in<br />
Deception Bay<br />
(zodiacs, launches,<br />
fishing and scientific<br />
survey boats)<br />
x x x<br />
Climate change -- Changes to<br />
the ice regime and increased<br />
x x<br />
warming in the bay's waters<br />
*Includes operation of the temporary wharf in 2013.<br />
**Source: Tremblay and Furgal, 2008<br />
Fragmentation / modification of ice<br />
cover<br />
Increase in noise level: disturbance,<br />
disruption of some biological<br />
activities and social behaviours<br />
Collisions<br />
Disturbance<br />
Collisions<br />
Changes to habitat conditions<br />
Access to food resources<br />
Changes to<br />
habitat conditions<br />
Fragmentation / modification of ice<br />
cover:<br />
Impediment to free circulation of<br />
snowmobiles and access to<br />
hunting grounds<br />
Access to traditional hunting and<br />
fishing grounds affected/modified**
Xstrata port infrastructures<br />
Potential cumulative effects are likely to be caused by the encroachment of<br />
infrastructures into the aquatic environment. Impacts of their construction are no<br />
longer being felt.<br />
CRI port infrastructures<br />
Potential cumulative effects are likely to be caused by the encroachment of<br />
infrastructures into the aquatic environment. The direct environmental effects of their<br />
construction on the environment will be temporary (a few weeks to a few months).<br />
Circulation of big ships in Deception Bay<br />
As of 2013, about twenty ships will visit Deception Bay each year: 11 for the NNiP<br />
and nine for the Raglan project. The ships are needed to export the ore concentrate<br />
and replenish equipment and petroleum products.<br />
Circulation of small ships in Deception Bay<br />
The exact number of small ships (fishing vessels and scientific survey boats,<br />
launches, zodiacs) travelling in the bay is unknown but small. Aside from a few<br />
occasional needs (such as scientific surveys and environmental monitoring), the<br />
NNiP will not substantially increase the number of small boats in Deception Bay.<br />
Climate change<br />
Nunavik is already feeling the impacts of climate change (see section 6.1.3.4).<br />
Greater warming of the water in Deception Bay and a change to the ice regime and<br />
pack ice dynamic are likely or already observed consequences of the higher air<br />
temperatures. Climate change is also expected to modify the feeding and<br />
reproductive habitats and migratory behaviour of marine mammals and fish<br />
(GENIVAR, 2007b).<br />
8.6.3 Analysis of cumulative effects<br />
8.6.3.1 Marine mammals<br />
The analysis of the cumulative effects of navigation on marine mammals is adapted<br />
from the study in the 2007 sector report on navigation prepared for the NNiP<br />
(GENIVAR, 2007b; Appendix 23), with some additions and adjustments.<br />
Canadian Royalties Inc.<br />
GENIVAR<br />
101-53046-02 November 2012<br />
254
Marine mammals are likely to be affected by:<br />
• changes associated with climate warming<br />
• disturbances to the ice cover caused by ship travel<br />
• risks of collision with the ships and the noise the ships generate<br />
Climate change<br />
Climate change could affect marine mammal populations by changing their habitat<br />
and access to food resources.<br />
Marine mammals use a huge array of survival strategies and have particular habitat<br />
requirements for feeding, wintering, reproduction, avoiding predation and facilitating<br />
migration (CEMAM, 2006). Coastal regions and estuarine and soft water habitat<br />
used by marine species will probably be affected by large increases in temperature<br />
in the years to come (FCIA, 2005). Changes associated with the distribution of pack<br />
ice, habitat quality, and the prey-predator dynamic could generate substantial<br />
changes in the lifestyle of marine mammals, their migratory periods and routes. At<br />
this time, the alteration of reproduction grounds and access to food are certainly the<br />
key elements involved in the change to migration schemes.<br />
Scientists note that the reduction in pack ice has been accelerating in the last few<br />
years. It has been shown that the reduction lowers the successful reproduction of<br />
adult seals, increases infant mortality and leads to changes in the availability of<br />
resources for pups (Friedlaender and coll., 2007). Long-term habitat modification<br />
could change the distribution of marine mammals, particularly seals that live on the<br />
ice. Habit change could either reduce their populations or force them to extend their<br />
range northward.<br />
Marine mammals are, of course, highly adapted to extreme climate fluctuations and<br />
some species depend on them (Friedlaender and coll., 2007). Their responses to<br />
climate change are often specific and vary from species to species.<br />
Navigation<br />
Although little developed at this point within Deception Bay, marine transport during<br />
the ice period could change the habitat of marine mammals by modifying the ice<br />
surface or creating temporary channels. The ringed seal's habitat is most at risk of<br />
impact (SENES, 2005), as the species is dependent on the available surface of pack<br />
ice to calve and raise its young (Johnston, et al, 2005; Lavigne, 2006; Friedlaender<br />
et al, 2007).<br />
Canadian Royalties Inc.<br />
GENIVAR<br />
101-53046-02 November 2012<br />
255
In Deception Bay, the potential cumulative impact of navigation is associated with<br />
the increase in maritime traffic for the resupply process and NNiP export of ore<br />
concentrates. The number of trips per year would rise to about twenty (11 trips for<br />
the NNiP project, nine for the Raglan project). No further increases are expected<br />
during the period covered.<br />
Despite the increase associated with NNiP, the average frequency of trips would be<br />
just two boats a month during the open water period. With this little traffic, and no<br />
trips at all between March 15 and June 15, there will be long periods free of<br />
disturbance for the marine mammals. Moreover, the trip through Deception Bay lasts<br />
from 2 to 24 hours, depending on whether or not there is ice.<br />
Given that ships always take the same track (map 7.5), only affecting a very small<br />
proportion of Deception Bay pack ice, it is unlikely that the change in ice cover will<br />
significantly affect ringed seals' calving and nursing habitat. Moreover, it only takes a<br />
few hours for the ice to reform after a ship has passed during the winter. The<br />
suspension of marine transport from mid-March to mid-June coincides with the<br />
period in which seals are concentrated on pack ice for calving. This critical period of<br />
their life cycle can thus unfold without disruption.<br />
Short-term reactions, such as an instant abandonment of reproduction and feeding<br />
areas, suggest that repeated noise, such as the noise put out by a boat prop, could<br />
have cumulative negative impacts on marine mammals (Richardson et al., 1991).<br />
Acoustic interference caused by marine traffic substantially changes socialization<br />
and reproduction behaviours (Richardson et a., 1995; Popper et al., 2000). This kind<br />
of change to the environment's sound can trigger flight movements and cause<br />
mothers to be separated from their offspring. If females with their young must<br />
repeatedly abandon nursing, weaning or feeding zones, newborns are vulnerable to<br />
exhaustion and predation (McCauley et al., 2000a,b).<br />
In Deception Bay, the Inuit have not noted any change to the behaviour of marine<br />
mammals during ship passage, except for a temporary grouping in wakes noted by<br />
hunters (Don Cameron, Nuvumiut Developments Inc., pers. comm, 2007). A study<br />
also showed that seal air holes are more dense in the frozen wake behind an ice<br />
breaker than in the surrounding ice cover (Alliston, 1980 in Mansfield, 1983).<br />
However, the impact of increasing passage frequency is undetermined.<br />
In terms of small ship circulation, the NNiP could make it increase very slightly.<br />
Moreover, these vessels do not operate during the winter; when they do operate,<br />
they do so at low speed, greatly reducing the risks of collision and noise emissions.<br />
Canadian Royalties Inc.<br />
GENIVAR<br />
101-53046-02 November 2012<br />
256
The intermittent nature of navigation, exclusion period, use of the same track, and<br />
speed limit on large ships (decrease in noise intensity) mean that there will be no<br />
significant impact on the conditions conducive to maintaining the marine mammal<br />
populations that use Deception Bay. Consequently, the cumulative impact of marine<br />
transportation on marine mammals that use Deception Bay caused by NNiP's<br />
activities is judged to be slight.<br />
However, the combination of the three types of nuisance (sound, physical and<br />
climatic) associated with marine traffic is likely to have a long-term effect on the<br />
marine mammals that use Deception Bay. Navigation activities should be monitored<br />
to judge whether they are putting additional pressure on the ecology, despite the<br />
mitigation measures in place. A navigation monitoring program was set up for this<br />
purpose subsequent to authorization from the NNiP in 2008 (Appendix 24).<br />
8.6.3.2 Inuit use of the land for traditional purposes<br />
Climate change<br />
Climate change is having a clear impact on Nunavik. It is seeing substantial average<br />
temperature increases, later snow cover and ice formation, earlier thaw, more<br />
frequent winter mild spells, the precipitation regime is changing, and the frequency<br />
and intensity of geomorphological processes is increasing in response to these<br />
changes (section 6.1.3.4).<br />
These changes have direct impacts on the flow of traditional Inuit activities,<br />
particularly by affecting access to hunting and fishing grounds and by changing the<br />
habitats of the animals they count on. For example, in the spring of 2012, Salluit<br />
hunters did not harvest a single seal as a result of very early ice breakup (N. Tayara,<br />
Qaqqalik Landholding Corporation, pers. comm., 2012).<br />
Navigation<br />
Deception Bay is considered an essential subsistence area for the Salluit Inuit<br />
(ARK, 1998). It is the site of fishing, hunting of marine mammals and waterfowl, and<br />
shellfish harvesting. During the winter, the Inuit develop a network of snowmobile<br />
trails for accessing their hunting grounds (map 6.6).<br />
The potential cumulative effects of constructing CRI's port infrastructures and the<br />
increase in marine traffic on traditional use of the territory are primarily more frequent<br />
fracturing of the ice cover during ship travel, increased disturbance to seal habitat<br />
and the loss of a potential shellfish harvesting area (blue mussel and Icelandic<br />
scallop).<br />
Canadian Royalties Inc.<br />
GENIVAR<br />
101-53046-02 November 2012<br />
257
Previously, it was determined that the cumulative impact of increased marine traffic<br />
on ice cover in Deception Bay and seal habitat was minor. A set of mitigation<br />
measures will also be applied to minimize the direct impacts of ship traffic on use of<br />
the territory (ice breaker passage warning protocol, maintenance of a second ice<br />
bridge, etc.). For these reasons, the cumulative impacts on traditional Inuit use of<br />
the territory are deemed to be minor.<br />
Lastly, the construction of the CRI port infrastructures will cause the loss of a<br />
potential shellfish harvesting zone. The loss is in addition to the loss that occurred<br />
when the Xstrata wharf was built, and the small jetty on Plage du Bombardier. Given<br />
the small surface area (about 9,350 m 2 ) of the cells and ballasts protecting the<br />
proposed infrastructures and the very broad availability of other potential harvesting<br />
zones in Deception Bay, the cumulative impact is deemed to be minor.<br />
In short, the port infrastructure project is unlikely to have major cumulative impacts<br />
on traditional Inuit use of the territory.<br />
8.6.3.3 Fish habitat<br />
Climate change<br />
As yet, we know little about the impacts climate change could have on the biology of<br />
Arctic fish or their habitat. First, the effects are more difficult to predict for marine and<br />
estuarine habitats, as they are more complex than fresh water habitats.<br />
For the Arctic char (anadromous species), the primary species the Inuit fish,<br />
temperature increases, changes to seasonal cycles and precipitation regimes, and<br />
changes to ocean currents could affect the availability of its food, which it obtains in<br />
the sea, facilitate or hamper migration due to heavier or lighter currents, and change<br />
the spawning and hatching periods. Habitat transformation could also create<br />
competition with other species, which could increase their ranges due to favourable<br />
conditions (e.g., an increase in water temperature) (AADNC, 2012).<br />
Port infrastructures<br />
The construction of port infrastructures in Deception Bay will modify fish habitat<br />
without causing a net loss, given the new habitat created by the ballasts protecting<br />
the sheet piling cells. No cumulative impact is expected.<br />
Canadian Royalties Inc.<br />
GENIVAR<br />
101-53046-02 November 2012<br />
258
9. ENVIRONMENTAL MONITORING AND FOLLOW-UP<br />
PROGRAMS<br />
9.1 Environmental Monitoring<br />
The environmental monitoring program includes activities designed to monitor<br />
activities that generate environmental impacts and to verify if the planned mitigation<br />
measures have been implemented and effective. These measures may have been<br />
voluntarily proposed by CRI or imposed by the federal or provincial regulatory<br />
authorities when issuing authorizations or permits for the project. More specifically,<br />
the monitoring includes the following: 1) General site monitoring; 2) Monitoring of<br />
dredging and verification of morphology (bathymetry) of the seabed dredging sites,<br />
before and after work; 3) Verification of the presence of marine mammals during<br />
dredging and the construction of the wharf.<br />
In order to ensure that all mitigation measures proposed in the present report are<br />
respected, CRI will incorporate specific provisions in the call for tender. CRI will<br />
ensure that all mitigation measures in the present ESIA are included in the plans and<br />
specifications. These provisions will be integrated in the contracts that will be<br />
awarded to contractors.<br />
9.1.1 Site Supervision<br />
During the execution of the work, the Site Supervisor shall ensure that all<br />
environmental measures are respected. The Supervisor shall also ensure the<br />
effectiveness of these measures and, if required, inform the authorities and propose<br />
alternative protective measures. An environmental monitoring form is presented in<br />
Appendix 23. This form will allow the Site Supervisor to monitor the implementation<br />
of mitigation measures. Completed forms must be sent to the regional, provincial<br />
and federal authorities upon completion of the work.<br />
9.1.2 Monitoring of Dredging Activities<br />
In addition to general monitoring, specific monitoring of the dredging activities will be<br />
carried out. The Supervisor will verify the implementation of the mitigation measures<br />
described below.<br />
Management of Work<br />
• Limit the dredged area to a minimum.<br />
• Ensure that a real-time locating system for the clamshell is used to avoid<br />
overdredging.<br />
Canadian Royalties Inc.<br />
GENIVAR<br />
101-53046-02 November 2012<br />
259
• Ensure that the bathymetry of the dredged area after dredging is conducted to<br />
verify that the slopes respect the design plans and specifications.<br />
• Stop dredging during poor weather conditions (e.g. lighting storms, strong<br />
winds).<br />
Operational Behaviour<br />
• Handle the sediments carefully so they remain as cohesive as possible.<br />
• Lift and lower the clamshell slowly and in a controlled manner.<br />
• Ensure the dredge operator is aware of the importance of manoeuvres,<br />
specifically to avoid sudden movements or when levelling the bottom using the<br />
grab sampler or the bucket.<br />
• Control the tightness of the clamshell bucket during operations.<br />
• Control the tightness of the barge compartments during operations.<br />
• Do not overload or operate the barge during poor weather conditions.<br />
• Limit the speed and movements of the dredge and the barge in shallow waters.<br />
• Do not overload the bank and the area within proximity to the shore to reduce<br />
the risk of landslides or sediment stripping.<br />
Marine Mammals<br />
• Ensure that qualified marine mammal observers are onshore during dredging.<br />
• Monitor cetaceans at least 30 minutes prior to commencing work.<br />
• Stop dredging if belugas or other marine mammals are present within 400 m of<br />
the dredge.<br />
A monitoring report shall be prepared upon completion of the work and sent to the<br />
competent authorities.<br />
9.1.3 Monitoring of Marine Mammals during Ramming<br />
The following protection and monitoring measures will be implemented to mitigate<br />
the effects of pile ramming and sheet piling on marine mammals.<br />
• Pile ramming and sheet piling will be carried out after July 15, the period of time<br />
where belugas carry out the least amount of essential biological activities;<br />
• Cetacean monitoring will be carried out at least 30 minutes prior to pile<br />
ramming;<br />
Canadian Royalties Inc.<br />
GENIVAR<br />
101-53046-02 November 2012<br />
260
• Ramming activities will begin on a gradual and continuous basis, for 20 to<br />
30 minutes, to allow cetaceans to move away from the noise source;<br />
• A passive monitoring program for the presence of marine mammals will be<br />
used to listen to their sounds using hydrophones and their electronic detection<br />
using sonars will be implemented;<br />
• An initially intensive visual monitoring program will be implemented to<br />
distinguish between passive observations (acoustic) and active observations<br />
(visual), which will facilitate the identification of passively observed organisms.<br />
Subsequently, the visual monitoring equipment shall only be used to validate<br />
the “ambiguous” passive observations;<br />
• An acoustic monitoring program for noise emitted by site activities will be<br />
implemented in order to define, in real-time, the safe perimeter (threshold<br />
of 160 dB re 1 µPa rms ), to modulate the site equipment and limit the emission of<br />
potentially disturbing noise, as well as to assess the need for additional<br />
mitigation measures.<br />
A monitoring report will be prepared upon completion of the work and sent the<br />
competent authorities.<br />
9.2 Environmental Follow-up Program<br />
The objectives of the environmental follow-up programs are to follow the evolution of<br />
certain sensitive environmental components and to verify, over a specific period of<br />
time, the accuracy of the predicted significance of the project impacts on these<br />
components. The follow-up programs also determine if the impacts were accurately<br />
identified and assess the effectiveness of the implemented mitigation measures.<br />
They generally include a series of studies and field surveys to observe the changes<br />
to the components induced by the project or measure certain parameters. The<br />
proposed follow-up programs are described below.<br />
9.2.1 Dredging<br />
The effectiveness of the mitigation measures, aimed to limit the resuspension of<br />
sediments and their dispersion, will be largely related to the weather conditions that<br />
will prevail during dredging. Considering it is impossible to predict the weather and,<br />
consequently, the behaviour of the dispersion plume, 2 follow-up programs are<br />
proposed. The objectives of each program are presented below. Details and<br />
program methodologies will be defined at a later date and submitted to the<br />
competent authorities for approval.<br />
Canadian Royalties Inc.<br />
GENIVAR<br />
101-53046-02 November 2012<br />
261
9.2.1.1 Follow-up of Suspended Solids Concentrations<br />
CRI will carry out the follow-up of suspended solid (SS) concentrations at the<br />
dredging site (Q1) and at Deception Bay which will enable:<br />
To monitor the evolution of SS concentrations over time;<br />
To monitor the turbidity plume;<br />
To determine, in terms of SS measurements, which areas of Deception Bay were<br />
most affected by the increase in SS concentrations;<br />
To delineate the benthic habitats most susceptible to sedimentation.<br />
9.2.1.2 Follow-up of Benthic Habitats<br />
CRI will monitor benthic habitats at Site Q1, which will be located in the immediate<br />
vicinity of dredging, where the increase in SS concentrations will be at their peak and<br />
where sedimentation is presumed to be significant. The monitoring will cover other<br />
benthic habitats susceptible to sedimentation, if required. As mentioned above, the<br />
habitats will be located through SS concentration monitoring at Deception Bay during<br />
dredging work.<br />
Follow-up of benthic habitats will enable:<br />
• To assess the importance of sedimentation on benthic communities and aquatic<br />
grass beds;<br />
• To estimate the time required for habitats to be restored;<br />
• To determine if the benthic communities and the aquatic grass that recolonize<br />
the disturbed sites have characteristics similar to those preceding them.<br />
9.2.2 Reconstitution of Habitats on Ripraps<br />
A follow-up program will be implemented to verify the recovery of aquatic habitats on<br />
the sheet piles riprap protections. More specifically, this program will follow the<br />
evolution of the colonization of the aquatic vegetation and the epibenthos using<br />
quantitative indicators (numbers of species, coverage percentage, diversity, etc.).<br />
The follow-up will also verify how often fish frequent the ripraps.<br />
This follow-up will be carried out over a 7-year period and will begin 1 year after the<br />
construction of marine infrastructures. Measurements and field surveys will be<br />
carried out in the month of August in years 1, 3, 5 and 7 following the construction of<br />
port infrastructures. A report will be completed for each year monitored. A detailed<br />
follow-up protocol will be submitted to the competent authorities for approval.<br />
Canadian Royalties Inc.<br />
GENIVAR<br />
101-53046-02 November 2012<br />
262
9.2.3 Sediment Disposal Site<br />
A follow-up program of surface water is proposed to ensure that resurgent water<br />
from the sediment disposal site respects the surface water quality criteria and the<br />
proposed measures to control the suspended solids are effective.<br />
Surface water monitoring is recommended as follows:<br />
• During landfill construction and sediment disposal, if water is present, a<br />
surface water sample should be collected weekly from the sampling locations<br />
shown on Plan 101-53046-02_F01 to analyze for suspended solids, petroleum<br />
hydrocarbons C 10 –C 50 as well as electrical conductivity.<br />
• During sedimentation, this frequency can be reduced to one sample per month<br />
for each sampling point in the event that none of the samples exceeded the limit<br />
values presented in Table 9.1 for two consecutive weeks. This reduction will<br />
remain in effect as long as the monthly measurements shows that the limit<br />
values are respected; should the limit values be exceeded, the frequency of<br />
measurements should be increased to once a week until the situation is rectified<br />
for two consecutive weeks.<br />
Table 9.1<br />
Limit Values<br />
Parameters<br />
Acceptable Average Monthly Acceptable Maximum<br />
Concentration<br />
Concentration<br />
Petroleum Hydrocarbons C 10 -C 50 ---- 2 mg/l<br />
Suspended Solids (SS) 15 mg/l 30 mg/l<br />
Electrical Conductivity ---- ----<br />
The sedimentation period is defined as the period in which the salt water in the<br />
dredged sediments is released. The electrical conductivity is an indicator parameter<br />
used to identify this period. The maximum SS concentration was set at 30 mg/l, a<br />
maximum increase of 25 mg/L compared to the natural SS concentration of the<br />
water at Deception Bay which was measured at 5 mg/l (MDDEFP, 2012).<br />
This follow-up program may be stopped should the analytical results show no<br />
exceedances of the limit values in Table 9.1 for the parameters analyzed for at least<br />
two consecutive years subsequent to the sedimentation period.<br />
Analyses shall be carried out by an MDDEP certified laboratory, in accordance with<br />
Section 18.6 of the EQA. All water samples shall be collected in accordance with the<br />
guidelines of the most recent version of the Guide d’échantillonnage for<br />
environmental analyses published by the MDDEP.<br />
Canadian Royalties Inc.<br />
GENIVAR<br />
101-53046-02 November 2012<br />
263
CRI shall ensure that the results and measurements obtained be recorded in a report<br />
describing the sampling methodology (points, locations, instruments, and laboratory)<br />
and a confirmation certifying that the samples were collected in accordance with the<br />
applicable regulations.<br />
The results obtained and measurements carried out as a part of this follow-up<br />
program and environmental monitoring will be included in the annual report<br />
submitted to the Regional Director of the MDDEP.<br />
9.2.4 Navigation in Deception Bay<br />
In accordance with Condition 3.4 included in the Certificate of Authorization issued<br />
in 2008 by the MDDEP for the NNI Project and upon the Federal Administrator’s<br />
decision, also issued in 2008, CRI implemented a follow-up program for the marine<br />
navigation in Deception Bay. The protocol is presented in Appendix 24.<br />
Canadian Royalties Inc.<br />
GENIVAR<br />
101-53046-02 November 2012<br />
264
10. RÉFÉRENCES<br />
ACIA, 2005. Arctic Climate Impact Assessment. Cambridge : Cambridge University<br />
Press, 1042 p. http://www.acia.uaf.edu, Chapter 8, 9, 18.<br />
ADMINISTRATION RÉGIONALE KATIVIK (ARK). 1998. Plan directeur<br />
d’aménagement des terres de la région Kativik. Les grandes orientations<br />
d’aménagement et les affectations du territoire. Service de l’environnement<br />
et de l’aménagement du territoire. 67 p. En ligne :<br />
http://geoportal.krg.ca/public/dasCommunity.jsp<br />
Consulté le 21 septembre 2012.<br />
ADMINISTRATION RÉGIONALE KATIVIK, 2012. Administration régionale Kativik,<br />
renseignements généraux. En ligne : http://www.krg.ca/fr/renseignementsgeneraux-krg<br />
Consulté le 18 septembre 2012.<br />
ADMINISTRATION RÉGIONALE KATIVIK, 2010. Rapport Annuel. Kuujjuaq, 170 p.<br />
ADMINISTRATION RÉGIONALE KATIVIK, 2009. Entente – Asphaltage au Nunavik<br />
2010-2014. Rapport produit par l’ARK, 12 p.<br />
ADMINISTRATION RÉGIONALE KATIVIK, 2008. Les changements climatiques au<br />
Nunavik et au Nord du Québec : L’accès au territoire et aux ressources.<br />
Rapport final présenté aux Iniatives des écosystèmes nordiques,<br />
Environnement Canada. Soumis par : Martin Tremblay et Christopher<br />
Furgal, Université Trent. Kuujjuaq, 31 mars 2008, 99 p. et annexes.<br />
ADMINISTRATION RÉGIONALE KATIVIK, 1998. Plan directeur d’aménagement<br />
des terres de la région Kativik. Les grandes orientations d’aménagement et<br />
les affectations du territoire. Service de l’environnement et de<br />
l’aménagement du territoire. Kuujjuaq : Administration régionale Kativik,<br />
67 p.<br />
ADMINISTRATION RÉGIONALE KATIVIK ET SOCIÉTÉ MAKIVIK, 2011. Plan<br />
Nunavik. Kuujjuaq : Institut Culturel Avataq, 141 p. En ligne :<br />
http://www.makivik.org/wp-content/uploads/2012/06/Plan-Nunavik-<br />
06_20.pdf. Consulté le 10 octobre 2012.<br />
AFFAIRES AUTOCHTONES ET DÉVELOPPEMENT DU NORD CANADA, 2012.<br />
L'outil de gestion de l'environnement et des ressources pétrolières<br />
(OGERP). Informations contextuelles sur les composantes valorisées de<br />
l'OGERP - l'Arctique de l'Est. Site internet : http://www.aadncaandc.gc.ca/fra/1315676277753/1315676351336#cli.<br />
Consulté le 13 novembre 2012.<br />
Canadian Royalties Inc.<br />
GENIVAR<br />
101-53046-02 November 2012<br />
265
AFFAIRES AUTOCHTONES ET DÉVELOPPEMENT DU NORD CANADA. 2010.<br />
Convention de la Baie James et du Nord Québécois et La Convention du<br />
Nord-Est québécois. Rapport annuel 1998-1999. Rapport annuel 1999-<br />
2000. En ligne<br />
http://www.aadnc-aandc.gc.ca/DAM/DAM-INTER-HQ/STAGING/textetext/cin00_1100100030849_fra.pdf.<br />
Consulté le 21 septembre 2012.<br />
AIR INUIT, 2012. À propos d’Air Inuit. En ligne http://www.airinuit.com/fr/History.aspx<br />
Consulté le 24 septembre 2012.<br />
ALLARD, M., CALMELS, F., FORTIER, D., LAURENT, C., L’HÉRAULT, E. ET<br />
VINET, F. 2007. Cartographie des conditions de pergélisol dans les<br />
communautés du Nunavik en vue de l’adaptation au réchauffement<br />
climatique. Centre Ouranos. 42 p.<br />
ALLARD, M., FORTIER, R., GAGNON, R. ET MICHAUD, Y., 2004. Salluit : Une<br />
communauté en croissance sur un terrain sensible au changement<br />
climatique. Québec : Université Laval et Commission géologique, 101 p.<br />
ALLARD, M., FORTIER, R., GAGNON, O. AND MICHAUD, Y. 2004. Problématique<br />
du développement du village de Salluit, Nunavik. Salluit: Une communauté<br />
en croissance sur un terrain sensible au changement climatique. Université<br />
Laval, Québec 84 pages.<br />
ALLARD, M, M. LEMAY, C. LARRIVÉE, M. TREMBLAY, T. ANNANACK, J. LAMPE.<br />
2007. Initiating the Eastern Subarctic IRIS Approach. Internet.<br />
http://www.arcticnet.ulaval.ca/pdf/talks2007/Allard.pdf.<br />
ANCTIL, M. 2008. Les faits saillants de l’enquête. Enquête de santé auprès des<br />
Inuits du Nunavik 2004, Qanuippitaa? Comment allons-nous? Québec :<br />
Institut national de santé publique du Québec (INSP) et Régie régionale de<br />
la santé et des services sociaux du Nunavik (RRSSSN).<br />
ASSOCIATION DES CORPORATIONS FONCIÈRES DU NUNAVIK, 2006. Page<br />
principale du site. En ligne http://www.nlhca.com/<br />
Consulté le 18 septembre 2012<br />
ARTEFACTUEL, 2012. EIES pour l’aménagement d’infrastructures portuaires et la<br />
gestion des sédiments à la baie Déception. Volet archéologique. 33 p.<br />
ARTEFACTUEL, 2012. Projet Nunavik Nickel. Fouille et évaluation du site Ka-Fi-1<br />
(baie Déception, Nunavik). 56 p.<br />
Canadian Royalties Inc.<br />
GENIVAR<br />
101-53046-02 November 2012<br />
266
BEAULIEU, N., ALLARD, M. 2003. The impact of climate change on an emerging<br />
coastline affected by discontinuous permafrost: Manitounuk Strait, northern<br />
Quebec. Canadian Journal of Earth Sciences. 40:1393-1404.<br />
BENOIT, C. 2004. L’entente Raglan: outil efficace pour favoriser la formation et<br />
l’emploi inuit? Évaluation et documentation de la situation de l’emploi des<br />
Inuits à la mine Raglan, au Nunavik, dans le cadre de l’entente sur les<br />
impacts et bénéfices. Montréal : Université du Québec à Montréal, 171 p.<br />
BLONDEAU, M. 2004. Atlas des plantes des villages du Nunavik. En collaboration<br />
avec C. Roy, A. Cuerrier et l’Institut culturel Avataq. Éditions MultiMondes,<br />
Sainte-Foy, Québec. 610 p.<br />
BOURDAGES, H., LESAGE, V., HAMMILL, M.O., DE MARCH, B. 2002. Impact of<br />
harvesting on population trends of beluga in eastern Hudson Bay. Research<br />
document 2002/036. Canadian Science Advisory Secretariat. Fisheries and<br />
Oceans Canada. 46 p. En ligne http://www.dfo-mpo.gc.ca/csas/). Consulté<br />
le 6 septembre 2006.<br />
BIOREX Inc., 1999. Caractérisation biophysique et des usages d’un secteur retenu<br />
pour la détermination d’une zone de protection marine dans l’estuaire du<br />
Saint-Laurent, volume 2. Les mammifères marins et leurs principales<br />
ressources alimentaires.<br />
BOWEN, W. D., 2006. Ministère des Pêches et des Océans Institut<br />
océanographique de Bedford.<br />
BRAY, R.N., A.D. BATES et J.M. LAND. 1997. Dredging – A handbook for<br />
engineers. 2e édition. Butterworth-Heinemann, Boston. 434 p.<br />
BRAY, R.N. – Editor. 2008. Environmental Aspects of Dredging. Taylor & Francis<br />
Group. 386 p.<br />
CANADIAN ROYALTIES, 2012. À propos de Canadian Royalties. En ligne<br />
http://www.canadianroyalties.com/fr/ Consulté le 24 septembre 2012 :<br />
CEMAM, 2006. Recherche sur les mammifères marins, Un aperçu. Rapport Pêches<br />
et Océans Canada. 78 p.<br />
COMMISSION DE L’ENVIRONNEMENT KATIVIK, 2008. Décision relative au projet<br />
nickélifère Nunavik Nickel par Canadian Royalties Inc. 40 pages. En ligne<br />
http://www.mddep.gouv.qc.ca/evaluations/projet/maj/Decision-CQEK.pdf<br />
Consulté le 5 octobre 2012.<br />
Canadian Royalties Inc.<br />
GENIVAR<br />
101-53046-02 November 2012<br />
267
COMMISSION SCOLAIRE KATIVIK, 2012. À propos de la CSK. Consulté le<br />
18/09/2012 : http://www.kativik.qc.ca/fr/a-propos-de-la-csk<br />
COMMISSION DE L’ENVIRONNEMENT KATIVIK, 2008. Décision relative au projet<br />
nickélifère Nunavik Nickel par Canadian Royalties Inc. 40 pages. En ligne<br />
http://www.mddep.gouv.qc.ca/evaluations/projet/maj/Decision-CQEK.pdf<br />
Consulté le 5 octobre 2012.<br />
CONFÉRENCE DES MINISTRES DE L’ÉNERGIE ET DES MINES, 2005. Rapport<br />
d’activités 2004-2005 pour le Nunavik, Fonds d’exploration minière du<br />
Nunavik, 7 p.<br />
CONSEIL DU STATUT DE LA FEMME, 2005. Les conditions de vie des femmes<br />
dans le Nord-du-Québec, 2004. Collection Femmes et développement des<br />
régions, 51 p.<br />
CONSEIL RÉGIONAL DE DÉVELOPPEMENT KATIVIK, 1998. Stratégie de<br />
développement pour la région Kativik, Kuujjuaq, septembre 1998, 33 p.<br />
COSEPAC, 2012. Comité sur les espèces en péril au Canada En ligne<br />
http://www.cosewic.gc.ca/fra/sct0/rpt/rpt_csar_f.pdf. Consulté le 11 octobre<br />
2012.<br />
COSEPAC. 2011. Espèces sauvages canadiennes en péril. Comité sur la situation<br />
des espèces en péril au Canada. 104 p.<br />
COSEPAC. 2006. Espèces canadiennes en péril. Comité sur la situation des<br />
espèces en péril au Canada. 82 p.<br />
COSEPAC, 2005. Évaluation et Rapport de situation du COSEPAC sur la<br />
baleine boréale (Balaena mysticetus) au Canada – Mise à jour. Comité sur<br />
la situation des espèces en péril au Canada. Ottawa. viii + 57 p.<br />
(www.registrelep.gc.ca/status/status_f.cfm).<br />
COSEPAC, 2004a. Évaluation et Rapport de situation du COSEPAC sur le béluga<br />
(Delphinapterus leucas) au Canada – Mise à jour. Comité sur la situation<br />
des espèces en péril au Canada. Ottawa. x + 77 p.<br />
COSEPAC, 2002. http://www.cosewic.gc.ca/fra/sct1/searchdetail_f.cfm.<br />
CSIRO Marine and Atmospheric Research. 2012. Sea level rise: understanding the<br />
past - Improving projections for the future. IPCC AR4 sea-level projections -<br />
an update. http://www.cmar.csiro.au/sealevel/sl_proj_21st.html. Consulté le<br />
2 octobre 2012.<br />
Canadian Royalties Inc.<br />
GENIVAR<br />
101-53046-02 November 2012<br />
268
DAIGNEAULT, R.-A. 1997. Géologie et géomorphologie de la région du cratère du<br />
Nouveau-Québec, Nunavik. Rapport préparé pour le ministère de<br />
l’Environnement et de la Faune, Direction des parcs québécois. 117 p. +<br />
annexes.<br />
DESSAU INC. 2010. Programme de surveillance et de suivi environnemental des<br />
travaux de dragage au quai de Rivière-du-Loup, 2009. Rapport final remis à<br />
la Société des traversiers du Québec. 46 p. et annexes<br />
DIRECTEUR GÉNÉRAL DES ÉLECTIONS DU QUÉBEC, 2011. Référendum sur la<br />
création du gouvernement régional du Nunavik, article paru en ligne le 28<br />
avril 2011. Consulté en ligne le 18/09/2012 :<br />
http://www.electionsquebec.qc.ca/francais/actualite-detail.php?id=3930<br />
DUHAIME, G. et V. ROBICHAUD, 2010. « L’économie du Nunavik entre 1983 et<br />
2003 », Recherches sociographiques, vol. 51, no 1-2, 2010, p. 45-73.<br />
DUHAIME, G., 2009. La pauvreté au Nunavik : État des connaissances. Québec :<br />
Université Laval et Chaire de recherche du Canada en condition autochtone<br />
comparée, 46 p.<br />
DUHAIME, G., 2008. Profil socioéconomique du Nunavik. Québec : Université Laval<br />
et Chaire condition autochtone, 71 p.<br />
DUHAIME, G. et V. ROBICHAUD, 2007. Portrait économique du Nunavik. Université<br />
Laval. Chaire de recherche du Canada sur la condition autochtone<br />
comparée.<br />
DUHAIME, G., 2004. La situation économique du Nunavik et l’avenir de l’État,<br />
Québec, Chaire de recherche du Canada sur la condition autochtone<br />
comparée, Centre interuniversitaire d’études et de recherches autochtones,<br />
Université Laval, collection Recherche en ligne, 9 p.<br />
DUTIL, D., 2010. La situation du logement et des ménages dans la région<br />
administrative du Nord-du-Québec, Bulletin d’information de la société<br />
d’habitation du Québec, vol. 4, no. 3, 12 p.<br />
EMPLOYMENT, TRAINING, INCOME SUPPORT AND CHILD CARE<br />
DEPARTMENT, 2006. Jobs in Nunavik in 2005. Kativik Regional<br />
Government, 62 p.<br />
ENVIRONNEMENT Canada, 2004. En ligne http://www.dfo-mpo.gc.ca/speciesspeces/<br />
species/species_bowheadwhale_eastartic_f.asp<br />
Canadian Royalties Inc.<br />
GENIVAR<br />
101-53046-02 November 2012<br />
269
ENVIRONNEMENT CANADA. 2002a. Guide d’échantillonnage des sédiments du<br />
Saint-Laurent pour les projets de dragage et de génie maritime. <strong>Volume</strong> 1 :<br />
Directives de planification. Environnement Canada, Direction de la<br />
Protection de l’environnement, Région du Québec, Section innovation<br />
technologique et secteurs industriels. Rapport. 106 p.<br />
ENVIRONNEMENT CANADA. 2002 b. Guide d’échantillonnage des sédiments du<br />
Saint-Laurent pour les projets de dragage et de génie maritime. <strong>Volume</strong> 2 :<br />
Manuel du praticien. Environnement Canada, Direction de la Protection de<br />
l’environnement, Région du Québec, Section innovation technologique et<br />
secteurs industriels. Rapport. 107 p.<br />
ENVIRONNEMENT CANADA ET MINISTÈRE DU DÉVELOPPEMENT DURABLE,<br />
DE L’ENVIRONNEMENT ET DES PARCS DU QUÉBEC (MDDEP). 2007.<br />
Critères pour l’évaluation de la qualité des sédiments au Québec et cadres<br />
d’application : prévention, dragage et restauration. 39 p.<br />
ENVIRONNEMENT CANADA. 2012. Service canadien des glaces. Internet.<br />
http://www.ec.gc.ca/glaces-ice/default.asp?lang=Fr&n=D32C361E-1.<br />
ENVIRONNEMENT CANADA. 1994. Répercussions environnementales du dragage<br />
et de la mise en dépôt des sédiments. Document préparé par Les<br />
Consultants Jacques Bérubé inc. pour la Section du développement<br />
technologique. Direction de la protection de l’environnement, régions du<br />
Québec et de l’Ontario. 109 p.<br />
FAPAQ. 2000. Parc des Pingualuit, État des connaissances. Direction de la<br />
planification et du développement des parcs québécois. 133 p.<br />
FESTA-BIANCHEt, M., RAY, J.C., BOUTIN, S. et A.GUNN, 2011. Conservation of<br />
caribou (Rangifer tarandus) in Canada: an Uncertain Future. P. 419-433.<br />
Canadian Journal of Zoology En ligne www.nrcresearchpress.com/cjz<br />
Consulté le 10 octobre 2012.<br />
FRIEDLAENDER, A.S., JOHNSTON, D.W., FINK, S.L., LAVIGNE, D.M. 2007.<br />
Variation in ice Cover on the East Coast of Canada, February-march, 1969-<br />
2006: implications for harp and hooded seals. IFAW Technical <strong>Report</strong><br />
2007-1.<br />
GENIVAR, 2012a. Étude d’impact environnementale et sociale pour l’aménagement<br />
d’infrastructures portuaires et la gestion des sédiments à la baie Déception.<br />
Modélisation hydrodynamique de la baie Déception. Rapport de GENIVAR<br />
à Canadian Royalties Inc. 32 p. et annexes.<br />
Canadian Royalties Inc.<br />
GENIVAR<br />
101-53046-02 November 2012<br />
270
GENIVAR, 2012b. Étude d’impact sur l’environnement et le milieu social pour<br />
l’aménagement d’infrastructures portuaires et la gestion des sédiments à la<br />
baie Déception. Caractérisation de l’environnement sonore sous-marin -<br />
2012. Rapport de GENIVAR à Canadian Royalties Inc. 47 p. et annexes.<br />
GENIVAR, 2012c. Étude d’impact environnementale et sociale pour l’aménagement<br />
d’infrastructures portuaires et la gestion des sédiments à la baie Déception.<br />
Inventaire des espèces vasculaires menacées ou vulnérables. Rapport<br />
sectoriel. Rapport de GENIVAR à Canadian Royalties Inc. 32 p. et annexes.<br />
GENIVAR, 2012d. Étude d’impact environnementale et sociale pour l’aménagement<br />
d’infrastructures portuaires et la gestion des sédiments à la baie Déception.<br />
Rapport sectoriel sur la faune aviaire. Rapport de GENIVAR à Canadian<br />
Royalties Inc. 32 p. et annexes.<br />
GENIVAR, 2012e. Étude d’impact environnementale et sociale pour l’aménagement<br />
d’infrastructures portuaires et la gestion des sédiments à la baie Déception.<br />
Étude d’intégration au milieu visuel. Rapport sectoriel. Rapport de<br />
GENIVAR à Canadian Royalties Inc. 32 p. et annexes.<br />
GENIVAR, 2012f. Étude d’impact environnementale et sociale pour l’aménagement<br />
d’infrastructures portuaires et la gestion des sédiments à la baie Déception.<br />
Inventaire des espèces vasculaires menacées ou vulnérables. Rapport<br />
sectoriel. Rapport de GENIVAR à Canadian Royalties Inc. 19 p. et annexes.<br />
GENIVAR, 2011. Construction d’infrastructures portuaires pour les activités du projet<br />
Nunavik Nickel – Rapport principal – Étude d’impact sur l’environnement et<br />
le milieu social. Rapport de GENIVAR Société en commandite pour<br />
Canadian Royalties inc., 158 p. et annexes<br />
GENIVAR, 2008a. Étude d'impact sur l'environnement et le milieu social - Rapport<br />
sectoriel final - Inventaires 2006 et 2007 dans la baie Déception. Rapport<br />
préparé pour Canadian Royalties Inc. 60 p. et annexes.<br />
GENIVAR, 2008b. Projet Nunavik Nickel. Étude d’impact sur l’environnement et le<br />
milieu social. Réponses aux questions – 2 e série. Présenté à l’Agence<br />
canadienne d’évaluation environnementale. Questions et commentaires de<br />
Pêches et Océans Canada, Transports Canada et Environnement Canada.<br />
34 p.<br />
GENIVAR, 2007a. Projet nickélifère Raglan Sud – Rapport principal – Étude<br />
d’impact sur l’environnement et le milieu social. Rapport de GENIVAR<br />
Société en commandite pour Canadian Royalties inc., 649 p. et annexes.<br />
Canadian Royalties Inc.<br />
GENIVAR<br />
101-53046-02 November 2012<br />
271
GENIVAR, 2007b. Projet Nunavik Nickel – Étude sur la navigation maritime dans la<br />
baie Déception - Impacts sur les mammifères marins et les activités<br />
traditionnelles Inuites. Rapport final – Révision no 1 - Rapport sectoriel –<br />
Étude d’impact sur l’environnement et le milieu social. Rapport de<br />
GENIVAR pour Canadian Royalties inc.75 p. et annexes.<br />
GENIVAR, 2007c. Projet Nickélifère Raglan Sud – Caractérisation des sols et des<br />
roches. Rapport sectoriel final – Étude d’impact sur l’environnement et le<br />
milieu social. Rapport de GENIVAR pour Canadian Royalties inc. 106 p. et<br />
annexes.<br />
GERARDIN, V. ET MCKENNEY, D. 2001. Une classification climatique du Québec à<br />
partir de modèles de distribution spatiale de données climatiques<br />
mensuelles: vers une définition des bioclimats du Québec. Dans<br />
Contribution du Service de la cartographie écologique, Québec, p. 39.<br />
GOLDER. 2007. Interim kinetic test results on waste rock samples. Raglan South<br />
Nickel Project, Nunavik, Québec. Technical memorandum prepared for<br />
Canadian Royalties inc. February 2007.<br />
GOUVERNEMENT DU QUEBEC. 2012. Arrêté ministériel concernant la publication<br />
d’une liste d’espèces de la flore vasculaire menacées ou vulnérables<br />
susceptibles d’être ainsi désignées et concernant la publication d’une liste<br />
des espèces de la faune menacées ou vulnérables susceptibles d’être ainsi<br />
désignées [c. E-12.01, r. 4]. Annexe 1. Liste des espèces floristiques<br />
menacées ou vulnérables susceptibles d’être ainsi désignées. Les<br />
Publications du Québec, Éditeur officiel du Québec, 1 er juillet 2012, 11 p.<br />
GOUVERNEMENT DU QUÉBEC, 2012a. Loi sur le régime des terres dans les<br />
territoires de la Baie-James et du Nouveau-Québec. En ligne<br />
http://www2.publicationsduquebec.gouv.qc.ca/dynamicSearch/telecharge.p<br />
hp?type=2&file=/R_13_1/R13_1.html. Consulté le 18 septembre 2012.<br />
GOUVERNEMENT DU QUÉBEC, 2012b. Loi sur les villages nordiques et<br />
l’administration régionale Kativik. L.Q.R., chapitre V-6.1. En ligne<br />
http://www2.publicationsduquebec.gouv.qc.ca/dynamicSearch/telecharge.p<br />
hp?type=2&file=/V_6_1/V6_1.html. Consulté le 18 septembre 2012.<br />
GOUVERNEMENT DU QUÉBEC, 2011. Faire le Nord ensemble : le chantier d’une<br />
génération. Québec : Ministère des Ressources naturelles et de la Faune,<br />
156 p. En ligne http://plannord.gouv.qc.ca/documents/plan-action.pdf<br />
Consulté le 10 octobre 2012.<br />
Canadian Royalties Inc.<br />
GENIVAR<br />
101-53046-02 November 2012<br />
272
GOUVERNEMENT DU QUÉBEC, 2008. Le Nunavik ou la terre où vivre.<br />
Développement social, juin 2008, vol. 9, no. 1, 72 p.<br />
GOUVERNEMENT DU QUÉBEC, 2008. Le Nunavik ou la terre où vivre.<br />
Développement social, juin 2008, vol. 9, no. 1, 72 p.<br />
GRAY, J.T., DE BOUTRAY, B., HILLAIRE-MARCEL, C., AND LAURIOL, B. 1980.<br />
Postglacial emergence of the west coast of Ungava Bay, Quebec. Arctic<br />
and Alpine Research, 12: 19-30.<br />
GRAY, J. B. LAURIOL, D. BRUNEAU, J. RICARD. 1993. Postglacial emergence of<br />
Ungava Peninsula, and its relationship to glacial history. Can. J. Earth<br />
Sci. 30, 1676-1696.<br />
GRAY, J.S. et M. ELLIOTT. 2009. Ecology of marine sediments : from science to<br />
management. 2e édition. Oxford University Press, New York. 225 p.<br />
GRAY ET SEPPALA. 1991. Deeply Dissected Tundra Polygons on a Glacio-Fluvial<br />
Outwash Plain, Northern Ungava Peninsula, Québec. Géographie physique<br />
et Quaternaire. 45 :111-117<br />
HAMMILL, M.O., LESAGE, V. 2005. Évaluation du stock de beluga du<br />
Nord-du-Québec (Nunavik) (Delphinapterus leucas). Pêches et Océans<br />
Canada, région du Québec. 12 p.<br />
HAMMILL, M.O., STENSON, G., 2005. Abundance of Northwest Atlantic harp seals<br />
(1960-2005). Fisheries and Oceans Canada. Canadian Science Advisory<br />
Secretariat. Document 2005/090. 15 p. + tableaux + figures.<br />
HEGMANN, G., COCKLIN, C., CREASEY, R., DUPUIS, S., KENNEDY, A.,<br />
KINGSLEY, L., ROSS, W., SPALING, H., STALKER, D. 1999. Évaluation<br />
des effets cumulatifs, Guide du praticien. Rédigé par AXYS Environmental<br />
Consulting Ltd. et le groupe de travail sur l'évaluation des effets cumulatifs<br />
à l'intention de l'Agence canadienne d'évaluation environnementale, Hull,<br />
Québec.<br />
HERBICH, J.B. 1992. Handbook of dredging engineering. McGraw-Hill Inc.,<br />
Montréal. Pagination multiple.<br />
ILLINWORTH & RODKIN INC. 2007. Compendium of pile driving sound dta. Préparé<br />
pour California Department of Transportation. Sacramento, Californie.<br />
129 p.<br />
Canadian Royalties Inc.<br />
GENIVAR<br />
101-53046-02 November 2012<br />
273
INSTITUT NATIONAL DE SANTÉ PUBLIQUE DU QUÉBEC, 2006. Portrait de santé<br />
du Québec et de ses régions 2006 : les statistiques – Deuxième rapport sur<br />
l’état de santé de la population du Québec. Québec : Gouvernement du<br />
Québec, 659 p.<br />
IPCC, 2007. Climate change 2007 : Working Group I : The Physical Science Basis.<br />
http://www.ipcc.ch/publications_and_data/ar4/wg1/en/spmsspm-projectionsof.html.<br />
Consulté le 18 septembre 2012.<br />
JEAN, D., LAMONTAGNE, G. 2004. Plan de gestion du caribou (Rangifer tarandus)<br />
dans la région du Nord-du-Québec 2004-2010. Ministère des Ressources<br />
naturelles et de la Faune – Secteur Faune Québec, Direction de<br />
l’Aménagement de la faune du Nord-du-Québec. 86 p. En ligne<br />
http://www.mrn.gouv.qc.ca/publications/faune/caribous_plan_gestion_2004<br />
_2010.pdf Consulté le 5 octobre 2012.<br />
JOHNSTON, D.W., FRIEDLAENDER, A.S., TORRES, L.G., LAVIGNE, D.M., 2005.<br />
Variation in sea ice cover o the east coast of Canada from 1969 to 2002 :<br />
climate variability and implications for harp and hooded seals. Climate<br />
Research 29:209-222.<br />
KUMAR, P. (éditeur) 2010. The economics of ecosystems and biodiversity –<br />
Ecological and economic foundations. Earthscan, Washington, DC. 306 p.<br />
et annexes.<br />
L’HERAULT, M. 2009. Contexte climatique critique favorable au déclenchement de<br />
ruptures de mollisol dans la vallée de saluit, nunavik. Mémoire de maîtrise,<br />
Université LAval. Québec. 135 pages+annexes.<br />
LABORATOIRE D’EXPERTISE DU QUÉBEC. 2007. Étude géotechnique sur les<br />
forages réalisés dans la baie Déception. Rapport no 4264-09-02 du<br />
Laboratoire d’Expertise du Québec présenté à GENIVAR.<br />
LAIST, D. W., KNOWLTON, A. R., MEAD, J. G., COLLET, A. S., PODESTA, M.,<br />
2001. Collisions between ships and whales, Marine Mammal Science,<br />
vol. 17, no 1, pp. 35-75<br />
LANDRY, B., MERCIER, M. 1992. Notions de géologie. Modulo éditeur (3e édition).<br />
565 p.<br />
LAURIOL, B., A. CHAMPOUX ET J.T. GRAY. Répartition estivale des surfaces<br />
enneigées en Ungava, Nouveau-Québec. Géographie physique et<br />
Quaternaire, 38 : 37-47.<br />
Canadian Royalties Inc.<br />
GENIVAR<br />
101-53046-02 November 2012<br />
274
LAVIGNE, D. M., 2006. Notes for a presentation to the Standing Committee on<br />
Fisheries and Oceans, House of Commobns, Ottawa. Tuesday, 12<br />
December 2006. International Fund for Animal Welfare, Guelph, Canada.<br />
12 pp.<br />
LAVOIE, C., M. ALLARD. 2008. (remplacer par : Lavoie. C. 2006. Géomorphologie<br />
et quaternaire du lac guillaume-delisle, Nunavik, Canada. Thèse de<br />
docotrat, université laval. 123 p.<br />
HAMMILL, M.O., LESAGE, V. 2005. Évaluation du stock de beluga du<br />
Nord-du-Québec (Nunavik) (Delphinapterus leucas). Pêches et Océans<br />
Canada, région du Québec. 12 p.<br />
INSTITUT NATIONAL DE SANTÉ PUBLIQUE DU QUÉBEC, 2006. Portrait de santé<br />
du Québec et de ses régions 2006 : les statistiques – Deuxième rapport sur<br />
l’état de santé de la population du Québec. Québec : Gouvernement du<br />
Québec, 659 p.<br />
JEAN, D., LAMONTAGNE, G. 2004. Plan de gestion du caribou (Rangifer tarandus)<br />
dans la région du Nord-du-Québec 2004-2010. Ministère des Ressources<br />
naturelles et de la Faune – Secteur Faune Québec, Direction de<br />
l’Aménagement de la faune du Nord-du-Québec. 86 p. En ligne<br />
http://www.mrn.gouv.qc.ca/publications/faune/caribous_plan_gestion_2004<br />
_2010.pdf Consulté le 5 octobre 2012.<br />
LÉVESQUE, R., ALLARD, M., SÉGUIN, M. K., P. J. 1990. Données préliminaires sur<br />
le régime thermique du pergélisol dans quelques localités du Nunavik,<br />
Québec. Proceedings, 5th Canadian Permafrost Conference. C. d. é.<br />
Nordiques. Université Laval, Québec. 54: 207-213.<br />
LINDHOLM, J.B., P.J. AUSTER et L.S. KAUFMAN. 1999. Habitat-mediated<br />
survivorship of juvenile (0-year) Atlantic cod Gadus morhua. Marine<br />
Ecology Progress Series 180 : 247-255.<br />
MARTIN, T., 2003. De la banquise au congélateur. Mondialisation et culture au<br />
Nunavik, Sainte-Foy, Les Presses de l’Université Laval, 202 p.<br />
McCAULEY, R. D., FEWTRELL, J., DUNCAN, A. J. JENNER, C., JENNER, M-N.,<br />
PENROSE, J.D., PRINCE, R.I.T., ADHITYA, A., MURDOCH, J. MCCABE,<br />
K., 2000a. Marine seismic surveys: analysis and propagation of air-gun<br />
signals; and effects of air-gun exposure on humpback whales, sea turtles<br />
fishes and squid. Curtin University of Technology, Project CMST 163,<br />
<strong>Report</strong> R99-15, 198 pages.<br />
Canadian Royalties Inc.<br />
GENIVAR<br />
101-53046-02 November 2012<br />
275
McCAULEY, R.D., FEWTRELL, J., DUNCAN, A.J. JENNER, C., JENNER, M-N.,<br />
PENROSE, J.D., PRINCE, R.I.T., ADHITYA, A., MURDOCH, J., MCCABE,<br />
K., 2000b. Marine seismic surveys-a study of environmental implications.<br />
APPEA Journal, 40, 692-708.<br />
MINISTÈRE DU DÉVELOPPEMENT DURABLE, DE L’ENVIRONNEMENT DE LA<br />
FAUNE ET DES PARCS. 2012. Critères de qualité de l’eau de surface. En<br />
ligne :http://www.mddep.gouv.qc.ca/eau/criteres_eau/index.asp. Consulté le<br />
6 novembre 2012.<br />
MDDEP, 2008. Certificat d’autorisation pour le projet minier Nunavik Nickel. N/Réf. :<br />
3215-14-007. 13 p.<br />
MINISTÈRE DU DÉVELOPPEMENT DURABLE ET DES PARCS, 2005. Plan<br />
directeur : Parc national des Pingualuit. Québec : MDDEP, 60 p.<br />
MINISTÈRE DU DÉVELOPPEMENT DURABLE ET DES PARCS. 1998. Politique de<br />
protection des sols et de réhabilitation des terrains contaminés.<br />
MINISTÈRE DES RESSOURCES NATURELLES DE LA FAUNE (MRNF). 2005.<br />
Statistiques de chasse et de piégeage. En ligne :<br />
http://www.fapaq.gouv.qc.ca/fr/faune/statistiques/index.htm)<br />
Consulté le 7 septembre 2006.<br />
MINISTÈRE DES RESSOURCES NATURELLES DE LA FAUNE (MRNF). 2012.<br />
Statistiques de chasse et de piégeage. En ligne<br />
https://www.mrnf.gouv.qc.ca/faune/statistiques/chasse/caribou-2011-<br />
2012.jsp Consulté le 9 septembre 2012.<br />
MINISTERE DES RESSOURCES NATURELLES DU QUEBEC. 2012. Liste des<br />
espèces désignées menacées ou vulnérables au Québec.<br />
http://www3.mrnf.gouv.qc.ca/faune/especes/menacees/liste.asp.<br />
Consulté le 22 octobre 2012.<br />
MINISTÈRE DE LA SANTÉ ET DES SERVICES SOCIAUX, 2008. Portrait des<br />
infections transmissibles sexuellement et par le sang (ITSS) au Québec :<br />
Année 2007 (et projections 2008). Collection analyses et surveillance, 84 p.<br />
MORTON, J.W. 1977. Ecological effect of dredging spoil disposal : a litterature<br />
review. United States Department of the Interior, Fish and Wildlife Service,<br />
Washington D.C. XX p.<br />
MPO, 2007a. Impacts de la construction d’un port méthanier à Gros-Cacouna sur les<br />
mammifères marins. Secr. can. de consult. sci. du Ministère des Pêches et<br />
Océans. Rép. des Sci. 2007/010.<br />
Canadian Royalties Inc.<br />
GENIVAR<br />
101-53046-02 November 2012<br />
276
MPO, 2007b. Sur la piste des bélugas de l’Arctique canadienne - Ministère des<br />
Pêches et Océans. Commentaire de Pierre Richard.<br />
www.dfo-mpo.gc.ca/science/Stor/central_arctic/whales_f.htm<br />
NGI et Sierra Neige. 2010. Avalanche Hazard Assessment. Deception Bay, Salluit,<br />
Nunavik, Quebec, Canada. 27 pages+annexes.<br />
NUNAVIK’S REGIONAL DEVELOPMENT COUNCIL, 2002. Orientation and<br />
perspectives for actions to fight poverty. Kuujjuaq : Nunavik’s Regional<br />
Development Council.<br />
NUNAVIK LANDHOLDING CORPORATIONS ASSOCIATION. 2012. Droits et<br />
pouvoirs sur les terres de catégorie 1. En ligne :<br />
http://nlhca.strata360.com/ Consulté le 9 octobre 2012.<br />
NUNAVIK TOURISM. 2012. En ligne :<br />
http://www.nunavik-tourism.com/page.aspx?page_id=71<br />
Consulté le 21 septembre 2012.<br />
NUNIVAAT, 2012. Nunavik, total population, 1961, 1966, 1971, 1976, 1981, 1986,<br />
1991, 1996, 2001, 2006, 2011. En ligne :<br />
http://www.nunivaat.org/TableViewer.aspx?S=2&ID=12961<br />
Consulté le 10 octobre 2012.<br />
OURANOS. 2007. (Celle que tu utilise pour les données de changement climatique)<br />
PARCS NUNAVIK, 2012. Au sujet des parcs: historique. Consulté le 24/09/2012 :<br />
http://www.nunavikparks.ca/fr/introduction/historique.htm<br />
PENNY, C., SENÉCAL, S. ET BOBET, E., 2009. Mortalité par suicide dans les<br />
collectivités inuites au Canada : taux et effets des caractéristiques des<br />
collectivités, Cahiers québécois de démographie, vol. 38, n° 2, p. 311-343.<br />
PERRIN, W.F., Wursig, B., Thewissen, J.G.M., 2002. Encyclopedia of Marine<br />
Mammals. Academic Press, 1414pp.<br />
POPPER, A.N., DEFERRARI, H.A., DOLPHIN, W.F., EDDS-WALTON, P.L.,<br />
GREVE, G.M., McFADDEN, D., RHINES, P.B., RIDGWAY, S.H.,<br />
SEYFARTH, R.M., SMITH, S.L., TYACK, P.L., 2000. Marine mammals and<br />
low-frequency noise: progress since 1994. National Academy Press,<br />
Washington, D.C. (http:/www.nap.edu/openbook/030906886X/html).<br />
RÉGIE RÉGIONALE DE LA SANTÉ ET DES SERVICES SOCIAUX NUNAVIK,<br />
2012. Mission. En ligne :<br />
http://www.rrsss17.gouv.qc.ca/index.php?option=com_content&view=article<br />
&id=20&Itemid=103&lang=fr Consulté le 18 septembre 2012.<br />
Canadian Royalties Inc.<br />
GENIVAR<br />
101-53046-02 November 2012<br />
277
RÉGIE RÉGIONALE DE LA SANTÉ ET DES SERVICES SOCIAUX NUNAVIK,<br />
2003. Les communautés du Nunavik. Consulté le 20/09/2012 :<br />
http://www.rrsss17.gouv.qc.ca/fr/nunavik/communautes/default.aspx<br />
RESSOURCES NATURELLES CANADA, 2007. Ententes de partenariat : La mine<br />
Raglan – Québec. Bulletin d’information sur la participation des<br />
Autochtones à l’industrie minière, 2 p.<br />
RÉSÉ-NORD. 2005. Eaux du Nord : Un guide pour concevoir et mener des<br />
observations sur la qualité de l’eau dans le nord du Canada. 252 p Roche.<br />
2004<br />
RICE, D.W., 1998. Marine mammals of the world. Systematics and distribution.<br />
Society for Marine Mammalogy. Spec. Pub. No. 4. 231 p.<br />
RICHARDSON, W.J., GREENE, C.R.Jr., MALME, C.I., THOMSON, D.H., 1995.<br />
Marine mammals and noise. Academic Press, San Diego, 576 pages.<br />
RIEUSSEC, E. 2008. Analyse comparative des différents modes de gestion des<br />
sédiments de dragage en milieux terrestre et marin. Travail présenté au<br />
Centre universitaire de formation en environnement en vue de l’obtention<br />
du grade de maître en environnement (M. Env.). Université de Sherbrooke.<br />
122 p.<br />
ROCHE. 2005. Expo and Phoenix Project. Prelimimary Environmental Baseline<br />
Study. Final report to Canadian Royalties Inc., Sainte-Foy, Québec:<br />
April 2005. 51 p. + appendix.<br />
ROCHE, 1993. Projet Raglan. Étude d’impact sur l’environnement. Roche, Québec.<br />
ROCHE, CANARCTIC, 1993. Projet Raglan. Évaluation des impacts et des risques<br />
associés au transport maritime à Baie Déception. Présenté à Falconbridge.<br />
100 p et annexes.<br />
ROCHE, 1992c. Projet Raglan. Étude sur l’occupation et l’utilisation du territoire par<br />
les Inuit dans la région entre la baie Déception et le havre Douglas,<br />
Nunavik. Vol 3, 107p.<br />
SENES, 2005. Vérification environnementale des T.N.-O. Rapport sur l’état de<br />
l’environnement Environnement marin. SENES Consultants Limited.<br />
SKILLETER, G.A. 1994. Refuges from predation and the persistence of estuarine<br />
clam populations. Marine Ecology Progress Series 109 : 29-42.<br />
Canadian Royalties Inc.<br />
GENIVAR<br />
101-53046-02 November 2012<br />
278
STANTEC. 2011. GEOTECHNICAL REPORT Proposed Wharf – Site 1. Deception<br />
Bay, Quebec 15 pages +annexes.<br />
SCOTT, W.B., SCOTT, M.G. 1988. Atlantic Fishes of Canada. Canadian Bulletin of<br />
Fisheries and Aquatic Sciences No 219. Canada. 731 p.<br />
SECRÉTARIAT AUX AFFAIRES AUTOCHTONES, 2012. Ententes avec les Inuits.<br />
En ligne :<br />
http://www.saa.gouv.qc.ca/relations_autochtones/ententes/inuits/ententes_i<br />
nuits.htm Consulté le 18 septembre 2012.<br />
SOCIÉTÉ MAKIVIK, 2012a. La Société. En ligne :<br />
http://www.makivik.org/fr/corporate/ Consulté le 18 septembre 2012.<br />
SOCIÉTÉ MAKIVIK, 2012b. Gouvernement régional du Nunavik. En ligne :<br />
http://www.makivik.org/fr/building-nunavik/nunavik-government/.<br />
Consulté le 18 septembre 2012.<br />
SOCIÉTÉ MAKIVIK, 2007. Coup d’œil sur le Nunavik. Kuujjuaq : Société Makivik.<br />
SOCIÉTÉ MAKIVIK, ADMINISTRATION RÉGIONAL KATIVIK ET<br />
GOUVERNEMENT DU QUÉBEC, 2008. Entente de partenariat sur le<br />
développement économique et communautaire au Nunavik. En ligne<br />
http://www.krg.ca/images/stories/docs/Agreements/Sanarrutik%20versionconsolidee-2008%20fr.pdf.<br />
Consulté le 18 septembre 2012.<br />
SOCIÉTÉ MAKIVIK. 2011. Nunavik Guidebook Mineral Exploration, Mining<br />
Development and Nunavik Region: Société Makivik. 31 pages. En ligne<br />
http://www.google.ca/url?sa=t&rct=j&q=&esrc=s&source=web&cd=2&ved=0<br />
CCYQFjAB&url=http%3A%2F%2Fnlhca.strata360.com%2Fapp%2Fdmsfile<br />
s%2Fdms_download.php%3Fapplication%3Dnlhca%26fileid%3D95&ei=O8<br />
V2UKXhHY6k8ATc64DAAQ&usg=AFQjCNFxVBsKckQ9Ky_IPNHI0Oucma<br />
yCEw. Consulté le 11 octobre 12.<br />
SMITH, S. L., BURGESS, M. M., COMMISSION GÉOLOGIQUE DU CANADA.<br />
2004. Sensitivity of permafrost to climate warming in Canada. [Ottawa],<br />
Geological Survey of Canada. viii, 24.<br />
SMITH, T.G., HAMMILL, M.O., 1981. Ecology of the ringed seal, Phoca hispida, in<br />
its fast ice breeding habitat. Can. J. Zool. 59: 966-981.<br />
SMITH, T.G., HAMMILL, M.O., 1980. A survey of the breeding habitat of ringed<br />
seals, Phoca hispida, and a study of their behaviour during the spring<br />
hauling-out period on southeastern Baffin Island. Can. Tech. Rep. Fish.<br />
Aquat. Sci. 1561. pp. 1-23.<br />
Canadian Royalties Inc.<br />
GENIVAR<br />
101-53046-02 November 2012<br />
279
STANTEC, 2012. GEOTECHNICAL REPORT Proposed Wharf – Site 1. Deception<br />
Bay, Quebec 9 pages + annexes.<br />
STATISTIQUE CANADA. 2012. Salluit, Québec (Code 2499135) et Kangiqsujuaq,<br />
Québec (Code 2499130) (tableau). Profil du recensement,<br />
Recensement de 2011, produit nº 98-316-XWF au catalogue de Statistique<br />
Canada. Ottawa. Diffusé le 29 mai 2012. En ligne :<br />
http://www12.statcan.gc.ca/census-recensement/2011/dppd/prof/index.cfm?Lang=F<br />
Consulté le 18 septembre 2012.<br />
STATISTIQUE CANADA. 2007. Salluit, Québec (Code 2499135) et Kangiqsujuaq,<br />
Québec (Code 2499130) (tableau). Profils des communautés de 2006,<br />
Recensement de 2006, produit nº 92-591-XWF au catalogue de Statistique<br />
Canada. Ottawa. Diffusé le 13 mars 2007. En ligne :<br />
http://www12.statcan.ca/census-recensement/2006/dp-pd/prof/92-<br />
591/index.cfm?Lang=F<br />
Consulté le 19 septembre 2012.<br />
STANTEC. 2011. GEOTECHNICAL REPORT Proposed Wharf – Site 1. Deception<br />
Bay, Quebec 15 pages +annexes.<br />
SUSHAMA, L., LAPRISE, R. AND ALLARD, M. 2006. Modeled current and future<br />
soil thermal regime for northeast Canada. Journal of Geophysical<br />
Research, 11, D18111, 13 p.<br />
THERRIEN, J., PLOURDE, Y., TREMBLAY, B., PELLETIER, M., PARADIS, J. 2007.<br />
Projet Nickélifère Raglan Sud – Inventaires complémentaires dans la baie<br />
Déception. Rapport sectoriel final – Étude d’impact sur l’environnement et le<br />
milieu social. Rapport de GENIVAR pour Canadian Royalties inc. 92 p. et<br />
annexes.<br />
THIFFAULT, D., 2007. Projet Nickélifère Raglan Sud – Milieu humain. Rapport<br />
sectoriel final – Étude d’impact sur l’environnement et le milieu social.<br />
Rapport de GENIVAR pour Canadian Royalties inc., 84 p. et annexes.<br />
TREMBLAY, M. FURGAL, C. 2008. Les changements climatiques au Nunavik et au<br />
Nord du Québec: L’accès au territoire et aux ressources Rapport Final.<br />
Service des Ressources renouvelables - Administration régionale Kativik.<br />
99 pages+annexes.<br />
TURNER, S.J., S.F. THRUSH, J.E. HEWITT, V.J. CUMMINGS et G. FUNNELL.<br />
1999. Fishing impacts and degradation or loss of habitat structure. Fisheries<br />
Management and Ecology 6 : 401-420.<br />
Canadian Royalties Inc.<br />
GENIVAR<br />
101-53046-02 November 2012<br />
280
XSTRATA NICKEL, 2012. Mine Raglan – Accueil du site. En ligne :<br />
http://www.xstratanickelraglan.ca/FR/Pages/default.aspx<br />
Consulté le 24 septembre 2012.<br />
XSTRATA NICKEL, 2011. Mine Raglan-Fact Sheet. En ligne :<br />
http://www.xstratanickel.com/EN/Publications/FactSheets/December%2020<br />
11_Raglan%20FR.pdf. Consulté le 10 octobre 2012.<br />
XSTRATA NICKEL, 2008. Statistics Abitibi/Montréal/Québec.<br />
Canadian Royalties Inc.<br />
GENIVAR<br />
101-53046-02 November 2012<br />
281