Tourism YearBook 2012 - Ministry of Tourism Arts & Culture
Tourism YearBook 2012 - Ministry of Tourism Arts & Culture
Tourism YearBook 2012 - Ministry of Tourism Arts & Culture

You also want an ePaper? Increase the reach of your titles
YUMPU automatically turns print PDFs into web optimized ePapers that Google loves.
tourism<br />
YEARBOOK<br />
<strong>2012</strong><br />
M i n i s t r y o f T o u r i s m , A r t s & C u l t u r e<br />
R e p u b l i c o f M a l d i v e s
tourism<br />
YEARBOOK<br />
<strong>2012</strong><br />
<strong>Ministry</strong> <strong>of</strong> <strong>Tourism</strong>, <strong>Arts</strong> and <strong>Culture</strong><br />
Republic <strong>of</strong> Maldives
Copyright ©<strong>Ministry</strong> <strong>of</strong> <strong>Tourism</strong>, <strong>Arts</strong> and <strong>Culture</strong>, <strong>2012</strong><br />
<strong>Tourism</strong> Yearbook <strong>2012</strong><br />
Produced and Published by;<br />
Statistics & Research Section<br />
<strong>Ministry</strong> <strong>of</strong> <strong>Tourism</strong>, <strong>Arts</strong> and <strong>Culture</strong> (MOTAC)<br />
5th Floor, Velaanaage<br />
Ameer Ahmed Magu<br />
Male’ 20094<br />
Republic <strong>of</strong> Maldives<br />
Tel: +960 332 3224<br />
Fax: +960 332 2512<br />
E-mail: stat@tourism.gov.mv<br />
Website: www.tourism.gov.mv<br />
Data Compilation & Verification:<br />
Statistics & Research Section / MOTAC<br />
Layout & Design:<br />
Statistics & Research Section / MOTAC<br />
Editor:<br />
Moosa Zameer Hassan<br />
ii
FOREWORD<br />
Welcome to the <strong>Tourism</strong> Yearbook <strong>2012</strong>!<br />
It is with great pleasure that we present to you this annual publication <strong>of</strong><br />
the <strong>Ministry</strong> <strong>of</strong> <strong>Tourism</strong>, <strong>Arts</strong> and <strong>Culture</strong>. The <strong>Tourism</strong> Yearbook is<br />
published with the objective <strong>of</strong> providing comprehensive and updated<br />
statistical information on the tourism industry, for the use <strong>of</strong> relevant<br />
Government authorities as well as private sector, institutions and<br />
individuals. This annual publication highlights key tourism indicators <strong>of</strong><br />
the Maldives for the past five years and provides information on the<br />
performance <strong>of</strong> the Maldives tourism industry in 2011.<br />
Year 2011 had been portrayed as a challenging year for the world<br />
tourism. While the global economy was recovering from the shock <strong>of</strong><br />
2008 and 2009, major political changes occurred in many countries<br />
specially the Middle East region. Regardless <strong>of</strong> these challenges,<br />
international tourist arrivals hit a new record registering an impressive<br />
4.4% growth in 2011 with a healthy 980 million arrivals.<br />
The Maldives set a new record in tourist arrivals to the country with<br />
over 930 thousand arrivals in a year and an impressive above average<br />
growth rate <strong>of</strong> nearly 18%. A significant increase in tourist bed capacity<br />
was recorded which resulted in an increased bed nights <strong>of</strong> tourists.<br />
While the European market share dropped, Asia and the Pacific<br />
recorded an increase, most <strong>of</strong> which accounts for the tremendous<br />
increase in the Chinese market. The increase in Chinese market led to a<br />
decline in average stay <strong>of</strong> tourists in the country.<br />
For <strong>2012</strong>, the initial projections were to reach a target <strong>of</strong> one million<br />
arrivals. However, due to the declines registered during the first quarter<br />
<strong>of</strong> the year, the target may not be achieved although a positive growth is<br />
still expected for the year.<br />
<strong>Tourism</strong> Yearbook <strong>2012</strong> is the result <strong>of</strong> the collaboration <strong>of</strong> many. We<br />
acknowledge and appreciate the Government institutions and the private<br />
sector for providing continued support. We hope that the readers find<br />
this publication a vital source <strong>of</strong> information.<br />
November <strong>2012</strong><br />
Ahmed Adeeb Abdul Ghafoor<br />
Minister <strong>of</strong> <strong>Tourism</strong>, <strong>Arts</strong> and <strong>Culture</strong><br />
iii
ACKNOWLEDGEMENTS<br />
Except where otherwise indicated, data used in this publication have<br />
been collected from relevant Government Authorities and the Maldives<br />
tourism industry.<br />
The <strong>Ministry</strong> <strong>of</strong> <strong>Tourism</strong>, <strong>Arts</strong> and <strong>Culture</strong> (MOTAC) wishes to express<br />
its gratitude to the following government authorities for their<br />
contribution in the compilation <strong>of</strong> this publication;<br />
<strong>Ministry</strong> <strong>of</strong> Finance and Treasury<br />
Department <strong>of</strong> Immigration and Emigration<br />
Department <strong>of</strong> National Planning<br />
Maldives Inland Revenue Authority<br />
Maldives Monetary Authority<br />
Maldives Customs Services<br />
Faculty <strong>of</strong> Hospitality and <strong>Tourism</strong> Studies<br />
MOTAC also acknowledges with appreciation the Maldives tourism<br />
industry for their continued cooperation and assistance in the<br />
compilation <strong>of</strong> data for this publication.<br />
iv
INTRODUCTION<br />
<strong>Tourism</strong> Yearbook <strong>2012</strong> has been produced and published by the<br />
Statistics & Research Section <strong>of</strong> the <strong>Ministry</strong> <strong>of</strong> <strong>Tourism</strong>, <strong>Arts</strong> and<br />
<strong>Culture</strong>. This publication briefly presents the overall performance <strong>of</strong><br />
the tourism industry <strong>of</strong> the Maldives through 2007 to 2011. In<br />
addition to the available national tourism statistics for the past five<br />
years, the publication contains major highlights <strong>of</strong> the tourism<br />
industry in 2011.<br />
This publication is divided into 6 sections<br />
1. Tourist Accommodation<br />
2. Tourist Arrival Trends<br />
3. Economic Indicators <strong>of</strong> <strong>Tourism</strong><br />
4. Airlines Statistics<br />
5. <strong>Tourism</strong> Forecasts; and<br />
6. <strong>Tourism</strong> Highlights 2011<br />
Each section provides important data and information. Together, the<br />
sections provide a comprehensive picture <strong>of</strong> tourism in the<br />
Maldives.<br />
v
Table <strong>of</strong> Contents<br />
Foreword ..................................................................................................................................................................... i<br />
Acknowledgements...................................................................................................................................................... ii<br />
Preface ........................................................................................................................................................................ iii<br />
TOURIST ACCOMMODATION<br />
Accommodation Facilities ……………………………………………………………………………………………1<br />
Table 1: Accommodation Establishments & Bed Capacity, 2007 - 2011 ......................................................1<br />
Resorts by Atolls ……………………………………………………………………………………………………..2<br />
Table 2: Bed Capacity <strong>of</strong> Resort Beds by Atolls, 2007 - 2011 .......................................................................2<br />
Resorts by Management Type ………………………………………………………………………………………..3<br />
Figure 1: Bed Capacity by Management Type, 2011 ……….…………………………………..…………...3<br />
Table 3: Tourist Resorts by Type <strong>of</strong> Lease Holder, Operator and Management, 2007 - 2011 ......................3<br />
Capacity Utilization …………………………………………………………………………………………………..4<br />
Table 4: Bed Nights, Occupancy Rate & Average Duration <strong>of</strong> Stay, 2007 - 2011..........................................4<br />
Figure 2: Bed Nights vs. Occupancy Rate, 2007 - 2011 ……….………...…………………………...…......5<br />
Figure 3: Average Duration <strong>of</strong> Stay, 2007 - 2011 ……….………...……….………...……………………...5<br />
Table 5: Monthly Average Occupancy Rates <strong>of</strong> Resorts & Hotels, 2007 - 2011 ...........................................5<br />
TOURIST ARRIVAL TRENDS<br />
Global Arrival Trends ..................................................................................................................................................6<br />
Table 6: International Tourist Arrivals Worldwide, 2009-2011 .....................................................................6<br />
Maldives Arrival Trends ………..................................................................................................................................7<br />
Table 7: Monthly Arrivals to the Maldives, 2007 - 2011 ................................................................................7<br />
Table 8: Growth Trends <strong>of</strong> Monthly Arrivals to the Maldives, 2007 - 2011 ..................................................7<br />
Major Markets ..............................................................................................................................................................8<br />
Figure 4: Market Share by Regions, 2007 - 2011 ...........................................................................................8<br />
Top Ten Markets in 2011 .............................................................................................................................................9<br />
Table 9: Tourist Arrivals and Market Share <strong>of</strong> Top Ten Markets, 2011 ......................................................................9<br />
1. China………………………………………………………………………………………………..………10<br />
Figure 5: Growth and Market Share <strong>of</strong> China, 2007 - 2011 .........................................................................10<br />
Figure 6: Monthly Arrival <strong>of</strong> Chinese Market, 2007 - 2011 .........................................................................10<br />
2. United Kingdom ……………………..……………………………………………………………..………11<br />
Figure 7: Growth and Market Share <strong>of</strong> UK, 2007 - 2011 .............................................................................11<br />
Figure 8: Monthly Tourist Arrivals <strong>of</strong> UK market, 2007 - 2011 ..................................................................11<br />
3. Germany ……………………………..……………………………………………………………..………12<br />
Figure 9: Growth and Market Share <strong>of</strong> Germany, 2007 - 2011 ....................................................................12<br />
Figure 10: Monthly Tourist Arrivals <strong>of</strong> German market, 2007 - 2011 .........................................................12<br />
4. Italy …………………………………..……………………………………………………………..………13<br />
Figure 11: Growth and Market Share <strong>of</strong> Italy, 2007 - 2011 ..........................................................................13<br />
Figure 12: Monthly Tourist Arrivals <strong>of</strong> Italian market, 2007 - 2011 ............................................................13<br />
5. Russia ………………………………..……………………………………………………………..………14<br />
Figure 13: Growth and Market Share <strong>of</strong> Russia, 2007 - 2011 ......................................................................14<br />
Figure 14: Monthly Tourist Arrivals <strong>of</strong> Russian market, 2007 - 2011 .........................................................14<br />
6. France ………………………………..……………………………………………………………..………15<br />
Figure 15: Growth and Market Share <strong>of</strong> France, 2007 - 2011 ......................................................................15<br />
Figure 16: Monthly Tourist Arrivals <strong>of</strong> French market, 2007 - 2011 ...........................................................15<br />
7. Japan ………………………………..……..………………………………………………………..………16<br />
Figure 17: Growth and Market Share <strong>of</strong> Japan, 2007 - 2011 ........................................................................16<br />
Figure 18: Monthly Tourist Arrivals <strong>of</strong> Japanese market, 2007 - 2011 ........................................................16<br />
8. Switzerland …………..……………..……..………………………………………………………..………17<br />
Figure 19: Growth and Market Share <strong>of</strong> Switzerland, 2007 - 2011 ..............................................................17<br />
Figure 20: Monthly Tourist Arrivals <strong>of</strong> Swiss market, 2007 - 2011 .............................................................17<br />
vi
9. India ………………………………..……..………………………...……………………………..………18<br />
Figure 21: Growth and Market Share <strong>of</strong> India, 2007 - 2011 .......................................................................18<br />
Figure 22: Monthly Tourist Arrivals <strong>of</strong> Indian market, 2007 - 2011 ..........................................................18<br />
10. Korea ……………………..……..…………………...…………………………………………..………19<br />
Figure 23: Growth and Market Share <strong>of</strong> Korea, 2007 - 2011 .....................................................................19<br />
Figure 24: Monthly Tourist Arrivals <strong>of</strong> Korean market, 2007 - 2011 ........................................................19<br />
ECONOMIC INDICATORS<br />
<strong>Tourism</strong> Contribution to the economy .....................................................................................................................20<br />
Figure 25: GDP Contribution by Major Economic Sectors, 2011 ...........................................................................20<br />
Table 10: <strong>Tourism</strong> Contribution to Gross Domestic Product (GDP), 2007 - 2011 .................................................21<br />
Table 11: <strong>Tourism</strong> Revenue and Tax, 2007 - 2011 ..................................................................................................21<br />
Table 12: <strong>Tourism</strong> Receipts, 2007 - 2011 ................................................................................................................22<br />
Table 13: Government Expenditure on <strong>Tourism</strong>, 2007 - 2011 ................................................................................22<br />
AIRLINE STATISTICS<br />
Traffic by International Carriers ……………………………………………………………………………..……23<br />
Table 14: Passenger Arrivals by Type <strong>of</strong> International Carriers, 2007 - 2011 ........................................................23<br />
Traffic by Domestic Carriers …………….…………………………………………………………………..……23<br />
Table 15: Passenger Arrivals by Domestic Carriers at Ibrahim Nasir International Airport, 2007 – 2011 ............23<br />
International Scheduled Carriers …………….………...……………………………………………………..……23<br />
Table 16: Traffic by International Carriers - Scheduled, 2007 - 2011 .....................................................................24<br />
International Chartered Carriers …………….………...……………………………………………………...……25<br />
Table 17: Traffic by International Carriers - Chartered, 2007 - 2011 ......................................................................25<br />
TOURISM FORECASTS<br />
Global Forecasts ......................................................................................................................................................26<br />
Table 18: Outlook for International Arrivals ...........................................................................................................26<br />
Maldives <strong>Tourism</strong> Forecasts ………………………………………………………………………………………26<br />
Table 19: Maldives <strong>Tourism</strong> Outlook <strong>2012</strong> - 2015 ..................................................................................................26<br />
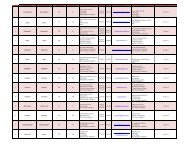
Table 20: Resort / Hotel Projects Underway ………………………………………………………………………27<br />
OTHER TABLES<br />
Table 21: Bed Capacity <strong>of</strong> Tourist Resorts, 2007 - 2011 .........................................................................................31<br />
Table 22: Bed Capacity <strong>of</strong> Tourist Hotels, 2007 - 2011 ..........................................................................................34<br />
Table 23: Graduates from Faculty <strong>of</strong> Hospitality & <strong>Tourism</strong> Industry, 2007 - 2011 ..............................................35<br />
Table 24: Inbound and Outbound Travel, 2007 - 2011 ............................................................................................35<br />
Table 25: Seasonal Variation <strong>of</strong> Tourist Arrivals, 2007 - 2011 ...............................................................................35<br />
Table 26: Tourist Arrivals & Market Share by Major Markets, 2007 - 2011 ..........................................................36<br />
Table 27: Growth Trends <strong>of</strong> Major Markets, 2007 - 2011 .......................................................................................38<br />
Table 28: Tourist Arrivals by Nationality – at end September <strong>2012</strong> .......................................................................40<br />
Table 29 Major <strong>Tourism</strong> Indicators - at end September <strong>2012</strong> .................................................................................42<br />
TOURISM HIGHLIGHTS 2011 .......................................................................................................................... 44<br />
vii
[Type<br />
the document title]<br />
SECTION<br />
1: TOURIST<br />
ACCOMMODATION<br />
Accommodation<br />
Facilities<br />
As per Maldives <strong>Tourism</strong> Act Law No. 2/99, tourists visiting the Maldives must stay at a facility which is<br />
registered at the <strong>Ministry</strong> <strong>of</strong> <strong>Tourism</strong>, <strong>Arts</strong> and <strong>Culture</strong> (MOTAC) to accommodate<br />
tourists. There are four<br />
types <strong>of</strong> accommodation facilities currently available for tourists in the Maldives; namely tourist resorts,<br />
tourist hotels, tourist guest houses and safari vessels.<br />
Uninhabited<br />
islands in the Maldives are developed into resorts, taking into consideration the ‘one-island-one--<br />
At the end<br />
<strong>of</strong> 2011 there were 101 resort islands with a total bed capacity <strong>of</strong> 22,120<br />
registered with the MOTAC. Being<br />
the most popular and traditional form <strong>of</strong> accommodation<br />
in the Maldives, 82.2% <strong>of</strong> the bed capacity<br />
originates in<br />
resorts in 2011. Threee new resorts came into<br />
operation in 2011, which include Olhuveli in<br />
Laamu Atoll with 194 beds, Meradhoo in Gaafu Alifu Atoll with 74 beds<br />
and Magudhdhuva in Gaafu Dhaalu<br />
Atoll with 200 beds (refer table 1).<br />
resort’ concept which is unique to the Maldives, <strong>of</strong>fering splendid experiences in luxury vacations.<br />
With the opening <strong>of</strong> two new hotels, total number <strong>of</strong> hotels increased from 17 in 2010 to 19 by end 20111<br />
increasing the bed capacity to 1,603 (refer Table 1).<br />
Guest Houses in the Maldives <strong>of</strong>fer budget accommodation<br />
for tourists visiting locall islands in the Maldives.<br />
Previously, this type <strong>of</strong><br />
accommodation was available only in the capital city, Male’. Since 2011, guest<br />
houses are being developed in other<br />
local islands. 13 new guest housess were opened in different islands <strong>of</strong><br />
the Maldives in 2011. At the end <strong>of</strong><br />
2011, theree were 659 beds in 38 guest houses registered with MOTAC.<br />
Although guest houses contribute only 2.5% to the total bed capacity, this form<br />
<strong>of</strong> accommodation is<br />
increasing rapidly (referr table 1).<br />
Live-aboard<br />
floating beds, commonly known as Safari Vessels, are a rapidly growing form <strong>of</strong><br />
accommodation in the Maldives. A live-aboard vacation in the Maldives <strong>of</strong>fers an onboard holiday, with an<br />
adventurous<br />
approach combined with various recreational activities, such as scuba diving, snorkeling, wave<br />
surfing and various kinds <strong>of</strong> game fishing. These vessels cruise around islands, sailing to secluded locations<br />
such as marine protected<br />
areas/parkss in the Maldives. At the end <strong>of</strong> 2011, there were 157 safari vessels with a<br />
total bed capacity <strong>of</strong> 2,514 registered<br />
to accommodate tourists in the Maldives (refer table 1)<br />
Table 1: Accommodation Establishments and Bed Capacity, 2007-2011<br />
2007<br />
2008<br />
2009<br />
2010<br />
2011<br />
Type <strong>of</strong> Establishment<br />
Nos<br />
Beds<br />
Nos<br />
Beds<br />
Nos<br />
Beds<br />
Nos<br />
Beds<br />
Nos<br />
Beds<br />
Resorts / Marinas<br />
92 19,028<br />
94<br />
19,860<br />
97 20,942<br />
98<br />
21,342 101 22,120<br />
Hotels<br />
11 886 _/ 13<br />
1,110<br />
15 1,368<br />
17<br />
1,449<br />
19 1,603<br />
Guest Houses<br />
24 400<br />
24<br />
400<br />
22 462<br />
25<br />
476<br />
38 659<br />
Safari Vessels<br />
133 1,923<br />
143<br />
2,094<br />
145 2,206<br />
156<br />
2,434 157 2,514<br />
Total<br />
260 22,237<br />
274<br />
23,464<br />
279 24,978<br />
296<br />
25,701 315 26,896<br />
Source: <strong>Ministry</strong><br />
<strong>of</strong> <strong>Tourism</strong>, <strong>Arts</strong><br />
and <strong>Culture</strong><br />
Note: Revised _/<br />
1 | Page
[Type<br />
the document title]<br />
Resorts by Atolls<br />
The first tourist resort in<br />
the Maldives was opened in 1972<br />
at Vihamanaafushi in Kaafu Atoll. Since then,<br />
Kaafu Atoll,<br />
being closest atoll to the only international airport in the country, was centralized<br />
as the first<br />
tourism zone<br />
in the Maldives. Subsequently, Alifu Atoll, the next closest atoll to the airport was developed. At<br />
the end <strong>of</strong> 2011, Kaafu and Alifu Atoll together held 67.5% <strong>of</strong> the total resort bed capacity (refer Table 2).<br />
At the beginning <strong>of</strong> tourism in the Maldives, the<br />
policy was to develop resorts closer to the airport and away<br />
from local islands. Under the Second <strong>Tourism</strong><br />
Master Plan, tourism<br />
expanded to new atolls. With the<br />
implementation <strong>of</strong> The Third <strong>Tourism</strong> Master Plan a new policy was adopted. With<br />
this new policy tourism<br />
was further expanded to the whole country with plans to develop domestic<br />
airports to cover all atolls.<br />
In 2008, Noonu Atoll was opened for<br />
tourism with the opening <strong>of</strong> two new<br />
resorts, one in Medhafushi and one<br />
in Kudafunafaru. While in 2009, Gaafu Alif Atoll opened its first resort, tourism was introduced to Laamu and<br />
Gaafu Dhaalu Atolls in 2011 with the<br />
opening <strong>of</strong><br />
their first resorts in Olhuveli and Magudhdhuva respectively.<br />
Table 2: Bed Capacity <strong>of</strong> Resorts by Atolls, 2007 - 2011<br />
2007<br />
2008<br />
2009<br />
2010<br />
2011<br />
Atoll<br />
Haa Alifu<br />
Beds<br />
390<br />
% Share<br />
2.0<br />
Beds % Share Beds % Share Beds % Share<br />
432 2. 2 432 2.1 456 2.1<br />
Beds % Share<br />
456 2.1<br />
Noonu<br />
-<br />
-<br />
400 2. 0 490<br />
2.3 542 2.5<br />
542<br />
2.5<br />
Raa<br />
470<br />
2.5<br />
470 2. 4 470<br />
2.2 470 2.2<br />
470<br />
2.1<br />
Baa<br />
1,240<br />
6.5<br />
1,240 6. 2 1,240<br />
5.9 1,398 6.6<br />
1,398<br />
6.3<br />
Lhaviyani<br />
1,276<br />
6.7<br />
1,294 6. 5 1,336<br />
6.4 1,336 6.3<br />
1,336<br />
6.0<br />
Kaafu<br />
8,724<br />
45.8<br />
8,914 44. 9 8,982<br />
42.9 9,050 42.4<br />
9,128<br />
41.3<br />
Alifu (No rth & So uth) 5,058<br />
26.6<br />
5,240 26. 4 5,526<br />
26.4 5,574 26.1<br />
5,806<br />
26.2<br />
Vaavu<br />
350<br />
1.8<br />
350 1. 8 350<br />
1.7 350 1.6<br />
350<br />
1.6<br />
Meemu<br />
400<br />
2.1<br />
400 2. 0 400<br />
1.9 400 1.9<br />
400<br />
1.8<br />
Faafu<br />
250<br />
1.3<br />
250 1. 3 250<br />
1.2 250 1.2<br />
250<br />
1.1<br />
Dhaalu<br />
324<br />
1.7<br />
324 1. 6 436<br />
2.1 436 2.0<br />
436<br />
2.0<br />
Laamu<br />
-<br />
-<br />
-<br />
- -<br />
-<br />
- -<br />
194<br />
0.9<br />
Gaafu Alifu<br />
-<br />
-<br />
-<br />
- 200<br />
1.0 250 1.2<br />
324<br />
1.5<br />
Gaafu Dhaalu<br />
-<br />
-<br />
-<br />
- -<br />
-<br />
- -<br />
200<br />
0.9<br />
Seenu<br />
546<br />
2.9<br />
546 2. 7 830<br />
4.0 830 3.9<br />
830<br />
3.8<br />
19,028<br />
100.0 19,860 100. 0 20,942<br />
100.0 21,342 100.0<br />
22,120 100.0<br />
Source: <strong>Ministry</strong><br />
<strong>of</strong> <strong>Tourism</strong>, <strong>Arts</strong><br />
and <strong>Culture</strong><br />
Note: Revised _/<br />
2 | Page
[Type<br />
the document title]<br />
Resorts by<br />
Management Type<br />
Resorts are leased by the government<br />
for a period <strong>of</strong> 35 years, and the leaseholder<br />
is allowed to sublease the<br />
property for operational purposes. In 2011, with a slight change that was brought to the <strong>Tourism</strong> Act, resort<br />
operators are allowed to sub-contract the islands for<br />
management purposes under a management agreement.<br />
As<br />
shown in Table 3, in the year 20111 the number <strong>of</strong> resorts leased to local parties was 74 comprising <strong>of</strong> 16, ,714<br />
beds (76%) <strong>of</strong><br />
the total bed capacity <strong>of</strong> resorts. While the number <strong>of</strong> resorts leased to foreign parties was 12 with<br />
11,858 beds, the number <strong>of</strong><br />
beds in companies leased to joint ventures formed between local companies and foreign<br />
companies was<br />
3,548 in 15<br />
resorts.<br />
There were 47 resorts with 11,390 beds operated by local<br />
Figure 1: Bed Capacity by Management<br />
companies. The number <strong>of</strong> resorts managed by local<br />
Type, 2011<br />
companies was 43<br />
with 10,394<br />
beds. As can be seen from<br />
Table 3, the number <strong>of</strong> beds operated by local companies<br />
has increased from<br />
49.9% in 2010 to 51.5% at the end <strong>of</strong><br />
Joint Venture<br />
2011.<br />
34%<br />
Foreign<br />
19%<br />
Table 3: Resorts by Type <strong>of</strong> Lease Holder, Operator and Management<br />
Lease Holder<br />
Local<br />
47%<br />
Operator<br />
The number <strong>of</strong> resort operators by foreign<br />
companies was<br />
37 (6,422 beds), while the number <strong>of</strong> resorts managed<br />
by<br />
foreign companies was only 17 with 4,308 beds. At<br />
the<br />
end <strong>of</strong> 2011, the<br />
number <strong>of</strong><br />
resorts managed by joint<br />
venture companies was 41 with 7,418 beds, which was<br />
33.5%<br />
<strong>of</strong> the total bed capacity.<br />
Management<br />
Year<br />
2007 Nos<br />
Share (%)<br />
Beds<br />
Share (%)<br />
2008 Nos<br />
Share (%)<br />
Beds<br />
Share (%)<br />
2009 Nos<br />
Share (%)<br />
Beds<br />
Share (%)<br />
2010 Nos<br />
Share (%)<br />
Beds<br />
Share (%)<br />
2011 Nos<br />
Share (%)<br />
Beds<br />
Share (%)<br />
Joint<br />
Joint<br />
Local Foreign<br />
Venture<br />
Total Local Foreign<br />
Venture<br />
70<br />
76.1<br />
8<br />
8.7 14<br />
15.2<br />
92 100.0<br />
44<br />
47.8<br />
31<br />
33.7<br />
17<br />
18.5<br />
14,716 1,122 3,190 19,028 10,146 5,340 3,542<br />
77.3 5.9 16.8 100.0 53.3 28.1 18.6<br />
74<br />
78.7<br />
8<br />
8.5 12<br />
12.8<br />
94 100.0<br />
44<br />
46.8<br />
33<br />
35.1<br />
17<br />
18.1<br />
15,882 1,086 2,892 19,860 10,322 5,706 3,832<br />
80.0 5.5 14.6 100.0 52.0 28.7 19.3<br />
73<br />
75.3<br />
8<br />
8.2 16<br />
16.5<br />
97 100.0<br />
42<br />
43.3<br />
35<br />
36.1<br />
20<br />
20.6<br />
16,192 1,180 3,570 20,942 10,354 5,960 4,628<br />
77.3 5.6 17.0 100.0 49.4 28.5 22.1<br />
74 10 14 98 43 37 18<br />
75.5 10.2 14.3 100.0 43.9 37.8 18.4<br />
16,562 1,382 3,398 21,342 10,642 6,302 4,398<br />
77.6 6.5 15.9 100.0 49.9 29.5 20.6<br />
74 12 15 101 47 37 17<br />
73.3 11.9 14.9 100.0 46.5 36.6 16.8<br />
16,714 1,858 3,548 22,120 11,390 6,422 4,308<br />
75.6 8.4 16.0 100.0 51.5 29.0 19.5<br />
Total<br />
92<br />
100.0<br />
19,028<br />
100.0<br />
94<br />
100.0<br />
19,860<br />
100.0<br />
97<br />
100.0<br />
20,942<br />
100.0<br />
98<br />
100.0<br />
21,342<br />
100.0<br />
Joint<br />
Local Foreign Venture<br />
Total<br />
- - - -<br />
- - - -<br />
- - - -<br />
- - - -<br />
- - - -<br />
- - - -<br />
- - - -<br />
- - - -<br />
- - - -<br />
- - - -<br />
- - - -<br />
- - - -<br />
- - - -<br />
- - - -<br />
- - - -<br />
- - - -<br />
101 43<br />
17 41 101<br />
100.0 42.6<br />
16.8 40.6 100.0<br />
22,120 10,394<br />
4,308 7,418 22,120<br />
100.0 47.0<br />
19.5 33.5 100.0<br />
Source: <strong>Ministry</strong> <strong>of</strong> <strong>Tourism</strong>, <strong>Arts</strong> and <strong>Culture</strong><br />
3 | Page
[Type<br />
the document title]<br />
Capacity Utilization<br />
The<br />
bed night capacity, which is derived from operational bed capacity, recorded an increase <strong>of</strong> 3.5% in 20111<br />
compared with 2010. With the increase in bed capacity, the actual tourist bed<br />
nights have<br />
been increasing steadily<br />
over the years. The dip recorded for the year 2009 was due to the<br />
world economic crisis in 2008 which resulted in<br />
a negative growth in tourists arrivals to<br />
the Maldives. The total registered<br />
bed nights <strong>of</strong> resorts, hotels, guest<br />
houses and safari vessels in 2011 was 6, 529,141 which was an increase <strong>of</strong> 9.1% compared to that <strong>of</strong> 2010.<br />
Although the bed nights have been increasing steadily over the years, capacity utilization<br />
rate or more commonly<br />
known as occupancy rate has declined through 2007<br />
to 2010, from 82.5% to 69.5%. One<br />
<strong>of</strong> the major reasons for<br />
this drop in occupancy rate is the huge increase in bed capacity<br />
and the shift in market segments. In 2011, the<br />
national averagee occupancy rate recorded an increasee <strong>of</strong> 73.1%, over 2010.<br />
The<br />
shift in demographic pr<strong>of</strong>ile <strong>of</strong> major generatingg markets from Western Europe to North East Asia, especially<br />
China is reflected in the declines <strong>of</strong> average stay <strong>of</strong><br />
tourists. The Chinese market overtook all European markets<br />
and<br />
became the<br />
market leader by strengthening its position with<br />
a healthy market share. This shift has caused a<br />
decline in average stay <strong>of</strong><br />
tourists in the country. As seen from Table 4, the average duration <strong>of</strong> stay has<br />
decreased from 8.5 days in 2007 to 7 days in 2011. According to the findings <strong>of</strong> Maldives Visitor Survey 2011,<br />
over 96% <strong>of</strong> the<br />
Chinese tourists stayed<br />
in the Maldives for less than 7 nights. Out <strong>of</strong> which 9% stayed for lesss<br />
than<br />
3 nights.<br />
Table 4: Bed Nights, Occupancy Rate and Duration <strong>of</strong> Stay, 2007 - 2011<br />
Bed<br />
Capacity in<br />
Year<br />
Operation<br />
(annual average)<br />
2007 17,589<br />
Bed Night<br />
Capacity<br />
6,400,167<br />
Tourist Bed<br />
Nights<br />
5,293,224<br />
Bed Night<br />
Growth<br />
(%)<br />
9.7<br />
Occupancy<br />
Rate (%)<br />
82.5<br />
Average<br />
Duration <strong>of</strong><br />
Stay (days)<br />
8.5<br />
Resorts & Hotels 17,589 _/<br />
6,400,167<br />
5,293,224<br />
9.7<br />
82.5 _/<br />
8.5<br />
Guest House and Vessels<br />
-<br />
-<br />
-<br />
-<br />
-<br />
-<br />
2008 19,117<br />
6,996,640<br />
5,446,937<br />
2.9<br />
77.8<br />
8.0<br />
Resorts & Hotels 19,117<br />
6,996,640<br />
5,446,937<br />
2.9<br />
77.8<br />
8.0<br />
Guest House and Vessels<br />
-<br />
-<br />
-<br />
-<br />
-<br />
-<br />
2009 20,137<br />
7,338,221<br />
5,150,688<br />
-5.4<br />
70.2<br />
8.6<br />
Resorts & Hotels 20,137<br />
7,338,221<br />
5,150,688<br />
-5.4<br />
70.2<br />
8.6<br />
Guest House and Vessels<br />
-<br />
-<br />
-<br />
-<br />
-<br />
-<br />
2010 23,649<br />
8,631,809<br />
5,986,342<br />
-<br />
69.5<br />
7.6<br />
Resorts & Hotels 21,541<br />
7,861,955<br />
5,829,589 _/<br />
13.2<br />
74.2<br />
7.4<br />
_/<br />
Guest House and Vessels 2,108<br />
769,854<br />
156,753<br />
-<br />
20.7<br />
0.2<br />
2011 24,490<br />
8,938,190<br />
6,529,141<br />
9.1<br />
73.1<br />
7.0<br />
Resorts & Hotels 22,504<br />
8,213,871<br />
6,358,519<br />
9.1<br />
77.5<br />
6.8<br />
Guest House and Vessels<br />
1,987<br />
724,319<br />
170,622<br />
8.8<br />
23.4<br />
0.2<br />
Source: <strong>Ministry</strong> <strong>of</strong> <strong>Tourism</strong>, <strong>Arts</strong> and <strong>Culture</strong><br />
Note: Revised _/<br />
4 | Page
[Type<br />
the document title]<br />
Figure 2: Bed nights Vs Occupancy Rate<br />
2007 - 2011<br />
Figure 3: Average Duration <strong>of</strong><br />
Stay<br />
2007 - 20111<br />
9,000<br />
84.0<br />
9.0<br />
Bed nights in Thousands<br />
8,000<br />
7,000<br />
6,000<br />
5,000<br />
4,000<br />
3,000<br />
2,000<br />
1,000<br />
Bed Night Capacity<br />
Tourist Bed Nights<br />
Occupancy Rate (%)<br />
82.0<br />
80.0<br />
78.0<br />
76.0<br />
74.0<br />
72.0<br />
70.0<br />
68.0<br />
66.0<br />
occupancy rate (%)<br />
Days<br />
8.5<br />
8.0<br />
7.5<br />
7.0<br />
6.5<br />
6.0<br />
5.5<br />
0<br />
2007<br />
2008<br />
2009 2010<br />
2011<br />
64.0<br />
5.0<br />
2007<br />
2008 2009 2010<br />
2011<br />
Table 5: Monthly Average Occupancy Rates <strong>of</strong> Resorts & Hotels, 2007 - 2011<br />
Month<br />
2007<br />
2008<br />
2009<br />
2010<br />
2011<br />
January<br />
94.8<br />
90.0<br />
86.5<br />
83.5<br />
87.2<br />
February<br />
100.1<br />
95.9<br />
85.9<br />
92.5<br />
94.4<br />
March<br />
94.3<br />
95.7<br />
81.6<br />
82.6<br />
85.8<br />
April<br />
92.6<br />
88.2<br />
75.2<br />
74.2<br />
83.8<br />
May<br />
70.4<br />
70.4<br />
59.1<br />
64.5<br />
65.5<br />
June<br />
58.9<br />
54.2<br />
47.5<br />
50.2<br />
55.0<br />
July<br />
72.0<br />
65.3<br />
56.7<br />
63.5<br />
68.9<br />
August<br />
84.4<br />
76.0<br />
66.0<br />
73.1<br />
72.8<br />
September<br />
73.6<br />
66.0<br />
62.7<br />
67.6<br />
69.3<br />
October<br />
81.2<br />
75.7<br />
73.0<br />
79.8<br />
83.4<br />
November<br />
85.7<br />
78.1<br />
74.6<br />
81.4<br />
83.9<br />
December<br />
85.1<br />
78.4<br />
73.8<br />
77.7<br />
79.9<br />
Annual Averagee<br />
82.8<br />
77.8<br />
70.2<br />
74.2<br />
77.5<br />
Source: <strong>Ministry</strong> <strong>of</strong><br />
<strong>Tourism</strong>, <strong>Arts</strong> and <strong>Culture</strong><br />
Table 5, presents the monthly average occupancy rates <strong>of</strong> resorts and hotels. As seen from the table, while<br />
occupancy rates are higher for the months from October to April, low rates are recordedd for the period from May to<br />
September with<br />
June being<br />
the lowest month. Hence, October to April is the considered to the peak tourist season<br />
for<br />
the Maldives. This period also coincides with European Christmas/Ne<br />
ew year holidays as welll as the Chinese<br />
New Year holidays.<br />
5 | Page
[Type<br />
the document title]<br />
SECTION 2: TOURIS<br />
ST ARRIVAL<br />
TRENDS<br />
Global Arrival Trends<br />
The year 2011 had been<br />
a challenging year for the world. While the global economy was in the recovery<br />
stage, major political changes occurred in the Middle East and in North Africa. Japan was hit by<br />
one <strong>of</strong> the<br />
worst natural<br />
disasters in<br />
its history. Despite all these challenges, tourist arrivals worldwide hit new records<br />
in 2011. According to the<br />
figures released by the United Nation’s World <strong>Tourism</strong> Organization (UNWTO) in<br />
March <strong>2012</strong>,<br />
tourist arrivals worldwide registered<br />
an increasee <strong>of</strong> 4.4% in<br />
2011 over 2010 reaching a total <strong>of</strong><br />
980 million.<br />
Table 6: International<br />
Tourist Arrivals Worldwide,<br />
2009 - 2011<br />
Tourist Arrivals<br />
(in millions)<br />
2009<br />
2010 2011 *<br />
Europe<br />
461.1<br />
474.6 502.3<br />
% C hange<br />
(2011/2010) % Share<br />
2011 *<br />
5.8<br />
51.2<br />
Asia<br />
& the Pacific<br />
181.0<br />
204.5<br />
217.1<br />
6.1<br />
22.1<br />
Americas<br />
140.7<br />
149.7<br />
156.0<br />
4.2<br />
15.9<br />
Africa<br />
46.0<br />
49.9<br />
50.0<br />
0.2<br />
5.1<br />
Middle East<br />
52.1<br />
59.9<br />
54.8<br />
-8.4<br />
5.6<br />
World<br />
881<br />
939<br />
980<br />
4.4<br />
100.0<br />
Note:<br />
*Data as collected by UNWTO, March <strong>2012</strong><br />
Source: Adapted from<br />
UNWTO World<br />
<strong>Tourism</strong> Barometer, March <strong>2012</strong>2 Edition<br />
As per the UNWTO World <strong>Tourism</strong> Barometer, March <strong>2012</strong> edition, Europe was the best performer in terms<br />
<strong>of</strong> arrival numbers with over 502 million arrivals, which accounted for 51.2% <strong>of</strong> total arrivals that year. The<br />
region registered a growth <strong>of</strong> 5.8% in<br />
2011 compared with 2010.<br />
Asia & the Pacific region registered<br />
the highest<br />
growth in 2011with a positive 6.1% %. This region was the<br />
second best performer in<br />
terms <strong>of</strong> arrival numbers in 2011 with a total <strong>of</strong><br />
217.1 million arrivals, contributing<br />
22.1% to the total arrivals that year.<br />
Americas recorded a total arrival <strong>of</strong> 156 million in 2011grasping nearly16% shares. The region registered a<br />
positive growth <strong>of</strong> 4.2% in 2011 compared with that <strong>of</strong> 2010.<br />
Africa and Middle East,<br />
both were experiencing political turbulence in<br />
the region<br />
during the year 2011.<br />
While Africa<br />
posted just<br />
a slight increment <strong>of</strong> 0. .2% in arrivals in 2011, the Middle East region registered a<br />
negative growth <strong>of</strong> 8.4% in 2011 compared to that <strong>of</strong> 2010.<br />
6 | Page
[Type<br />
the document title]<br />
Maldives Arrival Trends<br />
Over the last five years (2007-2011),<br />
tourist arrivals to the Maldives increased at an average rate <strong>of</strong> 9.5% %.<br />
However, the Maldives, remains vulnerable to worldwide incidents, and tourist arrivals<br />
tends to decline heavily,<br />
followed by any such natural or manmade disasterss around the world. In 2009, arrivals<br />
to the Maldives declined<br />
due to the world economicc crisis. Nevertheless, Maldives bounced back the<br />
following year with a robust growth<br />
<strong>of</strong> over 20%.<br />
Table 7: Monthly Arrivals to the Maldives, 2007 - 2011<br />
Year<br />
Jan<br />
Feb<br />
Mar Apr May<br />
Jun<br />
Jul<br />
Aug<br />
Sep Oct<br />
Nov<br />
Dec<br />
Total<br />
2007 64,570<br />
2008 64,621<br />
2009 61,531<br />
2010 67,478<br />
2011 79,493<br />
65,224 64,491 63,171 46, 602 38,457 51,025 53,168<br />
67,963 71,623<br />
62,670 48, 764 40,283 47,675 51,824<br />
58,520 62,127<br />
57,186 43, 154 36,205 44,332 52,388<br />
77,063 74,975<br />
60,742 58, 324 44,050 57,232 66,315<br />
87,392 80,732<br />
79,947 64, 456 55,947 72,516 76,828<br />
48,468 58,706 56,797 65,210 675,889<br />
50,687 56,363 57,961 62,578 683,012<br />
50,396 62,432 61,986 65,595 655,852<br />
62,524 74,707 74,252 74,255 791,9177<br />
71,861 91,059 85,501 85,601 931,3333<br />
Source: Department <strong>of</strong> Immigration & Emigration<br />
In<br />
2011 the Maldives reached a new milestone in<br />
terms <strong>of</strong> arrival numbers reaching a total <strong>of</strong> 931,333 and<br />
registering an<br />
impressive17.6% growth over 2010. The UNWTO World<br />
<strong>Tourism</strong> Barometer, March <strong>2012</strong><br />
edition highlighted the Maldives among the countries which recorded the fastest growth<br />
for the year.<br />
Table 8: Growth Trends <strong>of</strong> Monthly Arrivals to the Maldives, 2007 – 2011 (percent)<br />
Jan<br />
Feb<br />
Mar<br />
Apr<br />
May<br />
Jun<br />
Jul<br />
Aug<br />
Sep<br />
Oct<br />
Nov<br />
Dec<br />
Total<br />
2007 10.7 19.2<br />
18.1 12. .8 13.8<br />
16.4 19.3<br />
6.4<br />
8.7 7.3<br />
6.0<br />
11.2 12.3<br />
2008 0.1 4.2<br />
11.1 -0.8 4.6<br />
4.7 -6.66 -2.5<br />
4.6 -4.0<br />
2.0<br />
-4.0 1.1<br />
2009 -4.8 -13.9<br />
-13.3 -8.8 -11.5<br />
-10.1 -7.0<br />
1.1<br />
-0.6 10.8<br />
6.9<br />
4.8 -4.0<br />
2010 9.7 31.7<br />
20.7 6. .2 35.2<br />
21.7 29. 1 26.6<br />
24.1 19.7<br />
19.8<br />
13.2 20.7<br />
2011 17.8 13.4<br />
7.7 31. .6 10.5<br />
27.0 26.7<br />
15.9<br />
14.9 21.9<br />
15.1<br />
15.3 17.6<br />
Source: Department <strong>of</strong> Immigration & Emigration<br />
7 | Page
[Type<br />
the document title]<br />
Major Markets<br />
Europe, as the leading market generator to the Maldives, captured over 57%<br />
market shares in 2011. With a total <strong>of</strong><br />
537,757 tourists the region<br />
recorded a growth <strong>of</strong> 6. .4% in 2011 compared with 2010. Although Europe sustained its<br />
market position, the market share has been dropping over the years. Share dropped from<br />
73.3% in 2007 to 57.7%<br />
at<br />
the<br />
end 2011. Leading markets from this region in 2011 were the United Kingdom, Germany, Italy, Russia, France<br />
and Switzerland.<br />
Asia and the Pacific is the<br />
second largest market generator to the Maldives. With a total <strong>of</strong> 348,887 tourists, this<br />
region secured<br />
over 37% market shares in 2011. With the rapid growth <strong>of</strong><br />
Chinese market over the last few years,<br />
the<br />
market share <strong>of</strong> Asia region has been increasing<br />
steadily. Market share increased from 22.9% in<br />
2007 to 37.5%<br />
at the end <strong>of</strong> 2011. Major markets from<br />
this region include China, Japan, India and Republic <strong>of</strong> Korea.<br />
Americas, Middle East and Africa region contributed 2.5%, 1.6% and 0.7% shares respectively<br />
in 2011.While<br />
market shares <strong>of</strong> Americas and the Middle East has<br />
been increasing steadily<br />
over the last five years,<br />
market share <strong>of</strong><br />
Africa show a slight drop from 2009 to 2010.<br />
Figure 4: Market Share by Regions, 2007 - 2011<br />
8 | Page
[Type<br />
the document title]<br />
Top Ten Generating Markets in 2011<br />
Europe and Asia Pacific region supplying over 95%<br />
to the market shares, the top ten markets to the<br />
Maldives<br />
generate from these two regions. While six markets from the top ten list were from Europe, remaining four<br />
were Asian markets. (Refer<br />
table 9)<br />
Table 9: Tourist Arrivals and Market Share <strong>of</strong> Top<br />
Ten Markets, 2011<br />
Rank<br />
2011 Country<br />
1 China<br />
2011<br />
Arrivals<br />
198,655<br />
Market<br />
Share<br />
(%)<br />
21.3<br />
2010<br />
Arrivals<br />
118,961<br />
Market<br />
Share<br />
(%)<br />
Rank<br />
20100<br />
15.0 1<br />
2 United Kingdom<br />
104,508<br />
11.2<br />
114,158<br />
14.4 2<br />
3 Germany<br />
90,517<br />
9.7<br />
77,108<br />
9.7 4<br />
4 Italy<br />
83,088<br />
8.9<br />
89,596<br />
11.3 3<br />
5 Russia<br />
63,936<br />
6.9<br />
49,111<br />
6.2 6<br />
6 France<br />
59,694<br />
6.4<br />
54,789<br />
6.9 5<br />
7 Japan<br />
35,782<br />
3.8<br />
38,791<br />
4.9 7<br />
8 Switzerland<br />
32,504<br />
3.5<br />
27,766<br />
3.5 8<br />
9 India<br />
30,978<br />
3.3<br />
25,756<br />
3.3 9<br />
10 Korea<br />
25,285<br />
2.7<br />
24,808<br />
3.1 10<br />
Global Total<br />
931,333<br />
791,917<br />
Source: Department <strong>of</strong> Immigration<br />
& Emigration<br />
While no new markets made it to the top ten list, only a slight change in market positions were noted from 3 rd to<br />
6 th<br />
positions. China and the<br />
United Kingdom maintained their ranks at the 1 st and 2 nd position with 21.3% sharess<br />
and 11.2% shares respectively. Germany and Italy<br />
switched positions as 3 rd and 4 th markets with 9.7% sharess<br />
and 8.9% shares respectively. Russia overtook France to climb to the 5 th<br />
position with 6.9% shares and the<br />
French market<br />
was pushed<br />
down to the 6 th position<br />
with a slight drop in its<br />
market share from 6.9%<br />
in 2010 to<br />
6.4% in 2011. Japan, Switzerland, India and Korea maintained<br />
their respective positions as the 7 th<br />
, 8 th , 9 th and<br />
10<br />
th markets. While the Japanese market share recorded a drop from 4.9% in<br />
2010 to 3.8% by 2011, Switzerland<br />
and India sustained their market shares at 3.5% and 3.3%. The Korean market also registered a drop in its<br />
market share from 3.1% in<br />
2010 to 2.7% by 2011.<br />
9 | Page
[Type<br />
the document title]<br />
1. China<br />
With its rapid increase in outbound tourism, China<br />
has become one <strong>of</strong> the<br />
largest global source markets for<br />
international tourism. According to the PATA (Pacific Asia Travel Association) Annual <strong>Tourism</strong><br />
Monitor<br />
<strong>2012</strong>, more than 58 million arrivals were generated from China to Asia Pacific Region in 2011. The World<br />
<strong>Tourism</strong> Organization forecasts that China will have 100 million<br />
outbound travelers by 2020.<br />
Figure 5: Growth & Market Share <strong>of</strong> China, 2007 - 2011<br />
Precent (%)<br />
120.0<br />
100.0<br />
80.0<br />
60.0<br />
40.0<br />
20.0<br />
0.0<br />
Market Share<br />
96.1<br />
Arrival Growth<br />
67.0<br />
46.1<br />
36.3<br />
15.4<br />
15.0<br />
21.3<br />
5.3 6.1 9.2<br />
2007 2008 2009 2010 2011<br />
Chinese arrivals to the Maldives<br />
have been growing rapidly over<br />
the last five years at<br />
an average<br />
rate <strong>of</strong> 52.2%. With<br />
a total <strong>of</strong><br />
118,961 arrivals and 15% <strong>of</strong><br />
total shares, China became the<br />
number one market to the<br />
Maldives<br />
in 2010. The market<br />
maintained its position in 2011<br />
by further increasing its shares<br />
to 21.3%<br />
with 198,655 arrivals<br />
that year. This huge<br />
increase in<br />
Chinese arrivals to the Maldives<br />
mainly accounts for the increased direct access between Maldives and China as welll as the strong demand<br />
for Maldives as a honeymoon destination among Chinese.<br />
Figure 6: Monthly Arrivals <strong>of</strong><br />
Chinese Market, 2007 - 2011<br />
Percent (%)<br />
25,000<br />
20,000<br />
15,000<br />
10,000<br />
5,000<br />
0<br />
Jan Feb Mar Apr May<br />
Jun Jul Aug Sep Oct Nov Dec<br />
2007<br />
2008<br />
2009<br />
2010<br />
1,855 4,591 1, 647 1,981 3,5055 2,722 3,159 3,996 3,450 4,097 2,671 2,302<br />
2,569 5,638 2,065 2,408 3,631<br />
3,133 3,903 3,440 4,724 4,286 3,101 2,613<br />
5,912 2,682 2, 363 3,417 3,706<br />
3,226 5,206 6,197 6,141 10,805 6,286 4,725<br />
6,069 13,345 6, 144 7,060 8,964<br />
8,615 12,449 14,998 13,028 13,476 8,313 6,500<br />
2011 12,367 18,759 8,968 10,165 14,889 15,410 23,176 22,827 20,107 22,595 16,897 12,495<br />
Figure 6 represents<br />
monthly<br />
arrivals from China to the<br />
Maldives<br />
from 2007<br />
to 2011. As<br />
seen from the graph, while the<br />
peak season for Chinese arrivals is<br />
recordedd to be from July to<br />
October,<br />
a sharp increase in<br />
arrivals is registered for the month<br />
<strong>of</strong> February. The Chinese New<br />
Year holidays falling into the<br />
month <strong>of</strong> February, is one <strong>of</strong> the<br />
major reasons for<br />
increased<br />
arrivals during this month.<br />
10<br />
| Page
[Type<br />
the document title]<br />
2. United Kingdom<br />
Although the UK market has traditionally been<br />
the largest source market to the Asia Pacificc region from<br />
Europe, an overall 1% decline was recorded from this market for the region in 2011. According<br />
to the PATAA<br />
(Pacific Asia Travel Association) Annual <strong>Tourism</strong> Monitor <strong>2012</strong> early edition, during the year 2011 a total <strong>of</strong><br />
9.4 million visitors from<br />
UK travelled to the Asia Pacific region. Out <strong>of</strong> which 0.248 million travelled to South<br />
Asia.<br />
Figure 7: Growth & Market Share <strong>of</strong> U.K, 2007 - 2011<br />
Percent (%)<br />
20.0<br />
15.0<br />
10.0<br />
5.0<br />
0.0<br />
-5.0<br />
-10.0<br />
-15.0<br />
18.5<br />
15.9<br />
2007<br />
17.1<br />
Market Share<br />
2008<br />
-6.7<br />
Arrival Growth<br />
16.2<br />
2009<br />
-9.3<br />
14.4<br />
7.7<br />
2010<br />
11.2<br />
2011<br />
-8.5<br />
The United Kingdom is a well-<br />
established traditional market<br />
to<br />
the Maldives. UK<br />
remained as<br />
the number one market to the<br />
Maldives till end 2009. The<br />
market<br />
however, has been<br />
unstable since 2008 registering<br />
negative growths and dropping<br />
its market shares. In 2010, the<br />
UK market recorded a positive<br />
growth <strong>of</strong> 7.7% however the<br />
market lost nearly 2% <strong>of</strong> its<br />
sharess along with its number<br />
one position.<br />
In 2011, the Maldives<br />
received a total <strong>of</strong> 104,508 visitors from UK, which was a decline <strong>of</strong> -8.5% compared<br />
with 2010. With this decline, a considerable<br />
drop in market share, from 14.4% in<br />
2010 to 11.2% in 2011,<br />
was also recorded. This decline is mainly associated with European economic crisis.<br />
Figure 8: Monthly<br />
Arrivals <strong>of</strong> U.K Market, 2007<br />
- 2011<br />
Arrival numbers<br />
14,000<br />
12,000<br />
10,000<br />
8,000<br />
6,000<br />
4,000<br />
2,000<br />
0<br />
Jan Feb Mar Apr May Jun Jul Aug Sep<br />
Oct Nov Dec<br />
2007 10,952 11,913 10,787 10,912 8, ,599 8,109 11,2722 10,783 10,092 11,332 9,719 10,688<br />
2008 9,638 11,238 12,544 11,150 7, ,972 8,037 9,136<br />
9,789 10,448 9,541 8,470 8,8588<br />
2009 7,751 8,573 9,973 9,014 8, ,200 7,558 7,994<br />
9,399 9,100 9,805 9,726 8,857<br />
2010 8,405 10,422 11,394 9,529 9, ,460 6,728 9,053 10,259 9,917 10,419 9,614 8,9588<br />
2011 8,435 9,661 9,637 11,167 7, ,988 6,338 7,795 8,855 8,896 9,537 8,310 7,889<br />
Figure<br />
8 represents monthly<br />
arrivals from the<br />
U.K market<br />
from 2007 to 2011. As can be<br />
seen from the figure, while the<br />
months <strong>of</strong> March<br />
and October<br />
are recorded to be the peak<br />
months for arrivals from U.K,<br />
arrivals is at its lowest during<br />
the month <strong>of</strong> June.<br />
111 | Page
[Type<br />
the document title]<br />
3.<br />
Germany<br />
International visitor arrivals from Germany into Asia Pacific region increased by 2% with a total <strong>of</strong> 4.9 million<br />
visits, reported<br />
the PATAA (Pacific Asia Travel Association) Annual <strong>Tourism</strong> Monitor <strong>2012</strong> early edition.<br />
According to the Travel Monitor, although the least visited sub region by Germans, South Asia recorded the<br />
strongest gain <strong>of</strong> +18% , receiving a total <strong>of</strong> 0.171 million tourists from Germany during<br />
the year 2011.<br />
Figure 9: Growth & Market Share <strong>of</strong> Germany, 2007 - 2011<br />
Percent (%)<br />
20.0<br />
15.0<br />
10.0<br />
5.0<br />
0.0<br />
-5.0<br />
-10.0<br />
10.7<br />
2007<br />
2. 0<br />
Market Share<br />
Arrival Growth<br />
10.1<br />
2008<br />
-4.2<br />
10.5<br />
2009<br />
-0.2<br />
11.6<br />
9.7<br />
2010<br />
9.7<br />
2011<br />
17.4<br />
Germany was the third largest<br />
market to the Maldives at the<br />
end <strong>of</strong> 2011. Although the<br />
market<br />
has lost 1%<br />
<strong>of</strong> its shares<br />
throughh 2007 to 2011, it appears<br />
to have stabilized in 2011.<br />
During<br />
the world economic<br />
recession<br />
period, 2008 and<br />
2009, the market<br />
recorded<br />
negative growths. Whilst market<br />
share remained constant<br />
at<br />
9.7%, the market performed<br />
remarkably well with increased<br />
volume in 2011. In terms <strong>of</strong> market ranking, Germany overtook Italy to jump up to the 3 rd position in 2011.<br />
The Maldives recorded a total <strong>of</strong> 90,517 visitss from German market during the year 2011, which was an<br />
increase <strong>of</strong> 17.4% compared with 2010.<br />
Figure 10: Monthly<br />
Arrivals <strong>of</strong> German<br />
Market, 2007 - 20111<br />
Arrival numbers<br />
12,000<br />
10,000<br />
8,000<br />
6,000<br />
4,000<br />
2,000<br />
0<br />
Jan Feb Mar Apr May Jun Jul Aug Sep Oct Nov Dec<br />
2007<br />
2008<br />
2009<br />
20100 5,911<br />
6,000<br />
5,364<br />
5,890<br />
6,186<br />
6,182<br />
5,319<br />
6,602<br />
6,982<br />
7,949<br />
6,268<br />
8,554<br />
6,718<br />
6,015<br />
6,718<br />
5,317<br />
6,930 6,983 6,341 7,634 4,288<br />
3,964<br />
3,738<br />
3,748<br />
4,629<br />
4,163<br />
3,972<br />
4,402<br />
4,790<br />
4,103<br />
4,636<br />
4,943<br />
5,850<br />
5,292<br />
5,806<br />
6,412 7,450 6,647 7,886 8,937<br />
6,829<br />
6,880<br />
7,297<br />
8,444<br />
5,706<br />
5,062<br />
5,740<br />
6,225<br />
2011 6,109 6,874 8,906 9,389 7,467 5,276 5,034 5,918 6,956 10,986 10,058 7,544<br />
As with other European markets,<br />
the monthly arrival pattern <strong>of</strong><br />
German tourists is<br />
very similar<br />
over the last five years except<br />
for the year 2011, where an<br />
increase is registered for the<br />
month <strong>of</strong> April while in other<br />
years, arrivals drop during this<br />
month. October to<br />
March is the<br />
most visible peak<br />
season and<br />
lowest<br />
count in<br />
arrivals is<br />
recorded for the moth June.<br />
12<br />
| Page
[Type<br />
the document title]<br />
4. Italy<br />
As<br />
per figures released by Pacific Asia<br />
Travel Association (PATA), touristt arrivals from<br />
the Italian<br />
market, to<br />
Asia Pacific destinations declined by -1.04% in 2011. While in 2010, the<br />
region received a total<br />
<strong>of</strong> 599.06<br />
thousand Italians, this region was able to attract 592.84 thousand tourists in<br />
2011. According to PATA figures,<br />
with over 50%<br />
<strong>of</strong> total Italian arrivals<br />
to the regions, Northeast Asian destinations are most popular among<br />
Italians. In 2011 South Asia received a total <strong>of</strong> 94.36 thousand<br />
tourists from Italy, which was 15.9% <strong>of</strong> total<br />
Italians that travelled to the<br />
region thatt year.<br />
Figure 11: Growth & Market Share <strong>of</strong> Italy, 2007 - 2011<br />
20.0<br />
Percent (%)<br />
15.0<br />
10.0<br />
5.0<br />
0.0<br />
-5.0<br />
-10.0<br />
-15.0<br />
-20.0<br />
17.3<br />
-1.4<br />
15.2<br />
2007 2008<br />
-11.4<br />
13.6<br />
2009<br />
-14.0<br />
11.3<br />
0.3<br />
2010<br />
Market Share<br />
Arrival Growth<br />
2007 to 8.9%<br />
by the end<br />
<strong>of</strong> 2011. Italy was the fourth largest market to<br />
the Maldives in 2011. The declinee is<br />
associated with multiple<br />
factors, from European<br />
economy performance<br />
e to decline in Italian managed tourist<br />
facilities and<br />
upgrading <strong>of</strong> Maldives resort facilities over the years.<br />
8.9<br />
2011<br />
-7.3<br />
Italians being the first group<br />
<strong>of</strong><br />
travelers to the Maldives, this<br />
market has played a major role<br />
in the tourism industry <strong>of</strong> the<br />
Maldives since tourism began<br />
in<br />
the country in 1972. Since 1998<br />
till end 2006, Italy, with the<br />
largest<br />
share <strong>of</strong> arrivals,<br />
remained as the number one<br />
market to the Maldives. In 2007,<br />
with the drop in market the<br />
Italian went down to the second<br />
position. Over the last five years<br />
the Italian market lost more than<br />
half <strong>of</strong> its shares from 17.3% in<br />
Figure 12:<br />
Monthly Arrivals <strong>of</strong><br />
Italian Market, 2007 - 2011<br />
Arrival numbers<br />
18,000<br />
16,000<br />
14,000<br />
12,000<br />
10,000<br />
8,000<br />
6,000<br />
4,000<br />
2,000<br />
0<br />
2007<br />
2008<br />
2009<br />
2010<br />
2011<br />
Jan Feb Mar Apr May Jun Jul Aug Sep<br />
15,507 14,323 13,872 13,488 5,455 5,027 6,925<br />
9,555 5,896<br />
13,473 13,630 14,865 11,246 4,212 3,683 5,432<br />
8,305 5,972<br />
10,441 11,604 12,599 9,306 3,764 3,828 4,3233 7,629 5,004<br />
12,276 12,003 13,153 7,577 3,213 3,495 3,882<br />
8,351 4,167<br />
12,828 11,499 12,143 8,398 3,077 2,347 3,208<br />
7,267 3,479<br />
Oct Nov Dec<br />
7,912 7,034 12,252<br />
5,579 6,711 10,715<br />
4,658 5,943 10,193<br />
5,153 6,506 9, ,845<br />
4,610 5,543 8, ,929<br />
Figure 12 shows the monthly<br />
arrival<br />
pattern from Italian<br />
market to the Maldives. As can<br />
be seen from the graph, a<br />
consistent pattern is seen from<br />
this market over the last five<br />
years. Arrivals start to increase<br />
from<br />
the month<br />
<strong>of</strong> November<br />
and increasing steadily till<br />
March. From April to July the<br />
market gradually slows down<br />
and attains its lowest during the<br />
month <strong>of</strong> June. After a sharp<br />
increase in August, Italian<br />
arrival again drops during the month <strong>of</strong> September.<br />
13<br />
| Page
[Type<br />
the document title]<br />
5. Russia<br />
The PATA (Pacific Asia<br />
Travel Association) Annual <strong>Tourism</strong> Monitor <strong>2012</strong> early<br />
edition reported that<br />
Arrivals from<br />
Russia to the Asia Pacific region increased by<br />
19% reaching 4.5 million at the end <strong>of</strong> 2011.<br />
When looking<br />
at sub regional level data collected<br />
by PATA for the Russian market, the strongest growth in<br />
2011was recorded for the Southeast Asia region with 54% followed by South Asia with<br />
34%.<br />
Figure 13: Growth & Market Share <strong>of</strong> Russia, 2007<br />
- 2011<br />
Percent (%)<br />
60.0<br />
50.0<br />
40.0<br />
30.0<br />
20.0<br />
10.0<br />
0.0<br />
-10.0<br />
-20.0<br />
-30.0<br />
45.0<br />
4.7<br />
2007<br />
53.8<br />
7.2<br />
2008<br />
6.1<br />
2009<br />
-18.3<br />
and a slight increase in market share,<br />
the Russian<br />
market overtook France<br />
to jump to the 5 th position.<br />
22.7<br />
6.2<br />
2010<br />
Market Share<br />
Arrival Growth<br />
30.2<br />
6.9<br />
2011<br />
At the end <strong>of</strong> 2011, Russia was<br />
the 5 th largest market to the<br />
Maldives.<br />
The market<br />
performed remarkably well over<br />
the last five years with an<br />
average growth <strong>of</strong><br />
26%. The<br />
decline recorded for the year<br />
2009 was due to the overall<br />
decline in arrivals that year as a<br />
result <strong>of</strong> world economicc<br />
recession which started in late<br />
2008. In 2011 with 63,9366<br />
arrivals,<br />
a strong growth <strong>of</strong> 30%<br />
Figure 14: Monthly Arrivals <strong>of</strong> Russian Market, 2007 - 20111<br />
Arrival numbers<br />
8,0000<br />
7,0000<br />
6,0000<br />
5,0000<br />
4,0000<br />
3,0000<br />
2,0000<br />
1,0000<br />
0<br />
Jan Feb Mar Apr May Jun Jul Aug Sep Oct Nov Dec<br />
2007 4,401 2,205 2,696 2,958 1,791 1,257 1,654 2,239 1,932 2,793 3,8554,064<br />
2008 5,507 3,339 4,730 4,313 3,345 2,225 2,691 3,511 2,834 3,997 6,3976,089<br />
2009 6,591 3,220 3,829 3,028 2,251 1,510 2,382 2,730 2,248 3,506 3,8394,880<br />
2010 5,873 3,285 4,301 3,899 3,704 2,569 3,098 4,176 3,488 4,482 4,7505,486<br />
2011 6,256 4,347 6,043 5,205 4,793 3,812 4,565 5,214 4,594 5,887 6,0087,212<br />
A harmonious monthly trend is<br />
observed from the<br />
Russian<br />
market over the last five years.<br />
(refer Figure 14). While in 2007<br />
and 2009 January is the peak<br />
month for Russian tourists to the<br />
Maldives, in 2008, 2010 and<br />
2011 December is recorded to<br />
be the peak month. A sharp drop<br />
in arrivals is recorded from<br />
January<br />
to February.<br />
From February to March arrivals from Russia yet again increase as sharply. However, from March till June<br />
Russian arrivals drops<br />
steadily. June is recorded to be the lowest month <strong>of</strong> arrivals from this market to the<br />
Maldives.<br />
14<br />
| Page
[Type<br />
the document title]<br />
6. France<br />
In<br />
2011, arrivals from France into Asia Pacific destinations increased by 6% to reach a total volume <strong>of</strong> nearly<br />
4.7 million, reported the PATA (Pacific Asia Travel Association) Annual <strong>Tourism</strong> Monitor <strong>2012</strong> early edition.<br />
As per the <strong>Tourism</strong> Monitor, South Asia was the<br />
fastest growing sub-region for the French market in 2011,<br />
with a total <strong>of</strong> 133,000 arrivals which was an improvement <strong>of</strong> over 22% compared with<br />
2010.<br />
Figure 15: Growth & Market Share <strong>of</strong> France, 2007 - 2011<br />
In 2011, the Maldives received<br />
a<br />
total <strong>of</strong> 59,694 tourists from<br />
France,<br />
which was<br />
an increment<br />
<strong>of</strong> 9% compared with 2010. The<br />
French market has been stable<br />
over the last five years with an<br />
averagee growth <strong>of</strong> 6.5%. While<br />
all<br />
other markets registered negative<br />
growths<br />
during the world<br />
economic crisis in 2008 and 2009,<br />
the French market performed very<br />
well with positive growths <strong>of</strong><br />
6.2% and 4.7% in 2008 and 2009<br />
respectively.<br />
From 2007 till 2009 the<br />
French market share increased steadily. However, in 2010 and 2011 the market share<br />
dropped considerably from 7.7%in 2009 to 6.4%<br />
by end 2011. France was the 6 th largest market to the Maldives<br />
at the end <strong>of</strong> 2011.<br />
Figure 16: Monthly<br />
Arrivals <strong>of</strong> French Market, 2007 - 20111<br />
Figure 16 illustrates the monthly<br />
arrival pattern <strong>of</strong> French market<br />
to the Maldives from 2077 to<br />
2011. As can be seen from the<br />
graph, a uniform<br />
monthly<br />
pattern is observed from this<br />
market<br />
over the last five years.<br />
As with all European markets,<br />
the lowest count in<br />
arrivals from<br />
France is registered for the<br />
month <strong>of</strong> June and February, the<br />
peak month.<br />
15<br />
| Page
[Type<br />
the document title]<br />
7. Japan<br />
Outbound travel from Japan to Asia Pacific destinations posted<br />
a growth <strong>of</strong> over 2% in<br />
2011. According to the<br />
PATA (Pacific Asia Travel Association) Annual<br />
<strong>Tourism</strong> Monitor <strong>2012</strong>2 early edition, a total <strong>of</strong> over 17.4<br />
million Japanese travelled<br />
to the Asia Pacific region. The South Asian destinations, although recorded the least<br />
in<br />
terms <strong>of</strong> volume in arrivals, was the<br />
second best<br />
performing<br />
region in terms <strong>of</strong> its growth rate over 2010. As<br />
per the <strong>Tourism</strong> Monitor, a total <strong>of</strong> 0.823 million Japanese travelled to South Asia Region in 2011.<br />
Figure 17: Growth & Market Share <strong>of</strong> Japan, 2007<br />
- 2011<br />
Percent (%)<br />
8.0<br />
6.1<br />
6.0<br />
4.0 4.0<br />
2.0<br />
0.0<br />
2007<br />
-2.0<br />
-4.0<br />
-6.0<br />
-8.0<br />
-10.0<br />
5.6 5.6 4.9<br />
5.9<br />
3.8<br />
2008 2009 2010 2011<br />
-4.1<br />
-7.1<br />
Market Share<br />
-7.8<br />
Arrival Growth<br />
The Japanese market played a<br />
major role in the inbound tourism<br />
market to the Maldives in the<br />
tourism<br />
history <strong>of</strong><br />
the country.<br />
Apart from being one <strong>of</strong> the top<br />
five markets, Japan was the<br />
number<br />
one Asian market to the<br />
Maldives till the year 2007. The<br />
market however, has been<br />
unstable<br />
and declining gravely<br />
since then. Over the<br />
last five years<br />
the Japanese market share has<br />
droppedd considerably from 6.1%<br />
in 2007<br />
to 3.8% by end 2011.<br />
Five year average growth rate <strong>of</strong> the<br />
market stood at -1.8%. In 2011, with a total <strong>of</strong> 35,782 tourists Japan was<br />
the 7 th largest market to the Maldives.<br />
Figure 18: Monthly Arrivals <strong>of</strong> Japanese Market, 2007 - 2011<br />
Arrival numbers<br />
5,000<br />
4,500<br />
4,000<br />
3,500<br />
3,000<br />
2,500<br />
2,000<br />
1,500<br />
1,000<br />
500<br />
0<br />
Jan Feb Mar Apr May<br />
Jun Jul Aug Sep Oct<br />
Nov Dec<br />
2007<br />
2,586 3,293 3,623 3,173 2,057 2,822 3,554 4,322 4,714 3,913 3,477 3,587<br />
2008 2,269 2,985 3,088 2,832 2,305 3,062 3,746 3,966 4,288 3,413 3,178 3,061<br />
2009<br />
2,255 2,802 3,204 2,796 2,080 2,270 3,274 3,838 4,474 3,280 3,179 3,189<br />
20100 2,275 3,090 3,169 2,684 2,024 2,626 3,595 4,061 4,447 3,569 3,738 3,513<br />
2011 2,592 3,129 2,819 2,931 1,768 2,239 3,008 4,116 3,786 3,334 2,891 3,169<br />
The Japanese market, although<br />
has dropped considerably over the<br />
years, a consistency has been<br />
maintained<br />
for the monthly<br />
performance. Contrary to the<br />
European<br />
markets, the peak<br />
month for Japanesee arrivals to the<br />
Maldives is recorded<br />
to be<br />
September and the lowest is May.<br />
(refer Figure 18)<br />
16<br />
| Page
[Type<br />
the document title]<br />
8. Switzerland<br />
As per figures released by Pacific Asia Travel Association (PATA) Asia<br />
Pacific destinations received a total<br />
<strong>of</strong> 332,997 tourists from<br />
Switzerland, which was a 5.8% increase compared with<br />
the 314,786 Swiss that<br />
arrived to this destination in 2010. According to<br />
PATA figures, in 2011 the most traveled sub-region in Asia<br />
Pacific by Swiss was Southeast Asian destinations covering over 58% <strong>of</strong><br />
total arrivals to the region that year.<br />
In 2011 South Asia received a total <strong>of</strong> 38,527 tourists from Switzerland,<br />
which was 12.2% <strong>of</strong> total Swiss that<br />
travelled to the region that year.<br />
Figure 19: Growth & Market Share <strong>of</strong> Switzerland, 2007 - 2011<br />
Percent (%)<br />
18.0<br />
16.0<br />
14.0<br />
12.0<br />
10.0<br />
8.0<br />
6.0<br />
4.0<br />
2.0<br />
0.0<br />
-2.0<br />
3.9<br />
-0.3<br />
2007<br />
4.0<br />
3.1<br />
2008<br />
Market Share<br />
Arrival Growth<br />
4.1<br />
3.5<br />
3.7<br />
2009 -0. 7 2010<br />
17.11<br />
3.5<br />
2011<br />
In 2011 the Maldives received<br />
a<br />
total <strong>of</strong> 32,504 tourists from<br />
Switzerland,<br />
which<br />
was an<br />
increase <strong>of</strong> 17.1% compared<br />
with the 27,766 arrivals in 2010.<br />
Tourist arrivals to<br />
the Maldives<br />
from Swiss market have been<br />
increasing steadily<br />
over the last<br />
five years at an average rate <strong>of</strong><br />
4.6%. The Swiss market share<br />
increased steadily from 2007 till<br />
end 2009.<br />
In 2010, the market share droppedd considerably from 4.1%<br />
to 3.5% and in 2011 it<br />
remained at 3.5%. At the<br />
end <strong>of</strong> 2011, Switzerland was the 8<br />
th largest market to the Maldives<br />
Figure 20: Monthly<br />
Arrivals <strong>of</strong> Swiss Market, 2007 - 2011<br />
Arrival numbers<br />
4,500<br />
4,000<br />
3,500<br />
3,000<br />
2,500<br />
2,000<br />
1,500<br />
1,000<br />
500<br />
0<br />
Jan Feb Mar Apr May Jun Jul Aug Sep Oct Nov Dec<br />
2007 2,551 2,581 2,702 3,731 1,478 956 1,817<br />
904 1,726 2, ,221 2,792 2,724<br />
2008 2,815 2,883 3,265 2,933 1,465 1,214 1,459<br />
1,099 1,665 2, ,544 3,080 2,561<br />
2009 2,522 2,715 3,055 3,010 1, 559 1,025 1,7111 1,382 1,848 2, ,464 3,221 2,271<br />
2010 2,949 3,145 2,942 2,585 1, 867 953 1,5999 1,247 1,745 3, ,254 3,186 2,294<br />
2011 3,148 3,173 3,163 3,988 1, 996 1,010 2,2822 1,302 1,752 3, ,978 3,449 3,2633<br />
Figure<br />
20 illustrates the monthly<br />
arrivals from Swiss market to<br />
the Maldives from<br />
2007-2011.<br />
As seen from the<br />
graph, while<br />
June and August are recorded to<br />
have the lowest count arrivals<br />
from this market,<br />
arrivals is at<br />
its peak during the months <strong>of</strong><br />
April and November.<br />
17<br />
| Page
[Type<br />
the document title]<br />
9. India<br />
According to<br />
the PATA (Pacific Asia Travel Association) Annual <strong>Tourism</strong> Monitor <strong>2012</strong> early edition, India<br />
generated close to 5.4 million arrivals to Asia Pacific destinations in 2011. This was an increase <strong>of</strong> 7.3% over<br />
2010. Although in terms <strong>of</strong> volume, Southeast Asia destinations captured most <strong>of</strong> the arrivals from<br />
India to the<br />
Asia Pacific destinations,<br />
South Asia recorded the<br />
highest growth rate for the Indian market over 2010.<br />
Figure 21:<br />
Growth & Market Share <strong>of</strong> India, 2007<br />
- 2011<br />
Percent (%)<br />
70.0<br />
60.0<br />
50.0<br />
40.0<br />
30.0<br />
20.0<br />
10.0<br />
0.0<br />
-10.0<br />
2.6<br />
2007<br />
43.5<br />
Market Share<br />
Arrival Growth<br />
2.4<br />
2008<br />
-3.8<br />
2.4<br />
2009<br />
-4.9<br />
3.3<br />
2010<br />
62.5<br />
3.3<br />
2011<br />
20.3<br />
The Indian market to the<br />
Maldives has been growing at<br />
above average growth rates <strong>of</strong><br />
23.5% over the last five years.<br />
In 2011, Maldives received a<br />
total <strong>of</strong> 32,504 tourists from<br />
India, which was an increase <strong>of</strong><br />
20.3% compared with 2010.<br />
Market share remained at 3.3% %.<br />
Being a neighboring country and<br />
having<br />
easier access,<br />
India<br />
remains to be a potential tourist<br />
market<br />
to the Maldives.<br />
Figure 22: Monthly<br />
Arrivals <strong>of</strong> Indian Market, 2007 - 2011<br />
Arrival numbers<br />
4,500<br />
4,000<br />
3,500<br />
3,000<br />
2,500<br />
2,000<br />
1,500<br />
1,000<br />
500<br />
0<br />
Jan Feb<br />
Mar Apr May Jun Jul Aug Sep Oct Nov Dec<br />
2007 1,578 1,184 1,156 1,592 2,051 1,275 1,237 1,099 1,159<br />
1,278 1,634 2,084<br />
2008 1,436 1,313 1,467 1,337 2,001 1,425 1,147 1,231 1,036<br />
1,425 1,037 1,808<br />
2009 1,290 1,143 1,163 1,165 1,425 1,058 1,032 999 1,328<br />
1,462 1,421 2,364<br />
2010 1,742 1,594 1,385 1,802 2,400 1,999 1,871 1,419 1,8388 2,387 3,110 4,209<br />
2011 2,786 2,078 2,030 2,109 2,813 2,659 2,359 1,963 1,820<br />
3,007 3,232 4,122<br />
The monthly arrivals pattern<br />
<strong>of</strong><br />
Indian market is shown in figure<br />
22. As seen from<br />
the graph, the<br />
monthly behavior <strong>of</strong> this market<br />
remained consistent from 2007<br />
till 2009. In 2010 and 2011,<br />
monthly performance from this<br />
market<br />
has<br />
changed<br />
significantly.<br />
Unlike other<br />
markets,<br />
the Indian market<br />
performs well during the month<br />
<strong>of</strong> May with a sharp increase<br />
during the month.<br />
18<br />
| Page
[Type<br />
the document title]<br />
10. Korea<br />
The Republic <strong>of</strong> Korea generated nearly 13 million tourists into the Asia Pacific destinations in 2011.<br />
According to<br />
the PATAA (Pacific Asia Travel Association)<br />
Annual <strong>Tourism</strong> Monitor <strong>2012</strong> early edition,<br />
arrivals from<br />
the Korean market across Asia Pacific destinations increased<br />
by less than<br />
1% in 2011.<br />
Figure 23: Growth & Market Share <strong>of</strong> Korea, 2007 - 2011<br />
Percent (%)<br />
60.0<br />
50.0<br />
40.0<br />
30.0<br />
20.0<br />
10.0<br />
0.0<br />
-10.0<br />
-20.0<br />
29.8<br />
3.1<br />
2007<br />
Market Share<br />
Arrival Growth<br />
3.1<br />
-0.2<br />
2008<br />
2.5<br />
2009<br />
53.8<br />
3.1<br />
2010<br />
2.7<br />
1.9<br />
2011<br />
The Maldives received a total <strong>of</strong><br />
25,285 tourists from Korea in<br />
2011, which was a 1.9% growth<br />
compared with that <strong>of</strong> 2010.<br />
Although there was<br />
an increasee<br />
in arrivals from this market, a<br />
slight drop in market share was<br />
recordedd in 2011. Over the last<br />
five years, from 2007 to 2011,<br />
the market grew at<br />
an averagee<br />
annual rate <strong>of</strong> 12.5% %.<br />
-30.0<br />
-22.9<br />
Figure 24: Monthly<br />
Arrivals <strong>of</strong> Korean Market, 2007 - 20111<br />
Figure 24 show the monthly<br />
arrival pattern <strong>of</strong><br />
the Korean<br />
market. While the months <strong>of</strong><br />
May, October and November are<br />
recorded to be the<br />
peak months<br />
for Korean arrivals, lowest count<br />
in arrivals is recorded for the<br />
months<br />
<strong>of</strong> January and July.<br />
19<br />
| Page
[Type<br />
the document title]<br />
SECTION 3:<br />
ECONOMIC<br />
INDICATORS<br />
<strong>Tourism</strong> Contribution to the Economy<br />
<strong>Tourism</strong> is the largest economic activity in the country as well as the major<br />
source <strong>of</strong> foreign exchange earnings.<br />
Figure 25 shows the GDP contributionn by major sectors in 2011. As displayed in the figure tourism<br />
contributionn<br />
to the GDP in<br />
2011 was 30% whichh was an increase <strong>of</strong> 1. .8% compared with that <strong>of</strong> 2010. Construction<br />
n,<br />
Manufacturing, Electricity<br />
& Water all together<br />
contributed<br />
15% to GDP, Transport and Communicationn<br />
contributed 18% to the country’s GDP in 2011.<br />
Figure 25: GDP Contribution by Major Economic Sectors, 2011<br />
Source: Department <strong>of</strong> National Planning<br />
20<br />
| Page
[Type<br />
the document title]<br />
With the increase in tourism supply and demand, the contribution from tourism to the country’s GDP has<br />
been increasing over the years (refer Table 10). In<br />
2008, while the GDP contribution in currency, recorded<br />
an<br />
increase, the percent share declined by 2.2%. From 2008 to 2009 again a slight decline was recorded<br />
which was due to global financial crisis. However the industry managed to achieve a GDP growth rate <strong>of</strong><br />
2. .5% in 2010.<br />
The percentage share <strong>of</strong> tourism contribution to<br />
GDP was seen at 30.2%<br />
for the first time in<br />
2011 after the<br />
Asian Tsunami <strong>of</strong> December 2004. The steady increase leads us to consider that the<br />
tourism<br />
sector has the potential for<br />
a steady growth in GDP<br />
share in the<br />
long-term future.<br />
Table 10: <strong>Tourism</strong> Contribution to GDP, 2007-2011<br />
(Million Rufiyaa, at<br />
2003 Constant Prices)<br />
Year<br />
GDP<br />
GDP Growth %<br />
<strong>Tourism</strong> Contribution<br />
% Share <strong>of</strong> <strong>Tourism</strong><br />
Contribution<br />
2007 16,512.00<br />
10.6<br />
4,704.00<br />
28.5<br />
2008 18,526.00<br />
12.2<br />
4,870.00<br />
26.3<br />
2009 17,648.00<br />
-4.7<br />
4,608.00<br />
26.1<br />
2010 18,659.00<br />
5.7<br />
5,335.00<br />
28.6<br />
2011 20,051.00<br />
7.5<br />
6,061.00<br />
30.2<br />
Source: Department <strong>of</strong> National Planning<br />
<strong>Tourism</strong> revenue refers to<br />
the lease rent payable to<br />
government by the islands leased for resort development,<br />
the bed tax <strong>of</strong> US$ 8 collected from<br />
all tourist accommodating establishments and the newly introduced<br />
<strong>Tourism</strong> Goods and Service Tax (T-GST) collected<br />
from all tourist facilities. The T-GST was first introduced<br />
in<br />
October 2011 at the rate<br />
<strong>of</strong> 3.5%. The rate was later increased to 6% in January <strong>2012</strong>. The resort<br />
lease rent<br />
formula was also revised in 2011 from a tourist bed based rent to a land<br />
area based<br />
rent wheree US$ 8 is<br />
charged per square meter <strong>of</strong> the land.<br />
As seen from<br />
Table 11 the percentage share <strong>of</strong> tourism revenue droppedd from 34% to 28.4% in 2008 and<br />
further 26.9 in<br />
2009. However, 2011 saw an increase <strong>of</strong> 13%. The industry<br />
reached an all-time highh <strong>of</strong> 39.7%<br />
share earning 3.3 billion Rufiyaa as revenue out <strong>of</strong> which 1.6 billion was received as tourism tax. The huge<br />
increase in tourism tax revenue was due to the newly introduced T-GST.<br />
Table 11: <strong>Tourism</strong> Revenue and<br />
Tax, 2007-2011<br />
(Million Rufiyaa)<br />
Government <strong>Tourism</strong><br />
% Share <strong>of</strong><br />
Year<br />
Revenue Revenu e <strong>Tourism</strong> Revenue<br />
<strong>Tourism</strong> Tax<br />
% Share <strong>of</strong><br />
<strong>Tourism</strong> Tax to<br />
<strong>Tourism</strong> Revenue<br />
2007<br />
6,527.20<br />
_/ 2,216.000 _/<br />
34.0<br />
547.30<br />
_/<br />
24.7 _/<br />
2008<br />
6,939.30<br />
_/ 1,969.80<br />
28.4<br />
566.55<br />
28.8<br />
2009<br />
5,313.30<br />
_/ 1,429.81<br />
26.9<br />
531.41<br />
37.2<br />
2010<br />
6,392.40<br />
_/ 1,711.30<br />
26.8<br />
602.70<br />
35.2<br />
2011<br />
8,323.30<br />
3,305.000<br />
39.7<br />
1,588.00<br />
48.0<br />
Source:<br />
<strong>Ministry</strong><br />
<strong>of</strong> Finance and Treasury<br />
Maldives<br />
Inland Revenuee Authority<br />
Note:<br />
_/ Revised Figures<br />
21<br />
| Page
[Type<br />
the document title]<br />
<strong>Tourism</strong> receipts is the expenditure made by tourists during their stay in<br />
the Maldives, hence calculated in<br />
US Dollars. With the introduction <strong>of</strong> T-GST in 2011, it was found that tourism receipts have been under<br />
estimated over the years. Hence, the Maldives Monetary Authority (MMA), Central Bank <strong>of</strong> Maldives,<br />
revised their calculations for <strong>Tourism</strong> Receipts using the<br />
GST records <strong>of</strong> Maldives Inland<br />
Revenue<br />
Authority (MIRA).<br />
As seen from<br />
Table 12, <strong>Tourism</strong> Receipts have been increasing over the last five years, with the exception<br />
<strong>of</strong> 2009 which recorded a decline 8.3% reflecting<br />
the decline in arrivals that year due to the global financial<br />
crisis which started in 2008. The percentage is steadily climbing from 2010 onwards with 2011 closing at<br />
20.90% which is an all time high tourism receipt <strong>of</strong> 1.87 billion US dollars.<br />
Table 12:<br />
<strong>Tourism</strong> Receipts, 2007-20111<br />
(Million US Dollars)<br />
Year<br />
<strong>Tourism</strong> Receipts 1_/<br />
Growth Rate (%) Exports, FOB<br />
Imports, CIF<br />
2007<br />
1,304. 42<br />
17.55<br />
107.75<br />
1,092.022<br />
2008<br />
1,437. 02<br />
10.17<br />
125.87<br />
1,382.11<br />
2009<br />
1,317. 19<br />
-8.34<br />
76.37<br />
962.53<br />
2010<br />
1,545. 25<br />
17.31<br />
73.91<br />
1,090.86<br />
2011<br />
1,868. 20<br />
20.90<br />
114.81<br />
1,328.555<br />
Source:<br />
Maldives Monetary Authority<br />
Maldives Customs Services<br />
Note: _/ Revised Estimates based on GST data from<br />
MIRA<br />
<strong>Tourism</strong> Expenditure refers to the expenditure made on tourism from the central government budget. The<br />
percentage share <strong>of</strong> tourism expenditure has always been lesss than 1.5% <strong>of</strong> the total government expenditure<br />
as seen from<br />
Table 13. With the exception <strong>of</strong> 2006 and 2007 during which the government spent over 100<br />
million rufiyaa, the following four years showed a significant decreasee with the government expenditure<br />
sloping by 36.7 million rufiyaa in 2009. Although there was a slight increase in tourism expenditure from<br />
2010 to 20111 the percentage share <strong>of</strong><br />
tourism expenditure remained the same at 0.5%. .<br />
Table 13: Government Expenditure on <strong>Tourism</strong>, 2007-2011<br />
(Million Rufiyaa)<br />
Year<br />
Government Expenditure<br />
<strong>Tourism</strong> Expenditur re<br />
% S hare <strong>of</strong> <strong>Tourism</strong><br />
Expenditure<br />
2007<br />
8,325.40<br />
_/<br />
108.20<br />
_/<br />
1.3<br />
2008<br />
10,342.40<br />
_/<br />
93.30<br />
_/<br />
0.9<br />
2009<br />
11,104.30<br />
_/<br />
56.60<br />
_/<br />
0.5<br />
2010<br />
10,996.40<br />
_/<br />
45.40<br />
0.4<br />
2011<br />
12,503.90<br />
58.44<br />
0.5<br />
Source:<br />
<strong>Ministry</strong> <strong>of</strong> Finance and Treasury<br />
Note:<br />
_/ Revised Figures<br />
222 | Page
[Type<br />
the document title]<br />
SECTION 4: AIRLINE STATISTICS<br />
Traffic by<br />
International Carriers<br />
In<br />
2011, over 1.1 million international visitor arrivals weree recorded for the Maldives (Table<br />
14). This<br />
include international passengers arrived at both Ibrahim Nasir International Airport as well as the Gan<br />
International<br />
Airport. Out <strong>of</strong> the 1.1 million passengers thatt arrived in the country, over 89% came from<br />
scheduled flight. While the scheduledd passengerss increased by 21% in 2011, the charter market recorded a<br />
considerable drop <strong>of</strong> 31%<br />
over 2010.<br />
Table 14: Passenger<br />
Arrivals by Type <strong>of</strong> International Carriers 2007-2011<br />
Type <strong>of</strong> Carrier<br />
2007<br />
2008<br />
2009<br />
2010<br />
2011<br />
Arrivals % S hare Arrivals % Share Arriva als % Share Arrivals % Share Arrivals<br />
% Share<br />
Scheduled<br />
669,219 80.3 694,718 80.8 696,925 83.8 837,027 83.0 1,013,652 89.6<br />
Charter<br />
164,217<br />
19.7<br />
164,587<br />
19.2 134,999 16.2<br />
171,716<br />
17.0 117,671 10.4<br />
Total<br />
833,436<br />
100.0<br />
859,305<br />
100.0 831,924 100.0<br />
1,008,743<br />
100.0 1,131,323 100.0<br />
Source:<br />
Department <strong>of</strong> Civil Aviation<br />
Traffic by Domestic Carriers<br />
Table 15 shows traffic by domestic carriers at Ibrahim Nasir<br />
International Airport. At the end <strong>of</strong> 2011, the<br />
domestic flight movements increased by 16% compared with 2010. With this increase in movements, the<br />
number <strong>of</strong> passengers carried with also increased<br />
by 13%. A new airline, Fly Me started operating in 2011,<br />
which carried<br />
a total <strong>of</strong> 12,446 passengers that year.<br />
As can be seen from the table, most passengers were carried by the Trans<br />
Maldivian Airways and<br />
Maldivian<br />
Air Taxi. Both these airlines mainly cater for the tourism sector <strong>of</strong> the Maldives and operate sea planes only.<br />
Table 15: Passenger Arrivals by Domestic Carriers at<br />
Airport, 2007-2011<br />
Ibrahim<br />
Nasir International<br />
Operator<br />
Domestic<br />
Island Aviation Services<br />
Fly Me<br />
Maldivian Air Taxi<br />
Mega Maldives<br />
9,139<br />
38,959<br />
-<br />
Trans Maldivian Airways (Scheduled)<br />
-<br />
Trans Maldivian Airways<br />
26,798<br />
Other Domestic *<br />
-<br />
2007<br />
No. <strong>of</strong><br />
2008<br />
No. <strong>of</strong><br />
2009<br />
No. <strong>of</strong><br />
Movements<br />
Passenger Movements<br />
Passenger<br />
Movements Passenger<br />
(Take <strong>of</strong>f /<br />
Landing)<br />
In (Take<br />
<strong>of</strong>f /<br />
Landing)<br />
In (Take <strong>of</strong>f /<br />
Landing)<br />
In<br />
93,244 9,311 90,557<br />
195,361 39,570 204,413<br />
- - -<br />
- 1,538 21,408<br />
109,825 25,856 101,624<br />
- - -<br />
2010<br />
No. <strong>of</strong><br />
Movements<br />
Passenger<br />
(Take <strong>of</strong>f / In<br />
Landing)<br />
8,621 114,069 7,955 127,813<br />
38,256 196,775 41,668 216,593<br />
-<br />
328<br />
24,802<br />
-<br />
-<br />
4,145<br />
93,614<br />
-<br />
2<br />
-<br />
34,392 2,214 52<br />
-<br />
157,617<br />
-<br />
2011<br />
No. <strong>of</strong><br />
Movements<br />
(Take <strong>of</strong>f /<br />
Landing)<br />
Passenger<br />
In<br />
10,369 154,785<br />
834 12,446<br />
43,558 188,797<br />
28<br />
-<br />
44,989<br />
485<br />
-<br />
208,567<br />
440 17<br />
Total<br />
74,896<br />
398,430 76,275 418,002<br />
72,007 408,603 86,231 502,075<br />
100,218 565,097<br />
Source:<br />
Department <strong>of</strong> Civil Aviation<br />
International Scheduled Carriers<br />
The scheduled flights carrying over 1 million passengers into the country in 2011, flight movements (in and<br />
out) <strong>of</strong> this sector recorded an increase <strong>of</strong> 50% compared with 2010. Newly started scheduled flights include<br />
China Southern Airlines,<br />
Etihad Airways, Jet Air<br />
Fly, Shanghai Airlines, Transearo Airlines, Mega Maldives<br />
and Meridiana Fly.<br />
23<br />
| Page
[Type<br />
the document title]<br />
Of these new scheduled flights, most number <strong>of</strong> passengers arrived from Transearo Airlines 30,268 passengers,<br />
Meridiana Fly, 29,965 passengers and China Southern Airlines 25,655 passengers. Transearo Airlines is a direct<br />
flight from Moscow Russia, the China<br />
Southern comes directly from Guangzhou, China and Meridiana is a<br />
direct flight from<br />
Malpensa, Italy.<br />
Table 16: Traffic by International Carriers – Scheduled, 2007-2011<br />
Operator<br />
2007<br />
No. <strong>of</strong><br />
Movements<br />
Passenger<br />
(Take <strong>of</strong>f / In<br />
Landing)<br />
Aer<strong>of</strong>lot<br />
-<br />
- 26<br />
Air Berlin<br />
-<br />
-<br />
-<br />
Air Sahara<br />
264 8,575 -<br />
Austrian Airlines<br />
110 7,827 42<br />
Bangkokk Airways<br />
224 9,142 256<br />
British Airways<br />
-<br />
-<br />
-<br />
China Eastern Airlines<br />
280 7,075 217<br />
China Southern Airlines<br />
-<br />
-<br />
-<br />
Condor<br />
258 28,512 252<br />
Czech Airlines<br />
-<br />
-<br />
-<br />
Emirates<br />
1,242 109,713<br />
1,234<br />
Etihad Airways<br />
-<br />
-<br />
-<br />
Eur<strong>of</strong>ly<br />
487 50,476 522<br />
Hainan Airlines<br />
-<br />
-<br />
-<br />
Indian Airlines<br />
1,258 68,425 1,326<br />
Jet Air Fly<br />
-<br />
-<br />
-<br />
Jazeera Airways<br />
38<br />
641 30<br />
L. T. U<br />
314 37,859 258<br />
Lauda Air - Italy / Livingston 190 23,219 138<br />
Malaysiaa Airlines<br />
333 15,297 422<br />
Maldivian<br />
-<br />
- 991<br />
Martin Air<br />
56<br />
1,229 -<br />
Mega Maldives<br />
-<br />
-<br />
-<br />
Meridiana Fly<br />
-<br />
-<br />
-<br />
Mihin Lanka<br />
208 10,229 116<br />
Oman Air<br />
-<br />
-<br />
-<br />
Qatar Airways<br />
736 65,891 732<br />
Shangai Airlines<br />
-<br />
-<br />
-<br />
Singapore Airlines<br />
730 90,472 735<br />
Srilankann Airlines<br />
1,893 132,406<br />
2,252<br />
Transaero Airlines<br />
-<br />
-<br />
-<br />
Viva Macau<br />
70<br />
2,231 -<br />
Srilankann Airlines (Cargo) 186 0<br />
4<br />
Expo Aviation (Cargo)<br />
537 0 440<br />
Schedule Total<br />
9,414 669,2199 9,993<br />
Source: Departmentt <strong>of</strong> Civil Aviation<br />
2008<br />
No. <strong>of</strong><br />
Movements<br />
(Take <strong>of</strong>f /<br />
Landing)<br />
Passenger<br />
In<br />
2009<br />
2010<br />
No. <strong>of</strong><br />
No. <strong>of</strong><br />
Move me nts Passenger<br />
Moveme nts<br />
(Take <strong>of</strong>f /<br />
Landing)<br />
In (Take <strong>of</strong>f /<br />
Landing)<br />
Passenger<br />
In<br />
2,492<br />
-<br />
-<br />
3,342<br />
8,872<br />
-<br />
7,690<br />
-<br />
27,949<br />
-<br />
128,053<br />
-<br />
52,787<br />
-<br />
63,836<br />
-<br />
498<br />
29,896<br />
13,209<br />
27,162<br />
25,028<br />
-<br />
-<br />
-<br />
4,603<br />
-<br />
62,263<br />
-<br />
83,569<br />
153,469<br />
-<br />
-<br />
0<br />
0<br />
694,718<br />
36<br />
144<br />
-<br />
44<br />
210<br />
58<br />
-<br />
-<br />
254<br />
-<br />
1,232<br />
-<br />
506<br />
-<br />
1,234<br />
-<br />
102<br />
-<br />
-<br />
441<br />
2,082<br />
-<br />
-<br />
-<br />
-<br />
76<br />
772<br />
-<br />
667<br />
2,623<br />
-<br />
-<br />
-<br />
374 10,855<br />
2,981 16, 019<br />
-<br />
3,794 8,569 3,325 -<br />
-<br />
30, 364<br />
-<br />
127,357 -<br />
45, 700<br />
-<br />
52, 203<br />
-<br />
12, 438<br />
-<br />
-<br />
35, 811<br />
48, 923<br />
-<br />
-<br />
-<br />
-<br />
1,845 59, 411<br />
-<br />
80, 375<br />
167,810 -<br />
-<br />
- 0<br />
696,925 38<br />
224<br />
-<br />
48<br />
224<br />
308<br />
134<br />
-<br />
260<br />
-<br />
1,948<br />
-<br />
84<br />
-<br />
1,274<br />
10<br />
-<br />
-<br />
-<br />
588<br />
2,665<br />
-<br />
-<br />
326<br />
26<br />
416<br />
1,096<br />
62<br />
731<br />
2,738<br />
-<br />
-<br />
-<br />
424<br />
13,624<br />
3,431<br />
25,948<br />
-<br />
5,146<br />
8,302<br />
26,336<br />
6,387<br />
-<br />
30,317<br />
-<br />
172,016<br />
-<br />
8,595<br />
-<br />
56,701<br />
281<br />
-<br />
-<br />
-<br />
46,021<br />
61,888<br />
-<br />
-<br />
28,387<br />
1,828<br />
8,785<br />
64,019<br />
5,938<br />
82,774<br />
193,927<br />
-<br />
-<br />
-<br />
0<br />
837,027<br />
2011<br />
No. <strong>of</strong><br />
Movements<br />
(Take <strong>of</strong>f /<br />
Landing)<br />
Passenger<br />
In<br />
214 19,414<br />
162 19,070<br />
-<br />
-<br />
74 7,086<br />
330 11,523<br />
314 28,451<br />
405 19,419<br />
180 25,655<br />
258 30,149<br />
-<br />
-<br />
2,208 194,831<br />
122 5,750<br />
-<br />
-<br />
30 2,967<br />
1,404 57,137<br />
72 1,408<br />
-<br />
-<br />
-<br />
-<br />
-<br />
-<br />
732 46,950<br />
1,574 31,017<br />
-<br />
-<br />
242 19,127<br />
344 29,965<br />
378 22,246<br />
490 17,049<br />
1,462 79,510<br />
44 3,009<br />
976 103,327<br />
3,642 208,324<br />
222 30,268<br />
-<br />
-<br />
-<br />
-<br />
400 -<br />
16,279 1,013,652<br />
24<br />
| Page
[Type<br />
the document title]<br />
International Charter Carriers<br />
From the charter market, while some major charters, such as Transaero Airlines and China Southern Airlines<br />
started operating scheduled flights, others, such as Monarch<br />
Airlines, Atlant Soyuz and Belair stopped its<br />
operation in 2011. New charters include Hongkongg Airways, Korean Air and Sichuan Airlines.<br />
Table 17: Traffic by International Carriers – Chartered, 2007-2011<br />
Operator<br />
Air Italy<br />
Alitalia<br />
Atlantt Soyuz<br />
Belair<br />
Blue Panorama Airlines<br />
Britannia Airways/Thomson Fly<br />
China Southern Airlines<br />
Condor<br />
Edelwe eiss<br />
First Choice<br />
Hongkong Airways<br />
Kingfisher Airlines<br />
Korean<br />
Air<br />
Kras Air<br />
Malev - Hungarian Airlines<br />
Mega Maldives<br />
Monarch Airlines<br />
My Travel Airways<br />
Neos Spa<br />
Sichuan<br />
Airlines<br />
St ar Airlines/XL Airways Swiss Air<br />
Transaero Airlines<br />
Travel<br />
Services<br />
Tuifly Nordic<br />
Ukraine International<br />
Vaso Airlines<br />
Volare<br />
Other Internationals<br />
Charter Total<br />
72<br />
-<br />
-<br />
52<br />
84<br />
18<br />
-<br />
- 156 210<br />
-<br />
-<br />
-<br />
40<br />
18<br />
- 226<br />
72<br />
78<br />
- 110<br />
- 140<br />
2<br />
-<br />
-<br />
7<br />
40<br />
1, ,906<br />
3, ,231<br />
7,723 -<br />
-<br />
4,430 9,317 2,001 -<br />
-<br />
18,194 25,172 -<br />
-<br />
-<br />
3,575 937<br />
-<br />
33,728 8,558 7,950 -<br />
16,651 -<br />
14,746 45<br />
-<br />
-<br />
3033 3,785 7,102 164,217 8<br />
-<br />
34<br />
78<br />
96<br />
76<br />
-<br />
24<br />
158<br />
180<br />
-<br />
-<br />
-<br />
131<br />
-<br />
-<br />
190<br />
-<br />
82<br />
-<br />
110<br />
-<br />
122<br />
8<br />
10<br />
-<br />
-<br />
60<br />
2,141<br />
3,508<br />
Grand<br />
Total<br />
(Schedule+Charter)<br />
Source:<br />
Department <strong>of</strong> Civil Aviation<br />
2007<br />
2008<br />
2009<br />
2010<br />
No. <strong>of</strong><br />
No. <strong>of</strong><br />
No. <strong>of</strong><br />
No. <strong>of</strong><br />
Movements<br />
Passenger<br />
Movements<br />
Passenger<br />
Movements Passenger<br />
Movements<br />
Passenger<br />
(Take <strong>of</strong>f /<br />
Landing)<br />
In (Take <strong>of</strong>f /<br />
Landing)<br />
In (Take <strong>of</strong>f /<br />
Landing)<br />
In (Take <strong>of</strong>f /<br />
Landing)<br />
In<br />
12,645 833,436 13,501<br />
925<br />
-<br />
2,927<br />
5,899<br />
9,339<br />
9,106<br />
-<br />
781<br />
18,956<br />
21,406<br />
-<br />
-<br />
-<br />
13,463<br />
-<br />
-<br />
30,243<br />
-<br />
9,099<br />
-<br />
16,000<br />
-<br />
15,406<br />
410<br />
1,394<br />
-<br />
-<br />
4,070<br />
5,163<br />
164,587<br />
859,305<br />
72 7,313 54<br />
5,187 24<br />
-<br />
49<br />
- 4,272<br />
-<br />
-<br />
-<br />
-<br />
4<br />
-<br />
64 4,882 -<br />
-<br />
-<br />
-<br />
238<br />
- 27,690<br />
-<br />
244 -<br />
28,549<br />
-<br />
242<br />
-<br />
-<br />
174<br />
-<br />
-<br />
19,467 206 -<br />
194 22,391<br />
-<br />
18,659<br />
-<br />
-<br />
182<br />
-<br />
-<br />
-<br />
-<br />
-<br />
-<br />
-<br />
109<br />
-<br />
-<br />
-<br />
-<br />
-<br />
-<br />
-<br />
17,058 -<br />
-<br />
-<br />
84<br />
-<br />
-<br />
-<br />
888 -<br />
-<br />
-<br />
8,602<br />
-<br />
-<br />
-<br />
13,411<br />
-<br />
72<br />
2<br />
42<br />
-<br />
-<br />
53<br />
-<br />
-<br />
160<br />
-<br />
18,508 -<br />
190 -<br />
21,477<br />
-<br />
208<br />
-<br />
101<br />
-<br />
12,628 -<br />
112 -<br />
15,608<br />
94<br />
92<br />
-<br />
124<br />
-<br />
16,520 -<br />
210 80<br />
27,299<br />
6<br />
-<br />
-<br />
-<br />
-<br />
-<br />
-<br />
1,836<br />
-<br />
-<br />
-<br />
-<br />
- 6,661<br />
-<br />
-<br />
8<br />
-<br />
-<br />
1,846 -<br />
-<br />
237<br />
-<br />
-<br />
10,216<br />
-<br />
-<br />
4<br />
-<br />
-<br />
2,367<br />
2,927 134,999 3,236 171,716<br />
3,392<br />
13,782 831,924 16,860 1,008,743 19,671<br />
2011<br />
No. <strong>of</strong><br />
Movements<br />
(Take <strong>of</strong>f /<br />
Landing)<br />
Passenger<br />
In<br />
2,441<br />
480<br />
-<br />
-<br />
-<br />
28,356<br />
-<br />
-<br />
19,398<br />
-<br />
7,965<br />
2<br />
5,323<br />
-<br />
-<br />
2,885<br />
-<br />
-<br />
23,676<br />
9,338<br />
13,701<br />
87<br />
-<br />
-<br />
-<br />
152<br />
-<br />
-<br />
3,867<br />
117,671<br />
1,131,323<br />
25<br />
| Page
[Type<br />
the document title]<br />
SECTION<br />
5: TOURISM<br />
FORECASTS<br />
Global Forecasts, <strong>2012</strong><br />
After a year <strong>of</strong> healthy<br />
growth in<br />
international arrivals, united Nations World<br />
<strong>Tourism</strong> Organization<br />
n<br />
(UNWTO) forecasts an increase <strong>of</strong> arrivals between +3% and +4% in <strong>2012</strong>, reaching<br />
the historic<br />
one billion<br />
mark by the end <strong>of</strong> the year.<br />
While Africa<br />
as well as Asia and the Pacific is expected to remain solid between +4%<br />
and +6%, for Americas<br />
and the Europe arrival growth is expected to be between +2%<br />
and +4%. For the Middle East region, UNWTO<br />
projects a growth between 0% and +5% (refer Table 18)<br />
Table 18: Global Forecasts, <strong>2012</strong><br />
Real<br />
year, change (in %)<br />
2008 2009<br />
2010<br />
Europe<br />
0.5 -4.9 2.9<br />
<strong>2012</strong>2<br />
2011 Projection between (in %)<br />
6.0<br />
+2 and +4<br />
Asia & the Pacific<br />
1.2 -1.6<br />
12.9<br />
5.6<br />
+4 and +6<br />
Americas<br />
2.7 -4.9<br />
6.5<br />
4.2<br />
+2 and +4<br />
Africa<br />
3.4 3.2<br />
6.7<br />
0.0<br />
+4 and +6<br />
Middle East<br />
20.1 -4.6<br />
15.1<br />
-7.9<br />
+0 and +5<br />
World<br />
Source:<br />
2.1 -3.8 6.5 4.4<br />
+3 and +4<br />
World<br />
<strong>Tourism</strong> Organization (UNWTO) Adapted from UNWTO World <strong>Tourism</strong> Barometer, January <strong>2012</strong> edition<br />
Maldives <strong>Tourism</strong> Forecasts<br />
Tourist arrival to the Maldives is expected to grow<br />
by 4.7% reaching 974,829 by end<br />
<strong>2012</strong>. This is below the<br />
initial expected growth rate and the one million target for the year, mainly<br />
due to the four consecutive months<br />
<strong>of</strong> negative growth recorded for <strong>2012</strong>. While average stay is expected to decline, the<br />
average occupancy rate<br />
for the year is<br />
anticipated to have a slight increasee <strong>of</strong> 0.3%.<br />
From 2013 to<br />
2015 the tourist arrival forecasts are based on the Global Elasticity model developed to forecast<br />
tourist arrivals to the Maldives with technical assistance from<br />
the World<br />
Bank, which takes into account the<br />
long term observed elasticity <strong>of</strong> Maldives tourism to global tourism. With the rapid<br />
growth in the Chinesee<br />
market, average duration <strong>of</strong> stay is expected to decline even further. However, the occupancy rate<br />
is expected<br />
to<br />
be maintained above 80%. With new islands leased for resort/hotel development, bed capacity is<br />
expected to<br />
increase to 27,240 by end<br />
2015.<br />
Table 19: Maldives <strong>Tourism</strong> Forecasts, <strong>2012</strong> - 2015<br />
Tourist Arrivals (000's)<br />
% Growth<br />
2011<br />
931<br />
17.6<br />
Real<br />
<strong>2012</strong> (end Sep) <strong>2012</strong><br />
692<br />
975<br />
3.4<br />
4.7<br />
Projections<br />
2013 2014<br />
1,057 1,144<br />
8.5 8.1<br />
2015<br />
1,237<br />
8.2<br />
Average Stay ( days)<br />
7.0<br />
6.8<br />
6.6<br />
6.8<br />
6.5<br />
6.2<br />
Tourist Bed nights (000's)<br />
6,359<br />
4,728<br />
6,464<br />
7,167<br />
7,470<br />
7,707<br />
Bed night capacity (000's)<br />
8,214<br />
7,107<br />
8,867<br />
9,093<br />
9,716<br />
9,942<br />
Occupancy rate<br />
(%)<br />
77.5<br />
69.7<br />
77.8<br />
84.2<br />
81.9<br />
82.4<br />
No. <strong>of</strong> Resorts / Hotels<br />
112<br />
124<br />
124<br />
134<br />
141<br />
141<br />
Bed Capacity ( end year total , resorts/hotels)<br />
23,306<br />
24,380<br />
24,5122 24,995<br />
26,700<br />
27,322<br />
Source:<br />
<strong>Ministry</strong> <strong>of</strong> <strong>Tourism</strong>, <strong>Arts</strong> and <strong>Culture</strong><br />
26<br />
| Page
[Type<br />
the document title]<br />
Table 20: Resort / Hotel Projects Underway<br />
Island<br />
Facility Type / Batch<br />
Lease Holder<br />
Leased Date<br />
Beds<br />
Estimated<br />
Opening<br />
Date<br />
Mathi Uthuru (Upper North Province)<br />
2,550<br />
Haaa Alif Atoll<br />
400<br />
1<br />
Kelaa<br />
Laggoon Resorts / Lagoon<br />
Developments<br />
Hamidh Ismail, H. Hirifushi, Male'<br />
7-Oct-08 200<br />
NA<br />
2<br />
Naridhoo<br />
Phase 2 - Open Rent - 2006<br />
Mr. Ali Zahir, H. Iruvelige<br />
15-Nov-06 100<br />
NA<br />
3<br />
Uligamu<br />
MTDC Islands - City Hotel<br />
Maldives T ourism<br />
Development<br />
Corporation PLC<br />
27-Feb-07 100<br />
NA<br />
Haaa Dhaal Atoll<br />
1,550<br />
4<br />
5<br />
6<br />
7<br />
8<br />
Dhipparufushi<br />
Hanimaadhoo<br />
Hondaafushi<br />
Kudamuraidhoo o<br />
Naagoashi<br />
New Resorts with Transport<br />
Network projects<br />
Regional Airport Hotels<br />
11 Islands - 2004<br />
Phase 1 - Open Controlled -<br />
2006<br />
MTDC Islands<br />
Trinus-CAE Holdings Pvt Ltd<br />
Ms. Fathimath T hasleema, M.<br />
Maafannu Villa<br />
Mr. Abdulla Ali, H. Girithereyge<br />
Hithafinivaa Magu<br />
JH<br />
Resorts Pvt Ltd<br />
Maldives T ourism<br />
Development<br />
Corporation PLC<br />
5-May-10 100<br />
18-Jun-07 200<br />
5-Aug-05 200<br />
25-Jun-06 250<br />
17-Sep-06 600<br />
NA<br />
NA<br />
NA<br />
Na<br />
December-13<br />
9<br />
Nolhivaranfaru<br />
Training Resorts<br />
Nalaveli Maldives Pvt.Ltd,<br />
3-Dec-08 200<br />
NA<br />
Shaviyani Atoll<br />
600<br />
10<br />
11<br />
12<br />
Dholhiyadhoo<br />
Gaakoshibi<br />
Kabaalifaru<br />
11 Islands - 2004<br />
Phase 2 - Open Controlled -<br />
2006<br />
Phase 2 - Open Controlled -<br />
2006<br />
5-Aug-05 200<br />
24-Aug-06 200<br />
31-Aug-06 200<br />
Mr. Mohamed Latheef, H.<br />
Baraboamaage<br />
Mr. Hussain Waheed,<br />
Huvandhumaage, Sh. Foakaidhooo<br />
Mr. Ali Shareef, M. Anaa Villa<br />
June-13<br />
NA<br />
NA<br />
Uthuru Province (North Province)<br />
3,270<br />
Noon Atoll<br />
980<br />
13<br />
Dhigurah<br />
Other Resort Projects<br />
Wego Private Limited<br />
19-Jan-12 NA<br />
NA<br />
14<br />
Ekulhivaru<br />
MTDC Islands<br />
Maldives T ourism<br />
Development<br />
Corporation PLC<br />
17-Sep-06 180<br />
NA<br />
15<br />
Fushivelavaru<br />
Housing Fund Projects<br />
Gladonia Maldives Pvt Ltd<br />
5-Aug-10 100<br />
June-13<br />
16<br />
17<br />
Huvadhumaava attaru<br />
Maafaru<br />
Tourist Establishments with<br />
Airports<br />
Tourist Establishments with<br />
Airports - Transit<br />
Hotel<br />
Noonu Hotels & Resorts<br />
Development Pvt. Ltd.<br />
Noonu Hotels & Resorts<br />
Development Pvt. Ltd.<br />
8-Jan-08 200<br />
8-Jan-08 200<br />
NA<br />
NA<br />
18<br />
Maavelaavaru<br />
11 Islands - 2004<br />
Athama Investments Pvt.Ltd<br />
5-Aug-05 100<br />
December-13<br />
19<br />
Raafushi<br />
Housing Fund Projects<br />
Exotic properties<br />
Pvt.Ltd<br />
13-Dec-210 100<br />
NA<br />
20<br />
Randheli<br />
11 Islands - 2004<br />
I & T Management Pvt. Ltd.<br />
22-Aug-06 100<br />
June-13<br />
27<br />
| Page
[Type<br />
the document title]<br />
Table 20: (continued…)<br />
Island<br />
Facility Type / Batch<br />
Lease Holder<br />
Leased Date<br />
Beds<br />
Estimated<br />
Opening<br />
Date<br />
Raa Atoll<br />
890<br />
21<br />
Eiythigili<br />
Population Consolidation<br />
Amin Construction Pvt. Ltd.<br />
2-Jan-08 200<br />
NA<br />
22<br />
23<br />
24<br />
Furaveri<br />
Ifuru<br />
Kudakurathu<br />
Population Consolidation<br />
Tourist Establishments w/<br />
Airports<br />
New<br />
Resorts with Transport<br />
Network projects<br />
Mr. Ahmed Ibrahim Didi, 7-A, Ma<br />
Niyaz Villa, Buruzu Magu<br />
Ifuru Investment Pvt Ltd<br />
Dheebaja Investment Pvt Ltd<br />
6-Feb-12 200<br />
25-May-11 NA<br />
5-May-10 100<br />
NA<br />
NA<br />
December-14<br />
25<br />
Lundhufushi<br />
Phase 1 - Open Rent - 2006<br />
Silver Tides Pvt Ltd<br />
9-Jul-06 40<br />
NA<br />
26<br />
Maamigil<br />
Other Resort Projects<br />
Ahmed Waheed<br />
G. Vaffushi, Male'<br />
2-Feb-11 200<br />
December-13<br />
27<br />
Maamunagau<br />
Other Resort Projects<br />
Cocoon Investment Pvt. Ltd<br />
14-Jul-11 NA<br />
NA<br />
28<br />
29<br />
30<br />
Maanenfushi<br />
Madivaafaru<br />
Muravandhoo<br />
Phase 2 - Open Rent - 2006<br />
Tourist Establishments with<br />
Airports<br />
Tourist Establishments with<br />
Airports<br />
Ms. Nasra Abdul Sattar, M. Maavina,<br />
Male'<br />
Ifuru Investment Pvt Ltd<br />
Ifuru Investment Pvt Ltd<br />
3-Sep-06 150<br />
25-May-11 NA<br />
25-May-11 NA<br />
NA<br />
NA<br />
NA<br />
Baa Atoll<br />
700<br />
31<br />
32<br />
33<br />
Dharavandhoo / Finolhas<br />
Kanufushi<br />
Muthaafushi<br />
Tourist Establishments with<br />
Airports<br />
Tourist Establishments with<br />
Airports<br />
Tourist Establishments with<br />
Airports<br />
Coastline Hotels & Resorts Pvt. Ltd.<br />
Coastline Hotels & Resorts Pvt. Ltd.<br />
STO Hotels and Resorts Pvt Ltd<br />
10-Dec-07 200<br />
6-Jan-08 200<br />
6-Jan-08 100<br />
December-14<br />
NA<br />
NA<br />
34<br />
Vakkaru<br />
Population Consolidation<br />
Efzy Holdings Pvt. Ltd.<br />
25-Feb-08 200<br />
December-13<br />
Lhaviyani Atoll<br />
700<br />
35<br />
36<br />
Hudhufushi<br />
Kanifushi<br />
Other Resort Projects - 13<br />
islands leased in 2000<br />
Phase 2 - Open Controlled -<br />
2006<br />
Mr. Abdul Rauf, M. Snowrose, Male'<br />
Mr. Mohamed Nasheedh, H.<br />
Fodhdhooge<br />
9-Oct-00 400<br />
14-Sep-06 300<br />
July-14<br />
July-13<br />
Medhu Uthuru Province (North Central Province)<br />
700<br />
Male' (Capital)<br />
200<br />
37<br />
Male' Hotel / Dharubaaruge Other Islands + City Hotels<br />
Male' Investmentss Pvt. Ltd.<br />
28-Oct-07 200<br />
NA<br />
Kaaf<br />
Atoll<br />
400<br />
38<br />
Kaashidhuffaru<br />
Falhu<br />
/ Dhiffushi Laggoon Resorts / Lagoon<br />
Developments<br />
Hamidh Ismail,<br />
H. Hirifushi, Male'<br />
22-Jun-08 200<br />
NA<br />
39<br />
Kuda Villigili<br />
Other Resort Projects<br />
Kudaviligili Development Pvt Ltd<br />
8-Jun-10 200<br />
NA<br />
40<br />
41<br />
Lagoon 17<br />
Lagoon 19<br />
Laggoon Resorts / Lagoon<br />
Developments<br />
Laggoon Resorts / Lagoon<br />
Developments<br />
Dutch Docklands Maldives Pvt Ltd<br />
Dutch Docklands Maldives Pvt Ltd<br />
27-Jan-11 NA<br />
27-Jan-11 NA<br />
August-14<br />
NA<br />
28<br />
| Page
[Type<br />
the document title]<br />
Table 20: (continued…)<br />
Island<br />
Facility Type / Batch<br />
Lease Holder<br />
Leased Date<br />
Beds<br />
Estimated<br />
Opening<br />
Date<br />
42<br />
43<br />
44<br />
Lagoon 37<br />
Lagoon 7<br />
Lagoon 9<br />
Laggoon Resorts / Lagoon<br />
Developments<br />
Laggoon Resorts / Lagoon<br />
Developments<br />
Laggoon Resorts / Lagoon<br />
Developments<br />
Dutch Docklands Maldives Pvt Ltd<br />
Dutch Docklands Maldives Pvt Ltd<br />
Dutch Docklands Maldives Pvt Ltd<br />
27-Jan-11 NA<br />
27-Jan-11 NA<br />
27-Jan-11 NA<br />
NA<br />
NA<br />
NA<br />
Alif<br />
Alif Atoll<br />
0<br />
Alif<br />
Dhaal Atoll<br />
0<br />
Vaav Atoll<br />
100<br />
45<br />
Fottheyo<br />
New Resorts with Transport<br />
Network projects<br />
Maldives T ransport & Contracting<br />
Company Plc.<br />
5-May-10 100<br />
NA<br />
Medhu Province ( Central Province)<br />
260<br />
Meem Atoll<br />
60<br />
46<br />
Dhekunuboduveli /<br />
Kudausffushi / Gasveli<br />
Phase 2 - Open Rent - 2006<br />
Mr. Mohamed Manik, M. Villa<br />
Dhashuge<br />
3-Sep-06 60<br />
December-14<br />
Faaf<br />
Atoll<br />
0<br />
Dhaal Atoll<br />
200<br />
47<br />
48<br />
Dhoores<br />
Vohmuli<br />
New Resorts with Transport<br />
Network projects<br />
New Resorts with Transport<br />
Network projects<br />
Vermillion International Pvt Ltd<br />
Vermillion International Pvt Ltd<br />
26-May-11 100<br />
19-May-10 100<br />
NA<br />
December-14<br />
Medhu Dhekunu Province (South Central Province )<br />
1,280<br />
Th aa Atoll<br />
580<br />
49<br />
Elaa<br />
Phase 2 - Open Controlled -<br />
2006<br />
Villa Shipping & Trading Company<br />
Pte. Ltd<br />
19-Sep-06 280<br />
NA<br />
50<br />
Kalhufahalafushi 11 Islands - 2004<br />
Asia Resorts Pvt.Ltd<br />
5-Aug-05 200<br />
NA<br />
51<br />
Male'fushi<br />
Phase 1 - Open Controlled - I. V. P. l. Investnment Company Pvt<br />
2006<br />
Ltd<br />
2-Jul-06 100<br />
July-13<br />
Laam Atoll<br />
700<br />
52<br />
Bodufinolhu /<br />
Gasgandufinolhu<br />
Training Resorts<br />
Premier Equity Pvt. Ltd.<br />
28-Sep-08 150<br />
NA<br />
53<br />
Gan<br />
Hotel & Training facility<br />
Premier Equity Pvt. Ltd.<br />
28-Sep-08 150<br />
NA<br />
54<br />
55<br />
56<br />
Gan Medical Resort<br />
Kadhdhoo<br />
Vadinolhu<br />
Other Resort Projects<br />
Regional Airport Hotels<br />
New Resorts with Transport<br />
Network projects<br />
Island Development Company Pvt.<br />
Ltd<br />
Mr. Ali Ibrahim, Finivaage, Adh.<br />
Fenfushi<br />
Maldives Dhoni Services<br />
27-Jul-11 NA<br />
14-Jun-07 200<br />
31-Mar-10 200<br />
NA<br />
NA<br />
NA<br />
29<br />
| Page
[Type<br />
the document title]<br />
Table 20: (continued…)<br />
Island<br />
Facility Type / Batch<br />
Lease Holder<br />
Leased<br />
Date<br />
Beds<br />
Estimated<br />
Opening<br />
Date<br />
Mathi Dhekunu Province (Upper South Province)<br />
1,302<br />
Gaaf Alif Atoll<br />
648<br />
Tourist Establishments with<br />
57<br />
Dhigurah<br />
Airports<br />
58<br />
Kondeymathee Laabadhoo MTDC Islands<br />
New Resorts with<br />
Transport<br />
59<br />
Maanagala (Matu)<br />
Network projects<br />
Tourist Establishments with<br />
60<br />
Maarehaa<br />
Airports<br />
Bonavista (Maldives) Pvt.Ltd<br />
Maldives <strong>Tourism</strong> Development<br />
Corporation PLC<br />
Trinus-CAE Holdings Pvt Ltd<br />
Moving International (Pvt). Ltd<br />
10-Jul-10<br />
NA<br />
17-Sep-06 100<br />
5-May-10 100<br />
10-Jul-11<br />
NA<br />
July-14<br />
NA<br />
NA<br />
NA<br />
61<br />
Mahadhdhoo<br />
Phase 2 - Open Rent - 2006<br />
Mahadhdhoo Investment Pvt. Ltd.<br />
17-Aug-06 100<br />
NA<br />
62<br />
Munandhuvaaa<br />
Phase 1 - Open Rent - 2006<br />
Clear Sand Pvt Ltd<br />
18-Jun-06 48<br />
NA<br />
63<br />
Vodamulaa<br />
MTDC Islands<br />
Maldives <strong>Tourism</strong> Development<br />
Corporation PLC<br />
27-Mar-07 300<br />
NA<br />
Gaaf Dhaal Atoll<br />
654<br />
64<br />
Gazeera<br />
Phase 1 - Open Rent - 2006<br />
Gazeera Pvt. Ltd.<br />
22-Jun-06 44<br />
NA<br />
65<br />
Kaadedhdhoo<br />
Regional Airport<br />
Hotels<br />
Dream Ocean Holidays Pvt. Ltd. 1-Jul-07 200<br />
NA<br />
666 Kaishidhoo<br />
Phase 2 - Open Rent - 2006<br />
Kaishidhoo Resorts Pvt. Ltd.<br />
3-Sep-06 60<br />
NA<br />
67<br />
Konotta<br />
11 Islands - 2004<br />
Crystal Lagoon Resorts Pvt.Ltd<br />
5-Aug-05 100<br />
December-13<br />
68<br />
Lonudhuahutta 11 Islands - 2004<br />
69<br />
Maavaarulu<br />
Tourist Establishments with<br />
Airports<br />
70<br />
Vat avarreha<br />
Phase 1 - Open Controlled -<br />
2006<br />
One and Half Degree Maldives Pvt.<br />
Ltd<br />
Moving International (Pvt). Ltd<br />
Yacht Tours Maldives Pvt Ltd<br />
5-Aug-05 100<br />
10-Jul-11<br />
NA<br />
26-Jun-06 150<br />
NA<br />
NA<br />
NA<br />
Dekunu Province (South Province)<br />
320<br />
Gnaviyani Atoll<br />
120<br />
71<br />
Fuvahmulak<br />
Other Islands + City Hotels<br />
One and Half Degree Maldives Pvt<br />
Ltd<br />
2-Jun-06 120<br />
NA<br />
Seenu Atoll<br />
200<br />
72<br />
Hankede<br />
Other Islands + City Hotels<br />
Dollarton Private Limited<br />
9-Apr-06 200<br />
NA<br />
Total<br />
Source:<br />
<strong>Ministry</strong> <strong>of</strong> <strong>Tourism</strong>, <strong>Arts</strong> and <strong>Culture</strong><br />
9,682<br />
Revised on October <strong>2012</strong><br />
30<br />
| Page
[Type<br />
the document title]<br />
SECTION<br />
6: OTHER<br />
TABLES<br />
Table 21: Bed Capacity <strong>of</strong> Resorts and Distance from Airport, 2007-2011<br />
Name <strong>of</strong> the Resort<br />
Atoll & Island<br />
Name<br />
Airpo rt<br />
Distance<br />
(Km)<br />
Ye ar o f<br />
Initial<br />
Operation<br />
Initial<br />
Bed<br />
Capacity<br />
2007 2008<br />
2009 2010<br />
2011<br />
1 Adaaran Prestige Vaadhu<br />
K. Vaadhu<br />
8.0 1978<br />
18<br />
66 66<br />
100 100<br />
100<br />
2 Adhaaran Club Rannaalhi<br />
K. Rannalhi 34.0 1978<br />
34<br />
232 256<br />
256 256<br />
256<br />
3 Adhaaran Select<br />
Hudhuranfushi<br />
K. Lhohifushi 22.5 1979<br />
40<br />
354 354<br />
354 354<br />
354<br />
4 Adhaaran Select<br />
Meedhupparu<br />
R. Meedhupparu 130.3 2000<br />
430<br />
470 470<br />
470 470<br />
470<br />
5 Alimatha Aquat ic Resort<br />
V. Alimat ha 48.0 1975<br />
20<br />
260 260<br />
260 260<br />
260<br />
6 Amari Addu Maldives<br />
S. Heret here 480.0 2007<br />
106<br />
546 546<br />
546 546<br />
546<br />
7 Anantara Kihavah Villas<br />
B. Kihavahh Haruvalhi 125.0 2010<br />
110<br />
- -<br />
- 110<br />
110<br />
8 Anantara Resort<br />
& Spa Maldives<br />
K. Dhigufinolhu 40.0 1980<br />
24<br />
220 220<br />
220 220<br />
220<br />
9 Angaaga Island Resort and Spa<br />
A.Dh. Angaga 85.0 1989<br />
100<br />
140 140<br />
140 140<br />
140<br />
10 Angsana Resort & Spa Maldives, Ihuru<br />
K. Ihuru<br />
17.0 1978<br />
20<br />
90 90<br />
90 90<br />
90<br />
11 Angsana Resort and Spa Maldives - Velavaru<br />
Dh. Velavaru 125.0 1998<br />
50<br />
168 168<br />
236 236<br />
236<br />
12 Asdhu Sun Island<br />
K. Asdhu<br />
32.0 1981<br />
36<br />
60 60<br />
60 60<br />
60<br />
13 Athurugau Island<br />
Resort<br />
A.Dh. Athurugau 90.0 1990<br />
79<br />
98 98<br />
98 146<br />
146<br />
14 Ayada Maldives<br />
G.Dh. Magudhdhuva 420.0 2011<br />
200<br />
- -<br />
- -<br />
200<br />
15 Bandos Island Resort and Spa<br />
K. Bandos<br />
8.0 1972<br />
220<br />
450 450<br />
450 450<br />
450<br />
16 Banyan Tree Maldives Vabbinfaru<br />
K. Vabbinfa aru 12.0 1977<br />
24<br />
96 96<br />
96 96<br />
96<br />
17 Baros Holiday Resort<br />
K. Baros<br />
16.0 1973<br />
56<br />
150 150<br />
150 150<br />
150<br />
18 Bathala Island Resort<br />
A.A. Bathala 48.3 1983<br />
20<br />
90 90<br />
90 90<br />
90<br />
19 Biyaadhu Island Resort<br />
K. Biyaadh oo 18.0 1982<br />
192<br />
192 192<br />
192 192<br />
192<br />
20 Centara Grand Island Resort & Spa Maldives<br />
A.Dh. Machchafushi 95.0 1992<br />
96<br />
128 128<br />
224 224<br />
224<br />
21 Chaaya Island Dhonveli<br />
K. Kanuoiy<br />
Huraa 13.0 1981<br />
20<br />
292 292<br />
296 296<br />
296<br />
22 Chaaya Lagoon Hakuraa Huraa<br />
M. Hakuraaa Huraa 128.7 1999<br />
72<br />
160 160<br />
160 160<br />
160<br />
23 Cinnamon Island Alidhoo<br />
H.A. Alidhoo 300.0 2007<br />
66<br />
200 200<br />
200 200<br />
200<br />
24 Club Faru, Farukolhufushi<br />
K. Farukolhufushi 2.0 1973<br />
112<br />
304 304<br />
304 304<br />
304<br />
25 Coco Palm Boduhithi<br />
K. Boduhith<br />
29.0 1979<br />
50<br />
206 206<br />
206 206<br />
206<br />
26 Coco Palm Dhunikolhu<br />
B. Dhunikolhu 124.0 1998<br />
192<br />
200 200<br />
200 200<br />
200<br />
27 Coco Palm Kudahithi<br />
K. Kudahith<br />
27.4 1984<br />
12<br />
14 14<br />
14 14<br />
14<br />
28 Cocoa Island<br />
K. Makunufushi 30.0 1981<br />
12<br />
70 70<br />
70 70<br />
70<br />
29 Conrad Maldives Rangali Island<br />
A.Dh. Rangalifinolhu 96.6 1992<br />
80<br />
304 304<br />
304 304<br />
304<br />
30 Constance Halaveli Resort<br />
A.A. Halaveli 36.0 1982<br />
30<br />
112 112<br />
172 172<br />
172<br />
31 Constance Mo<strong>of</strong>ushi Resort<br />
A.Dh. Mo<strong>of</strong>ushi 80.0 1990<br />
84<br />
124 124<br />
124 124<br />
220<br />
32 Dhiggiri Tourist<br />
Resort<br />
V. Dhiggiri<br />
32.0 1982<br />
50<br />
90 90<br />
90 90<br />
90<br />
33 Dream Island Maldives<br />
K. Villivaru<br />
29.0 1981<br />
120<br />
120 120<br />
120 120<br />
120<br />
34 Ellaidhu T ourist<br />
Resort<br />
A.A. Ellaidhoo 54.0 1985<br />
32<br />
176 224<br />
224 224<br />
224<br />
31<br />
| Page
[Type<br />
the document title]<br />
Table 21: (continued…)<br />
Name <strong>of</strong> the Resort<br />
Atoll & Island<br />
Name<br />
Airpo rt<br />
Distance<br />
(Km)<br />
Ye ar o f<br />
Initial<br />
Operation<br />
Initial<br />
Bed<br />
Capacity<br />
2007 2008<br />
2009 2010<br />
2011<br />
35 Emboodhu Village<br />
K. Emboodhu 8.0 1979<br />
44<br />
236 236<br />
236 236<br />
236<br />
36 Eriyadhu Island Resort<br />
K. Eriyadhu<br />
40.0 1982<br />
40<br />
114 114<br />
114 114<br />
114<br />
37 Fihalhohi Island<br />
Resort<br />
K. Fihaalhohi 28.0 1981<br />
90<br />
300 300<br />
300 300<br />
300<br />
38 Filitheyo Island Resort<br />
F. Filitheyo<br />
120.7 1999<br />
250<br />
250 250<br />
250 250<br />
250<br />
39 Four Seasons Resort Maldives at<br />
Kuda Huraa<br />
K. Kuda Huraa 12.9 1977<br />
32<br />
212 212<br />
212 212<br />
212<br />
40 Four Seasons Resort Maldives at<br />
Landaa Giraavaru B. Landaa Giraavaru 120.0 2006<br />
206<br />
206 206<br />
206 206<br />
206<br />
41 Fun Island Resort<br />
K. Bodufino olhu 38.0 1980<br />
44<br />
200 200<br />
200 200<br />
200<br />
42 Gangehi Island Resort<br />
A.A. Gange ehi 77.2 1987<br />
50<br />
50 72<br />
72 72<br />
72<br />
43 Gasfinolhu Island Resort<br />
K. Gasfinol lhu 23.0 1980<br />
18<br />
80 80<br />
80 80<br />
80<br />
44 Giraavaru Tourist Resort<br />
K. Giraavaru 11.3 1980<br />
40<br />
132 132<br />
132 132<br />
132<br />
45 Helengeli Island<br />
Resort<br />
K. Helengeli 46.7 1979<br />
20<br />
100 100<br />
100 100<br />
100<br />
46 Hilton Maldives<br />
- Irufushi Resort & Spa<br />
N. Medhafushi 238.0 2008<br />
200<br />
- 300<br />
390 442<br />
442<br />
47 Holiday Inn Resort Kandooma Maldives<br />
K. Kandoomafushi 27.4 1985<br />
98<br />
204 322<br />
322 322<br />
322<br />
48 Holiday Island<br />
A.Dh. Dhiffushi 93.0 1994<br />
284<br />
284 284<br />
284 284<br />
284<br />
49 Huvafenfushi<br />
K. Nakatchafushi 25.7 1979<br />
80<br />
102 102<br />
102 102<br />
102<br />
50 Huvandhumaafushi<br />
G.A Funamauddua 400.0 2009<br />
100<br />
- -<br />
100 150<br />
150<br />
51 Island Hideaway<br />
at Dhonakulhi Maldives, Spa Reso H.A. Dhonakulhi 250.0 2005<br />
50<br />
90 90<br />
90 90<br />
90<br />
52 Jumeirah Dhevanafushi<br />
G.A Meradhoo 400.0 2011<br />
38<br />
- -<br />
- -<br />
74<br />
53 Jumeirah Vittaveli Island Resort<br />
at Bolifushi<br />
K. Bolifushi 12.0 1982<br />
64<br />
110 110<br />
110 110<br />
174<br />
54 Kanifinolhu Tourist Resort<br />
K. Kanifinolhu 19.3 1978<br />
18<br />
444 444<br />
444 448<br />
448<br />
55 Kihaadhufaru Tourist Resort<br />
B. Kihaadhuffaru 104.6 1999<br />
200<br />
200 200<br />
200 200<br />
200<br />
56 Komandoo Maldive Island Resort<br />
Lh. Komandoo 128.7 1998<br />
90<br />
120 120<br />
120 120<br />
120<br />
57 Kudarah Island Resort<br />
A.Dh. Kudarah 88.5 1991<br />
50<br />
60 60<br />
60 60<br />
60<br />
58 Kuramathi Tourist Resort<br />
A.A. Kuramathi 56.3 1977<br />
48<br />
580 580<br />
580 580<br />
580<br />
59 Kuredhdhu Island Resort<br />
Lh. Kuredhdhu 128.7 1978<br />
18<br />
740 746<br />
768 768<br />
768<br />
60 Kurumba Maldives<br />
K. Vihamanaafushi 3.2 1972<br />
60<br />
362 362<br />
362 362<br />
362<br />
61 Lily Beach Resort<br />
A.Dh. Huvahendhoo 85.0 1994<br />
168<br />
170 170<br />
250 250<br />
250<br />
62 Lux* Maldives (Diva Maldives)<br />
A.Dh. Dhidhdhufinolh 104.0 1988<br />
180<br />
282 394<br />
394 394<br />
394<br />
63 Maayafushi Tourist Resort<br />
A.A. Maayafushi 63.0 1983<br />
48<br />
150 150<br />
150 150<br />
150<br />
64 Madoogali Resort<br />
A.A. Madoogali 77.2 1989<br />
70<br />
112 112<br />
112 112<br />
112<br />
65 Makunudhoo Island<br />
K. Makunudhu 38.6 1983<br />
58<br />
74 74<br />
74 74<br />
74<br />
66 Medhufushi Island Resort<br />
M. Medhufushi 128.7 2000<br />
240<br />
240 240<br />
240 240<br />
240<br />
67 Meeru Island Resort<br />
K. Meerufenfushi 37.0 1978<br />
128<br />
570 570<br />
570 570<br />
570<br />
68 Mirihi Island Resort<br />
A.Dh. Mirihi 112.6 1989<br />
36<br />
72 72<br />
72 72<br />
72<br />
69 Nika Island Resort<br />
A.A. Kudafolhudhu 69.2 1983<br />
30<br />
76 76<br />
76 76<br />
76<br />
32<br />
| Page
[Type<br />
the document title]<br />
Table 21: (continued…)<br />
Name <strong>of</strong> the Resort<br />
Atoll & Island<br />
Name<br />
Airport<br />
Distance<br />
(Km<br />
)<br />
Ye ar o f<br />
Initial<br />
Operatio n<br />
Initial<br />
Bed<br />
Capacity<br />
2007 2008<br />
2009 2010<br />
2011<br />
70 Olhuveli Beach & Spa Resort<br />
K. Olhuveli<br />
51.5 1979<br />
36<br />
268 268<br />
268 332<br />
332<br />
71 One & Only Kanuhura, Maldives<br />
Lh. Kanuhuraa 125.5 1999<br />
200<br />
200 200<br />
200 200<br />
200<br />
72 One & Only Reethi Rah, Maldives<br />
K. Medhufinolhu 64.4 1979<br />
24<br />
264 264<br />
268 268<br />
268<br />
73 Palm Beach Island<br />
Lh. Madhiriguraidhoo 128.7 1999<br />
200<br />
216 228<br />
248 248<br />
248<br />
74 Palm Tree Island<br />
K. Veligandu<br />
Huraa 27.0 1986<br />
32<br />
138 138<br />
138 138<br />
138<br />
75 Paradise Island Resort & Spa<br />
K. Lankanfinolhu 9.6<br />
1979<br />
24<br />
520 568<br />
568 568<br />
568<br />
76 Park Hyatt Maldives, Hadaha<br />
G.A Hadahaaa 405.0 2009<br />
100<br />
- -<br />
100 100<br />
100<br />
77 Ranveli Village<br />
A.Dh. Villin gilivaru 77.0 1991<br />
112<br />
112 112<br />
112 112<br />
112<br />
78 Reethi Beach Resort<br />
B. Fonimagoodhoo 104.6 1998<br />
200<br />
200 200<br />
200 248<br />
248<br />
79 Rihiveli Beach Resort<br />
K. Mahaanaelhi Huraa 40.2 1980<br />
40<br />
100 100<br />
100 100<br />
100<br />
80 Royal Island<br />
B. Horubadh hoo 110.0 2001<br />
304<br />
304 304<br />
304 304<br />
304<br />
81 Shangri - La Villingili Resort & Spa<br />
S. Villingili<br />
478.0 2009<br />
284<br />
- -<br />
284 284<br />
284<br />
82 Sheraton Maldives Full Moon Reosort & Spa<br />
K. Furanafushi 5.6<br />
1973<br />
112<br />
312 312<br />
312 312<br />
312<br />
83 Six Senses Laamu<br />
L. Olhuveli<br />
260.0 2011<br />
66<br />
- -<br />
- -<br />
194<br />
84 Soneva Fushi By Six Senses<br />
B. Kunfunadhoo 104.6 1983<br />
50<br />
130 130<br />
130 130<br />
130<br />
85 Soneva Gili By Six Senses<br />
K. Lankanfushi 9.7<br />
1980<br />
12<br />
94 94<br />
94 94<br />
94<br />
86 Summer Island Village<br />
K. Ziyaaraifushi 35.0 1983<br />
58<br />
216 216<br />
216 216<br />
230<br />
87 Sun Island Resort<br />
& Spa<br />
A.Dh. Nalaguraidhoo 99.8 1998<br />
700<br />
852 852<br />
852 852<br />
852<br />
88 Taj Exortica Resort & Spa Maldives<br />
K. Embudhuu Finolhu 12.9 1983<br />
20<br />
128 128<br />
128 128<br />
128<br />
89 Thulhaagiri Island Resort<br />
K. Thulhaagiri 11.0 1980<br />
44<br />
138 138<br />
172 172<br />
172<br />
90 Thundufushi Island Resort<br />
A.Dh. Thundufushi 80.5 1990<br />
74<br />
94 94<br />
94 94<br />
144<br />
91 Twin Island Resort<br />
A.Dh. Maafushivaru 54.7 1991<br />
60<br />
98 98<br />
98 98<br />
98<br />
92 Vakarufalhi Island Resort<br />
A.Dh. Vakarufalhi 90.0 1994<br />
100<br />
100 100<br />
150 150<br />
150<br />
93 Velassaru Maldives<br />
K. Velassaru<br />
11.3 1974<br />
90<br />
258 258<br />
258 258<br />
258<br />
94 Velidhoo Island Resort<br />
A.A. Velidho oo 80.5 1989<br />
22<br />
200 200<br />
200 200<br />
200<br />
95 Veligandu Island<br />
A.A. Veligan ndu 51.0 1984<br />
34<br />
148 148<br />
148 148<br />
148<br />
96 Vilamendhoo Island Resort<br />
A.Dh. Vilamendhoo 48.3 1994<br />
200<br />
282 282<br />
282 282<br />
368<br />
97 Villu Reef Beach & Spa Resort<br />
Dh. Meedhuffushi 128.7 1998<br />
136<br />
156 156<br />
200 200<br />
200<br />
98 Vivanta by Taj - Coral Reef, Maldives<br />
K. Hembadhoo 32.2 1982<br />
68<br />
132 132<br />
124 124<br />
124<br />
99 W. Retreat & Spa<br />
Maldives<br />
A.A. Fesdhu<br />
72.4 1982<br />
90<br />
164 164<br />
164 164<br />
164<br />
100 Waldorf Astoria Maldives<br />
H.A Manafaru 337.0 2007<br />
100<br />
100 142<br />
142 166<br />
166<br />
101 Zitahli Resort & Spa, Kudafunafa aru<br />
N. Kudafuna afaru 180.0 2008<br />
100<br />
- 100<br />
100 100<br />
100<br />
Total<br />
19,028 19,860 20,942 21,342 22,120<br />
Source: <strong>Ministry</strong> <strong>of</strong> <strong>Tourism</strong>, <strong>Arts</strong> & <strong>Culture</strong><br />
333 | Page
[Type<br />
the document title]<br />
Table 22: Bed Capacity <strong>of</strong> Hotels, 2007-2011<br />
Name <strong>of</strong> the Resort<br />
Atoll & Island<br />
Name<br />
Airport<br />
Distance<br />
(Km)<br />
Ye<br />
ar <strong>of</strong><br />
Initial<br />
Ope<br />
ra tio n<br />
Initial<br />
Bed<br />
Capacity<br />
2007 2008 2009<br />
2010 2011<br />
1 Central Hotel<br />
K. Male'<br />
2.0 1998 82<br />
82<br />
82 82<br />
82 82<br />
2 Coral Hotel & Spa<br />
K. Male'<br />
2.0 2006 77<br />
77<br />
77 77<br />
77 81<br />
3 Equator Village - Gan<br />
S. Gan<br />
400.0 1992 60<br />
156<br />
156 156<br />
156 156<br />
4 Gan Island<br />
Retreat<br />
S. Gan<br />
400.0 2011 100<br />
-<br />
- -<br />
- 100<br />
5 Green Hotel<br />
L. Gan<br />
260.0 2011 50<br />
-<br />
- -<br />
- 50<br />
6 Hulhule Island Hotel<br />
K. Hulhule'<br />
0.0 2000 176<br />
170<br />
272 272<br />
272 272<br />
7 Hulhumale' Sunshine Hotel<br />
K. Hulhumale'<br />
1.0 2010 30<br />
-<br />
- -<br />
30 30<br />
8 Kam Hotel<br />
K. Male'<br />
2.0 1994 58<br />
24<br />
24 24<br />
24 24<br />
9 Lucky Hiya Hotel<br />
K. Male'<br />
2.0 2007 39<br />
39<br />
39 39<br />
39 39<br />
10 Marble Hotel<br />
K. Male'<br />
2.0 2008 40<br />
-<br />
40 40<br />
55 55<br />
11 Mookai Hotel<br />
K. Male'<br />
2.0 2000 102<br />
102<br />
102 102<br />
102 102<br />
12 Mookai Siutes<br />
K. Male'<br />
2.0 2008 98<br />
-<br />
98 98<br />
98 98<br />
13 Nalahiya Hotel<br />
K. Male'<br />
2.0 2007 84<br />
84<br />
84 84<br />
84 84<br />
14 Nasandhura Palace Hotel<br />
K. Male'<br />
2.0 1981 60<br />
62<br />
62 -<br />
36 36<br />
15 Off Day Inn<br />
K. Male'<br />
2.0 1999 30<br />
30<br />
30 30<br />
30 30<br />
16 Relax Inn<br />
K. Male'<br />
2.0 1998 60<br />
60<br />
74 74<br />
74 74<br />
17 The Boutique Inn at Villa Shabnamee<br />
K. Male'<br />
2.0 2009 24<br />
-<br />
- 24<br />
24 24<br />
18 The Wave<br />
Hotel and Spa<br />
K. Male'<br />
2.0 2008 32<br />
-<br />
32 32<br />
32 32<br />
19 Traders Hotel<br />
K. Male'<br />
2.0 2009 78<br />
-<br />
- 234<br />
234 234<br />
Total<br />
Source:<br />
<strong>Ministry</strong> <strong>of</strong> <strong>Tourism</strong>, <strong>Arts</strong> & <strong>Culture</strong><br />
886 1, 172 1,368 1,449 1,603<br />
34<br />
| Page
[Type<br />
the document title]<br />
Table 23: Graduates from Faculty <strong>of</strong> Hospitality and <strong>Tourism</strong> Studies<br />
2007 - 20111<br />
Full Time Courses<br />
Other Courses<br />
Grand<br />
Year<br />
2007<br />
Male<br />
63<br />
Female<br />
16<br />
Total<br />
79<br />
Male<br />
104<br />
Female<br />
71<br />
Total<br />
175<br />
Total<br />
254<br />
2008<br />
75<br />
49<br />
124<br />
64<br />
13 77<br />
201<br />
2009<br />
48<br />
15<br />
63<br />
95<br />
54 149<br />
212<br />
2010<br />
76<br />
24<br />
100<br />
13<br />
11 24<br />
124<br />
2011<br />
65<br />
20<br />
85<br />
16<br />
52 68<br />
153<br />
Total<br />
327<br />
124 451<br />
Source:<br />
Faculty <strong>of</strong> Hospitality and <strong>Tourism</strong> Studies (FHTS)<br />
292 201 493<br />
944<br />
Table 24: Inbound and Outbound Travel (Maldivians Only)<br />
2007 - 20111<br />
Year<br />
Arrivals<br />
%<br />
change<br />
Departure<br />
%<br />
change<br />
2007<br />
100,575<br />
22.3<br />
101,842<br />
37.0<br />
2008<br />
121,287<br />
20.6<br />
123,008<br />
20.8<br />
2009<br />
120,328<br />
-0.8<br />
121,464<br />
-1.3<br />
2010<br />
129,286<br />
7.4<br />
129,608<br />
6.7<br />
2011<br />
132,215<br />
2.3<br />
131,501<br />
1.5<br />
Source: Department <strong>of</strong> Immigration<br />
and Emigration<br />
Table 25: Seasonal Variations <strong>of</strong> Tourist<br />
Arrivals (Seasonal Indices)<br />
2007 - 2011<br />
Year<br />
Jan<br />
Feb<br />
Mar<br />
Apr<br />
May Jun Jul Aug<br />
Sep<br />
Oct<br />
Nov<br />
Dec Seaso onality<br />
Ratio<br />
2007<br />
115 116<br />
114 112<br />
83 68 91<br />
94 86<br />
104 101<br />
116<br />
1.2<br />
2008<br />
114 119<br />
126 110<br />
86 71 84<br />
91 89<br />
99 102<br />
110<br />
1.3<br />
2009<br />
108 103<br />
109 100<br />
76 64 78<br />
92 89<br />
110 109<br />
115<br />
1.2<br />
2010<br />
102 117<br />
114 92<br />
88 67 87<br />
100 95<br />
113 113<br />
113<br />
1.2<br />
2011<br />
102 113<br />
104 103<br />
83 72 93<br />
99 93<br />
117 110<br />
110<br />
1.2<br />
Source:<br />
<strong>Ministry</strong> <strong>of</strong> <strong>Tourism</strong>, <strong>Arts</strong> & <strong>Culture</strong><br />
35<br />
| Page
Table 26: Tourist Arrivals and Market<br />
Share by<br />
Selected M<br />
2007 - 2011<br />
REGIO N / NATIONALITY<br />
EURO PE<br />
CENTRAL / EASTERN EUROPE 51,101 (7.6)<br />
Belarus<br />
Bulgaria<br />
Czech Republic<br />
Hungary<br />
Kazakhstan<br />
Poland<br />
Romania<br />
Russia<br />
Slovakia<br />
Ukraine<br />
Other Central / Eastern Europe<br />
NORTHERN EUROPE<br />
Denmark<br />
Finland<br />
Ireland<br />
Norway<br />
Sweden<br />
United Kingdom<br />
Other Northern Europe<br />
SOUTHERN EUROPE<br />
Greece<br />
Italy<br />
Portugal<br />
Slovenia<br />
Spain<br />
Other South hern Europe<br />
WESTERN EUROPE<br />
Austria<br />
Belgium<br />
France<br />
Germany<br />
Netherlands<br />
Switzerland<br />
Other Western Europe<br />
EAST MEDITERRANEAN EUROPE<br />
Israel<br />
Turkey<br />
Other East Mediterranean Europe<br />
495,371 (73.3)<br />
4<br />
3<br />
134,927 (20.0)<br />
1<br />
125,158 (18.5)<br />
1<br />
137,227 (20.3)<br />
1<br />
117,246 (17.3)<br />
1<br />
168,062 (24.9)<br />
1<br />
1<br />
the document title]<br />
(0.0)<br />
[Type<br />
304 359 (0.1)<br />
2008 2009<br />
97,560 (72.8)<br />
72,726 (10.6)<br />
583 (0.1)<br />
742 (0.1)<br />
784 (0.1)<br />
965 (0.1)<br />
3,811 (0.6)<br />
2,052 (0.3)<br />
1,656 (0.2)<br />
3,325 (0.5)<br />
1,225 (0.2)<br />
48,978 (7.2)<br />
1,916 (0.3)<br />
5,399 (0.8)<br />
2,657 (0.4)<br />
28,591 (18.8)<br />
1,834 (0.3)<br />
789 (0.1)<br />
865 (0.1)<br />
2,884 (0.4)<br />
2,596 (0.4)<br />
3,542 (0.5)<br />
16,821 (17.1)<br />
56 (0.0)<br />
49 (0.0)<br />
23,637 (18.1)<br />
4,926 (0.7)<br />
03,823 (15.2)<br />
4,150 (0.6)<br />
1,372 (0.2)<br />
8,217 (1.2)<br />
941 (0.1)<br />
1,149 (0.2)<br />
67,424 (24.5)<br />
13,462 (2.0)<br />
3,368 (0.5)<br />
69,240 (10.1)<br />
5,595 (0.8)<br />
605 (0.1)<br />
676 (0.1)<br />
5,182 (0.8)<br />
1,588 (0.2)<br />
3,235 (0.5)<br />
2007<br />
2,766 (0.4)<br />
2,568 (0.4)<br />
1,294 (0.2)<br />
2,659 (0.4)<br />
1,128 (0.2)<br />
1,845 (4.7)<br />
1,469 (0.2)<br />
3,545 (0.5)<br />
2,460 (0.4)<br />
1,819 (0.3)<br />
3,148 (0.5)<br />
1,808 (0.3)<br />
2,149 (0.3)<br />
4,850 (0.7)<br />
4,188 (0.6)<br />
1,204 (0.2)<br />
8,798 (1.3)<br />
3,673 (2.0)<br />
3,552 (0.5)<br />
45,301 (6.7)<br />
48,100 (7.0)<br />
50,373 (7.7)<br />
54,789 (6.9)<br />
72,269 (10.7)<br />
6,479 (1.0)<br />
26,183 (3.9)<br />
26,983 (4.0)<br />
26,783 (4.1)<br />
27,766 (3.5)<br />
4,054 (0.6)<br />
1,308 (0.2)<br />
2,442 (0.4)<br />
Markets<br />
2010<br />
505,421 (63.8)<br />
62,849 (9.6)<br />
75,435 (9.5)<br />
812 (0.1)<br />
898 (0.1)<br />
902 (0.1)<br />
1,051 (0.1)<br />
3,851 (0.6)<br />
5,137 (0.6)<br />
1,848 (0.3)<br />
2,434 (0.3)<br />
1,756 (0.3)<br />
1,572 (0.2)<br />
3,357 (0.5)<br />
3,795 (0.5)<br />
1,247 (0.2)<br />
1,290 (0.2)<br />
40,014 (6.1)<br />
49,111 (6.2)<br />
1,970 (0.3)<br />
2,348 (0.3)<br />
4,643 (0.7)<br />
5,445 (0.7)<br />
2,449 (0.4)<br />
2,354 (0.3)<br />
126,222 (15.9)<br />
1,722 (0.3)<br />
2,422 (0.3)<br />
1,088 (0.2)<br />
1,281 (0.2)<br />
2,420 (0.4)<br />
2,514 (0.3)<br />
2,120 (0.3)<br />
2,153 (0.3)<br />
3,165 (0.5)<br />
3,638 (0.5)<br />
114,158 (14.4)<br />
26 (0.0)<br />
56 (0.0)<br />
111,165 (14.0)<br />
5,406 (0.8)<br />
4,630 (0.6)<br />
89,292 (13.6)<br />
89,596 (11.3)<br />
4,822 (0.7)<br />
4,555 (0.6)<br />
1,324 (0.2)<br />
1,647 (0.2)<br />
7,279 (1.1)<br />
8,912 (1.1)<br />
1,185 (0.2)<br />
1,825 (0.2)<br />
185,433 (23.4)<br />
13,274 (2.0)<br />
14,944 (1.9)<br />
3,437 (0.5)<br />
4,386 (0.6)<br />
69,085 (10.5)<br />
77,108 (9.7)<br />
5,355 (0.8)<br />
5,682 (0.7)<br />
720 (0.1)<br />
758 (0.1)<br />
4,517 (0.7)<br />
7,166 (0.9)<br />
1,380 (0.2)<br />
2,113 (0.3)<br />
2,758 (0.4)<br />
4,637 (0.6)<br />
379 (0.1)<br />
462,192 (70.5)<br />
116,491 (17.8)<br />
105,950 (16.2)<br />
109,308 (16.7)<br />
169,027 (25.8)<br />
537,757 (57.7)<br />
95,247 (10.2)<br />
1,161 (0.1)<br />
1,368 (0.1)<br />
6,471 (0.7)<br />
2,596 (0.3)<br />
1,731 (0.2)<br />
4,158 (0.4)<br />
1,656 (0.2)<br />
63,936 (6.9)<br />
2,822 (0.3)<br />
6,729 (0.7)<br />
2,619 (0.3)<br />
119,388 (12.8)<br />
3,173 (0.3)<br />
1,535 (0.2)<br />
2,444 (0.3)<br />
2,775 (0.3)<br />
4,896 (0.5)<br />
104,508 (11.2)<br />
416 (0.1)<br />
2011<br />
57 (0.0)<br />
104,060 (11.2)<br />
3,009 (0.3)<br />
83,328 (8.9)<br />
4,325 (0.5)<br />
2,342 (0.3)<br />
8,861 (1.0)<br />
2,195 (0.2)<br />
211,755 (22.7)<br />
16,655 (1.8)<br />
5,738 (0.6)<br />
59,694 (6.4)<br />
90,517 (9.7)<br />
5,693 (0.6)<br />
32,504 (3.5)<br />
954 (0.1)<br />
7,307 (0.8)<br />
2,433 (0.3)<br />
4,542 (0.5)<br />
)<br />
332 (0.0)<br />
36<br />
6 | P age
[Type<br />
the document title]<br />
Table 26: (continued…)<br />
REGION / NATIO NALITY<br />
2007<br />
2008<br />
2009<br />
2010<br />
2011<br />
ASIA & THE PAC IFIC<br />
155,024 (22.9)<br />
NORTH EAST ASIA<br />
China<br />
Japan<br />
Korea<br />
Taiwan<br />
Other North East Asia<br />
SOUTH EAST ASIA<br />
Indonesia<br />
Malaysia<br />
Philippines<br />
Singapore<br />
Thailand<br />
Other South East Asia<br />
SOUTH ASIA<br />
Banglades sh<br />
India<br />
Pakistan<br />
Sri Lankaa<br />
Other South Asia<br />
OCEANIA<br />
Australia<br />
New Zealand<br />
Other Oceania<br />
Africa<br />
South Africa<br />
Other Africa<br />
Americas<br />
Brazil<br />
Canada<br />
U.S.A<br />
Other Americas<br />
Middle East<br />
Kuwait<br />
Lebanon<br />
Saudi Arabia<br />
United Arab Emirates<br />
Other Middle East<br />
Global Total<br />
675,889<br />
Source: Department <strong>of</strong> Immigration and Emigration<br />
100,669 (14.9)<br />
35,976 (5.3)<br />
41,121 (6.1)<br />
20,976 (3.1)<br />
2,018 (0.3)<br />
578 (0.1)<br />
13,344 (2.0)<br />
943 (0.1)<br />
2,999 (0.4)<br />
982 (0.1)<br />
4,456 (0.7)<br />
3,663 (0.5)<br />
301 (0.0)<br />
30,350 (4.5)<br />
1,284 (0.2)<br />
17,327 (2.6)<br />
1,013 (0.1)<br />
9,654 (1.4)<br />
1,072 (0.2)<br />
10,661 (1.6)<br />
9,406 (1.4)<br />
1,142 (0.2)<br />
113 (0.0)<br />
4,846 (0.7)<br />
3,293 (0.5)<br />
1,553 (0.2)<br />
14,198 (2.1)<br />
708 (0.1)<br />
2,851 (0.4)<br />
9,348 (1.4)<br />
1,291 (0.2)<br />
6,450 (1.0)<br />
1,004 (0.1)<br />
660 (0.1)<br />
1,940 (0.3)<br />
807 (0.1)<br />
2,039 (0.3)<br />
156,132 (22.9)<br />
102,899 (15.1)<br />
41,511 (6.1)<br />
38,193 (5.6)<br />
20,934 (3.1)<br />
2,233 (0.3)<br />
28 (0.0)<br />
13,678 (2.0)<br />
581 (0.1)<br />
3,137 (0.5)<br />
871 (0.1)<br />
4,956 (0.7)<br />
3,952 (0.6)<br />
181 (0.0)<br />
28,981 (4.2)<br />
455 (0.1)<br />
16,663 (2.4)<br />
1,191 (0.2)<br />
9,752 (1.4)<br />
920 (0.1)<br />
10,574 (1.5)<br />
9,368 (1.4)<br />
1,184 (0.2)<br />
22 (0.0)<br />
5,694 (0.8)<br />
3,732 (0.5)<br />
1,962 (0.3)<br />
14,485 (2.1)<br />
1,327 (0.2)<br />
2,966 (0.4)<br />
8,853 (1.3)<br />
1,339 (0.2)<br />
9,141 (1.3)<br />
1,340 (0.2)<br />
1,139 (0.2)<br />
2,747 (0.4)<br />
1,394 (0.2)<br />
2,521 (0.4)<br />
683,012<br />
163,942 (25.0)<br />
250,638 (31. 6)<br />
348,887 (37<br />
115,445 (17.6)<br />
186,452 (23. 5)<br />
265,096 (28<br />
60,666 (9.2)<br />
118,961 (15.<br />
198,655<br />
0) (2<br />
36,641 (5.6)<br />
38,791 (4. 9)<br />
35,782 (3<br />
16,135 (2.5)<br />
24,808 (3.<br />
25,285<br />
1) (2<br />
1,975 (0.3)<br />
28 (0.0)<br />
61 (0.<br />
69<br />
0) (0 0.0)<br />
14,097 (2.1)<br />
16,818 (2. 1)<br />
23,726 (2<br />
677 (0.1)<br />
818 (0.<br />
3,139 (0.5)<br />
979 (0.1)<br />
5,214 (0.8)<br />
3,813 (0.6)<br />
275 (0.0)<br />
311 (0. 0)<br />
532 (0 0.1)<br />
25,996 (4.0)<br />
36,612 (4. 6)<br />
45,870 (4<br />
388 (0.1)<br />
525 (0.<br />
15,850 (2.4)<br />
25,756 (3.<br />
30,978<br />
3) (3<br />
1,046 (0.2)<br />
7,833 (1.2)<br />
879 (0.1)<br />
8,404 (1.3)<br />
7,392 (1.1)<br />
991 (0.2)<br />
21 (0.0)<br />
31 (0. 0)<br />
27 (0 0.0)<br />
5,034 (0.8)<br />
2,975 (0.5)<br />
2,059 (0.3)<br />
15,159 (2.3)<br />
18,601 (2. 3)<br />
23,654 (2<br />
1,304 (0.2)<br />
3,043 (0.5)<br />
9,438 (1.4)<br />
1,374 (0.2)<br />
9,525 (1.5)<br />
1,181 (0.2)<br />
984 (0.2)<br />
3,036 (0.5)<br />
1,580 (0.2)<br />
2,744 (0.4)<br />
)<br />
3,831 (0. 5)<br />
5,305 (0<br />
1)<br />
1,283 (0<br />
)<br />
3,894 (0. 5)<br />
6,055 (0<br />
1,066<br />
) (0.<br />
1,652<br />
1) (0<br />
)<br />
5,332 (0. 7)<br />
7,990 (0<br />
5,397<br />
) (0.<br />
6,214<br />
7) (0<br />
1)<br />
1,496 (0<br />
)<br />
1,256 (0. 2)<br />
1,842 (0<br />
7,872<br />
) (1.<br />
9,670<br />
0) (<br />
)<br />
1,203 (0. 2)<br />
1,884 (0<br />
)<br />
10,756 (1. 4)<br />
14,195 (<br />
)<br />
9,622 (1. 2)<br />
12,778 (<br />
1,103<br />
) (0.<br />
1,390<br />
1) (0<br />
)<br />
5,628 (0. 7)<br />
6,465 (0<br />
)<br />
3,157 (0. 4)<br />
3,684 (0<br />
2,471<br />
) (0.<br />
2,781<br />
3) (0<br />
1,761<br />
) (0.<br />
2,342<br />
2) (0<br />
)<br />
3,815 (0. 5)<br />
4,690 (0<br />
11,482<br />
) (1.<br />
14,490<br />
4) (<br />
1,543<br />
) (0.<br />
2,132<br />
2) (0<br />
)<br />
11,629 (1. 5)<br />
14,570 (<br />
1,409<br />
) (0.<br />
1,797<br />
2) (0<br />
)<br />
1,145 (0. 1)<br />
1,346 (0<br />
4,040<br />
) (0.<br />
5,005<br />
5) (0<br />
)<br />
1,699 (0. 2)<br />
2,292 (0<br />
3,336<br />
) (0.<br />
4,130<br />
4) (0<br />
655,852 791,917 931,333<br />
7.5)<br />
8.5)<br />
1.3)<br />
3.8)<br />
2.7)<br />
0.6)<br />
2.5)<br />
0.1)<br />
0.7)<br />
0.2)<br />
0.9)<br />
0.7)<br />
4.9)<br />
0.2)<br />
3.3)<br />
0.2)<br />
1.0)<br />
0.2)<br />
1.5)<br />
1.4)<br />
0.1)<br />
0.7)<br />
0.4)<br />
0.3)<br />
2.5)<br />
0.3)<br />
0.5)<br />
1.6)<br />
0.2)<br />
1.6)<br />
0.2)<br />
0.1)<br />
0.5)<br />
0.2)<br />
0.4)<br />
37<br />
| Page
[Type<br />
the document title]<br />
Table 27: Growth Trends <strong>of</strong> Selected Markets, 2007 – 20111<br />
(Percent)<br />
REGIO N / NATIONALITY<br />
2007<br />
2008<br />
2009<br />
2010<br />
2011<br />
EURO PE<br />
8.3<br />
0.4<br />
-7.1<br />
9.4<br />
6.4<br />
CENTRAL / EASTERN EUROPE<br />
40.3<br />
42.3<br />
-13.6<br />
20.0<br />
26.3<br />
Belarus<br />
19.2<br />
27.3<br />
9.4<br />
10.6<br />
29.3<br />
Bulgaria<br />
73.8<br />
23.1<br />
-6.5<br />
16.5<br />
30.2<br />
Czech Republic<br />
20.5<br />
37.8<br />
1.0<br />
33.4<br />
26.0<br />
Hungary<br />
-3.5<br />
-20.1<br />
-9.9<br />
31.7<br />
6.7<br />
Kazakhstan<br />
117.5<br />
28.0<br />
6.0<br />
-10.5<br />
10.1<br />
Poland<br />
44.2<br />
25.0<br />
1.0<br />
13.0<br />
9.6<br />
Romania<br />
70.7<br />
8.6<br />
1.8<br />
3.4<br />
28.4<br />
Russia<br />
45.0<br />
53.8<br />
-18.3<br />
22.7<br />
30.2<br />
Slovakia<br />
55.6<br />
30.4<br />
2.8<br />
19.2<br />
20.2<br />
Ukraine<br />
46.1<br />
52.3<br />
-14.0<br />
17.3<br />
23.6<br />
Other Central / Eastern Europe<br />
17.3<br />
8.0<br />
-7.8<br />
-3.9<br />
11.3<br />
NORTHERN EUROPE<br />
16.2<br />
-4.7<br />
-9.4<br />
8.4<br />
-5.4<br />
Denmark<br />
21.3<br />
0.8<br />
-6.1<br />
40.7<br />
31.0<br />
Finland<br />
52.3<br />
9.6<br />
25.8<br />
17.7<br />
19.8<br />
Ireland<br />
18.9<br />
-8.4<br />
-16.1<br />
3.9<br />
-2.8<br />
Norway<br />
12.1<br />
43.6<br />
-18.3<br />
1.6<br />
28.9<br />
Sweden<br />
19.4<br />
64.8<br />
-10.6<br />
14.9<br />
34.6<br />
United Kingdom<br />
15.9<br />
-6.7<br />
-9.3<br />
7.7<br />
-8.5<br />
Other Northern Europe<br />
12.0<br />
-12.5<br />
-46.9<br />
115.4<br />
1.8<br />
SOUTHERN EUROPE<br />
2.1<br />
-9.9<br />
-11.6<br />
1.7<br />
-6.4<br />
Greece<br />
35.3<br />
1.6<br />
9.7<br />
-14.4<br />
-35.0<br />
Italy<br />
-1.4<br />
-11.4<br />
-14.0<br />
0.3<br />
-7.3<br />
Portugal<br />
14.6<br />
-0.9<br />
16.2<br />
-5.5<br />
-2.7<br />
Slovenia<br />
51.3<br />
14.0<br />
-3.5<br />
24.4<br />
-2.3<br />
Spain<br />
31.7<br />
-6.6<br />
-11.4<br />
22.4<br />
9.0<br />
Other South hern Europe<br />
17.2<br />
22.1<br />
3.1<br />
54.0<br />
21.1<br />
WESTERN EUROPE<br />
0.4<br />
-0.4<br />
1.0<br />
9.7<br />
14.2<br />
Austria<br />
-3.0<br />
-1.5<br />
-1.4<br />
12.6<br />
11.4<br />
Belgium<br />
-11.0<br />
-5.2<br />
2.0<br />
27.6<br />
30.8<br />
France<br />
3.8<br />
6.2<br />
4.7<br />
8.8<br />
9.0<br />
Germany<br />
2.0<br />
-4.2<br />
-0.2<br />
11.6<br />
17.4<br />
Netherlands<br />
-19.5<br />
-13.6<br />
-4.3<br />
6.1<br />
0.2<br />
Switzerland<br />
-0.3<br />
3.1<br />
-0.7<br />
3.7<br />
17.1<br />
Other Western Europe<br />
-3.4<br />
11.7<br />
6.5<br />
5.3<br />
25.9<br />
EAST MEDITERRANEAN EUROPE<br />
31.9<br />
27.8<br />
-12.8<br />
58.6<br />
2.0<br />
Israel<br />
54.6<br />
21.4<br />
-13.1<br />
53.1<br />
15.1<br />
Turkey<br />
19.5<br />
32.5<br />
-14.7<br />
68.1<br />
-2.0<br />
Other East Mediterranean Europe<br />
65.2<br />
18.1<br />
5.6<br />
9.8<br />
-20.2<br />
38 | P age
[Type<br />
the document title]<br />
Table 27: (continued…)<br />
REGION / NATIO NALITY<br />
ASIA & THE PACIFIC<br />
NORTH EAST ASIA<br />
China<br />
Japan<br />
Korea<br />
Taiwan<br />
Other North East Asia<br />
SOUTH EAST ASIA<br />
Indonesia<br />
Malaysiaa<br />
Philippines<br />
Singapor re<br />
Thailand<br />
Other South East Asia<br />
SOUTH ASIA<br />
Banglade esh<br />
India<br />
Pakistan<br />
Sri Lanka<br />
Other South Asia<br />
OCEANIA<br />
Australiaa<br />
New Zealand<br />
Other Oceania<br />
Africa<br />
South Africa<br />
Other Africa<br />
Americas<br />
Brazil<br />
Canada<br />
U.S.A<br />
Other Americas<br />
Middle East<br />
Kuwait<br />
Lebanonn<br />
Saudi Arabia<br />
United Arab Emirates<br />
Other Middle East<br />
Global Total<br />
Source: Department <strong>of</strong> Immigration and Emigration<br />
2007 24. 0<br />
20.7<br />
36. 3<br />
4. 0<br />
29. 8<br />
2008<br />
0.7<br />
2.22 15.4<br />
-7.1<br />
-0.2<br />
2009<br />
5.0<br />
12.2<br />
46.1<br />
-4.1<br />
-22.9<br />
20100 52.9<br />
61.5<br />
96.1<br />
5.9<br />
53.8<br />
2011<br />
39.2<br />
42.2<br />
67.0<br />
-7.8<br />
1.9<br />
57. 5<br />
1345. 0<br />
22.5<br />
50. 9<br />
10.7<br />
-95.2<br />
2.5<br />
-38.4<br />
-11.6<br />
0.00 3.1<br />
16.5<br />
94.0<br />
117.9<br />
19.3<br />
20.8<br />
38.5<br />
13.1<br />
41.1<br />
56.8<br />
2. 9<br />
47. 4<br />
4. 7<br />
62. 7<br />
63. 6<br />
33.4<br />
22. 3<br />
43. 5<br />
4.6<br />
-11.3<br />
11.2<br />
7.9<br />
-39.99 -4.5<br />
-64.66 -3.8<br />
0.1<br />
12.4<br />
5.2<br />
-3.5<br />
51.9<br />
-10.3<br />
-14.7<br />
-4.9<br />
24.1<br />
8.9<br />
2.3<br />
41.5<br />
13.1<br />
40.8<br />
35.3<br />
62.5<br />
55.5<br />
55.0<br />
49.8<br />
15.1<br />
71.1<br />
25.3<br />
185.0<br />
20.3<br />
-9. 5<br />
21. 4<br />
90. 4<br />
33.6<br />
36. 5<br />
13. 5<br />
39. 5<br />
16. 2<br />
17.6<br />
1.0<br />
-14.2<br />
-0.8<br />
-0.4<br />
3.7<br />
-80.5<br />
17.5<br />
-12.22 -19.7<br />
-4.5<br />
-20.5<br />
-21.11 -16.3<br />
-4.5<br />
-11.6<br />
20.1<br />
0.5<br />
36.9<br />
28.0<br />
30.2<br />
11.3<br />
47.6<br />
11.8<br />
46.7<br />
22.8<br />
56.6<br />
32.0<br />
32.8<br />
26.0<br />
-12.9<br />
14.9<br />
10. 8<br />
29. 8<br />
31. 3<br />
25. 5<br />
29. 8<br />
30. 7<br />
43. 0<br />
13.33 26.3<br />
2.0<br />
87.4<br />
4.0<br />
-5.3<br />
3.7<br />
-20.3<br />
4.9<br />
4.7<br />
-1.7<br />
2.6<br />
6.66 2.6<br />
6.1<br />
20.0<br />
22.7<br />
35.0<br />
25.4<br />
21.7<br />
12.3<br />
16.7<br />
12.5<br />
27.2<br />
33.0<br />
22.9<br />
26.2<br />
38.2<br />
47. 5<br />
50. 3<br />
64. 2<br />
26. 8<br />
64. 0<br />
59. 3<br />
12. 3<br />
41.7<br />
33.5<br />
72.6<br />
41.6<br />
72.77 23.6<br />
1.11 4.2<br />
-11.9<br />
-13.6<br />
10.5<br />
13.33 8.88 -4.0<br />
22.1<br />
19.3<br />
16.4<br />
33.1<br />
7.5<br />
21.6<br />
20.7<br />
25.3<br />
27.5<br />
17.6<br />
23.9<br />
34.9<br />
23.8<br />
17.6<br />
39 | P age
[Type<br />
the document title]<br />
Table 28: Tourist Arrivals by<br />
Markets,<br />
(at end September<br />
<strong>2012</strong>)<br />
January - September<br />
% S hare<br />
REGIO N / NATIO NALITY<br />
2011 <strong>2012</strong>2 % C han ge<br />
<strong>2012</strong><br />
EURO PE<br />
CENTRAL / EASTERN EUROPE<br />
Belarus<br />
Bulgaria<br />
Czech Republic<br />
Hungary<br />
Kazakhstan<br />
Poland<br />
Romania<br />
Russia<br />
Slovakia<br />
Ukraine<br />
Other Central / Eastern Europe<br />
NORTHERN EUROPE<br />
Denmark<br />
Finland<br />
Ireland<br />
Norway<br />
Sweden<br />
United Kingdom<br />
Other Northern Europe<br />
SOUTHERN EUROPE<br />
Greece<br />
Italy<br />
Portugal<br />
Slovenia<br />
Spain<br />
Other South hern Europe<br />
WESTERN EUROPE<br />
Austria<br />
Belgium<br />
France<br />
Germany<br />
Netherlands<br />
/ Holland<br />
Switzerland<br />
Other Western Europe<br />
EAST MEDITERRANEAN EUROPE<br />
Israel<br />
Turkey<br />
Other East Mediterranean Europe<br />
387,936<br />
66,720<br />
804<br />
1,008<br />
4,581<br />
2,020<br />
1,151<br />
2,837<br />
1,096<br />
44,829<br />
2,087<br />
4,559<br />
1,748<br />
88,659<br />
2,110<br />
1,022<br />
1,760<br />
1,928<br />
3,025<br />
78,772<br />
42<br />
80,004<br />
2,394<br />
64,231<br />
3,633<br />
1,178<br />
7,042<br />
1,526<br />
147,489<br />
11,765<br />
4,085<br />
43,002<br />
61,929<br />
4,181<br />
21,814<br />
713<br />
5,064<br />
1,634<br />
3,165<br />
265<br />
376,674<br />
70,084<br />
1,0411 986<br />
3,9533 1,749<br />
2,170<br />
2,589<br />
1,302<br />
46,440<br />
1,894<br />
5,640<br />
2,320<br />
78,495<br />
2,349<br />
9555 1,863<br />
2,145<br />
3,1555 67,9877 41<br />
61,161<br />
1,6066 47,348<br />
2,867<br />
9222 6,527<br />
1,8911 161,343<br />
12,7977 3,756<br />
42,197<br />
71,950<br />
4,517<br />
25,487<br />
639<br />
5,591<br />
1,990<br />
3,4044 197<br />
-2. 9<br />
5.0<br />
29. 5<br />
-2.22 -13. 7<br />
-13.4<br />
88. 5<br />
-8. 7<br />
18. 8<br />
3. 6<br />
-9.2<br />
23. 7<br />
32. 7<br />
-11.5<br />
11. 3<br />
-6. 6<br />
5. 9<br />
11. 3<br />
4. 3<br />
-13. 7<br />
-2.4<br />
-23.6<br />
-32. 9<br />
-26. 3<br />
-21. 1<br />
-21. 7<br />
-7. 3<br />
23. 9<br />
9.4<br />
8. 8<br />
-8. 1<br />
-1. 9<br />
16.2<br />
8. 0<br />
16. 8<br />
-10.4<br />
10.4<br />
21. 8<br />
7. 6<br />
-25. 7<br />
54.5<br />
10. 1<br />
0.2<br />
0.1<br />
0.6<br />
0.3<br />
0.3<br />
0.4<br />
0.2<br />
6.7<br />
0.3<br />
0.8<br />
0.3<br />
11. 3<br />
0.3<br />
0.1<br />
0.3<br />
0.3<br />
0.5<br />
9.8<br />
0.0<br />
8. 8<br />
0.2<br />
6.8<br />
0.4<br />
0.1<br />
0.9<br />
0.3<br />
23. 3<br />
1.9<br />
0.5<br />
6.1<br />
10.4<br />
0.7<br />
3.7<br />
0.1<br />
0. 8<br />
0.3<br />
0.5<br />
0.0<br />
40 | P age
[Type<br />
the document title]<br />
Table 28: (continued…)<br />
REGIO N / NATIO<br />
NALITY<br />
2011<br />
January - September<br />
<strong>2012</strong> % Change<br />
% S hare<br />
<strong>2012</strong><br />
ASIA & THE PACIFIC<br />
249,820<br />
275,343<br />
10.2<br />
39.8<br />
NORTH EAST ASIA<br />
191,316<br />
213,797<br />
11.8<br />
30.9<br />
China<br />
146,668<br />
169,117<br />
15.3<br />
24.5<br />
Japan<br />
26,388<br />
25,947<br />
-1.7<br />
3.8<br />
Korea<br />
14,469<br />
15,661<br />
8.2<br />
2.3<br />
Taiwan<br />
3,746<br />
3,041<br />
-18.8<br />
0.4<br />
Other North East Asia<br />
45<br />
31<br />
-31.1<br />
0.0<br />
SOUTH EAST ASIA<br />
16,499<br />
19,093<br />
15.7<br />
2.8<br />
Indonesia<br />
875<br />
1,198<br />
36.9<br />
0.2<br />
Malaysia<br />
4,284<br />
4,731<br />
10.4<br />
0.7<br />
Philippines<br />
1,183<br />
1,546<br />
30.7<br />
0.2<br />
Singapore<br />
5,352<br />
6,295<br />
17.6<br />
0.9<br />
Thailand<br />
4,474<br />
4,880<br />
9.1<br />
0.7<br />
Other South East Asia<br />
331<br />
443<br />
33.8<br />
0.1<br />
SOUTH ASIA<br />
31,335<br />
29,687<br />
-5.3<br />
4.3<br />
Bangladesh<br />
1,049<br />
839<br />
-20.0<br />
0.1<br />
India<br />
20,617<br />
19,723<br />
-4.3<br />
2.9<br />
Pakistan<br />
1,233<br />
1,353<br />
9.7<br />
0.2<br />
Sri Lanka<br />
7,073<br />
6,447<br />
-8.9<br />
0.9<br />
Other South Asia<br />
1,363<br />
1,325<br />
-2.8<br />
0.2<br />
OCEANIA<br />
10,670<br />
12,766<br />
19.6<br />
1.8<br />
Australia<br />
9,576<br />
11,548<br />
20.6<br />
1.7<br />
New Zealand<br />
1,073<br />
1,196<br />
11.5<br />
0.2<br />
Other Oceania<br />
21<br />
22<br />
4.8<br />
0.0<br />
AFRICA<br />
4,560<br />
5,005<br />
9.8<br />
0.7<br />
South Africa<br />
2,595<br />
2,732<br />
5.3<br />
0.4<br />
Other Africa<br />
1,965<br />
2,273<br />
15.7<br />
0.3<br />
AMERICAS<br />
16,367<br />
18,375<br />
12.3<br />
2.7<br />
Brazil<br />
1,793<br />
2,180<br />
21.6<br />
0.3<br />
Canada<br />
3,152<br />
3,439<br />
9.1<br />
0.5<br />
U.S.A.<br />
9,906<br />
10,899<br />
10.0<br />
1.6<br />
Other Americas<br />
1,516<br />
1,857<br />
22.5<br />
0.3<br />
MIDDLE EAS T<br />
10,489<br />
16,211<br />
54.6<br />
2.3<br />
Kuwait<br />
1,225<br />
2,145<br />
75.1<br />
0.3<br />
Lebanon<br />
979<br />
1,250<br />
27.7<br />
0.2<br />
Saudi Arabia<br />
3,761<br />
5,513<br />
46.6<br />
0.8<br />
United Arab Emirates<br />
1,627<br />
2,983<br />
83.3<br />
0.4<br />
Other Middle East<br />
2,897<br />
4,320<br />
49.1<br />
0.6<br />
TO<br />
TAL TO URIST ARRIVALS<br />
669,172<br />
691,608<br />
3.4<br />
100.0<br />
Source: Department <strong>of</strong> Immigration<br />
and Emigration<br />
41 | P age
[Type<br />
the document title]<br />
Table 29: <strong>Tourism</strong> Indicators, (at end September <strong>2012</strong>)<br />
Year<br />
Jan<br />
Feb<br />
Mar<br />
Apr<br />
May<br />
Jun<br />
Jul<br />
Aug<br />
Sep<br />
Jan-Sep<br />
TOURIST ARRIVALS<br />
Total<br />
FRONTIER ARRIVALS (by air)<br />
2011<br />
79,493 87,392 80,732<br />
79,947 64,456 55,947 72,516 76,8288 71,861<br />
669,172<br />
<strong>2012</strong><br />
96,146 83,252 76,469<br />
79,288 63,534 59,379 76,966 79,768<br />
76,806<br />
691,608<br />
Growth %<br />
20.9 -4.7 -5.3<br />
-0.8 -1.4 6.1<br />
6.1 3.8<br />
6.9<br />
3.4<br />
SURFACE ARRIVALS (Cruise P assengers ) 2011<br />
0<br />
0 0<br />
0<br />
0 0<br />
0 0 0<br />
0<br />
<strong>2012</strong><br />
0<br />
0 0<br />
0<br />
0 0<br />
0 0 0<br />
0<br />
REGISTERED CAPACITY <strong>2012</strong><br />
Growth %<br />
-<br />
- -<br />
-<br />
- -<br />
-<br />
- -<br />
-<br />
Average<br />
RESORTS<br />
Nos.<br />
102 103 105<br />
105 105 105<br />
105 105<br />
105<br />
104<br />
Beds<br />
22,140 22,277 22,483<br />
22,593 22,593 22,783 22,783 22,783<br />
22,783<br />
22,580<br />
HOTELS<br />
Nos.<br />
19<br />
20 20<br />
20 20 20<br />
20 20<br />
19<br />
20<br />
Beds<br />
1,603 1,649 1,649<br />
1,613 1,627 1,627<br />
1,627 1,627<br />
1,597<br />
1,624<br />
GUEST<br />
HOUSES<br />
Nos.<br />
43<br />
43 44<br />
45 50 56<br />
59 60<br />
67<br />
52<br />
Beds<br />
701 717 735<br />
787 791 851<br />
895 903<br />
985<br />
818<br />
SAFARI VESSELS<br />
Nos.<br />
158 159 160<br />
160 161 161<br />
159 158<br />
159<br />
159<br />
Beds<br />
2,530 2,544 2,564<br />
2,564 2,583 2,583<br />
2,557 2,541<br />
2,560<br />
2,558<br />
TOTA<br />
L<br />
Nos.<br />
322 325 329<br />
330 336 342<br />
343 3433 350<br />
336<br />
OPERATIONAL CAPACITY<br />
Beds<br />
26,974 27,187 27,431<br />
27,557 27,594 27,844 27,862 27,854<br />
27,925<br />
27,581<br />
Average<br />
RESORTS<br />
Nos. 2011<br />
90<br />
92 92<br />
93 93 93<br />
92 93<br />
93<br />
92<br />
<strong>2012</strong><br />
95<br />
96 98<br />
99 97 96<br />
97 98<br />
99<br />
97<br />
Beds 2011<br />
20,604 20,894 20,990<br />
21,234 21,192 21,014 20,544 21,0900 21,126<br />
20,965<br />
<strong>2012</strong><br />
21,514 21,574 21,671<br />
21,779 21,713 21,611 21,899 22,081<br />
22,177<br />
21,780<br />
HOTELS<br />
Nos. 2011<br />
16<br />
17 17<br />
17 17 17<br />
17 17<br />
17<br />
17<br />
<strong>2012</strong><br />
18<br />
19 19<br />
19 19 19<br />
19 19<br />
18<br />
19<br />
Beds 2011<br />
1,423 1,473 1,473<br />
1,473 1,473 1,473<br />
1,473 1,473<br />
1,473<br />
1,467<br />
<strong>2012</strong><br />
1,573 1,619 1,619<br />
1,619 1,597 1,597<br />
1,597 1,597<br />
1,567<br />
1,598<br />
GUEST<br />
HOUSES<br />
Nos. 2011<br />
22<br />
25 26<br />
26 24 26<br />
25 23<br />
26<br />
25<br />
<strong>2012</strong><br />
28<br />
20 29<br />
35 38 38<br />
45 47<br />
50<br />
37<br />
Beds 2011<br />
458 525 531<br />
527 483 507<br />
476 442<br />
480<br />
492<br />
<strong>2012</strong><br />
462 361 451<br />
593 55 55 555<br />
647 683<br />
713<br />
558<br />
SAFARI VESSELS<br />
Nos. 2011<br />
106 112 118<br />
116 100 104<br />
112 86<br />
79<br />
104<br />
<strong>2012</strong><br />
59<br />
53 78<br />
80 71 64<br />
60 67<br />
75<br />
67<br />
Beds 2011<br />
1,649 1,758 1,820<br />
1,806 1,486 1,593<br />
1,713 1,2911 1,205<br />
1,591<br />
<strong>2012</strong><br />
835 879 1,146<br />
1,152 1,040 894<br />
834 992<br />
1,125<br />
989<br />
TOTA<br />
L<br />
Nos. 2011<br />
234 246 253<br />
252 234 240<br />
246 219<br />
215<br />
238<br />
<strong>2012</strong><br />
200 188 224<br />
233 225 217<br />
221 231<br />
242<br />
220<br />
Beds 2011<br />
24,134 24,650 24,814<br />
25,040 24,634 24,587 24,206 24,296<br />
24,284<br />
24,516<br />
<strong>2012</strong><br />
24,384 24,433 24,887<br />
25,143 24,905 24,657 24,977 25,3533 25,582<br />
24,925<br />
42<br />
| Page
[Type<br />
the document title]<br />
Table 29: (continued…)<br />
BED NIGHTS<br />
RESORTS<br />
HOTELS<br />
GUEST HOUSES<br />
SAFARI VES S ELS<br />
TOTAL<br />
OCCUPANCY RATE (%)<br />
RESORTS<br />
HOTELS<br />
GUEST HOUSES<br />
SAFARI VES S ELS<br />
TOTAL<br />
AVG. DURATION OF<br />
STAY (Days)<br />
Year Jan Feb<br />
Mar Apr May<br />
Jun Jul Aug<br />
2011 575,643 570,008 578,260 553,106 445,082<br />
357,673 453,491 494,602<br />
<strong>2012</strong> 622,944 570,182 547,335 527,562 445,4333 363,041 467,362 512,488<br />
Growth %<br />
2011<br />
<strong>2012</strong><br />
Growth %<br />
2011<br />
<strong>2012</strong><br />
Growth %<br />
2011<br />
<strong>2012</strong><br />
Growth %<br />
2011 612,409 614,828 624,439 591,583 468,857<br />
376,347 478,483 519,711<br />
<strong>2012</strong> 658,702 599,398 581,755 559,815 465,1144 379,082 486,670 534,569<br />
Growth %<br />
2011<br />
<strong>2012</strong><br />
Change<br />
2011<br />
<strong>2012</strong><br />
Change<br />
2011<br />
<strong>2012</strong><br />
Change<br />
2011<br />
<strong>2012</strong><br />
Change<br />
2011<br />
<strong>2012</strong><br />
Change<br />
2011<br />
<strong>2012</strong><br />
Change<br />
8.2 0. .0 -5.3 -4.6 0.1<br />
1.5 3.1 3.6<br />
19,917 21,429 19,438 17,693 15,428<br />
13,551 16,889 14,569<br />
23,478 17,021 15,986 14,310 10,5999 10,665 12,919 12,793<br />
17.9 -20.6 -17.8<br />
2,445 2,586 2,824<br />
2,867 1,678 2,423<br />
17.3 -35.1 -14.2<br />
7.6 -2.5 -6.8 -5.4 -0.8<br />
0.7 1.7 2.9<br />
90.1 97. .4 88.9 86.8 67.77 56.7 71.2 75.7<br />
93.4 94. .4 81.5 80.7 66.2<br />
56.0 68.8 74.9<br />
3.3 -3.0 -7.4 -6.1 -1.6<br />
-0.7 -2.4 -0.8<br />
45.1 52. .0 42.6 40.0 33.8<br />
30.7 37.0 31.9<br />
48.1 37. .5 31.9 29.5 21.4<br />
22.3 26.1 25.8<br />
3.0 -14.4 -10.7 -10.6 -12.4<br />
-8.4 -10.9 -6.1<br />
17.2 15. .9 17.2<br />
20.0 16. .6 17.3<br />
2.8 0. .7 0.2<br />
28.2 38. .2 42.4<br />
36.4 38. .6 45.1<br />
8.2 0. .4 2.7<br />
81.9 89. .1 81.2<br />
87.1 87. .6 75.4<br />
5.3 -1.5 -5.8<br />
7.7 7. .0 7.7<br />
6.9 7. .2 7.6<br />
-0.9 0. .2 -0.1<br />
-19.1 -31.33 -21.3 -23.5 -12.2<br />
2,078 1,557<br />
2,640 2,628 2,098<br />
3,625 2,359<br />
2,296 2,676 3,417<br />
74.4 51.55 -13.0 1.8 62.9<br />
14,404 20,805 23,917 18,706 6,790<br />
2,483 5,475 8,442<br />
9,413 10,517 16,011 14,318 6,723<br />
3,080 3,713 5,871<br />
-34.7 -49.4 -33.1 -23.5 -1.0<br />
24.0 -32.2 -30.5<br />
13.1 10.4<br />
16.8 17.8 15.3<br />
19.7 13.7<br />
13.3 13.3 164.5<br />
6.6 3.33 -3.5 -4.5 149.2<br />
34.5 14.7<br />
5.0 10.3 21.1<br />
41.4 20.9<br />
11.1 14.4 19.1<br />
6.9 6.1<br />
6.1 4.1 -2.0<br />
78.8 61.4<br />
51.0 63.8 69.0<br />
74.2 60.2<br />
51.2 62.9 68.0<br />
-4.5 -1.2<br />
0.2 -0.9 -1.0<br />
7.4 7.3<br />
6.7 6.6 6.8<br />
7.1 7.3<br />
6.4 6.3 6.7<br />
-0.3 0.00 -0.3 -0.3 -0.1<br />
Sep Jan-Sep<br />
Total<br />
453,010 4,480,875<br />
439,180 4,495,527<br />
-3.1 0.3<br />
16,977 155,891<br />
14,797 132,568<br />
-12.8 -15.0<br />
2,600 21,456<br />
3,109 24,450<br />
19.6 14.0<br />
7,065 108,087<br />
6,044 75,690<br />
-14.5 -30.0<br />
479,652 4,766,309<br />
463,130 4,728,235<br />
-3.4 -0.8<br />
Average<br />
71.5 78.5<br />
66.0 75.8<br />
-5.5 -2.7<br />
38.4 39.1<br />
31.5 30.5<br />
-6.9 -8.6<br />
18.1 15.8<br />
14.5 32.6<br />
-3.5 16.8<br />
19.5 23.8<br />
17.9 27.2<br />
-1.6 3.4<br />
65.8 71.3<br />
60.3 69.7<br />
-5.5 -1.6<br />
6.7 7.1<br />
6.0 6.8<br />
-0.6 -0.3<br />
Source: <strong>Ministry</strong> <strong>of</strong> <strong>Tourism</strong>, <strong>Arts</strong> and <strong>Culture</strong><br />
43<br />
| Page
[Type<br />
the document title]<br />
TOURISM HIGHLIGHTS<br />
Security<br />
Seminar for the <strong>Tourism</strong> Sector <strong>of</strong><br />
Maldives<br />
In<br />
April 2011,<br />
the <strong>Ministry</strong> <strong>of</strong> <strong>Tourism</strong>, <strong>Arts</strong> and <strong>Culture</strong> (MOTAC), the Maldives Police Services (MPS),<br />
the Maldives National Defense Force (MNDF) and the Maldives Association <strong>of</strong> <strong>Tourism</strong> Industry<br />
(MATI)<br />
jointly organized a two day seminar to<br />
address the<br />
ongoing security concerns in the tourism industry <strong>of</strong> the<br />
Maldives.<br />
The seminar which was attended by 145 participants, who weree mainly from<br />
the Maldives tourism sector and<br />
the relevant governmental<br />
authorities, was inaugurated by the then president H.E Mohamed Nasheed. In his<br />
inaugural speech, the president highlighted the importance <strong>of</strong><br />
tourism to the economy<br />
<strong>of</strong> Maldives and the<br />
rising security<br />
issues for the industry.<br />
He also highlighted the<br />
importance<br />
<strong>of</strong> the seminar and the<br />
roles all<br />
stakeholders in<br />
strengthening this industry.<br />
After the discussions held<br />
regarding the safety and security <strong>of</strong> tourists visiting the Maldives, safeguarding<br />
and protection<br />
<strong>of</strong> tourism sector investments and properties, it was agreed to establish a standardd security<br />
system for the<br />
tourist resorts to prevent unauthorized accesss to resorts. Also agreed<br />
was to formulate a<br />
security action<br />
plan for the<br />
tourism sector <strong>of</strong> the Maldives.<br />
Workshop on <strong>Tourism</strong><br />
Sector<br />
Forecasting Models<br />
As part <strong>of</strong> the Maldives <strong>Tourism</strong> Technical Assistance and Policy Note <strong>of</strong><br />
the World Bank, a team<br />
from the<br />
Bank undertook analyticall work on the tourism sector <strong>of</strong> the Maldives, in consultationn with various industry<br />
stakeholders and governmental authorities over a period from November 2010 to February 2011, which<br />
resulted in the<br />
development <strong>of</strong> four models to forecast tourist arrivals to<br />
the country and a paper on the<br />
Maldives tourism sector positioning.<br />
A consultationn workshop organized jointly by the World Bank and the <strong>Ministry</strong> <strong>of</strong> <strong>Tourism</strong>, <strong>Arts</strong> and <strong>Culture</strong><br />
was thereafterr held in October 2011, during whichh the paper on the “Maldives <strong>Tourism</strong> Sector Positioning”<br />
was shared for<br />
discussion among participants and the forecasting models were presented. The workshop was<br />
attended by various tourism<br />
sector stakeholders and<br />
relevant government authorities.<br />
The first session <strong>of</strong> this interactive three session workshop was focused on the overview <strong>of</strong> the Maldives<br />
<strong>Tourism</strong> Sector Study and its key analytical findings. Session two was based on the technical<br />
work on<br />
forecasting arrivals. During this session, the World Bank consultants introduced and explained<br />
the four<br />
forecasting models namely; the Global Elasticity model, the Temporal Method, the Time Series model and<br />
the Econometric model. Session three was focused<br />
on Contemporary Issues in the Maldives <strong>Tourism</strong> Sector<br />
and areas for further Analytical Work.<br />
444 | Page
[Type<br />
the document title]<br />
Workshop on the Adaptation<br />
Plan for the <strong>Tourism</strong> Sector<br />
<strong>of</strong> Strategic Human Resource<br />
The <strong>Ministry</strong><br />
<strong>of</strong> <strong>Tourism</strong>, <strong>Arts</strong> and <strong>Culture</strong> in collaboration<br />
with United Nations Development<br />
Programme<br />
conducted a one day workshop on 12 th September 2011 to discuss the Draft Strategic Human Resource Plan<br />
with the tourism sector. The workshop was attended by 114 participants from resorts, tourism related<br />
associations and relevant<br />
government<br />
authorities.<br />
The draft plan, prepared by Human Resources consultantt Mr. Wouter Schalken, includes a Situational<br />
Analysis and<br />
the Human Resource Demand and Supply forecast <strong>of</strong> the <strong>Tourism</strong> Industry.<br />
This plan was submitted<br />
to the National Planning Council and the cabinet secretariat for endorsement as an<br />
<strong>of</strong>ficial policy document for the tourism sector.<br />
Maldives Visitor Survey 2011<br />
The <strong>Ministry</strong> <strong>of</strong> <strong>Tourism</strong>, <strong>Arts</strong> and <strong>Culture</strong> in collaboration<br />
with Maldives Monetary<br />
Authority conducted the<br />
Maldives Visitor Survey 2011 from<br />
31 st March<br />
2011to 14 th April 2011. The primary goal <strong>of</strong> the Maldives<br />
Visitor Survey 2011 was to contribute to the efforts to enhance the tourism industry in the Maldives by<br />
providing those in industry and the government<br />
with a resource which details the characteristics, preferences<br />
and expectations <strong>of</strong> tourists who visit the Maldives. This survey also seeks to identify<br />
deviations from the last<br />
Tourist Pr<strong>of</strong>ile and Opinion Survey conducted in<br />
2008.<br />
The survey<br />
was able to capture information on:<br />
• The demographic, economic, social, and<br />
geographic<br />
pr<strong>of</strong>ile <strong>of</strong> tourists who visit the Maldives<br />
• Opinions <strong>of</strong> tourists about their place <strong>of</strong> stay in the Maldives; services and facilities; modes <strong>of</strong> travel<br />
to the Maldives<br />
• Patterns <strong>of</strong> visit, perceptions <strong>of</strong> value for money, holiday preferences and interests; and<br />
• Tourist expenditure in the Maldives.<br />
The survey<br />
report was launched at a ceremony held on 12 th<br />
January <strong>2012</strong> by the then Special Advisor to the<br />
President, Hon. Ibrahim<br />
Hussain Zaki. The report is available for download from the website <strong>of</strong> <strong>Ministry</strong> <strong>of</strong><br />
<strong>Tourism</strong>, <strong>Arts</strong> and <strong>Culture</strong>.<br />
45<br />
| Page
[Type<br />
the document title]<br />
Celebrating World <strong>Tourism</strong> Day 2011<br />
As<br />
in previous<br />
years, the <strong>Ministry</strong> <strong>of</strong> <strong>Tourism</strong>, <strong>Arts</strong> and <strong>Culture</strong> together with the Maldives tourism<br />
industry<br />
celebrated the World <strong>Tourism</strong> Day 2011. Special activities weree carried out<br />
to mark the day, which include;<br />
Issuing <strong>of</strong> a <strong>Tourism</strong> Day<br />
Supplement: A special supplement was released on 27 th September 2011. The<br />
supplement contained highlights from major events<br />
since tourism day 2010. Also included were messages on<br />
the<br />
occasion <strong>of</strong> tourism day 2011 by the then president <strong>of</strong> the<br />
Maldives HEP Mr. Mohamed Nasheed, the<br />
then Minister <strong>of</strong> <strong>Tourism</strong>,<br />
<strong>Arts</strong> and <strong>Culture</strong>, Dr. Mariyam Zulfa, the Secretary General <strong>of</strong> World<br />
<strong>Tourism</strong><br />
Organization (UNWTO) and from senior <strong>of</strong>ficials from the tourism industry<br />
<strong>of</strong> the Maldives.<br />
Installation <strong>of</strong><br />
Male’ Attractions Map: A map identifying tourist attractions and areas <strong>of</strong> interest for tourists<br />
was installed in two locations <strong>of</strong> Male’. The two locations are<br />
Jumhooreee Maidhan (Republic Square) near<br />
Jetty No.1 and<br />
in front <strong>of</strong> Nasandhura Palace Hotel.<br />
st<br />
Organizing a Dhivehi Fair: A local souvenir fair<br />
was held on the occasion <strong>of</strong> tourism day on 1 October<br />
2011 at the Republic Square. The fair was organized by National Centre for the <strong>Arts</strong> in<br />
association<br />
with the<br />
<strong>Ministry</strong> <strong>of</strong> <strong>Tourism</strong>, <strong>Arts</strong> and <strong>Culture</strong>. With participation from<br />
14 local souvenir shops, stalls weree set up to<br />
display local products. Live music and cultural dances enhanced<br />
the event.<br />
Third <strong>Tourism</strong><br />
Master Plan Review<br />
The Third <strong>Tourism</strong> Master Plan (TTMP) <strong>of</strong> Maldives which covers the period 2007 – 2011 was formulated<br />
by<br />
the <strong>Ministry</strong> <strong>of</strong> <strong>Tourism</strong><br />
<strong>Arts</strong> and <strong>Culture</strong> (MOTAC) under the direction<br />
<strong>of</strong> a Project Steering Committee,<br />
comprising 14<br />
Government Ministries. Following a change in the government administration, the <strong>Ministry</strong> <strong>of</strong><br />
<strong>Tourism</strong> initiated a review<br />
<strong>of</strong> strategic<br />
actions formulated in the TTMP with the objective <strong>of</strong> extending the<br />
Mater Plan’s strategies up to end <strong>of</strong> 2013.<br />
The prime objective <strong>of</strong> reviewing the TTMP was to:<br />
• Assess the extent <strong>of</strong> the implementation <strong>of</strong> the Third <strong>Tourism</strong> Master Plan (2007 - 2011) , Evaluate<br />
and review the proposed policies and strategies <strong>of</strong> the<br />
Plan, against changes in the political, social,<br />
economic, institutional and legislative environments over the period.<br />
• Formulate a two year extension on the Third <strong>Tourism</strong> Master Plan until 2013, consisting <strong>of</strong> a<br />
Situation Analysis, the Master<br />
Plan and the<br />
Implementation<br />
The review process started<br />
with the analysis <strong>of</strong> the stated strategic actions<br />
stated in the TTMP, followed by<br />
regular discussion meetings held with<br />
MOTAC as the review<br />
process progressed. Further to this, several<br />
stakeholder meetings were held to understand the level <strong>of</strong> implementation <strong>of</strong> the strategic actions in the<br />
TTMP, and the feedback from these discussions was duly noted. The reviewed document is available for<br />
download from<br />
the website <strong>of</strong> <strong>Ministry</strong><br />
<strong>of</strong> <strong>Tourism</strong>, <strong>Arts</strong> and <strong>Culture</strong>.<br />
46<br />
| Page
[Type<br />
the document title]<br />
Conference / Seminars<br />
23<br />
rd Joint Meeting <strong>of</strong> the UNWTO Commission for Asia and UNWTO<br />
Conference on Mainstreaming <strong>Tourism</strong> and the Media<br />
The World <strong>Tourism</strong> Organization (UNWTO) 23 rd Joint meeting <strong>of</strong> the UNWTO Commission for Asia and<br />
UNWTO Conference on Mainstreaming <strong>Tourism</strong> and the Media, was held from 24-27 March 2011in Colombo<br />
Sri Lanka. The Maldives was represented by the<br />
then Minister <strong>of</strong> <strong>Tourism</strong>, <strong>Arts</strong> and<br />
<strong>Culture</strong>, Dr. Mariyam<br />
Zulfa and the<br />
Deputy Director General <strong>of</strong> the <strong>Ministry</strong> <strong>of</strong> <strong>Tourism</strong>, <strong>Arts</strong> and <strong>Culture</strong>, Mr. Moosa Zameer<br />
Hassan.<br />
During the conference period, bilateral meetings were held between Hon. Dr. Mariyam<br />
Zulfa and counterpart<br />
tourism ministers, including Hon. Basil Rajapaksa, the Minister <strong>of</strong> Economic Development <strong>of</strong> Sri Lanka.<br />
19 th General Assembly <strong>of</strong> the UNWTO<br />
The World <strong>Tourism</strong> Organization (UNWTO) 19 th<br />
General Assembly, was<br />
held from 10-14 October 2011 in<br />
Korea. The Maldives was<br />
represented<br />
by the then<br />
Minister <strong>of</strong><br />
<strong>Tourism</strong>, <strong>Arts</strong> and <strong>Culture</strong>, Dr. Mariyam Zulfa<br />
and the Deputy Director General <strong>of</strong> the <strong>Ministry</strong> <strong>of</strong> <strong>Tourism</strong>, <strong>Arts</strong> and <strong>Culture</strong>, Mr. Moosa Zameer Hassan.<br />
Following the<br />
general assembly and the South Asia Commission meeting,<br />
the Maldives proposed to host the<br />
2013 <strong>of</strong>ficial World <strong>Tourism</strong> Day in the Maldives and was successfully endorsed.<br />
Staff Training<br />
Overseas<br />
Training Program for Young<br />
Leaders 2010, Vocational<br />
Training<br />
Education Course<br />
The training program for Young Leaders 2010, Vocational Training Education was held from 22 February to<br />
111 March 2011 in Japan. Mr. Ghaly Murthala, Assistant Director, Ms. Azma Najeeb Para Legal Assistant,<br />
Ms. Fareesha Haneef, Assistant Planning Officer and Ms. Dheena Shareef, Assistant Human Resource<br />
Officer took part in this training course.<br />
5<br />
th UNWTO Asia Pacific Executive Training Program<br />
The 5 th UNWTO Asia/Pacific Executive Training<br />
Program was held in Brunei from 12 th to 16 th June 2011.<br />
Permanent Secretary <strong>of</strong> <strong>Ministry</strong> <strong>of</strong> <strong>Tourism</strong>, <strong>Arts</strong><br />
and <strong>Culture</strong><br />
Mr. Ahmed<br />
Solih participated in this training<br />
program.<br />
Malta Commonwealth Third<br />
Country<br />
Training<br />
Program<br />
– Management <strong>of</strong> Coastal<br />
Recreation<br />
Resources<br />
The Malta-Commonwealth Third Country Training Programme - Management <strong>of</strong> Coastal Recreation<br />
Resources was held in Malta from<br />
4 th<br />
participated in<br />
this training.<br />
to 14 April. Ms. Jimzeena<br />
Musthafa, Environment Analyst<br />
47<br />
| Page
[Type<br />
the document title]<br />
Marketing & Promotional Activities<br />
Maldives Participates in ITB<br />
2011<br />
The Maldives<br />
was represented at the 45 th International <strong>Tourism</strong> Bourse (ITB) held<br />
in Berlin, Germany<br />
from 09 – 13 March 2011.The then Minister <strong>of</strong> <strong>Tourism</strong>, <strong>Arts</strong> & <strong>Culture</strong>, Dr. Mariyam<br />
Zulfa together with<br />
then Managing Director <strong>of</strong> Maldives Marketing and Public Relations Corporation (MMPRC), Mr. Simon<br />
Hawkins led the delegation<br />
from the Maldives.<br />
ITB Berlin is the B2B-Platform <strong>of</strong> alll tourism industry <strong>of</strong>fers with all levels <strong>of</strong> the industry including tour<br />
operators, booking engines, destinations, airlines, and hotels<br />
right through to car rental companies. In<br />
addition, the world’s largest tourism convention Market<br />
Trends & Innovations provides<br />
unique<br />
opportunities to benefit from the global tourism industry.<br />
During the event, the Hon. Minister held interviews and meetings with the<br />
major German tour operators as<br />
well as Airlines and media. The minister also participated at the panel on<br />
climate change convention and<br />
presented a paper about<br />
the Maldives. Further, Dr. Zulfa gave information about the investment<br />
opportunities<br />
and government policies regarding the foreign investment in the Maldives.<br />
Maldives Participates in ATM Dubai<br />
The Maldives Marketing and Public Relations Corporation (MMPRC) participated in the 18 th Arabian Travel<br />
Market (ATM) which was<br />
held from 2 nd to 5 th May 2011 at Dubai International Convention and Exhibition<br />
Centre, Dubai. The Maldives delegation, comprising <strong>of</strong> 77 members, was led by the then Managingg Director<br />
<strong>of</strong><br />
MMPRC, Mr. Simon Hawkins.<br />
ATM, the largest trade and consumer travel show in the Gulf region, serves as an ideal platform for<br />
Maldivian suppliers and relevant agencies to establish marketing networks<br />
with their United Arab<br />
Emirates<br />
(UAE) and Middle East counterparts.<br />
Maldives wins Travel Agents Choice<br />
Award at World Travel Market 2011<br />
The Maldives Marketing & Public Relations Corporation and representativ<br />
ves from Maldives tourism<br />
industry<br />
participated in<br />
one <strong>of</strong> the biggest travel trade event, the 32nd<br />
World Travel Market (WTM) thatt was held<br />
from 7 to 10 November 2011 at ExCeL<br />
London.<br />
The Maldivian delegation<br />
led by the then Chairman, Mr. Thoyyib Mohamed Waheed and Managing<br />
Director, Mr. Simon Hawkins, <strong>of</strong> the Maldives Marketing & Public Relations Corporation (MMPRC);<br />
comprises 1711 participants<br />
from 70 organizations.<br />
WTM, the second largest travel trade exhibition<br />
after ITB<br />
Berlin, servess as an ideal platform for Maldivian suppliers and relevant agencies to establish marketing<br />
networks with<br />
their United<br />
Kingdom ( UK) and European counterparts.<br />
During the event, the Maldives received the award for “Long Haul Destination <strong>of</strong> the year for Romance”, the<br />
reader’s choice award conducted by Selling Long Haul Magazine.<br />
48<br />
| Page
[Type<br />
the document title]<br />
Other Promotional Activities<br />
Fairs & Exhibition<br />
List 20111<br />
Name <strong>of</strong> Fair<br />
City/Country<br />
Venue<br />
Dates<br />
Type <strong>of</strong> Fair<br />
1<br />
FITUR<br />
Madrid, Spain<br />
Parque Ferial Juan Carlos 1, 28042 Madrid, Apdo. De Correos 67.067,<br />
Spain<br />
(www.fituronlin ne.com)<br />
19<br />
- 23 Jan Trade & Consumer<br />
2<br />
BOOT<br />
Dusseldorf,<br />
Germany<br />
Messe Dusseldo orf GmbH, D-40001 Dusseldorf, Germany<br />
(www.boot.de)<br />
222 - 30 Jan<br />
Dive<br />
3<br />
SATTE<br />
New Delhi,<br />
India<br />
Hall 8-12A, Pragati Maidan, New<br />
Delhi<br />
(www.satte.org)<br />
27<br />
- 29 Jan Trade & Consumer<br />
4<br />
BIT<br />
Milan, Italy<br />
Expo cts via G. Govone, 66 - 20155 Milan, Italy<br />
(www.expocts. it/bit)<br />
17<br />
- 20 Feb Trade & Consumer<br />
5<br />
ITB<br />
Berlin,<br />
Germany<br />
Messe Berlin GmbH, Messedammm 22, D-14055 Berlin, Germany<br />
(www.itb-berlin.de)<br />
9 - 13 Mar Trade & Consumer<br />
6 MITT<br />
8 ATM<br />
Moscow,<br />
Russia<br />
Dubai, U.A.E<br />
Krasnaya Presnya Exhibition Complex, ZAO Expocentre, Moscow,<br />
Russia<br />
(www.mitt-mos cow.com)<br />
Dubai International Convention & Exhibition Centre, Sheikh Zayed<br />
Road, Dubai, United Arab Emirates<br />
(www.arabiantravelmarket.com)<br />
16 - 19 Mar Trade & Consumer<br />
2 - 5 May Trade & Consumer<br />
8<br />
BITE<br />
Beijing, China<br />
China National Convention Centre, 7 Tiancheng East Road, Chaoyang<br />
District, Beijing<br />
100105, China<br />
(www.bitechina.com.cn)<br />
17 - 19 June Trade & Consumer<br />
9<br />
DRT Expo<br />
Hong Kong<br />
Hong Kong Exhibition Centre (China Resourcess Building)<br />
3F, Low Block, China Resources Building, 26 Harbour Road, Wanchai, 8 - 10 July 2011 Dive & Liveaboard<br />
Hong Kong (www.divingandresorttravelexpo.com)<br />
10<br />
Top Resa<br />
Paris, France<br />
Paris Porte de Versailles Exhibition Centre, 75015 Paris, France<br />
(www.iftm.fr)<br />
20<br />
- 23 Sep<br />
Trade<br />
11<br />
JATA WTF<br />
Tokyo, Japan<br />
Tokyo International Exhibition Center, 3-21-1 Ariake, Koto-ku,<br />
Tokyo 135-0063, Japan<br />
(www.jata-wtf.com/en)<br />
29 Sep - 2 Oct<br />
Trade & Consumer<br />
12<br />
TTG Incontri<br />
Rimini, Italy<br />
TTG Italia S.p.A<br />
- RIMINI FIERA -Via Emilia, 1555 - 47900 Rimini, Italy<br />
(www.ttgitalia.com/ttgincontri)<br />
6 - 8 October<br />
Trade<br />
13<br />
CITM<br />
Kunming,<br />
China<br />
Kunming International Convention & Exhibition Center, Kunming,<br />
China<br />
(www.citm.com.cn)<br />
27 - 30 Oct Trade & Consumer<br />
49<br />
| Page