the Australian wine industry - Land and Water Australia
the Australian wine industry - Land and Water Australia
the Australian wine industry - Land and Water Australia

Create successful ePaper yourself
Turn your PDF publications into a flip-book with our unique Google optimized e-Paper software.
Signposts<br />
for <strong><strong>Australia</strong>n</strong><br />
Agriculture<br />
The <strong><strong>Australia</strong>n</strong> <strong>wine</strong> <strong>industry</strong><br />
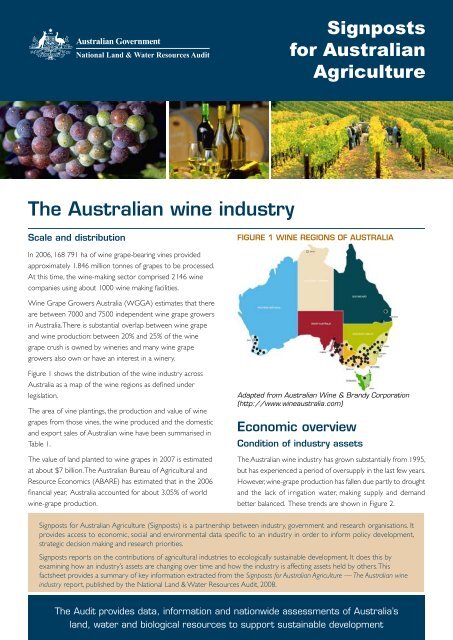
Scale <strong>and</strong> distribution<br />
Figure 1 Wine regions of <strong>Australia</strong><br />
In 2006, 168 791 ha of <strong>wine</strong> grape-bearing vines provided<br />
approximately 1.846 million tonnes of grapes to be processed.<br />
At this time, <strong>the</strong> <strong>wine</strong>-making sector comprised 2146 <strong>wine</strong><br />
companies using about 1000 <strong>wine</strong> making facilities.<br />
Wine Grape Growers <strong>Australia</strong> (WGGA) estimates that <strong>the</strong>re<br />
are between 7000 <strong>and</strong> 7500 independent <strong>wine</strong> grape growers<br />
in <strong>Australia</strong>. There is substantial overlap between <strong>wine</strong> grape<br />
<strong>and</strong> <strong>wine</strong> production: between 20% <strong>and</strong> 25% of <strong>the</strong> <strong>wine</strong><br />
grape crush is owned by <strong>wine</strong>ries <strong>and</strong> many <strong>wine</strong> grape<br />
growers also own or have an interest in a <strong>wine</strong>ry.<br />
Figure 1 shows <strong>the</strong> distribution of <strong>the</strong> <strong>wine</strong> <strong>industry</strong> across<br />
<strong>Australia</strong> as a map of <strong>the</strong> <strong>wine</strong> regions as defined under<br />
legislation.<br />
The area of vine plantings, <strong>the</strong> production <strong>and</strong> value of <strong>wine</strong><br />
grapes from those vines, <strong>the</strong> <strong>wine</strong> produced <strong>and</strong> <strong>the</strong> domestic<br />
<strong>and</strong> export sales of <strong><strong>Australia</strong>n</strong> <strong>wine</strong> have been summarised in<br />
Table 1.<br />
The value of l<strong>and</strong> planted to <strong>wine</strong> grapes in 2007 is estimated<br />
at about $7 billion. The <strong><strong>Australia</strong>n</strong> Bureau of Agricultural <strong>and</strong><br />
Resource Economics (ABARE) has estimated that in <strong>the</strong> 2006<br />
financial year, <strong>Australia</strong> accounted for about 3.05% of world<br />
<strong>wine</strong>-grape production.<br />
Adapted from <strong><strong>Australia</strong>n</strong> Wine & Br<strong>and</strong>y Corporation<br />
(http://www.<strong>wine</strong>australia.com)<br />
Economic overview<br />
Condition of <strong>industry</strong> assets<br />
The <strong><strong>Australia</strong>n</strong> <strong>wine</strong> <strong>industry</strong> has grown substantially from 1995,<br />
but has experienced a period of oversupply in <strong>the</strong> last few years.<br />
However, <strong>wine</strong>-grape production has fallen due partly to drought<br />
<strong>and</strong> <strong>the</strong> lack of irrigation water, making supply <strong>and</strong> dem<strong>and</strong><br />
better balanced. These trends are shown in Figure 2.<br />
Signposts for <strong><strong>Australia</strong>n</strong> Agriculture (Signposts) is a partnership between <strong>industry</strong>, government <strong>and</strong> research organisations. It<br />
provides access to economic, social <strong>and</strong> environmental data specific to an <strong>industry</strong> in order to inform policy development,<br />
strategic decision making <strong>and</strong> research priorities.<br />
Signposts reports on <strong>the</strong> contributions of agricultural industries to ecologically sustainable development. It does this by<br />
examining how an <strong>industry</strong>’s assets are changing over time <strong>and</strong> how <strong>the</strong> <strong>industry</strong> is affecting assets held by o<strong>the</strong>rs. This<br />
factsheet provides a summary of key information extracted from <strong>the</strong> Signposts for <strong><strong>Australia</strong>n</strong> Agriculture — The <strong><strong>Australia</strong>n</strong> <strong>wine</strong><br />
<strong>industry</strong> report, published by <strong>the</strong> National <strong>L<strong>and</strong></strong> & <strong>Water</strong> Resources Audit, 2008.<br />
The Audit provides data, information <strong>and</strong> nationwide assessments of <strong>Australia</strong>’s<br />
l<strong>and</strong>, water <strong>and</strong> biological resources to support sustainable development
Impact of <strong>the</strong> <strong>industry</strong> on assets held by<br />
o<strong>the</strong>rs<br />
ABARE estimated that <strong>Australia</strong> is <strong>the</strong> world’s sixth-largest<br />
<strong>wine</strong> producer <strong>and</strong> fourth-largest <strong>wine</strong> exporter. In <strong>the</strong> 2007<br />
financial year, <strong>the</strong> value of exports of <strong>wine</strong> was more than that<br />
for dairy, about <strong>the</strong> same as that for wheat <strong>and</strong> wool, <strong>and</strong><br />
substantially less than that for beef <strong>and</strong> veal.<br />
The gross value of production of <strong>wine</strong> grapes is one indicator<br />
of <strong>the</strong> contribution to national income of <strong>the</strong> <strong>wine</strong> <strong>industry</strong><br />
<strong>and</strong> a fur<strong>the</strong>r indicator is <strong>the</strong> export sales of <strong>wine</strong>. These are<br />
shown in Figures 3 <strong>and</strong> 4, respectively.<br />
The key economic issues relating to <strong>the</strong> contribution of <strong>the</strong><br />
<strong>wine</strong> <strong>industry</strong> to ecologically sustainable development are <strong>the</strong><br />
extent to which increasing <strong>industry</strong> wealth relies on:<br />
Figure 2 Wine grape production <strong>and</strong> <strong>wine</strong><br />
sales (disposals) by year<br />
2 0 0 0<br />
1 8 0 0<br />
1 6 0 0<br />
1 4 0 0<br />
1 2 0 0<br />
1 0 0 0<br />
8 0 0<br />
6 0 0<br />
Disposals ('000L); Production (t)<br />
4 0 0<br />
2 0 0<br />
0<br />
W ine dis pos als ('000L)<br />
W ine grape produc tion (t)<br />
1 9 9 5 1 9 9 6 1 9 9 7 1 9 9 8 1 9 9 9 2 0 0 0 2 0 0 1 2 0 0 2 2 0 0 3 2 0 0 4 2 0 0 5 2 0 0 6 2 0 0 7<br />
Source: Catalogue 1329.0 (ABS, various years)<br />
• <strong>the</strong> growth of exports<br />
• productivity increases based on research <strong>and</strong> development,<br />
<strong>and</strong> innovation.<br />
Environmental overview<br />
Condition of <strong>industry</strong> assets<br />
Industry environmental assets include <strong>the</strong> soil <strong>and</strong> genetic<br />
resources required for production of grapes, <strong>and</strong> <strong>the</strong> biota that<br />
affect production. Phosphorus <strong>and</strong> nitrogen in <strong>the</strong> soil supply<br />
about one-third <strong>and</strong> one-half, respectively, of vine<br />
requirements, leaving <strong>the</strong> remainder to be supplied by fertiliser<br />
application. Biota that affects grape production includes pests,<br />
weeds <strong>and</strong> disease that can degrade <strong>the</strong> value of <strong>industry</strong><br />
assets.<br />
Figure 3 Gross value of <strong>wine</strong> grape<br />
production (year ending 30 June)<br />
Table 1 <strong><strong>Australia</strong>n</strong> <strong>wine</strong> <strong>industry</strong> — plantings, production <strong>and</strong> sales<br />
1 600<br />
1 400<br />
1 200<br />
1 000<br />
800<br />
$ million 600<br />
400<br />
200<br />
0<br />
2003 2004 2005 2006 2007<br />
Source: <strong><strong>Australia</strong>n</strong> Bureau of Agricultural <strong>and</strong> Resource<br />
Economics (2007), <strong><strong>Australia</strong>n</strong> Commodities 14(4).<br />
Year<br />
Area of<br />
bearing<br />
vines (ha)<br />
Grape<br />
production<br />
for <strong>wine</strong> (t)<br />
Gross value<br />
of<br />
production,<br />
<strong>wine</strong> grapes<br />
($m)<br />
Wine<br />
(beverage)<br />
production<br />
(ML)<br />
Domestic<br />
sales (ML<br />
[$m])<br />
2003 142 793 1 329 595 1143 1 037.6 402.5<br />
(2097.9)<br />
2004 150 561 1 816 556 1491 1 401.0 417.4<br />
(1970.9)<br />
2005 153 204 1 818 426 1385 1 420.3 430.1<br />
(2097.4)<br />
2006 158 167 1 781 668 1141 1 410.5 432.4<br />
(1899.9)<br />
2007 163 951 1 370 690 828 955.0 449.2<br />
(2004.9)<br />
Exports (ML<br />
[$m])<br />
518.6<br />
(2423.5)<br />
584.4<br />
(2494.0)<br />
669.7<br />
(2715.3)<br />
722.0<br />
(2756.5)<br />
787.2<br />
(2878.6)<br />
Total sales (ML<br />
[$m])<br />
921.1<br />
(4521.4)<br />
1001.8<br />
(4464.9)<br />
1099.8<br />
(4812.7)<br />
1154.4<br />
(4656.4)<br />
1236.4<br />
(4883.5)<br />
ha = hectare; ML = megalitres; t = tonne<br />
Source: <strong><strong>Australia</strong>n</strong> Bureau of Statistics catalogue no. 1329.0 (2007), except gross value of production, <strong>wine</strong> grapes, which was<br />
extracted from <strong><strong>Australia</strong>n</strong> Bureau of Agricultural <strong>and</strong> Resource Economics (2007), <strong><strong>Australia</strong>n</strong> Commodities 14(4).<br />
Banner images on first page courtesy of DAFF
Figure 4 Export sales of <strong>wine</strong> free on<br />
board<br />
3 000<br />
2 900<br />
2 800<br />
2 700<br />
2 600<br />
2 500<br />
$ million<br />
2 400<br />
2 300<br />
2 200<br />
2 100<br />
2003 2004 2005 2006 2007<br />
Source: <strong><strong>Australia</strong>n</strong> Bureau of Agricultural <strong>and</strong> Resource<br />
Economics (2007), <strong><strong>Australia</strong>n</strong> Commodities 14(4).<br />
The grape <strong>industry</strong> has addressed pest, weed <strong>and</strong> disease<br />
management under integrated pest management (IPM). IPM<br />
provisions are now incorporated in almost all <strong>wine</strong>ry contracts<br />
for grape supply. This has resulted in major improvements in<br />
pest weed <strong>and</strong> disease management, resulting in substantial<br />
reductions in chemical use.<br />
Impact of <strong>the</strong> <strong>industry</strong> on assets held by<br />
o<strong>the</strong>rs<br />
<strong>Water</strong> use is a major ecologically sustainable development<br />
issue for <strong>the</strong> <strong>wine</strong> <strong>industry</strong>. Consequently, improved water use<br />
has been a focus for <strong>the</strong> <strong>industry</strong>. The most current example is<br />
<strong>the</strong> WFA’s <strong><strong>Australia</strong>n</strong> Wine Industry Stewardship (AWIS). The<br />
first <strong>industry</strong>-wide AWIS 2007 vintage survey reported<br />
responses representing approximately 70% of <strong>the</strong> national<br />
grape crush. Selected responses regarding irrigation best<br />
management practices are shown in Table 2.<br />
While <strong>the</strong> area under grape vines in South <strong>Australia</strong> represents<br />
42.8% of <strong>the</strong> national area, it uses only 28.4% of <strong>the</strong> <strong>industry</strong><br />
water. In contrast, <strong>the</strong> Victorian grape vine-growing area<br />
represents 23.3% of <strong>the</strong> national area, but consumes 44.7% of<br />
<strong>the</strong> amount of water extracted for grapes nationally. In New<br />
South Wales, <strong>the</strong> proportion of area under grapes <strong>and</strong><br />
proportion of <strong>industry</strong> water consumption are roughly<br />
equivalent.<br />
Table 2 percentage of Growers using<br />
best management practice (BMP)<br />
Management practice<br />
Growers<br />
using<br />
BMP (%)<br />
Maintain ground cover in vineyard mid-row 83<br />
Monitor soil moisture to schedule irrigation 69<br />
Use drip irrigation 62<br />
Use soil or petiole analysis to plan fertiliser<br />
applications<br />
Participate in natural resource management<br />
information workshops<br />
56<br />
44<br />
Source: Russell A (2007). AWIS results highlight key<br />
environmental issues. The <strong><strong>Australia</strong>n</strong> <strong>and</strong> New Zeal<strong>and</strong><br />
Grapegrower <strong>and</strong> Winemaker, October 2007, 11–13.<br />
irrigation — than New South Wales or Victoria. However,<br />
<strong>the</strong>se percentages are also likely to be influenced by <strong>the</strong><br />
location of <strong>the</strong> vineyards in respect to rainfall <strong>and</strong> relative<br />
dem<strong>and</strong> on irrigation supplies.<br />
Policy <strong>and</strong> management responses<br />
The major <strong>industry</strong> initiative, sponsored by <strong>the</strong> WFA <strong>and</strong><br />
overseen by Wine Industry National Environment Committee<br />
(WINEC), is AWIS, which started in 2005. An earlier initiative<br />
was a sustained program supported by government <strong>and</strong><br />
<strong>industry</strong> to improve environmental management by <strong>the</strong><br />
adoption of environmental management systems.<br />
Practices to improve <strong>the</strong> <strong>industry</strong>’s contribution to ecologically<br />
sustainable development include: irrigation management for<br />
improved water use efficiency; cover crop management;<br />
training for improved farm practices; improved management of<br />
plant nutrition; sustainable pest <strong>and</strong> disease management;<br />
precision viticulture; re-use of wastewater; group marketing;<br />
adoption of organic practices.<br />
A major determinant of water consumption is <strong>the</strong> type of<br />
irrigation system used — drip or microspray systems are <strong>the</strong><br />
most efficient in relation to evaporation <strong>and</strong> runoff losses.<br />
Table 3 shows that South <strong>Australia</strong> has a higher percentage of<br />
area under drip or microspray — <strong>the</strong> most efficient system of<br />
Dripper irrigation in vineyard. source:<br />
Scholefield Robinson Horticultural Services.
Table 3 Irrigation of grapevines — area <strong>and</strong> system used (2007)<br />
Total irrigated<br />
grapevines (ha)<br />
Total water use<br />
(ML)<br />
Spray, excluding<br />
microspray (ha [%])<br />
Drip or microspray (ha<br />
[%])<br />
Furrow or flood (ha<br />
[%])<br />
South <strong>Australia</strong> 68 081 186 880 10 886 (16.0) 58 034 (85.2) 929 (1.4)<br />
New South Wales 40 093 158 871 3149 (7.9) 29 241 (72.9) 8288 (20.7)<br />
Victoria 34 262 164 165 10 386 (30.3) 21 567 (62.9) 3109 (9.1)<br />
O<strong>the</strong>r state/territory 14 965 26 833 218 (1.5) 14 655 (97.9) 165 (1.1)<br />
Total 157 401 536 749 24 639 (15.7) 123 497 (78.5) 12 491 (7.9)<br />
Source: ABS(2008) 1<br />
Social overview<br />
Condition of <strong>industry</strong> assets<br />
Industry social assets include <strong>the</strong> capacity of <strong>the</strong> workforce,<br />
<strong>and</strong> <strong>the</strong> capacity of <strong>industry</strong> organisations <strong>and</strong> networks to<br />
support <strong>the</strong> <strong>industry</strong>. The workforce capacity is to a large<br />
degree determined by <strong>the</strong> level of education <strong>and</strong> skills in grape<br />
growing <strong>and</strong> <strong>wine</strong>making that its members posess. The <strong>industry</strong><br />
actively encourages its members to pursue lifelong learning<br />
<strong>and</strong> provides a number of educational <strong>and</strong> vocational training<br />
opportunities. These include:<br />
• WineSkills — a series of workshops that focus on<br />
practical advice on market, business <strong>and</strong> financial planning<br />
• <strong>Australia</strong>: world class — an online education platform<br />
designed to provide information on key issues in relation<br />
to <strong>the</strong> making, marketing <strong>and</strong> enjoyment of <strong>wine</strong><br />
• vocational training — training for grape growers <strong>and</strong><br />
<strong>wine</strong>makers offered by <strong>the</strong> National Wine <strong>and</strong> Grape<br />
Industry Centre (NWGIC).<br />
The major <strong>wine</strong> <strong>industry</strong> organisations are <strong>the</strong> Winemakers’<br />
Federation of <strong>Australia</strong> (WFA) <strong>and</strong> Wine Grape Growers<br />
<strong>Australia</strong> (WGGA). The major statutory organisations are <strong>the</strong><br />
<strong><strong>Australia</strong>n</strong> Wine <strong>and</strong> Br<strong>and</strong>y Corporation (AWBC) <strong>and</strong> <strong>the</strong><br />
Grape <strong>and</strong> Wine Research <strong>and</strong> Development Corporation<br />
(GWRDC). A task force of <strong>the</strong> chairs of <strong>the</strong> four national<br />
organisations is currently reviewing <strong>the</strong> <strong><strong>Australia</strong>n</strong> <strong>wine</strong><br />
<strong>industry</strong>’s national organisational structure. It published a<br />
consultation paper (in October 2007), which describes <strong>the</strong><br />
current structure <strong>and</strong> three possible approaches to change.<br />
There are also seven state associations <strong>and</strong> 88 regional<br />
<strong>industry</strong> organisations representing vignerons, <strong>wine</strong>makers <strong>and</strong><br />
<strong>wine</strong> grape growers. Membership at all levels is encouraged.<br />
Impact of <strong>the</strong> <strong>industry</strong> on assets held by<br />
o<strong>the</strong>rs<br />
A major social contribution of <strong>the</strong> <strong>wine</strong> <strong>industry</strong> is to public<br />
health. This refers to <strong>the</strong> effect of <strong>the</strong> consumption of <strong>wine</strong> on<br />
<strong>the</strong> health of <strong>the</strong> community. Wine is considered to have both<br />
negative <strong>and</strong> positive impacts on consumer health, due to its<br />
inherent attributes.<br />
The <strong>wine</strong> <strong>industry</strong> feels that this issue is a high priority <strong>and</strong> a<br />
specific policy has been developed by <strong>the</strong> WFA, <strong>and</strong> <strong>the</strong><br />
<strong><strong>Australia</strong>n</strong> Wine Research Institute AWRI Technical Review has<br />
a specific section in each issue about <strong>wine</strong> <strong>and</strong> health.<br />
The <strong>wine</strong> <strong>industry</strong> also contributes socially by providing<br />
employment. Table 4 summarises <strong>the</strong> results of <strong>the</strong> 2001 <strong>and</strong><br />
2006 censuses as <strong>the</strong>y relate to <strong>wine</strong> <strong>industry</strong> employment<br />
(excluding casual <strong>and</strong> seasonal workers, <strong>and</strong> those who<br />
worked in <strong>wine</strong> <strong>and</strong> grape production as a second job).<br />
The reduction in those employed in grape growing is<br />
consistent with reduced plantings in <strong>the</strong> past few years, but is<br />
partially offset by <strong>the</strong> employment growth in <strong>wine</strong><br />
manufacturing.<br />
Table 4 Employment in grape growing<br />
<strong>and</strong> <strong>wine</strong> manufacturing (2001 <strong>and</strong> 2006)<br />
2001 (% total 2006 Change<br />
agriculture)<br />
Grape growing 15 629 (5.41%) 11 003 –29.6%<br />
Wine<br />
manufacturing<br />
Sources: ABS (2008) 1<br />
14 480 (5.04%) 16 956 17.1%<br />
1 ABS (<strong><strong>Australia</strong>n</strong> Bureau of Statistics) (2008). 1329.0 <strong><strong>Australia</strong>n</strong> Wine <strong>and</strong><br />
Grape Industry, 2007, ABS, Canberra.<br />
Product Number: PN21914<br />
Phone: (02) 6263 6000 • Email: info@nlwra.gov.au • Web: www.nlwra.gov.au<br />
86 Northbourne Avenue, Braddon ACT 2612 • GPO Box 2182, Canberra ACT 2601