Effects of solar UV radiation on diurnal photosynthetic performance ...
Effects of solar UV radiation on diurnal photosynthetic performance ...
Effects of solar UV radiation on diurnal photosynthetic performance ...

Create successful ePaper yourself
Turn your PDF publications into a flip-book with our unique Google optimized e-Paper software.
<str<strong>on</strong>g>Effects</str<strong>on</strong>g> <str<strong>on</strong>g>of</str<strong>on</strong>g> <str<strong>on</strong>g>UV</str<strong>on</strong>g> <str<strong>on</strong>g>radiati<strong>on</strong></str<strong>on</strong>g> <strong>on</strong> Gracilaria <strong>diurnal</strong> photosynthesis 299<br />
with negligible reflecti<strong>on</strong> have been published elsewhere<br />
(Korbee-Peinado et al., 2004). The uncovered quartz<br />
tubes received 4% higher PAR <str<strong>on</strong>g>radiati<strong>on</strong></str<strong>on</strong>g> (measured by<br />
inserting a PAR sensor inside the quartz c<strong>on</strong>tainer)<br />
compared with the covered tubes with the 395 or 320<br />
filters due to the reflecti<strong>on</strong> (in water) caused by these<br />
filters.<br />
Seawater<br />
Flowmeter<br />
PAR+<str<strong>on</strong>g>UV</str<strong>on</strong>g>−A+<str<strong>on</strong>g>UV</str<strong>on</strong>g>−B<br />
PAR+<str<strong>on</strong>g>UV</str<strong>on</strong>g>−A<br />
PAR<br />
Quartz tube<br />
Oxygen m<strong>on</strong>itor<br />
Downloaded By: [Xiamen University] At: 11:35 26 February 2009<br />
Diurnal photosynthesis measurement<br />
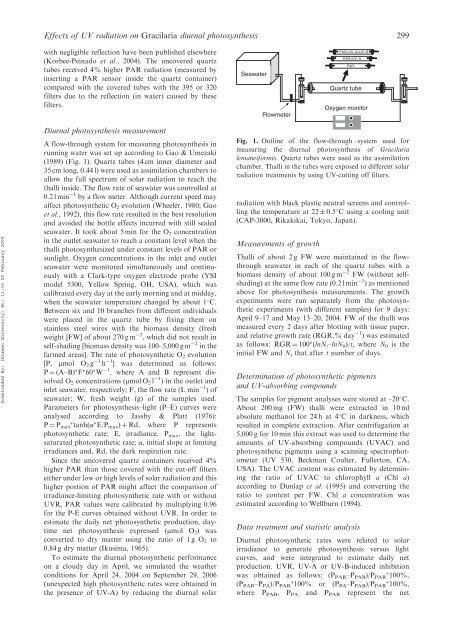
A flow-through system for measuring photosynthesis in<br />
running water was set up according to Gao & Umezaki<br />
(1989) (Fig. 1). Quartz tubes (4 cm inner diameter and<br />
35 cm l<strong>on</strong>g, 0.44 l) were used as assimilati<strong>on</strong> chambers to<br />
allow the full spectrum <str<strong>on</strong>g>of</str<strong>on</strong>g> <str<strong>on</strong>g>solar</str<strong>on</strong>g> <str<strong>on</strong>g>radiati<strong>on</strong></str<strong>on</strong>g> to reach the<br />
thalli inside. The flow rate <str<strong>on</strong>g>of</str<strong>on</strong>g> seawater was c<strong>on</strong>trolled at<br />
0.2 l min 1 by a flow meter. Although current speed may<br />
affect <strong>photosynthetic</strong> O 2 evoluti<strong>on</strong> (Wheeler, 1980; Gao<br />
et al., 1992), this flow rate resulted in the best resoluti<strong>on</strong><br />
and avoided the bottle effects incurred with still sealed<br />
seawater. It took about 5 min for the O 2 c<strong>on</strong>centrati<strong>on</strong><br />
in the outlet seawater to reach a c<strong>on</strong>stant level when the<br />
thalli photosynthesized under c<strong>on</strong>stant levels <str<strong>on</strong>g>of</str<strong>on</strong>g> PAR or<br />
sunlight. Oxygen c<strong>on</strong>centrati<strong>on</strong>s in the inlet and outlet<br />
seawater were m<strong>on</strong>itored simultaneously and c<strong>on</strong>tinuously<br />
with a Clark-type oxygen electrode probe (YSI<br />
model 5300, Yellow Spring, OH, USA), which was<br />
calibrated every day at the early morning and at midday,<br />
when the seawater temperature changed by about 1 C.<br />
Between six and 10 branches from different individuals<br />
were placed in the quartz tube by fixing them <strong>on</strong><br />
stainless steel wires with the biomass density (fresh<br />
weight [FW] <str<strong>on</strong>g>of</str<strong>on</strong>g> about 270 g m 2 , which did not result in<br />
self-shading [biomass density was 100–5,000 g m 2 in the<br />
farmed areas]. The rate <str<strong>on</strong>g>of</str<strong>on</strong>g> <strong>photosynthetic</strong> O 2 evoluti<strong>on</strong><br />
[P, mmol O 2 g 1 h 1 ] was determined as follows:<br />
P ¼ (A–B) F 60 W 1 , where A and B represent dissolved<br />
O 2 c<strong>on</strong>centrati<strong>on</strong>s (mmol O 2 l<br />
1 ) in the outlet and<br />
inlet seawater, respectively; F, the flow rate (L min 1 )<str<strong>on</strong>g>of</str<strong>on</strong>g><br />
seawater; W, fresh weight (g) <str<strong>on</strong>g>of</str<strong>on</strong>g> the samples used.<br />
Parameters for photosynthesis–light (P–E) curves were<br />
analysed according to Jassby & Platt (1976):<br />
P ¼ P max tanh( E/P max ) þ Rd, where P represents<br />
<strong>photosynthetic</strong> rate; E, irradiance, P max , the lightsaturated<br />
<strong>photosynthetic</strong> rate; , initial slope at limiting<br />
irradiances and, Rd, the dark respirati<strong>on</strong> rate.<br />
Since the uncovered quartz c<strong>on</strong>tainers received 4%<br />
higher PAR than those covered with the cut-<str<strong>on</strong>g>of</str<strong>on</strong>g>f filters<br />
either under low or high levels <str<strong>on</strong>g>of</str<strong>on</strong>g> <str<strong>on</strong>g>solar</str<strong>on</strong>g> <str<strong>on</strong>g>radiati<strong>on</strong></str<strong>on</strong>g> and this<br />
higher porti<strong>on</strong> <str<strong>on</strong>g>of</str<strong>on</strong>g> PAR might affect the comparis<strong>on</strong> <str<strong>on</strong>g>of</str<strong>on</strong>g><br />
irradiance-limiting <strong>photosynthetic</strong> rate with or without<br />
<str<strong>on</strong>g>UV</str<strong>on</strong>g>R, PAR values were calibrated by multiplying 0.96<br />
for the P-E curves obtained without <str<strong>on</strong>g>UV</str<strong>on</strong>g>R. In order to<br />
estimate the daily net <strong>photosynthetic</strong> producti<strong>on</strong>, daytime<br />
net photosynthesis expressed (mmol O 2 ) was<br />
c<strong>on</strong>verted to dry matter using the ratio <str<strong>on</strong>g>of</str<strong>on</strong>g> 1 g O 2 to<br />
0.84 g dry matter (Ikusima, 1965).<br />
To estimate the <strong>diurnal</strong> <strong>photosynthetic</strong> <strong>performance</strong><br />
<strong>on</strong> a cloudy day in April, we simulated the weather<br />
c<strong>on</strong>diti<strong>on</strong>s for April 24, 2004 <strong>on</strong> September 29, 2006<br />
(unexpected high <strong>photosynthetic</strong> rates were obtained in<br />
the presence <str<strong>on</strong>g>of</str<strong>on</strong>g> <str<strong>on</strong>g>UV</str<strong>on</strong>g>-A) by reducing the <strong>diurnal</strong> <str<strong>on</strong>g>solar</str<strong>on</strong>g><br />
Fig. 1. Outline <str<strong>on</strong>g>of</str<strong>on</strong>g> the flow-through system used for<br />
measuring the <strong>diurnal</strong> photosynthesis <str<strong>on</strong>g>of</str<strong>on</strong>g> Gracilaria<br />
lemaneiformis. Quartz tubes were used as the assimilati<strong>on</strong><br />
chamber. Thalli in the tubes were exposed to different <str<strong>on</strong>g>solar</str<strong>on</strong>g><br />
<str<strong>on</strong>g>radiati<strong>on</strong></str<strong>on</strong>g> treatments by using <str<strong>on</strong>g>UV</str<strong>on</strong>g>-cutting <str<strong>on</strong>g>of</str<strong>on</strong>g>f filters.<br />
<str<strong>on</strong>g>radiati<strong>on</strong></str<strong>on</strong>g> with black plastic neutral screens and c<strong>on</strong>trolling<br />
the temperature at 22 0.5 C using a cooling unit<br />
(CAP-3000, Rikakikai, Tokyo, Japan).<br />
Measurements <str<strong>on</strong>g>of</str<strong>on</strong>g> growth<br />
Thalli <str<strong>on</strong>g>of</str<strong>on</strong>g> about 2 g FW were maintained in the flowthrough<br />
seawater in each <str<strong>on</strong>g>of</str<strong>on</strong>g> the quartz tubes with a<br />
biomass density <str<strong>on</strong>g>of</str<strong>on</strong>g> about 100 g m 2 FW (without selfshading)<br />
at the same flow rate (0.2 l min 1 ) as menti<strong>on</strong>ed<br />
above for photosynthesis measurements. The growth<br />
experiments were run separately from the <strong>photosynthetic</strong><br />
experiments (with different samples) for 9 days:<br />
April 9–17 and May 13–20, 2004. FW <str<strong>on</strong>g>of</str<strong>on</strong>g> the thalli was<br />
measured every 2 days after blotting with tissue paper,<br />
and relative growth rate (RGR,% day 1 ) was estimated<br />
as follows: RGR ¼ 100 (lnN t –lnN 0 )/t, where N 0 is the<br />
initial FW and N t that after t number <str<strong>on</strong>g>of</str<strong>on</strong>g> days.<br />
Determinati<strong>on</strong> <str<strong>on</strong>g>of</str<strong>on</strong>g> <strong>photosynthetic</strong> pigments<br />
and <str<strong>on</strong>g>UV</str<strong>on</strong>g>-absorbing compounds<br />
The samples for pigment analyses were stored at –20 C.<br />
About 200 mg (FW) thalli were extracted in 10 ml<br />
absolute methanol for 24 h at 4 C in darkness, which<br />
resulted in complete extracti<strong>on</strong>. After centrifugati<strong>on</strong> at<br />
5,000 g for 10 min this extract was used to determine the<br />
amounts <str<strong>on</strong>g>of</str<strong>on</strong>g> <str<strong>on</strong>g>UV</str<strong>on</strong>g>-absorbing compounds (<str<strong>on</strong>g>UV</str<strong>on</strong>g>AC) and<br />
<strong>photosynthetic</strong> pigments using a scanning spectrophotometer<br />
(<str<strong>on</strong>g>UV</str<strong>on</strong>g> 530, Beckman Coulter, Fullert<strong>on</strong>, CA,<br />
USA). The <str<strong>on</strong>g>UV</str<strong>on</strong>g>AC c<strong>on</strong>tent was estimated by determining<br />
the ratio <str<strong>on</strong>g>of</str<strong>on</strong>g> <str<strong>on</strong>g>UV</str<strong>on</strong>g>AC to chlorophyll a (Chl a)<br />
according to Dunlap et al. (1995) and c<strong>on</strong>verting the<br />
ratio to c<strong>on</strong>tent per FW. Chl a c<strong>on</strong>centrati<strong>on</strong> was<br />
estimated according to Wellburn (1994).<br />
Data treatment and statistic analysis<br />
Diurnal <strong>photosynthetic</strong> rates were related to <str<strong>on</strong>g>solar</str<strong>on</strong>g><br />
irradiance to generate photosynthesis versus light<br />
curves, and were integrated to estimate daily net<br />
producti<strong>on</strong>. <str<strong>on</strong>g>UV</str<strong>on</strong>g>R, <str<strong>on</strong>g>UV</str<strong>on</strong>g>-A or <str<strong>on</strong>g>UV</str<strong>on</strong>g>-B-induced inhibiti<strong>on</strong><br />
was obtained as follows: (P PAR –P PAB )/P PAR 100%,<br />
(P PAR –P PA )/P PAR 100% or (P PA –P PAB )/P PAR 100%,<br />
where P PAB , P PA and P PAR represent the net