Data Analysis & Measurement: Having a Solar Blast pdf - ER - NASA
Data Analysis & Measurement: Having a Solar Blast pdf - ER - NASA
Data Analysis & Measurement: Having a Solar Blast pdf - ER - NASA

You also want an ePaper? Increase the reach of your titles
YUMPU automatically turns print PDFs into web optimized ePapers that Google loves.
Educational Product<br />
Educators Grades 6-8<br />
EG-2002-01-01-LARC<br />
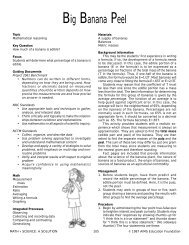
<strong>Data</strong> <strong>Analysis</strong> and <strong>Measurement</strong>:<br />
<strong>Having</strong> a <strong>Solar</strong> <strong>Blast</strong>!<br />
A Lesson Guide with Activities in Mathematics, Science, and Technology<br />
<br />
Find<br />
solar<br />
flares<br />
Total Numb<br />
Jan.<br />
Feb.<br />
1990<br />
1991<br />
1992<br />
1993<br />
1994<br />
1995
<strong>Data</strong> <strong>Analysis</strong> and <strong>Measurement</strong>: <strong>Having</strong> a <strong>Solar</strong> <strong>Blast</strong>!<br />
is available in electronic format through <strong>NASA</strong><br />
Spacelink - one of <strong>NASA</strong>’s electronic resources<br />
specifically developed for the educational<br />
community. This publication and other educational<br />
products may be accessed at the following<br />
address: http://spacelink.nasa.gov/products<br />
A PDF version of the lesson guide for <strong>NASA</strong><br />
CONNECT can be found at the <strong>NASA</strong> CONNECT<br />
web site: http://connect.larc.nasa.gov
<strong>Data</strong> <strong>Analysis</strong> and <strong>Measurement</strong>:<br />
<strong>Having</strong> a <strong>Solar</strong> <strong>Blast</strong>!<br />
A Lesson Guide with Activities in Mathematics, Science, and Technology<br />
Program Overview<br />
Summary and Objectives . . . . . . . . . . . . . . . . . . . . . . 5<br />
Student Involvement . . . . . . . . . . . . . . . . . . . . . . . . . . 5<br />
Cue Card Questions. . . . . . . . . . . . . . . . . . . . . . . . . . . 5<br />
Hands-On Activity . . . . . . . . . . . . . . . . . . . . . . . . . . . . 5<br />
Instructional Technology Activity. . . . . . . . . . . . . . 5<br />
Resources. . . . . . . . . . . . . . . . . . . . . . . . . . . . . . . . . . . . . . 5<br />
Hands-On Activity<br />
Background. . . . . . . . . . . . . . . . . . . . . . . . . . . . . . . . . . . . 6<br />
National Standards . . . . . . . . . . . . . . . . . . . . . . . . . . . . 6<br />
Instructional Objectives . . . . . . . . . . . . . . . . . . . . . . . . 7<br />
Vocabulary . . . . . . . . . . . . . . . . . . . . . . . . . . . . . . . . . . . . 7<br />
Preparing for the Activity. . . . . . . . . . . . . . . . . . . . . . . 8<br />
Student Materials . . . . . . . . . . . . . . . . . . . . . . . . . . . . 8<br />
Teacher Materials . . . . . . . . . . . . . . . . . . . . . . . . . . . . . 8<br />
Time . . . . . . . . . . . . . . . . . . . . . . . . . . . . . . . . . . . . . . . . . 8<br />
Focus Questions . . . . . . . . . . . . . . . . . . . . . . . . . . . . . 8<br />
Advance Preparation. . . . . . . . . . . . . . . . . . . . . . . . . . 8<br />
The Activity . . . . . . . . . . . . . . . . . . . . . . . . . . . . . . . . . . . . 8<br />
Extensions . . . . . . . . . . . . . . . . . . . . . . . . . . . . . . . . . . . 9<br />
Student Worksheets<br />
<strong>Data</strong> Charts A and B. . . . . . . . . . . . . . . . . . . . . . . . . . . 10<br />
<strong>Data</strong> Chart C . . . . . . . . . . . . . . . . . . . . . . . . . . . . . . . . . . 11<br />
Graph Paper . . . . . . . . . . . . . . . . . . . . . . . . . . . . . . . . . . 12<br />
Cue Cards . . . . . . . . . . . . . . . . . . . . . . . . . . . . . . . . . . . . 13<br />
Teacher Materials<br />
Cue Card Answers . . . . . . . . . . . . . . . . . . . . . . . . . . . . 14<br />
Summary Flare Counts . . . . . . . . . . . . . . . . . . . . . . . 15<br />
Resources<br />
Books, Pamphlets, and Periodicals . . . . . . . . . . . . . 16<br />
Web Sites . . . . . . . . . . . . . . . . . . . . . . . . . . . . . . . . . . . . . 16<br />
Acknowledgments: Special thanks to Michelle Larson, the NOAA GOES Satellite, Chris Giersch, Bill Williams, and NCTM.<br />
<strong>NASA</strong> CONNECT is a production of the <strong>NASA</strong> Langley Research Center, Hampton, VA. All Rights Reserved. Broadcast and off-air rights are unlimited and are<br />
granted in perpetuity with the following stipulations: <strong>NASA</strong> CONNECT shall not be used for commercial purposes; used, in whole or in part, to endorse a<br />
commercial product; stored, in whole or in part, in a commercial database; altered electronically, mechanically, or photographically without the expressed<br />
and prior written permission of <strong>NASA</strong>. This publication is in the public domain and is not protected by copyright. Permission is not required for duplication.
2001-2002 <strong>NASA</strong> CONNECT Series<br />
5<br />
Program Overview<br />
SUMMARY AND OBJECTIVES<br />
In <strong>Data</strong> <strong>Analysis</strong> and <strong>Measurement</strong>: <strong>Having</strong> a <strong>Solar</strong><br />
<strong>Blast</strong>!, students will learn how <strong>NASA</strong> researchers<br />
study the Sun. They will learn how satellite<br />
technology plays a pivotal role in helping <strong>NASA</strong><br />
researchers understand the Sun-Earth connection.<br />
Students will learn about three current satellites that<br />
monitor the Sun: SOHO, ACE,<br />
STUDENT INVOLVEMENT<br />
and IMAGE. They will also receive information about<br />
HESSI, a satellite that will study solar flares. Students<br />
will observe <strong>NASA</strong> researchers using data analysis<br />
and measurement to determine the solar cycle of<br />
the Sun. By conducting hands-on and web activities,<br />
students will make connections between <strong>NASA</strong><br />
research and the mathematics, science, and<br />
technology they learn in their classrooms.<br />
Cue Card Questions<br />
Norbert, <strong>NASA</strong> CONNECT’s animated cohost, poses<br />
questions throughout the broadcast. These<br />
questions direct the instruction and<br />
encourage students to think about the<br />
concepts being presented. When viewing a<br />
videotaped version of <strong>NASA</strong> CONNECT,<br />
educators have the option to use Norbert’s<br />
Pause, which gives students an opportunity<br />
to reflect and record their answers on the Cue<br />
Cards (p. 13). Norbert appears with a remote to<br />
indicate an appropriate time to pause the videotape<br />
and discuss the answers to the questions.<br />
Hands-On Activity<br />
The teacher-created, hands-on activity is aligned<br />
with the National Council of Teachers of<br />
Mathematics (NCTM) standards, the National<br />
Science Education (NSE) standards, the International<br />
Technology Education Association (ITEA) standards,<br />
and the National Education Technology (NET)<br />
standards. Students will discover the solar cycle<br />
through an investigation of solar X-ray flares. They<br />
will use data analysis and measurement to plot their<br />
findings to help them identify the long-term pattern<br />
of flare activity on the Sun.<br />
Instructional Technology Activity<br />
PBL: Space Weather is aligned with the National<br />
Council of Teachers of Mathematics (NCTM)<br />
standards, the National Science Education (NSE)<br />
standards, the International Technology Education<br />
Association (ITEA) standards, and the National<br />
Education Technology (NET) standards. This online<br />
Problem-Based Learning (PBL) activity will engage<br />
and motivate students to solve a real world<br />
problem. Students will use the Internet to learn<br />
more about the Sun and to develop possible<br />
solutions to the problem. To access PBL: Space<br />
Weather, go to Dan’s Domain on <strong>NASA</strong> CONNECT’s<br />
web site at http://connect.larc.nasa.gov/<br />
dansdomain.html.<br />
RESOURCES<br />
Teacher and student resources (p. 16) support,<br />
enhance, and extend the <strong>NASA</strong> CONNECT program.<br />
Books, periodicals, pamphlets, and web sites provide<br />
teachers and students with background information<br />
and extensions. In addition to the resources listed in<br />
this lesson guide, the <strong>NASA</strong> CONNECT web site,<br />
http://connect.larc.nasa.gov, offers online<br />
resources for teachers, students, and parents.<br />
Teachers who would like to get the most from the<br />
<strong>NASA</strong> CONNECT web site can visit the “Lab<br />
Manager,” located in “Dan’s Domain,”<br />
http://connect.larc.nasa.gov/dansdomain.html.<br />
EG-2002-01-01-LARC<br />
<strong>Data</strong> <strong>Analysis</strong> and <strong>Measurement</strong>: <strong>Having</strong> a <strong>Solar</strong> <strong>Blast</strong>!
6<br />
2001-2002 <strong>NASA</strong> CONNECT Series<br />
Hands-On Activity<br />
BACKGROUND<br />
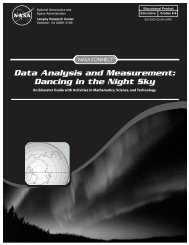
The Sun is the nearest star to Earth and our<br />
proximity to it allows us to study it in great detail.<br />
Observations reveal that the Sun is extremely<br />
dynamic, with changes taking place on many<br />
timescales. <strong>Solar</strong> flares are among the fastest and<br />
most energetic events on the Sun.<br />
<strong>Solar</strong> flares are the biggest explosions in the solar<br />
system! A solar flare occurs when magnetic energy<br />
that builds up in the solar atmosphere is suddenly<br />
released. Charged particles, such as electrons,<br />
protons, and heavier ions, are accelerated to such<br />
high energies that some are traveling at almost the<br />
speed of light. Some of these charged particles<br />
travel away from the Sun along magnetic field lines.<br />
Others move towards the surface of the Sun and<br />
emit X-rays and gamma rays as they slow down.<br />
Also, gas in the solar atmosphere is heated to<br />
temperatures as high as 100 million degrees Celsius.<br />
This heated gas emits X-rays as well. Flares produce<br />
all forms of electromagnetic radiation from radio<br />
waves and visible light to X-rays and gamma rays.<br />
<strong>Solar</strong> Flares occur in the solar atmosphere. The solar<br />
atmosphere starts at the photosphere, where the<br />
visible light from the Sun originates. It extends<br />
through the intermediate layer called the<br />
chromosphere to the outermost layer called the<br />
corona. The gas in the corona normally has a<br />
temperature of a few million degrees. Inside a flare,<br />
the temperature typically reaches 10 to 20 million<br />
degrees and can be as high as 100 million degrees<br />
Celsius. The frequency of solar flares varies with the<br />
Sun’s 11-year cycle. When the solar cycle is at a<br />
minimum, very few flares occur. As the Sun<br />
approaches the maximum part of its cycle, they<br />
begin to occur more and more frequently.<br />
The biggest flares are as powerful as billions of<br />
hydrogen bombs exploding at the same time! We<br />
still don’t know what triggers them or how they<br />
release so much energy in such a short time. <strong>Solar</strong><br />
flares have a direct effect on the Earth’s upper<br />
atmosphere. For instance, long distance radio<br />
communications can be disrupted by the effect the<br />
flares have on the Earth’s ionosphere. In addition,<br />
energetic particles accelerated in solar flares that<br />
escape into interplanetary space are dangerous to<br />
astronauts outside the protection of the Earth’s<br />
magnetic field and to electronic instruments in<br />
space. Understanding solar flares can aid in<br />
understanding energetic events throughout the<br />
Universe.<br />
In the hands-on activity,“X-ray Candles: <strong>Solar</strong> Flares<br />
on Your Birthday”, students will discover the solar<br />
cycle through an investigation of solar X-ray flares.<br />
Using the Geostationary Operational Environmental<br />
Satellite (GOES) X-ray data, students will record the<br />
total number of solar flares in their birth month over<br />
11 years and will compute the percentage of high<br />
class flares which occur for each year. Students will<br />
graph their findings to help them identify the longterm<br />
pattern of flare activity on the Sun.<br />
NATIONAL STANDARDS<br />
Mathematics (NCTM) Standards<br />
• Understand numbers, ways of representing<br />
numbers, relationships among numbers, and<br />
number systems.<br />
• Compute fluently and make reasonable estimates.<br />
• Use mathematical models to represent and<br />
understand quantitative relationships.<br />
• Apply appropriate techniques, tools, and formulas<br />
to determine measurements.<br />
• Formulate questions that can be addressed with<br />
data and collect, organize, and display relevant<br />
data to answer them.<br />
• Develop and evaluate inferences and predictions<br />
that are based on data.<br />
• Build new mathematical knowledge through<br />
problem solving.<br />
• Communicate mathematical thinking coherently<br />
and clearly to peers, teachers, and others.<br />
• Create and use representations to organize, record,<br />
and communicate mathematical ideas.<br />
<strong>Data</strong> <strong>Analysis</strong> and <strong>Measurement</strong>: <strong>Having</strong> a <strong>Solar</strong> <strong>Blast</strong>!<br />
EG-2002-01-01-LARC
2001-2002 <strong>NASA</strong> CONNECT Series<br />
7<br />
Science (NSE) Standards<br />
• Abilities necessary to do scientific inquiry<br />
• Understandings about scientific inquiry<br />
• Earth in the solar system<br />
• Understandings about science and technology<br />
• Science as a human endeavor<br />
• Develop an understanding of the role of society in<br />
the development and use of technology.<br />
Technology (NET) Standards<br />
• Select and use appropriate tools and technology<br />
resources to accomplish a variety of tasks and<br />
solve problems.<br />
Technology (ITEA) Standards<br />
• Develop an understanding of the relationships<br />
among technologies and the connections between<br />
technology and other fields of study.<br />
INSTRUCTIONAL OBJECTIVES<br />
The students will<br />
• discover the solar cycle through an investigation of<br />
solar X-ray flares.<br />
• record the total number of flares in their birth<br />
month over 11 years.<br />
• compute the percentage of high class flares which<br />
occur.<br />
• graph their findings to help them identify the longterm<br />
pattern of flare activity on the Sun.<br />
• incorporate collaborative problem-solving<br />
strategies in a real-life application.<br />
VOCABULARY<br />
chromosphere - the layer of the Sun, pinkish in<br />
color and composed of hydrogen, that lies between<br />
the visible surface (the photosphere) and the corona<br />
corona - the outermost layer of the Sun’s<br />
atmosphere that begins immediately above the<br />
chromosphere and that contains gas at<br />
temperatures of 1 to 2 million degrees kelvin<br />
electromagnetic spectrum - contains every<br />
frequency and wavelength of electromagnetic<br />
radiation that exists<br />
gamma ray - extremely high-energy radiation<br />
observed during large, very energetic solar flares.<br />
Gamma rays are more energetic and have shorter<br />
wavelengths than all other types of electromagnetic<br />
radiation.<br />
magnetic field - a field of magnetic force lines,<br />
usually referred to as the pattern of magnetic force<br />
emanating from and surrounding the Sun or any of<br />
the planets<br />
photosphere – the lowest layer of the solar<br />
atmosphere, where the Sun’s visible spectrum of<br />
light (electromagnetic radiation) is released. It is the<br />
visible “surface” we see in white-light images of the<br />
Sun.<br />
radio waves – energy waves produced by charged<br />
particles naturally emitted by the Sun and other<br />
stars<br />
solar flare – a sudden eruption in the vicinity of a<br />
sunspot, lasting minutes to hours and caused by the<br />
release of large amounts of magnetic energy in<br />
small volume above the solar surface<br />
<strong>Solar</strong> Maximum - the month(s) during the <strong>Solar</strong><br />
Cycle when the 12-month mean (average) of<br />
monthly average sunspot numbers reaches a<br />
maximum<br />
EG-2002-01-01-LARC<br />
<strong>Data</strong> <strong>Analysis</strong> and <strong>Measurement</strong>: <strong>Having</strong> a <strong>Solar</strong> <strong>Blast</strong>!
8<br />
2001-2002 <strong>NASA</strong> CONNECT Series<br />
<strong>Solar</strong> Minimum - the month(s) during the <strong>Solar</strong><br />
Cycle when the 12-month mean (average) of<br />
monthly average sunspot numbers reaches a<br />
minimum<br />
sunspot – a dark, cooler area on the Sun’s surface.<br />
Charged particles are emitted from these areas. The<br />
average sunspot is about the same diameter as the<br />
Earth.<br />
visible light – the region of the electromagnetic<br />
spectrum that can be perceived by human vision<br />
X-ray - electromagnetic radiation of very short<br />
wavelength and very high energy<br />
PREPARING FOR THE ACTIVITY<br />
Student Materials (per 4-student group)<br />
Calculator<br />
Graph Paper (p. 12)<br />
Student <strong>Data</strong> Charts (p. 10 - 11)<br />
Teacher Materials<br />
<strong>Solar</strong> flare data from the Internet<br />
Summary Flare Counts (p.15)<br />
Time<br />
Discussion of the activity................................10 minutes<br />
Performing the activity....................................30 minutes<br />
Focus Questions<br />
1. What is a solar flare?<br />
2. Where do solar flares occur?<br />
3. How often do solar flares occur?<br />
4. Why do <strong>NASA</strong> researchers and engineers study<br />
solar flares?<br />
Advance Preparation<br />
A. <strong>Solar</strong> flare data for each month of the year from<br />
1990 – 2001 can be accessed at http://<br />
connect.larc.nasa.gov/solarflaredata.html.<br />
The data are broken down into six columns: date,<br />
#B Flares, #C Flares, #M Flares, #X Flares, and Total<br />
Flares. Scientists use a series of letters to classify<br />
the energy level of an X-ray flare. The letters used<br />
are A, B, C, M, and X, with A being the weakest<br />
and X being the strongest. X-ray flare intensity is<br />
measured in units of power per area or W/m 2 .<br />
Each letter represents a certain numeric value.<br />
For this activity, the teacher will only use the X-<br />
ray classification letter. There are very few A-class<br />
flares in the data because satellites can only<br />
record flares which are above the normal X-ray<br />
level of the Sun and A-class flares are normally<br />
below this level.<br />
B. Print out a copy of the solar flare data for each<br />
month from 1990-2001. There are 12 pages of<br />
data for each month.<br />
THE ACTIVITY<br />
Step 1: Introducing the Activity<br />
A. Organize students into groups according to<br />
their birth month. If there is a month for which<br />
no one has a birthday, the teacher can use the<br />
Summary Flare Count (p. 15) to fill in data for the<br />
months where the teacher has no one to<br />
perform the activity. Also, if the teacher sees that<br />
a group is too big, he or she can ask students to<br />
pick a birth month not being used.<br />
B. Provide each group with the solar flare data for<br />
the corresponding birth month.<br />
C. Provide each student with a calculator, graph<br />
paper, and student data charts.<br />
Step 2: Conducting the Activity<br />
A. Have students add the total number of flares<br />
that occurred in their birth month for each year.<br />
To do this, first add together the numbers across<br />
the row for each day. Have students record that<br />
number in the last column of each row.<br />
B. Have students add together all the numbers in<br />
the last column to determine the total number<br />
<strong>Data</strong> <strong>Analysis</strong> and <strong>Measurement</strong>: <strong>Having</strong> a <strong>Solar</strong> <strong>Blast</strong>!<br />
EG-2002-01-01-LARC
2001-2002 <strong>NASA</strong> CONNECT Series<br />
9<br />
of flares in their birth month for each year. Have<br />
students record the total number of flares for<br />
each year in the box at the bottom right of each<br />
page.<br />
C. Have students add the total number of M-class<br />
flares in their birth month for each year. Students<br />
can do this by adding together all the numbers<br />
in the M-class column.<br />
D. Have students record the total number of M-<br />
class flares for each year in the box at the<br />
bottom middle of each page.<br />
Note: M-class flares are singled out because they are<br />
always strong enough to show up above normal X-ray<br />
levels of the Sun. X-class flares are the most energetic<br />
and are strong enough to be visible, but they do not<br />
occur very often; therefore, it would not be interesting<br />
to count them.<br />
E. Have students obtain the total number of flares<br />
for all months in each year. Groups will need to<br />
collaborate with each other to obtain the<br />
information. Have students record the data on<br />
<strong>Data</strong> Chart A (p. 10).<br />
F. Have students obtain the total number of M-<br />
class flares for all months in each year.<br />
G. Groups will need to collaborate with each other<br />
to obtain the information. Have students record<br />
the data on <strong>Data</strong> Chart B (p. 10).<br />
H. Have students calculate the total number of<br />
flares and M-class flares for each year.<br />
I. Record the data on <strong>Data</strong> Chart C (p. 11).<br />
J. Have students compute the percentage of M<br />
class flares for each year. This is done by dividing<br />
the number of M-class flares by the total number<br />
of flares and multiplying that number by 100.<br />
Record the percentage of M-class flares for each<br />
year on <strong>Data</strong> Chart C.<br />
K. Have students use graph paper to plot the<br />
percentage of M-class flares versus year.<br />
L. The year should be along the horizontal axis, and<br />
the percentage of M-class flares along the<br />
vertical axis.<br />
B. What year had the lowest percentage of M-class<br />
flares and the highest percentage of M-class<br />
flares? What is the difference in years between<br />
those two percentages?<br />
C. In general, the Sun goes through a regular solar<br />
cycle approximately every 11 years. Based on the<br />
graph, predict when the next solar maximum<br />
and solar minimum will occur.<br />
D. When you reach your 30th birthday, at what<br />
stage in the solar cycle will the Sun be?<br />
E. In analyzing the data, what are some other ways<br />
to graphically represent the length of the solar<br />
cycle?<br />
F. Why is it important for researchers and<br />
engineers to know when solar maximums and<br />
solar minimums will occur?<br />
Extensions<br />
A. Have the students research the relationship<br />
between solar flares and sunspots. Have<br />
students determine if the solar cycle can be<br />
calculated based on the number of sunspots on<br />
the Sun.<br />
B. Have students research Native American folklore<br />
concerning the Sun. Students can write a<br />
research paper, develop a web page, or give an<br />
oral presentation on why Native Americans<br />
worshiped the Sun.<br />
C. Have students use a graphing calculator to plot<br />
total number of flares vs. time.<br />
D. Students can determine if this plot is more<br />
accurate in determining the solar cycle of the<br />
Sun.<br />
Step 3: Discussion<br />
A. In analyzing the graph, what can you conclude<br />
about the percentage of high-energy solar flares<br />
from the Sun?<br />
EG-2002-01-01-LARC<br />
<strong>Data</strong> <strong>Analysis</strong> and <strong>Measurement</strong>: <strong>Having</strong> a <strong>Solar</strong> <strong>Blast</strong>!
10<br />
2001-2002 <strong>NASA</strong> CONNECT Series<br />
Student Worksheets<br />
Name:<br />
Date:<br />
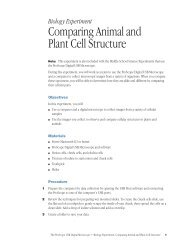
Total Number of Flares by Month<br />
<strong>Data</strong> Chart A<br />
Jan. Feb. Mar. Apr. May June July Aug. Sept. Oct. Nov. Dec.<br />
1990<br />
1991<br />
1992<br />
1993<br />
1994<br />
1995<br />
1996<br />
1997<br />
1998<br />
1999<br />
2000<br />
2001<br />
Total Number of M-Class Flares by Month<br />
<strong>Data</strong> Chart B<br />
Jan. Feb. Mar. Apr. May June July Aug. Sept. Oct. Nov. Dec.<br />
1990<br />
1991<br />
1992<br />
1993<br />
1994<br />
1995<br />
1996<br />
1997<br />
1998<br />
1999<br />
2000<br />
2001<br />
<strong>Data</strong> <strong>Analysis</strong> and <strong>Measurement</strong>: <strong>Having</strong> a <strong>Solar</strong> <strong>Blast</strong>!<br />
EG-2002-01-01-LARC
2001-2002 <strong>NASA</strong> CONNECT Series<br />
11<br />
Name:<br />
Date:<br />
1990<br />
1991<br />
1992<br />
1993<br />
1994<br />
1995<br />
1996<br />
1997<br />
1998<br />
1999<br />
2000<br />
2001<br />
Total Number<br />
of Flares<br />
Total Number<br />
of M-Class Flares<br />
<strong>Data</strong> Chart C<br />
Percentage of<br />
M-Class Flares<br />
EG-2002-01-01-LARC<br />
<strong>Data</strong> <strong>Analysis</strong> and <strong>Measurement</strong>: <strong>Having</strong> a <strong>Solar</strong> <strong>Blast</strong>!
12<br />
2001-2002 <strong>NASA</strong> CONNECT Series<br />
<strong>Data</strong> <strong>Analysis</strong> and <strong>Measurement</strong>: <strong>Having</strong> a <strong>Solar</strong> <strong>Blast</strong>!<br />
EG-2002-01-01-LARC
2001-2002 <strong>NASA</strong> CONNECT Series<br />
13<br />
Name:<br />
Date:<br />
Cue Cards<br />
Dr. Sten Odenwald, Astronomer,<br />
IMAGE Satellite Program, <strong>NASA</strong> Goddard Space Flight Center<br />
1<br />
What are some<br />
forms of<br />
electromagnetic<br />
radiation?<br />
2<br />
3<br />
How can<br />
satellites help<br />
researchers<br />
monitor the<br />
Sun?<br />
Why is it<br />
important to<br />
track solar storms<br />
as they approach<br />
Earth?<br />
Dr. Michelle Larson, Astrophysicist, University of California at Berkeley<br />
1<br />
What is the<br />
goal of the<br />
HESSI<br />
satellite?<br />
2<br />
When do<br />
solar flares<br />
occur on<br />
the Sun?<br />
3<br />
How do solar<br />
flares have a<br />
direct effect on<br />
the Earth’s<br />
atmosphere?<br />
EG-2002-01-01-LARC<br />
<strong>Data</strong> <strong>Analysis</strong> and <strong>Measurement</strong>: <strong>Having</strong> a <strong>Solar</strong> <strong>Blast</strong>!
14<br />
2001-2002 <strong>NASA</strong> CONNECT Series<br />
Teacher Materials<br />
Cue Cards<br />
Dr. Sten Odenwald, Astronomer,<br />
IMAGE Satellite Program, <strong>NASA</strong> Goddard Space Flight Center<br />
1<br />
What are some<br />
forms of<br />
electromagnetic<br />
radiation?<br />
Possible Answers: visible light, radio waves, microwaves, infrared light, ultraviolet light, X-<br />
rays, gamma rays<br />
2<br />
3<br />
How can<br />
satellites help<br />
researchers<br />
monitor the<br />
Sun?<br />
Why is it<br />
important to<br />
track solar storms<br />
as they approach<br />
Earth?<br />
Possible Answers: Satellites can be positioned outside of Earth’s atmosphere to collect<br />
valuable data from the Sun and to act as early warning devices against solar storms.<br />
Possible Answers: <strong>Solar</strong> storms have caused billions of dollars of<br />
satellite damage in the last 10 years. They have caused blackouts<br />
and will always be a hazard for astronauts working in space.<br />
Dr. Michelle Larson, Astrophysicist, University of California at Berkeley<br />
1<br />
What is the<br />
goal of the<br />
HESSI<br />
satellite?<br />
Possible Answers: The HESSI satellite is designed to learn more about the basic physical<br />
processes that occur in solar flares.<br />
2<br />
When do<br />
solar flares<br />
occur on<br />
the Sun?<br />
Possible Answers: A solar flare occurs when magnetic energy that builds up in the solar<br />
atmosphere is suddenly released. Particles are accelerated to such high energies that some are<br />
traveling at almost the speed of light.<br />
3<br />
How do solar<br />
flares have a<br />
direct effect on<br />
the Earth’s<br />
atmosphere?<br />
Possible Answers: Long distance radio communications can be disrupted by the effect of<br />
flares on the Earth’s ionosphere, which is a part of Earth’s atmosphere.<br />
<strong>Data</strong> <strong>Analysis</strong> and <strong>Measurement</strong>: <strong>Having</strong> a <strong>Solar</strong> <strong>Blast</strong>!<br />
EG-2002-01-01-LARC
2001-2002 <strong>NASA</strong> CONNECT Series<br />
15<br />
SUMMARY FLARE COUNTS<br />
This information can be used to shorten the activity or to fill in data for months that have no one available to<br />
participate in the full activity.<br />
Date Total # Flares # M Class Flares<br />
Jan 2001 197 10<br />
Feb 2001 107 1<br />
Mar 2001 253 37<br />
Apr 2001 212 38<br />
May 2001 181 11<br />
Jun 2001 241 13<br />
Jul 2001 149 3<br />
Aug 2001 325 22<br />
Sep 2001 262 50<br />
Oct 2001 264 32<br />
Nov 2001 310 46<br />
Dec 2001 205 47<br />
Jan 2000 149 9<br />
Feb 2000 202 14<br />
Mar 2000 343 37<br />
Apr 2000 210 11<br />
May 2000 235 20<br />
Jun 2000 222 21<br />
Jul 2000 273 51<br />
Aug 2000 168 3<br />
Sep 2000 232 14<br />
Oct 2000 174 11<br />
Nov 2000 200 17<br />
Dec 2000 253 7<br />
Jan 1999 243 10<br />
Feb 1999 152 6<br />
Mar 1999 200 11<br />
Apr 1999 165 5<br />
May 1999 199 16<br />
Jun 1999 202 17<br />
Jul 1999 249 23<br />
Aug 1999 225 23<br />
Sep 1999 135 2<br />
Oct 1999 212 8<br />
Nov 1999 250 40<br />
Dec 1999 192 9<br />
Jan 1998 176 5<br />
Feb 1998 144 0<br />
Mar 1998 235 10<br />
Apr 1998 143 4<br />
May 1998 236 15<br />
Jun 1998 155 4<br />
Jul 1998 159 3<br />
Aug 1998 187 14<br />
Sep 1998 170 9<br />
Oct 1998 177 3<br />
Nov 1998 241 15<br />
Dec 1998 225 12<br />
Jan 1997 10 0<br />
Date Total # Flares # M Class Flares<br />
Feb 1997 55 0<br />
Mar 1997 46 0<br />
Apr 1997 88 1<br />
May 1997 76 1<br />
Jun 1997 14 0<br />
Jul 1997 56 0<br />
Aug 1997 94 1<br />
Sep 1997 202 6<br />
Oct 1997 86 0<br />
Nov 1997 267 11<br />
Dec 1997 147 1<br />
Jan 1996 72 0<br />
Feb 1996 10 0<br />
Mar 1996 32 0<br />
Apr 1996 41 1<br />
May 1996 49 0<br />
Jun 1996 12 0<br />
Jul 1996 68 2<br />
Aug 1996 75 0<br />
Sep 1996 2 0<br />
Oct 1996 2 0<br />
Nov 1996 70 1<br />
Dec 1996 77 0<br />
Jan 1995 169 0<br />
Feb 1995 157 5<br />
Mar 1995 208 1<br />
Apr 1995 100 2<br />
May 1995 120 0<br />
Jun 1995 102 0<br />
Jul 1995 40 0<br />
Aug 1995 43 0<br />
Sep 1995 46 0<br />
Oct 1995 106 3<br />
Nov 1995 25 0<br />
Dec 1995 8 0<br />
Jan 1994 279 11<br />
Feb 1994 104 2<br />
Mar 1994 178 0<br />
Apr 1994 100 0<br />
May 1994 77 0<br />
Jun 1994 75 1<br />
Jul 1994 140 1<br />
Aug 1994 158 8<br />
Sep 1994 106 0<br />
Oct 1994 160 1<br />
Nov 1994 77 0<br />
Dec 1994 154 1<br />
Jan 1993 135 2<br />
Feb 1993 281 17<br />
Date Total # Flares # M Class Flares<br />
Mar 1993 256 13<br />
Apr 1993 220 3<br />
May 1993 204 5<br />
Jun 1993 211 13<br />
Jul 1993 152 4<br />
Aug 1993 139 1<br />
Sep 1993 116 2<br />
Oct 1993 233 3<br />
Nov 1993 197 3<br />
Dec 1993 284 8<br />
Jan 1992 235 39<br />
Feb 1992 290 47<br />
Mar 1992 176 4<br />
Apr 1992 197 8<br />
May 1992 161 5<br />
Jun 1992 193 7<br />
Jul 1992 255 12<br />
Aug 1992 309 12<br />
Sep 1992 273 33<br />
Oct 1992 300 24<br />
Nov 1992 216 7<br />
Dec 1992 210 4<br />
Jan 1991 277 32<br />
Feb 1991 254 52<br />
Mar 1991 367 103<br />
Apr 1991 218 41<br />
May 1991 252 39<br />
Jun 1991 308 66<br />
Jul 1991 266 29<br />
Aug 1991 217 33<br />
Sep 1991 272 24<br />
Oct 1991 314 53<br />
Nov 1991 238 27<br />
Dec 1991 341 91<br />
Jan 1990 168 25<br />
Feb 1990 175 10<br />
Mar 1990 261 28<br />
Apr 1990 195 21<br />
May 1990 205 28<br />
Jun 1990 174 21<br />
Jul 1990 161 13<br />
Aug 1990 186 25<br />
Sep 1990 172 16<br />
Oct 1990 244 11<br />
Nov 1990 358 25<br />
Dec 1990 331 50<br />
EG-2002-01-01-LARC<br />
<strong>Data</strong> <strong>Analysis</strong> and <strong>Measurement</strong>: <strong>Having</strong> a <strong>Solar</strong> <strong>Blast</strong>!
16<br />
2001-2002 <strong>NASA</strong> CONNECT Series<br />
Resources<br />
BOOKS, PAMPHLETS, AND P<strong>ER</strong>IODICALS<br />
Campbell, Wallace H. (1997). Introduction to<br />
Geomagnetic Fields. New York: Cambridge University<br />
Press.<br />
Friel, Susan; Rachlin, Sid; and Doyle, Dot: Navigating<br />
through Algebra in Grades 6-8 (with CD-ROM), NCTM,<br />
2001. (This book is also available for purchase on<br />
http://nctm.org/publications under new books.)<br />
WEB SITES<br />
Sun Science<br />
http://cse.ssl.berkeley.edu/hessi_epo/html/cur.html<br />
http://www.exploratorium.edu/spectra_from_space/<br />
xray_activity.html<br />
http://imagine.gsfc.nasa.gov/docs/science/know_l1/<br />
emspectrum.html<br />
http://www.hao.ucar.edu/public/education/slides/<br />
slides.html<br />
http://hesperia.gsfc.nasa.gov/sftheory/index.htm<br />
http://www.lmsal.com/YPOP/Classroom/Lessons/Cycles/<br />
http://image.gsfc.nasa.gov/poetry/sunspot/sunspot.html<br />
http://www.spaceweather.com/<br />
Satellites and Science<br />
http://wwwssl.msfc.nasa.gov/msl1/ground_lab/<br />
aroundtheworld.htm<br />
http://octopus.gma.org/surfing/satellites/index.html<br />
http://observe.ivv.nasa.gov/nasa/exhibits/learning/<br />
learning_0.html<br />
http://deepspace.jpl.nasa.gov/dsn/tutor/<br />
The HESSI Mission<br />
http://cse.ssl.berkeley.edu/hessi_epo/html/cur.html<br />
http://hesperia.gsfc.nasa.gov/hessi/hessi_model.<strong>pdf</strong><br />
http://hesperia.gsfc.nasa.gov/hessi/<br />
Figure This!<br />
Offers Mathematics Challenges that middle school<br />
students can do at home with their families to<br />
emphasize the importance of a high-quality<br />
mathematics education for all.<br />
http://www.figurethis.org<br />
Engineer Girl<br />
Part of the National Academy of Engineering’s<br />
Celebration of Women in the Engineering project.The<br />
project brings national attention to the opportunity<br />
that engineering represents to people of all ages,<br />
particularly to women and girls.<br />
http://www.engineergirl.org<br />
GetTech<br />
Through its web site and collateral materials,<br />
GetTech helps prepare students in fun ways for<br />
tomorrow’s great jobs.<br />
http://gettech.org<br />
Event-Based Science<br />
Event-Based Science is a new way to teach science<br />
at the middle school level. Newsworthy events<br />
establish the relevance of science topics; authentic<br />
tasks create the need-to-know more about those<br />
topics; and lively interviews, photographs, web<br />
pages, and inquiry-based science activities create a<br />
desire to know more about those topics.<br />
http://www.mcps.k12.md.us/departments/<br />
eventscience<br />
7 Steps for Teachers Using Television in the<br />
Classroom<br />
TV programs can add a new dimension to your<br />
classroom and promote active learning among your<br />
students. The following steps can guide you in<br />
preparing a lesson using instructional television:<br />
http://www.qued.org/erc/teachers/mediatips.html<br />
<strong>Data</strong> <strong>Analysis</strong> and <strong>Measurement</strong>: <strong>Having</strong> a <strong>Solar</strong> <strong>Blast</strong>!<br />
EG-2002-01-01-LARC