Sustainability Plan - University of Washington Tacoma
Sustainability Plan - University of Washington Tacoma
Sustainability Plan - University of Washington Tacoma

You also want an ePaper? Increase the reach of your titles
YUMPU automatically turns print PDFs into web optimized ePapers that Google loves.
<strong>Sustainability</strong><br />
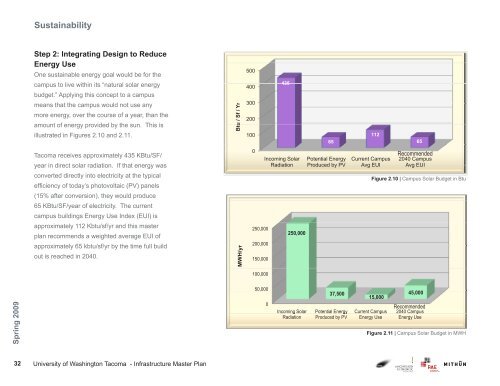
Step 2: Integrating Design to Reduce<br />
Energy Use<br />
One sustainable energy goal would be for the<br />
campus to live within its “natural solar energy<br />
budget.” Applying this concept to a campus<br />
means that the campus would not use any<br />
more energy, over the course <strong>of</strong> a year, than the<br />
amount <strong>of</strong> energy provided by the sun. This is<br />
illustrated in Figures 2.10 and 2.11.<br />
<strong>Tacoma</strong> receives approximately 435 KBtu/SF/<br />
year in direct solar radiation. If that energy was<br />
converted directly into electricity at the typical<br />
efficiency <strong>of</strong> today’s photovoltaic (PV) panels<br />
(15% after conversion), they would produce<br />
65 KBtu/SF/year <strong>of</strong> electricity. The current<br />
campus buildings Energy Use Index (EUI) is<br />
approximately 112 Kbtu/sf/yr and this master<br />
plan recommends a weighted average EUI <strong>of</strong><br />
approximately 65 kbtu/sf/yr by the time full build<br />
out is reached in 2040.<br />
Btu<br />
/ Sf / Yr<br />
MWH/yr<br />
500<br />
400<br />
300<br />
200<br />
100<br />
0<br />
250,000<br />
200,000<br />
150,000<br />
100,000<br />
435<br />
65<br />
Recommended<br />
Incoming Solar Potential Energy Current Campus 2040 Campus<br />
Radiation Produced by PV Avg EUI Avg EUI<br />
250,000<br />
112<br />
65<br />
Figure 2.10 | Campus Solar Budget in Btu<br />
Spring 2009<br />
50,000<br />
0<br />
37,500<br />
15,000<br />
45,000<br />
Recommended<br />
Incoming Solar Potential Energy Current Campus 2040 Campus<br />
Radiation Produced by PV Energy Use Energy Use<br />
Figure 2.11 | Campus Solar Budget in MWH<br />
32 <strong>University</strong> <strong>of</strong> <strong>Washington</strong> <strong>Tacoma</strong> - Infrastructure Master <strong>Plan</strong>