Monthly SFE Trading Report for May 2013 - Australian Stock ...
Monthly SFE Trading Report for May 2013 - Australian Stock ...
Monthly SFE Trading Report for May 2013 - Australian Stock ...

Create successful ePaper yourself
Turn your PDF publications into a flip-book with our unique Google optimized e-Paper software.
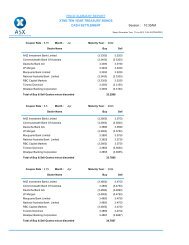
<strong>Monthly</strong> <strong>SFE</strong> <strong>Trading</strong> <strong>Report</strong> <strong>for</strong> <strong>May</strong> <strong>2013</strong><br />
<strong>Report</strong> Generation Time: 04/06/13 11:13:08 [PDSAP202]<br />
Mth Vol<br />
<strong>May</strong> <strong>2013</strong><br />
(23-Days)<br />
Mth Vol<br />
<strong>May</strong> 2012<br />
(23-Days)<br />
%<br />
Change<br />
YTD <strong>2013</strong><br />
(106-Days)<br />
YTD 2012<br />
(106-Days)<br />
%<br />
Change<br />
Op Int<br />
<strong>2013</strong><br />
(Mth-End)<br />
Op Int<br />
2012<br />
(Mth-End)<br />
%<br />
Change<br />
Equity Indices - Futures<br />
SPI 200 AP 678,498 826,263 -17.88% 3,928,075 3,859,010 1.79% 301,976 226,878 33.10%<br />
Total: 678,498 826,263 -17.88% 3,928,075 3,859,010 1.79% 301,976 226,878 33.10%<br />
Equity Indices - Options<br />
SPI 200 AP 35,610 81,930 -56.54% 112,488 200,889 -44.00% 87,751 138,734 -36.75%<br />
Total: 35,610 81,930 -56.54% 112,488 200,889 -44.00% 87,751 138,734 -36.75%<br />
Interest Rates - Futures<br />
30 Day Interbank Cash Rate IB 537,014 487,267 10.21% 2,055,433 1,864,903 10.22% 174,904 212,088 -17.53%<br />
90-Day Bank Bills IR 2,880,041 2,816,952 2.24% 12,304,017 9,166,560 34.23% 994,158 780,740 27.34%<br />
3 Month Overnight Index Swap OI 150 2,546 -94.11% 4,464 3,747 19.14% 1,560 1,377 13.29%<br />
3 Year Bonds YT 4,530,386 4,432,147 2.22% 20,195,309 17,738,502 13.85% 695,395 546,983 27.13%<br />
3 Year Interest Rate Swaps YS 0 0 na 101 1,300 -92.23% 0 0 na<br />
10 Year Bonds XT 1,949,796 1,387,869 40.49% 8,617,392 6,653,314 29.52% 507,570 398,915 27.24%<br />
10 Year Interest Rate Swaps XS 0 120 -100.00% 40 440 -90.91% 0 0 na<br />
Total: 9,897,387 9,126,901 8.44% 43,176,756 35,428,766 21.87% 2,373,587 1,940,103 22.34%<br />
Interest Rates - Options<br />
90-Day Bank Bills IR 0 0 na 0 0 na 0 0 na<br />
30 Day Interbank Cash Rate IB 0 0 na 0 0 na 0 0 na<br />
3 Year Bonds YT 65,110 82,885 -21.45% 232,384 233,954 -0.67% 29,220 102,080 -71.38%<br />
3 Year Bonds Overnight YO 217,822 132,028 64.98% 1,026,798 586,490 75.08% 0 0 na<br />
3 Year Bonds Intra-Day YD 215,674 125,680 71.61% 774,237 494,055 56.71% 0 0 na<br />
10 Year Bonds XT 60 852 -92.96% 9,220 1,466 528.92% 140 1,022 -86.30%<br />
10 Year Bonds Overnight XO 0 0 na 0 550 -100.00% 0 0 na<br />
10 Year Bonds Intra-Day XD 0 0 na 0 100 -100.00% 0 0 na<br />
Total: 498,666 341,445 46.05% 2,042,639 1,316,615 55.14% 29,360 103,102 -71.52%<br />
NZ Interest Rates - Futures<br />
90 Day Bank Bill BB 100,473 181,461 -44.63% 451,040 531,529 -15.14% 98,248 108,067 -9.09%<br />
3 Year <strong>Stock</strong> TY 0 0 na 0 0 na 0 0 na<br />
10 Year <strong>Stock</strong> TN 0 0 na 3,060 0 na 1,480 0 na<br />
NZ 30 Day OCR Interbank ZO 0 250 -100.00% 50 250 -80.00% 0 250 -100.00%<br />
Total: 100,473 181,711 -44.71% 454,150 531,779 -14.60% 99,728 108,317 -7.93%<br />
NZ Interest Rates - Options<br />
90 Day Bank Bill BB 0 0 na 0 0 na 0 0 na<br />
3 Year <strong>Stock</strong> TY 0 0 na 0 0 na 0 0 na<br />
10 Year <strong>Stock</strong> TN 0 0 na 0 0 na 0 0 na<br />
Total: 0 0 na 0 0 na 0 0 na<br />
l Volumes quoted are Total Volumes which include on-market, off-market and non-traded volumes.<br />
l Quoted figures are based on latest available in<strong>for</strong>mation at time of report generation.<br />
l Although ASX Limited ABN 98 008 624 691 and its related bodies corporate (“ASX”) has made every ef<strong>for</strong>t to ensure the accuracy of the in<strong>for</strong>mation as at<br />
the date of publication, ASX does not give any warranty or representation as to the accuracy, reliability or completeness of the in<strong>for</strong>mation. To the<br />
extent permitted by law, ASX and its employees, officers and contractors shall not be liable <strong>for</strong> any loss or damage arising in any way (including by<br />
way of negligence) from or in connection with any in<strong>for</strong>mation provided or omitted or from any one acting or refraining to act in reliance on this<br />
in<strong>for</strong>mation.<br />
Page 1 of 3
<strong>Monthly</strong> <strong>SFE</strong> <strong>Trading</strong> <strong>Report</strong> <strong>for</strong> <strong>May</strong> <strong>2013</strong><br />
<strong>Report</strong> Generation Time: 04/06/13 11:13:08 [PDSAP202]<br />
Mth Vol<br />
<strong>May</strong> <strong>2013</strong><br />
(23-Days)<br />
Mth Vol<br />
<strong>May</strong> 2012<br />
(23-Days)<br />
%<br />
Change<br />
YTD <strong>2013</strong><br />
(106-Days)<br />
YTD 2012<br />
(106-Days)<br />
%<br />
Change<br />
Op Int<br />
<strong>2013</strong><br />
(Mth-End)<br />
Op Int<br />
2012<br />
(Mth-End)<br />
%<br />
Change<br />
Commodities - Futures<br />
d-cypha <strong>SFE</strong> NSW Base Load Electricity BN 1,502 2,918 -48.53% 12,015 14,372 -16.40% 8,574 9,189 -6.69%<br />
d-cypha <strong>SFE</strong> QLD Base Load Electricity BQ 1,090 1,043 4.51% 11,663 9,122 27.86% 6,639 5,604 18.47%<br />
d-cypha <strong>SFE</strong> SA Base Load Electricity BS 442 353 25.21% 1,908 1,709 11.64% 1,193 1,340 -10.97%<br />
d-cypha <strong>SFE</strong> VIC Base Load Electricity BV 1,994 1,307 52.56% 9,190 9,700 -5.26% 5,894 6,808 -13.43%<br />
d-cypha <strong>SFE</strong> NSW Peak Period Electricity PN 475 312 52.24% 2,578 3,210 -19.69% 1,872 1,393 34.39%<br />
d-cypha <strong>SFE</strong> QLD Peak Period Electricity PQ 220 26 746.15% 1,090 1,523 -28.43% 544 641 -15.13%<br />
d-cypha <strong>SFE</strong> SA Peak Period Electricity PS 0 0 na 102 217 -53.00% 110 213 -48.36%<br />
d-cypha <strong>SFE</strong> VIC Peak Period Electricity PV 486 141 244.68% 2,334 889 162.54% 1,389 687 102.18%<br />
d-cypha <strong>SFE</strong> NSW Base $300 CAP GN 857 528 62.31% 6,595 3,325 98.35% 2,905 1,689 72.00%<br />
d-cypha <strong>SFE</strong> QLD Base $300 CAP GQ 101 240 -57.92% 2,785 1,854 50.22% 1,329 1,500 -11.40%<br />
d-cypha <strong>SFE</strong> SA Base $300 CAP GS 97 102 -4.90% 863 908 -4.96% 682 580 17.59%<br />
d-cypha <strong>SFE</strong> VIC Base $300 CAP GV 626 306 104.58% 4,502 3,972 13.34% 2,383 2,992 -20.35%<br />
d-cypha <strong>SFE</strong> NSW Base Load Electricity Strip HN 102 271 -62.36% 283 1,005 -71.84% 0 0 na<br />
d-cypha <strong>SFE</strong> QLD Base Load Electricity Strip HQ 74 61 21.31% 620 329 88.45% 0 0 na<br />
d-cypha <strong>SFE</strong> SA Base Load Electricity Strip HS 27 5 440.00% 47 25 88.00% 0 0 na<br />
d-cypha <strong>SFE</strong> VIC Base Load Electricty Strip HV 75 93 -19.35% 110 324 -66.05% 0 0 na<br />
Fine Wool FW 0 0 na 0 22 -100.00% 0 15 -100.00%<br />
Broad Wool BW 0 0 na 0 0 na 0 0 na<br />
Greasy Wool GW 0 116 -100.00% 48 971 -95.06% 0 147 -100.00%<br />
VIC Gas Futures GX 5 0 na 5 0 na 5 0 na<br />
VIC Gas Strip Futures GY 0 0 na 0 0 na 0 0 na<br />
Renewable Energy Certificate Futures EO 0 0 na 10 0 na 0 10 -100.00%<br />
WA Wheat WK 1,260 1,000 26.00% 9,398 8,525 10.24% 4,325 1,100 293.18%<br />
WA Wheat Tendered KK 0 0 na 0 0 na 0 0 na<br />
NSW Wheat VW 9,566 25,968 -63.16% 69,349 118,000 -41.23% 17,981 36,223 -50.36%<br />
NSW Wheat Tendered KW 0 0 na 0 0 na 0 0 na<br />
Eastern Australia Feed Barley UB 2,435 3,704 -34.26% 18,308 14,454 26.66% 4,160 4,717 -11.81%<br />
Eastern Australia Feed Barley Tendered KB 0 0 na 0 0 na 0 0 na<br />
<strong>Australian</strong> Sorghum US 961 370 159.73% 6,485 2,599 149.52% 910 55 1,554.55%<br />
<strong>Australian</strong> Sorghum Tendered KS 0 0 na 0 0 na 0 0 na<br />
Eastern Australia Canola VC 10 0 na 60 0 na 60 0 na<br />
Easterm Australia Canola Tendered KC 0 0 na 0 0 na 0 0 na<br />
d-cypha ASX NSW <strong>Monthly</strong> Base Load ElectricityEN 0 0 na 0 0 na 0 0 na<br />
d-cypha ASX QLD <strong>Monthly</strong> Base Load Electricity EQ 0 0 na 0 0 na 0 0 na<br />
d-cypha ASX SA <strong>Monthly</strong> Base Load Electricity ES 0 0 na 0 0 na 0 0 na<br />
d-cypha ASX VIC <strong>Monthly</strong> Base Load Electricity EV 10 0 na 10 0 na 5 0 na<br />
Total: 22,415 38,864 -42.32% 160,358 197,055 -18.62% 60,960 74,903 -18.61%<br />
Commodities - Options<br />
d-cypha <strong>SFE</strong> NSW Base Load Electricity Strip HN 490 315 55.56% 1,651 2,955 -44.13% 2,412 2,272 6.16%<br />
d-cypha <strong>SFE</strong> QLD Base Load Electricity Strip HQ 335 75 346.67% 1,346 2,125 -36.66% 1,681 1,927 -12.77%<br />
d-cypha <strong>SFE</strong> SA Base Load Electricity Strip HS 0 0 na 0 50 -100.00% 0 50 -100.00%<br />
d-cypha <strong>SFE</strong> VIC Base Load Electricty Strip HV 270 275 -1.82% 972 2,920 -66.71% 2,557 2,361 8.30%<br />
d-cypha <strong>SFE</strong> NSW Peak Period Electricity PN 0 0 na 0 0 na 0 0 na<br />
d-cypha <strong>SFE</strong> QLD Peak Period Electricity PQ 0 0 na 0 0 na 0 0 na<br />
d-cypha <strong>SFE</strong> SA Peak Period Electricity PS 0 0 na 0 0 na 0 0 na<br />
d-cypha <strong>SFE</strong> VIC Peak Period Electricity PV 0 0 na 0 0 na 0 0 na<br />
Greasy Wool GW 0 0 na 0 0 na 0 0 na<br />
WA Wheat WK 0 0 na 0 0 na 0 0 na<br />
NSW Wheat VW 0 8,750 -100.00% 1,250 8,800 -85.80% 0 8,800 -100.00%<br />
Eastern Australia Feed Barley UB 0 1,000 -100.00% 0 1,000 -100.00% 0 250 -100.00%<br />
<strong>Australian</strong> Sorghum US 0 0 na 0 0 na 0 0 na<br />
Eastern Australia Canola VC 0 0 na 0 0 na 0 0 na<br />
Total: 1,095 10,415 -89.49% 5,219 17,850 -70.76% 6,650 15,660 -57.54%<br />
l Volumes quoted are Total Volumes which include on-market, off-market and non-traded volumes.<br />
l Quoted figures are based on latest available in<strong>for</strong>mation at time of report generation.<br />
l Although ASX Limited ABN 98 008 624 691 and its related bodies corporate (“ASX”) has made every ef<strong>for</strong>t to ensure the accuracy of the in<strong>for</strong>mation as at<br />
the date of publication, ASX does not give any warranty or representation as to the accuracy, reliability or completeness of the in<strong>for</strong>mation. To the<br />
extent permitted by law, ASX and its employees, officers and contractors shall not be liable <strong>for</strong> any loss or damage arising in any way (including by<br />
way of negligence) from or in connection with any in<strong>for</strong>mation provided or omitted or from any one acting or refraining to act in reliance on this<br />
in<strong>for</strong>mation.<br />
Page 2 of 3
<strong>Monthly</strong> <strong>SFE</strong> <strong>Trading</strong> <strong>Report</strong> <strong>for</strong> <strong>May</strong> <strong>2013</strong><br />
<strong>Report</strong> Generation Time: 04/06/13 11:13:08 [PDSAP202]<br />
Mth Vol<br />
<strong>May</strong> <strong>2013</strong><br />
(23-Days)<br />
Mth Vol<br />
<strong>May</strong> 2012<br />
(23-Days)<br />
%<br />
Change<br />
YTD <strong>2013</strong><br />
(106-Days)<br />
YTD 2012<br />
(106-Days)<br />
%<br />
Change<br />
Op Int<br />
<strong>2013</strong><br />
(Mth-End)<br />
Op Int<br />
2012<br />
(Mth-End)<br />
%<br />
Change<br />
NZ Commodities - Futures<br />
NZ Electricity Futures (Otahuhu) EA 184 175 5.14% 1,435 1,325 8.30% 522 425 22.82%<br />
NZ Electricity Futures (Benmore) EE 212 236 -10.17% 1,822 1,510 20.66% 661 535 23.55%<br />
NZ Electricity Strip Futures (Otahuhu) EB 0 0 na 0 3 -100.00% 0 0 na<br />
NZ Electricity Strip Futures (Benmore) EF 0 0 na 0 1 -100.00% 0 0 na<br />
Total: 396 411 -3.65% 3,257 2,839 14.72% 1,183 960 23.23%<br />
NZ Commodities - Options<br />
NZ Electricity Strip Futures (Otahuhu) EB 0 0 na 0 5 -100.00% 0 5 -100.00%<br />
NZ Electricity Strip Futures (Benmore) EF 0 10 -100.00% 0 20 -100.00% 0 15 -100.00%<br />
Total: 0 10 -100.00% 0 25 -100.00% 0 20 -100.00%<br />
Total Exchange<br />
Daily Average<br />
11,234,540 10,607,950 5.91% 49,882,942 41,554,828 20.04% 2,961,195 2,608,677 13.51%<br />
488,458 461,215 5.91% 470,594 392,027 20.04%<br />
Non-Traded Volume<br />
(included in total volume) 4.00<br />
MS OE Total<br />
10 Year Bonds XT 0 30 30<br />
3 Year Bonds YT 0 92,858 92,858<br />
30 Day Interbank Cash Rate IB 70,843 0 70,843<br />
SPI 200 AP 3,512 0 3,512<br />
Total Non Traded: 74,355 92,888 167,243<br />
l Volumes quoted are Total Volumes which include on-market, off-market and non-traded volumes.<br />
l Quoted figures are based on latest available in<strong>for</strong>mation at time of report generation.<br />
l Although ASX Limited ABN 98 008 624 691 and its related bodies corporate (“ASX”) has made every ef<strong>for</strong>t to ensure the accuracy of the in<strong>for</strong>mation as at<br />
the date of publication, ASX does not give any warranty or representation as to the accuracy, reliability or completeness of the in<strong>for</strong>mation. To the<br />
extent permitted by law, ASX and its employees, officers and contractors shall not be liable <strong>for</strong> any loss or damage arising in any way (including by<br />
way of negligence) from or in connection with any in<strong>for</strong>mation provided or omitted or from any one acting or refraining to act in reliance on this<br />
in<strong>for</strong>mation.<br />
Page 3 of 3