Incorporating Climate Change into Conservation Planning for the ...
Incorporating Climate Change into Conservation Planning for the ...
Incorporating Climate Change into Conservation Planning for the ...

Create successful ePaper yourself
Turn your PDF publications into a flip-book with our unique Google optimized e-Paper software.
3/10/2010<br />
<strong>Incorporating</strong> <strong>Climate</strong> <strong>Change</strong> <strong>into</strong> <strong>Conservation</strong> <strong>Planning</strong> <strong>for</strong> <strong>the</strong> SADC Region<br />
Perspectives of a climatologist working in conservation<br />
Anton Seimon<br />
Wildlife <strong>Conservation</strong> Society<br />
Some climatology basics<br />
<strong>Climate</strong> vs. wea<strong>the</strong>r<br />
“<strong>Climate</strong> is what you expect; wea<strong>the</strong>r is what you get”<br />
Climatic variability<br />
Fluctuations around baseline means at seasonal, annual and longer time scales<br />
<strong>Climate</strong> change<br />
Multi-decadal climate trends that shift <strong>the</strong> baseline<br />
“Global warming”<br />
Ongoing human-caused or enhanced climate change<br />
El Niño-Sou<strong>the</strong>rn Oscillation (ENSO)<br />
Dominant driver of year to year climatic variability, especially in <strong>the</strong> tropics<br />
Controls over regional climate<br />
Spatial variability largely governed<br />
by topography and land surface type<br />
= local <strong>for</strong>cing<br />
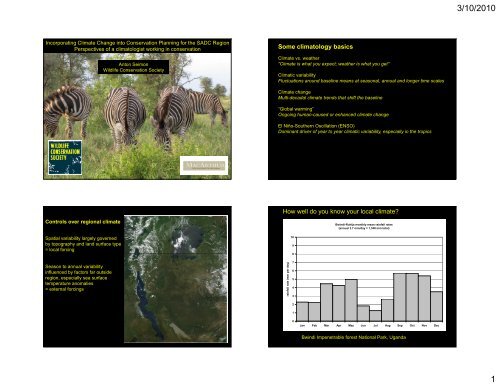
How well do you know your local climate?<br />
10<br />
9<br />
8<br />
Bwindi-Ruhija monthly mean rainfall rates<br />
(annual 3.7 mm/day = 1,348 mm total)<br />
Season to annual variability<br />
influenced by factors far outside<br />
region, especially sea surface<br />
temperature anomalies<br />
= external <strong>for</strong>cings<br />
rainfall rate (mm per day)<br />
7<br />
6<br />
5<br />
4<br />
3<br />
2<br />
1<br />
0<br />
Jan Feb Mar Apr May Jun Jul Aug Sep Oct Nov Dec<br />
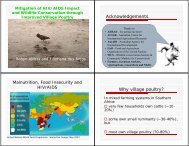
Bwindi Impenetrable <strong>for</strong>est National Park, Uganda<br />
1
3/10/2010<br />
Bwindi Impenetrable Forest National Park, Uganda<br />
daily precipitation rate 1991-2006 at Ruhija<br />
Nyungwe monthly averages and 9-day running mean, 1996-2007<br />
rainfall rate (mm/day)<br />
10<br />
9<br />
8<br />
7<br />
6<br />
5<br />
4<br />
3<br />
2<br />
1<br />
0<br />
1-Jan 1-Feb 1-Mar 1-Apr 1-May 1-Jun 1-Jul 1-Aug 1-Sep 1-Oct 1-Nov 1-Dec<br />
monthly mean 7-day running mean<br />
Rainfall rate (mm/day)<br />
12<br />
11<br />
10<br />
9<br />
8<br />
7<br />
6<br />
5<br />
4<br />
3<br />
2<br />
1<br />
0<br />
1-Jan 1-Feb 1-Mar 1-Apr 1-May 1-Jun 1-Jul 1-Aug 1-Sep 1-Oct 1-Nov 1-Dec<br />
7-day running mean monthly average<br />
Nyungwe and Bwindi rainfall rates, 9-day running mean<br />
Nyungwe (1996-2007); Bwindi (1990-2006)<br />
Rainfall rate (mm day-1)<br />
15<br />
14<br />
13<br />
12<br />
11<br />
10<br />
9<br />
8<br />
7<br />
6<br />
5<br />
4<br />
3<br />
2<br />
1<br />
0<br />
1-Jan 1-Feb 1-Mar 1-Apr 1-May 1-Jun 1-Jul 1-Aug 1-Sep 1-Oct 1-Nov 1-Dec<br />
Nyungwe 9-day running mean Bwindi 9-day<br />
Daily rainfall rate at Mahale smoo<strong>the</strong>d by applying a 21-day running mean<br />
10-year periods 1989-1998 and 1999-2008.<br />
-wetter to drier (red)<br />
-drier to wetter (blue)<br />
from <strong>the</strong> earlier to <strong>the</strong> latter period.<br />
Data provided of Dr. Noriko Itoh, Kyoto University.<br />
2
3/10/2010<br />
How to consider climate change relative to current threats?<br />
CC has slow evolution but ultimately will have severe impacts<br />
Physical environment<br />
– significantly increased temperatures, probably drier….<br />
Hydrology<br />
– increased desiccation, competition <strong>for</strong> water resources<br />
Wildlife habitat<br />
– shifting ecotones, changing biomes, species assemblages<br />
Disturbance<br />
– changed fire regimes, potential <strong>for</strong> fire outbreaks, pests, invasives…<br />
Seasonality<br />
– shift in dry season length, timing of rainfall peaks, etc.<br />
Disease<br />
– <strong>the</strong> witch’s brew of present-day disease + o<strong>the</strong>rs extending ranges + newly EIDs<br />
NET RESULT: by mid-late 21 st century, greatly changed landscapes <strong>for</strong> which past<br />
experience offers poor analogs<br />
Thermal increase is already strongly throughout <strong>the</strong><br />
tropics<br />
Example 1: Virunga massif (Rwanda, Uganda and Congo DRC)<br />
“Karisimbiis <strong>the</strong> highest peak of <strong>the</strong> range, being above<br />
sea-level. It is a beautifully <strong>for</strong>med sharp cone, nearly always snowcovered.”<br />
E. M. Jack, The Geographical Journal,<br />
1913<br />
Temperature trends in <strong>the</strong> western Albertine Rift<br />
Lwiro, Congo 1953-2006<br />
21.0<br />
ature (C)<br />
Tempera<br />
20.0<br />
19.0<br />
18.0<br />
17.0<br />
1953 1958 1963 1968 1973 1978 1983 1988 1993 1998 2003<br />
3
3/10/2010<br />
Example 2:<br />
Cultivator response to regional warming in Sou<strong>the</strong>rn Peru over 40 years<br />
- Frost limit at ~4,250 m in 1960s with short growing season<br />
- year-round frosts at 4,543 m<br />
Source: Winterhalder and Thomas, 1978<br />
Source: Hole et al., in press 2010<br />
Changing phenomenology of extreme events<br />
Example: Australia/Melbourne area fires in February 2009<br />
Meteorological conditions unprecedented in more than 100 years of<br />
records:<br />
- Highest temperatures ever (48 deg. C)<br />
- Humidity 7%<br />
- Winds gusting to 20 meters per second (40 knots)<br />
Result: Uncontrollable fires, extremely rapid propagation, total<br />
destruction of biota and structures in affected corridors, ~230<br />
fatalities<br />
Bushfire dwarfs a fire-truck at Labertouche, near Pakenham, east of Melbourne. Picture: Alex Coppel<br />
http://www.news.com.au/heraldsun/gallery/0,22010,5037339-5006020-163,00.html<br />
4
3/10/2010<br />
Photo taken by Nick Hill of <strong>the</strong> Bunyip State <strong>for</strong>est taken from a property on <strong>the</strong> Labertouche<br />
North Road.<br />
http://www.news.com.au/heraldsun/gallery/0,22010,5037340-5006020-10,00.html<br />
A bushfire burns in <strong>the</strong> Bunyip State Forest near <strong>the</strong> township of Tonimbuk. Picture: AAP/Andrew Brownbill<br />
http://www.news.com.au/heraldsun/gallery/0,22010,5037339-5006020-145,00.html<br />
Global warming of <strong>the</strong> 21 st century – IPCC multi-model<br />
simulations<br />
Global precipitation changes of <strong>the</strong> 21 st century – IPCC<br />
multi-model simulations<br />
IPCC multi-model<br />
projections <strong>for</strong> end of<br />
21 st century compared<br />
to present<br />
IPCC multi-model projections <strong>for</strong><br />
end of 21 st century compared to<br />
present<br />
Source: Impact of <strong>Climate</strong> <strong>Change</strong> on River Discharge Projected<br />
by Multimodel Ensemble<br />
Nohara et al. Journal of Hydrometeorology, 2006<br />
5
3/10/2010<br />
<strong>Climate</strong> change and adaptive management <strong>for</strong> conservation<br />
<strong>Climate</strong> model output = parameters such as temperature, wind circulation and<br />
precipitation<br />
What in<strong>for</strong>mation do we actually need?<br />
• precipitation amount – how much will it rain?<br />
• extreme events – floods and droughts<br />
• seasonality – when will it rain?<br />
• evaporation – how much water will be lost from soils, vegetation, water bodies?<br />
• river flows – how will <strong>the</strong>y change?<br />
• grasslands and <strong>for</strong>ests – will <strong>the</strong>y change in extent and species composition?<br />
• fire and pests – how will disturbance regimes change?<br />
• human/wildlife health – how will sickness and disease characteristics change?<br />
-- etc.<br />
Challenge is to create more meaningful products to in<strong>for</strong>m conservation needs<br />
River discharge changes in 2100<br />
derived product combining modeled precipitation and evaporation<br />
Impact of <strong>Climate</strong> <strong>Change</strong> on River Discharge Projected by Multimodel Ensemble<br />
Nohara et al.,Journal of Hydrometeorology, 2006<br />
6
3/10/2010<br />
The WCS Albertine Rift <strong>Climate</strong> Assessment Project<br />
(2007-2009)<br />
Climatological l i l analysis and linked climate-vegetation-crop t ti modeling<br />
2010<br />
2025?<br />
Output summarized in two whitepapers currently under revision:<br />
1. Climatological Assessment of <strong>the</strong> Albertine Rift <strong>for</strong> <strong>Conservation</strong><br />
Applications<br />
2. Potential <strong>Climate</strong> <strong>Change</strong> Impacts in <strong>Conservation</strong> Landscapes of <strong>the</strong><br />
Albertine Rift<br />
All project data and reports will be obtainable from <strong>the</strong> project website:<br />
http://programs.wcs.org/Resources/Downloads/tabid/2801/Default.aspx<br />
Comprehensive Monitoring <strong>for</strong> <strong>Climate</strong> <strong>Change</strong><br />
Adaptation and Management in <strong>the</strong> Albertine Rift<br />
Protected Area Network (2009-2012)<br />
Three aims:<br />
• to build <strong>the</strong> human and infrastructural capacity of Albertine Rift<br />
countries to collect accurate data about climate, vegetation, and <strong>the</strong><br />
impact of climate change on wildlife<br />
• prioritize wildlife and habitat migration corridors based on this data<br />
and on modeling<br />
• to provide all of this in<strong>for</strong>mation in readily usable <strong>for</strong>m to policymakers<br />
through reports and briefings <strong>for</strong> NAPA task<strong>for</strong>ce teams,<br />
protected area authorities, and o<strong>the</strong>r implementing agents<br />
Schematic diagram demonstrating <strong>the</strong> procedure used to generate<br />
ecologically meaningful products specific to <strong>the</strong> Albertine Rift study domain<br />
from raw, low resolution GCM output<br />
7
3/10/2010<br />
The WCS Albertine Rift modeling domain<br />
showing key conservation landscapes<br />
(see http://www.albertinerift.org)<br />
Downscaled climate variables across <strong>the</strong><br />
entire domain<br />
1. Climatological variables<br />
• Monthly mean temperature (°C)<br />
• Monthly mean precipitation amount (mm)<br />
• Monthly mean cloud cover (percent of sky coverage)<br />
2. Carbon Fluxes<br />
• Net Primary Production (NPP)<br />
• Land-Atmosphere flux<br />
• Carbon Loss from Fire<br />
• Heterotrophic respiration (Rh)<br />
3. Carbon Pools<br />
• Vegetation Carbon<br />
• Soil Carbon<br />
• Litter Carbon<br />
• Annual Total Carbon<br />
4. Hd Hydrological lVariables<br />
ibl<br />
• Total Runoff (mm)<br />
• Actual Evapotranspiration (mm)<br />
5. Vegetation and agriculture<br />
• Annual Phaseolus Bean Yield (kg ha)<br />
• Annual Brachiariadecumbens Yield (kg ha)<br />
• Annual Maize Yield (kg ha)<br />
• Fractional Cover of Plant Functional Type (%)<br />
8
3/10/2010<br />
9
3/10/2010<br />
10
)<br />
3/10/2010<br />
Modeled change in<br />
maize yield by 2090<br />
under <strong>the</strong> A2 IPCC<br />
scenario<br />
Increased pressure<br />
on mountain gorilla<br />
domain as a<br />
consequence of yield<br />
reductions elsewhere?<br />
Mountain Gorilla Domain<br />
IPCC 21 st century predicted rainfall trends<br />
A2 emissions scenario<br />
225<br />
Precipitation<br />
(mm)<br />
175<br />
125<br />
75<br />
25<br />
-25<br />
Jan Feb Mar Apr May Jun Jul Aug Sep Oct Nov Dec<br />
monthly rainfall<br />
1990<br />
2030<br />
2060<br />
2090<br />
n<br />
Precipitation<br />
change (mm<br />
50<br />
40<br />
30<br />
20<br />
10<br />
0<br />
-10<br />
Jan Feb Mar Apr May Jun<br />
Jul Aug Sep Oct Nov Dec<br />
1990<br />
2030<br />
2060<br />
2090<br />
rainfall change relative to 1990 means<br />
11
3/10/2010<br />
Temperature seasonality across <strong>the</strong> mountain gorilla domain: 1990-<br />
2090 (A2 scenario )<br />
Precipitation<br />
(mm)<br />
225<br />
175<br />
125<br />
75<br />
25<br />
-25<br />
Jan Feb Mar Apr May Jun Jul Aug Sep Oct Nov Dec<br />
1990<br />
2030<br />
2060<br />
2090<br />
Tempera ature (°C)<br />
28<br />
26<br />
24<br />
22<br />
20<br />
18<br />
16<br />
14<br />
Jan Feb Mar Apr May Jun Jul Aug Sep Oct Nov Dec<br />
1990<br />
2030<br />
2060<br />
2090<br />
rainfall rate (mm/day)<br />
Bwindi Im penetrable Forest National Park, U ganda<br />
daily precipitation rate 1991-2006 at R uhija<br />
10<br />
9<br />
8<br />
7<br />
6<br />
5<br />
4<br />
3<br />
2<br />
1<br />
0<br />
1-Jan 1-Feb 1-M ar 1-Apr 1-M ay 1-Jun 1-Jul 1-Aug 1-Sep 1-O ct 1-Nov 1-Dec<br />
m onthly m ean 7-day running m ean<br />
Temperature Cha ange<br />
(°C)<br />
5<br />
4<br />
3<br />
2<br />
1<br />
0<br />
Jan Feb Mar Apr May Jun Jul Aug Sep Oct Nov Dec<br />
1990<br />
2030<br />
2060<br />
2090<br />
Plant Functional Type across <strong>the</strong> mountain gorilla domain:<br />
1990-2090 (A2 scenario )<br />
- Currently dominated by Tropical Broadleaf Evergreen (84%)<br />
with Tropical Broadleaf Raingreen(10%)<br />
- Very little change indicated over <strong>the</strong> century across <strong>the</strong> domain<br />
--Suggests that existing <strong>for</strong>ests will remain extant<br />
1.00<br />
A2 scenario vegetation response – mountain gorilla domain<br />
apotranspiration<br />
(mm)<br />
Actual eva<br />
840<br />
810<br />
780<br />
750<br />
720<br />
690<br />
660<br />
630<br />
600<br />
1990 2030 2060 2090<br />
aet<br />
0.90<br />
0.80<br />
PFT Fractiona al Coverage<br />
0.70<br />
0.60<br />
0.50<br />
0.40<br />
0.30<br />
0.20<br />
0.10<br />
0.00<br />
trbe trbr tene tebe tebs c3pg c4pg<br />
1990<br />
2030<br />
2060<br />
2090<br />
Runoff (mm)<br />
800<br />
700<br />
600<br />
500<br />
400<br />
300<br />
200<br />
100<br />
runoff<br />
0<br />
1990 2030 2060 2090<br />
12
3/10/2010<br />
Acknowledgements<br />
Guy PictonPhillipps, Tracie Seimon, Steve Osofsky and David Cummings<br />
The John D. and Ca<strong>the</strong>rine T. MacArthur Foundation<br />
13