CBOE S&P 500 95-110 Collar Index (CLL) - CBOE.com
CBOE S&P 500 95-110 Collar Index (CLL) - CBOE.com
CBOE S&P 500 95-110 Collar Index (CLL) - CBOE.com

Create successful ePaper yourself
Turn your PDF publications into a flip-book with our unique Google optimized e-Paper software.
<strong>CBOE</strong> ® S&P <strong>500</strong> <strong>95</strong>-<strong>110</strong> <strong>Collar</strong> <strong>Index</strong> (<strong>CLL</strong>)<br />
I. Description of <strong>CBOE</strong> ® S&P <strong>500</strong> <strong>Collar</strong> <strong>Index</strong> <strong>Index</strong> Design<br />
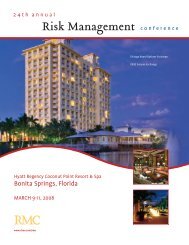
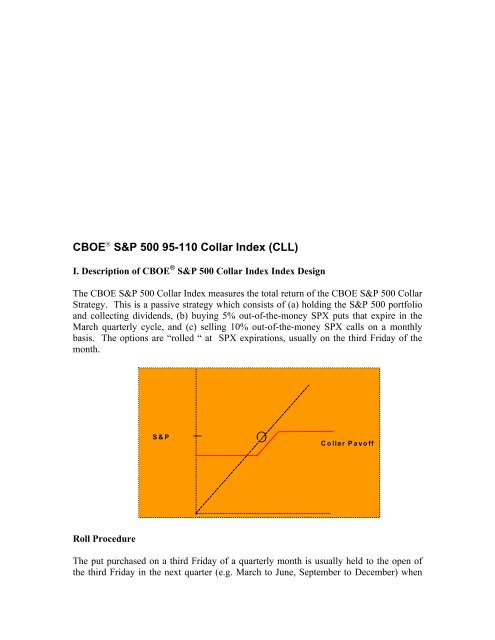
The <strong>CBOE</strong> S&P <strong>500</strong> <strong>Collar</strong> <strong>Index</strong> measures the total return of the <strong>CBOE</strong> S&P <strong>500</strong> <strong>Collar</strong><br />
Strategy. This is a passive strategy which consists of (a) holding the S&P <strong>500</strong> portfolio<br />
and collecting dividends, (b) buying 5% out-of-the-money SPX puts that expire in the<br />
March quarterly cycle, and (c) selling 10% out-of-the-money SPX calls on a monthly<br />
basis. The options are “rolled “ at SPX expirations, usually on the third Friday of the<br />
month.<br />
S&P<br />
<strong>Collar</strong> Pay off<br />
Roll Procedure<br />
The put purchased on a third Friday of a quarterly month is usually held to the open of<br />
the third Friday in the next quarter (e.g. March to June, September to December) when
SPX options expire, and it is settled to the Special Opening Quotation (SOQ) of the S&P<br />
<strong>500</strong>. A new three-month put is then purchased at the volume weighted average ask price<br />
from 11:30 to 12:00 ET. The strike price of the new put is equal to <strong>95</strong>% of the value of<br />
the S&P <strong>500</strong> reported just before 11:00 AM ET. If this strike is not listed, the closest<br />
strike below is selected.<br />
The call sold monthly is held to the next monthly SPX expiration and is also settled to the<br />
SOQ. A new call expiring in the next month is then purchased at the volume weighted<br />
average price (VWAP) ask price from 11:30 to 12:00 ET. The strike price of the new<br />
call is equal to <strong>110</strong>% of the value of the S&P <strong>500</strong> reported just before 11:00 AM ET. If<br />
this strike is not listed, the closest strike above is selected.<br />
If the strike of the call is smaller than the strike of the standing put on a non-quarterly roll<br />
date, that put is sold and replaced by a new 5% OTM put with the same quarterly<br />
expiration. Such roll dates are called “cross-roll” dates.<br />
The <strong>CBOE</strong> S&P <strong>500</strong> <strong>Collar</strong> <strong>Index</strong> portfolio is first assembled on June 20, 1986, the first<br />
quarterly roll date, and the index value is rescaled to 100 as of June 30, 1986. This date<br />
is set earlier than the base date of the BXM (June 1, 1988) to see how the <strong>Collar</strong> Strategy<br />
would have performed in October 1987. It requires estimation of daily dividends from<br />
June 20, 1988 to June 1, 1988, when Standard and Poor’s first started to disseminate<br />
these.<br />
Subsequent values of the index are calculated by chaining daily returns, i.e. the index<br />
value at the close of a day is equal to its value at the previous close times the gross daily<br />
return. Equivalently, the index value is equal to 100 times the <strong>com</strong>pounded daily returns<br />
since inception.<br />
I t = I t-1 (1+R t ) = 100 * П (1+R s ) s= 1, …,t<br />
where I t is the value of the index at the close of date t, and 1+ R t is its gross daily return<br />
Calculation of Daily Returns<br />
The calculation of daily returns <strong>com</strong>pounded to obtain the <strong>CBOE</strong> S&P <strong>500</strong> <strong>Collar</strong> <strong>Index</strong><br />
is similar to the calculation of BXM daily returns :<br />
On all but roll dates, the gross daily return of the <strong>CBOE</strong> <strong>Collar</strong> <strong>Index</strong> is equal to the ratio<br />
of the index portfolio at the current and previous closes:<br />
1 + R S + Div + P − C ) /( S + P − C )<br />
t<br />
= (<br />
t t t t t−1 t−1<br />
t−1<br />
where S t is the value of the index at the close of date t, Div t is the aggregate value of<br />
ordinary cash dividends payable on index <strong>com</strong>ponent stocks that trade “ex-dividend” at
date t expressed in index points, and P t and C t are the arithmetic averages of the last bid<br />
and ask prices of the put and call options reported before 4:00 p.m. ET at date t.<br />
On roll dates, the gross daily return is <strong>com</strong>pounded from three returns: (1) the return from<br />
the previous close to 11:00 a.m. ET, after the final settlement of expiring options, (2) the<br />
return from 11:00 a.m. ET to 12:00 a.m. ET when the <strong>CBOE</strong> <strong>com</strong>pletes the calculation of<br />
half-hour volume-weighted prices for the new call sold, the new put bought, if a quarterly<br />
roll, and the stock index, and (3) the return from 12:00 a.m. to the close of trading.<br />
Case 1: Non Quarterly Call Roll Dates<br />
Case 2: Quarterly Roll Dates<br />
1+<br />
R<br />
t<br />
= (1 + Ra<br />
) × (1 + Rb<br />
) × (1 + Rc<br />
)<br />
where:<br />
1+ a<br />
t 11 Settle t−1<br />
t−1<br />
t−1<br />
R = ( SOQ + Div + P − C ) /( S + P − C ) ,<br />
1<br />
b VWAP 12<br />
+ P11<br />
+ R = ( S + P ) /( SOQ ) , and<br />
1+<br />
Rc<br />
= ( St+<br />
Pt<br />
− Ct<br />
) /( SVWAP<br />
+ P12 − CVWAP<br />
)<br />
1+ a<br />
t Settle Settle t−1 t−1<br />
t−1<br />
R = ( SOQ + Div + P − C ) /( S + P − C ) ,<br />
1+ R ( S ) /( SOQ ) , and<br />
b<br />
=<br />
VWAP<br />
1+<br />
Rc<br />
= ( St+<br />
Pt<br />
− Ct<br />
) /( SVWAP<br />
+ PVWAP<br />
− CVWAP<br />
)<br />
Case 3: Cross Roll Dates<br />
1+ a<br />
t 11 Settle t−1<br />
t−1<br />
t−1<br />
R = ( SOQ + Div + P − C ) /( S + P − C ) ,<br />
1<br />
b VWAP VWAP<br />
+<br />
11<br />
old<br />
+ R = ( S + P ) /( SOQ P ) , and<br />
new<br />
1+<br />
Rc<br />
= ( St+<br />
Pt<br />
− Ct<br />
) /( SVWAP<br />
+ PVWAP<br />
− CVWAP<br />
)<br />
where SOQ is the Special Opening Quotation of the S&P <strong>500</strong> used as Final Settlement<br />
Price of SPX options, P 11 and P 12 are the average of the last bids and asks of the put<br />
before 11:00 a.m. and 12:p.m ET, P old VWAP and P new VWAP are the prices at which the old<br />
put is sold and the new put bought on cross-roll dates, C Settle = max[0, SOQ- K c ] where K c<br />
is the strike price of the expiring call, and S VWAP , P Settle = max[0,K p - SOQ] where K p is
the strike price of the expiring put, and S VWAP , C VWAP and P VWAP are the volume-weighted<br />
average values of the S&P <strong>500</strong>, call and put respectively.<br />
Notes<br />
(1) The calculation used to generate a historical series of the index differs slightly from<br />
the procedure above because historical intra-day volume data are not available and<br />
because SPX options were settled at the close before November 20, 1992.<br />
(2) The price of the stock index and index dividends are obtained from Bloomberg, index<br />
option prices are obtained from <strong>CBOE</strong>’s time and sales data which are publicly<br />
disseminated through the Option Price and Reporting System. Daily dividends from June<br />
20, 1986 to June 1, 1988 are estimated from monthly dividends available over this period.<br />
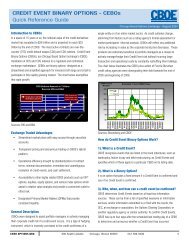
II. Impact of <strong>CLL</strong> on S&P <strong>500</strong> Portfolio<br />
Portfolio managers looking for ways to collar market risk will find <strong>CBOE</strong> ® s S&P <strong>500</strong><br />
<strong>95</strong> -<strong>110</strong> <strong>Collar</strong> <strong>Index</strong> (<strong>CLL</strong>) a convenient benchmark. This collar overlays an SPX bear<br />
spread (long put and short call) on the S&P <strong>500</strong>, the accepted proxy for U.S. stock market<br />
performance. The SPX put protects an investor from market declines and the SPX call<br />
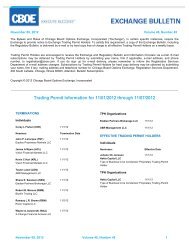
helps finance the put. As seen in Table 1 and Chart 1, a collar trades a ceiling on S&P<br />
<strong>500</strong> gains for a floor on S&P <strong>500</strong> losses. The terms of this exchange vary with the<br />
parameters of the collar, but the result is always a more <strong>com</strong>pact distribution of returns<br />
with shorter left and right tails, in other words, less risk and less return.<br />
Table 1. Five Worst and Five Best S&P <strong>500</strong> Total Returns (SPTR)<br />
Month-End Returns, June 1986 – September 2009<br />
SPTR BXM <strong>CLL</strong><br />
10/30/1987 -21.61% -17.42% -8.57%<br />
10/31/2008 -16.79% -15.13% -3.82%<br />
8/31/1998 -14.46% -11.83% -7.73%<br />
9/30/2002 -10.87% -7.35% -3.41%<br />
2/27/2009 -10.65% -6.34% -5.42%<br />
SPTR BXM <strong>CLL</strong><br />
4/30/2009 9.57% 3.77% 5.57%<br />
5/31/1990 9.75% 4.53% 8.27%<br />
3/31/2000 9.78% 4.88% 7.87%<br />
12/31/1991 11.44% 5.29% 6.70%<br />
1/30/1987 13.39% 5.15% 10.03%<br />
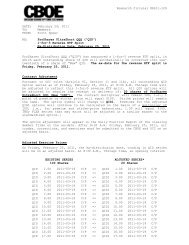
Chart 1. Frequency Distributions of Returns
Frequency of Returns<br />
25%<br />
Freuqency of Occurrence<br />
20%<br />
15%<br />
10%<br />
5%<br />
<strong>CLL</strong> <strong>95</strong> <strong>110</strong><br />
SPTR<br />
0%<br />
-0.22<br />
-0.18<br />
-0.14<br />
-0.1<br />
-0.06<br />
-0.02<br />
0.02<br />
0.06<br />
0.1<br />
0.14<br />
Rate of Return Roll Date to Roll Date<br />
The degree of protection offered by a collar and its cost in terms of foregone return<br />
depend on several factors, the moneyness of the options, their time to expiration, and<br />
their relative richness. For example, lowering the strike of the call provides more<br />
cushioning on the downside because the call garners more premium. The tradeoff is<br />
more truncation of upside returns. Similarly, increasing the strike of the put raises the<br />
floor but costs more, as does buying the put on a monthly as opposed to a quarterly basis.<br />
Analyzing these different tradeoffs, one finds there is no unique “best” collar, simply<br />
because investors have different <strong>com</strong>fort zones in risk-return space. This said, a collar<br />
benchmark calls for some intermediate level between the characteristics of investments in<br />
Treasury bills and the S&P <strong>500</strong>, and it also calls for preservation of a reasonable chunk of<br />
the upside potential, which even fairly risk averse investors are reluctant to give up.<br />
Amidst the countless possible <strong>com</strong>binations, a collar index that fits this description is the<br />
collar based on buying 5% out-of-the-money puts on a quarterly basis, and selling 10%<br />
out-of-the-money calls on a monthly basis. The <strong>CLL</strong> is therefore based on this<br />
<strong>com</strong>bination.<br />
III. Historical Performance of <strong>CBOE</strong> ® S&P <strong>500</strong> <strong>Collar</strong> <strong>Index</strong><br />
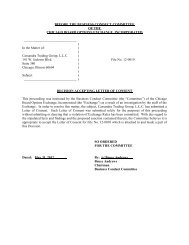
Since 1986, the <strong>CBOE</strong> S&P <strong>500</strong> <strong>Collar</strong> <strong>Index</strong> has protected investors from several large<br />
market downturns while delivering a solid overall performance. In rapidly rising market,<br />
its monthly rate of return has been intermediate between the BXM and S&P <strong>500</strong> rates of<br />
return. As expected, the <strong>CBOE</strong> S&P <strong>500</strong> <strong>Collar</strong> <strong>Index</strong> has outperformed both the S&P<br />
<strong>500</strong> and BXM in bearish markets. In bullish markets, it has done slightly better than the<br />
BXM and worse than the S&P <strong>500</strong>. In between, an S&P <strong>500</strong> range of –5% to 0, it has<br />
underperformed the S&P <strong>500</strong> and BXM.<br />
Chart 2 Performance of <strong>CLL</strong> June 1986 – September 2009
June 1986 - September 2009<br />
1000<br />
900<br />
800<br />
700<br />
600<br />
SPTR<br />
BXM<br />
<strong>CLL</strong><br />
<strong>500</strong><br />
400<br />
300<br />
200<br />
100<br />
6/30/1986<br />
6/30/1987<br />
6/30/1988<br />
6/30/1989<br />
6/30/1990<br />
6/30/1991<br />
6/30/1992<br />
6/30/1993<br />
6/30/1994<br />
6/30/19<strong>95</strong><br />
6/30/1996<br />
6/30/1997<br />
6/30/1998<br />
6/30/1999<br />
6/30/2000<br />
6/30/2001<br />
6/30/2002<br />
6/30/2003<br />
6/30/2004<br />
6/30/2005<br />
6/30/2006<br />
6/30/2007<br />
6/30/2008<br />
6/30/2009<br />
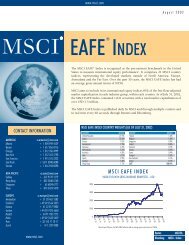
Chart 3 Performance of <strong>CLL</strong> in Different Market Environments<br />
Performance of <strong>CLL</strong> in Different Market Environments<br />
10%<br />
5%<br />
0%<br />
-5%<br />
-10%<br />
-15%<br />
-20%<br />
Impact of Aug 2008<br />
100<br />
90<br />
80<br />
70<br />
60<br />
<strong>CLL</strong><br />
SPTR<br />
BXM<br />
50<br />
40<br />
6/2/2008<br />
7/2/2008<br />
8/2/2008<br />
9/2/2008<br />
10/2/2008<br />
11/2/2008<br />
12/2/2008<br />
1/2/2009<br />
2/2/2009<br />
3/2/2009<br />
4/2/2009<br />
5/2/2009<br />
6/2/2009<br />
7/2/2009<br />
8/2/2009<br />
9/2/2009<br />
Impact of Oct 19, 1987<br />
105.00<br />
100.00<br />
<strong>95</strong>.00<br />
90.00<br />
85.00<br />
80.00<br />
75.00<br />
<strong>CLL</strong><br />
BXM<br />
SPTR<br />
70.00<br />
65.00<br />
9/1/1987<br />
9/15/1987<br />
9/29/1987<br />
10/13/1987<br />
10/27/1987<br />
11/10/1987<br />
11/24/1987<br />
12/8/1987<br />
12/22/1987
Table 2 Descriptive Statistics<br />
Monthly Return<br />
Descriptive Statistics<br />
June 1986 - September 2009<br />
1 month<br />
T-Bill Rate <strong>CLL</strong> BXM SPTR<br />
Min 0.00% -8.57% -17.42% -21.61%<br />
Max 0.72% 10.03% 8.17% 13.39%<br />
Arithmetic Avge 0.34% 0.62% 0.79% 0.81%<br />
Geometric Avge (Anualized) 0.34% 7.00% 9.17% 8.82%<br />
Median 0.37% 0.75% 1.29% 1.29%<br />
Std. Dev. 3.20% 3.24% 4.58%<br />
Negative Semi-Deviation 1.88% 3.49% 3.62%<br />
Positive Semi-Deviation 1.<strong>95</strong>% 1.63% 2.53%<br />
Skew -0.14 -1.78 -0.87<br />
Kurtosis -0.05 6.68 2.56<br />
Sharpe Ratio 0.09 0.14 0.10<br />
Semi-Sharpe Ratio 0.15 0.13 0.13<br />
In Table 2, the <strong>CLL</strong>’s arithmetic mean rate of return is seen to be approximately midway<br />
between the T-Bill and SPTR rates; its geometric mean is about 75% the SPTR rate. The<br />
<strong>CLL</strong> significantly decreases the negative skew of the SPTR, from -.87 to -.14. This<br />
suggests not to overrely on the standard deviation to <strong>com</strong>pare risks, or on the Sharpe<br />
ratios to measure risk-adjusted performance. The semi-Sharpe ratio, based on the<br />
standard deviation of negative returns is a better measure of risk-adjusted performance in<br />
this context. By this criterion, the differences between the different benchmards do not<br />
look significant. Each serves a different clientele of investors, with certain preferences<br />
for risk and return. The <strong>CLL</strong> is targeted at investors seeking an intermediate exposure<br />
between the S&P <strong>500</strong> and a riskless investment.<br />
Options involve risk and are not suitable for all investors. Prior to buying or selling an option, a<br />
person must receive a copy of Characteristics and Risks of Standardized Options (the “ODD”).<br />
The ODD and supporting documentation for any claims, <strong>com</strong>parisons, re<strong>com</strong>mendations,<br />
statistics or other technical data in these materials are available by calling 1-888-OPTIONS, or<br />
contacting <strong>CBOE</strong> at www.cboe.<strong>com</strong>/Contact. The information in these materials is provided<br />
solely for general education and information purposes and therefore should not be considered<br />
<strong>com</strong>plete, precise, or current. Many of the matters discussed are subject to detailed rules,<br />
regulations, and statutory provisions which should be referred to for additional detail and are<br />
subject to changes that may not be reflected in these materials. No statement within this material<br />
should be construed as a re<strong>com</strong>mendation to buy or sell a security or to provide investment<br />
advice. The <strong>CBOE</strong> S&P <strong>500</strong> <strong>95</strong>-10 <strong>Collar</strong> <strong>Index</strong> (<strong>CLL</strong> SM ),<strong>CBOE</strong> S&P <strong>500</strong> BuyWrite <strong>Index</strong><br />
(BXM SM ) and other <strong>CBOE</strong> buywrite indexes (the “<strong>Index</strong>es”) are designed to represent proposed<br />
hypothetical buy-write strategies. Like many passive benchmarks, the <strong>Index</strong>es do not take into<br />
account significant factors such as transaction costs and taxes. Transaction costs and taxes for a<br />
buy-write strategy could be significantly higher than transaction costs for a passive strategy of<br />
buying-and-holding stocks. Investors attempting to replicate the <strong>Index</strong>es should discuss with their<br />
brokers possible timing and liquidity issues. Past performance does not guarantee future results.<br />
These materials contain <strong>com</strong>parisons, assertions, and conclusions regarding the performance of<br />
indexes based on backtesting, i.e., calculations of how the indexes might have performed in the<br />
past if they had existed. The methodology of the <strong>Index</strong>es is owned by Chicago Board Options<br />
Exchange, Incorporated (<strong>CBOE</strong>) may be covered by one or more patents or pending patent<br />
applications. Standard & Poor's®, S&P®, and S&P <strong>500</strong>® are registered trademarks of The
McGraw-Hill Companies, Inc. and are licensed for use by <strong>CBOE</strong>. <strong>CBOE</strong>® and Chicago Board<br />
Options Exchange® are registered trademarks and BXM, BXD, BXN and BXY are servicemarks<br />
of <strong>CBOE</strong>. Copyright © 2008 Chicago Board Options Exchange, Incorporated. All Rights<br />
Reserved.<br />
http://www.cboe.<strong>com</strong>/<strong>CLL</strong>