GL900 USER'S MANUAL - Graphtec
GL900 USER'S MANUAL - Graphtec
GL900 USER'S MANUAL - Graphtec

You also want an ePaper? Increase the reach of your titles
YUMPU automatically turns print PDFs into web optimized ePapers that Google loves.
Settings and Measurement<br />
(9)-8 Next Search<br />
Moves the cursor to a position after the current cursor position where the search conditions are met<br />
(Set the search conditions in Section (9)-7, "Level Settings").<br />
(9)-9 Prev. Search<br />
Moves the cursor to a position before the current cursor position where the search conditions are<br />
met (Set the search conditions in Section (9)-7, "Level Settings").<br />
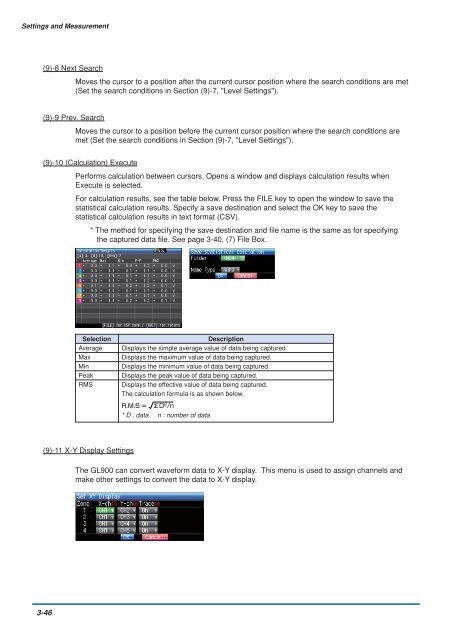
(9)-10 (Calculation) Execute<br />
Performs calculation between cursors. Opens a window and displays calculation results when<br />
Execute is selected.<br />
For calculation results, see the table below. Press the FILE key to open the window to save the<br />
statistical calculation results. Specify a save destination and select the OK key to save the<br />
statistical calculation results in text format (CSV).<br />
* The method for specifying the save destination and file name is the same as for specifying<br />
the captured data file. See page 3-40, (7) File Box.<br />
Selection<br />
Average<br />
Max<br />
Min<br />
Peak<br />
RMS<br />
Description<br />
Displays the simple average value of data being captured.<br />
Displays the maximum value of data being captured.<br />
Displays the minimum value of data being captured.<br />
Displays the peak value of data being captured.<br />
Displays the effective value of data being captured.<br />
The calculation formula is as shown below.<br />
<br />
* D : data n : number of data<br />
(9)-11 X-Y Display Settings<br />
The <strong>GL900</strong> can convert waveform data to X-Y display. This menu is used to assign channels and<br />
make other settings to convert the data to X-Y display.<br />
3-46