Annual REPORT
Annual REPORT
Annual REPORT

Create successful ePaper yourself
Turn your PDF publications into a flip-book with our unique Google optimized e-Paper software.
20<br />
09<br />
AnnuAl<br />
<strong>REPORT</strong>
VISION<br />
Charles Vögele is the number one choice<br />
for people in the prime of their lives<br />
who want to feel good and who are looking<br />
for the latest fashions at great prices.
09<br />
08<br />
07<br />
06<br />
05<br />
09<br />
08<br />
07<br />
06<br />
05<br />
09<br />
08<br />
07<br />
06<br />
05<br />
Gross sales in CHF million<br />
Net sales in CHF million<br />
1310<br />
1548<br />
1607<br />
1364<br />
1626<br />
1394<br />
1523<br />
1324<br />
1544<br />
1348<br />
0 400 800 1 200 1 600 2 000<br />
EBITDA in CHF million<br />
EBIT in CHF million<br />
4<br />
48<br />
0 40 80 120 160 200<br />
Net profit in CHF million<br />
–14<br />
12<br />
71<br />
GrOup key FIGureS<br />
2005 – 2009<br />
−20 0 20 40 60 80<br />
95<br />
86*<br />
113<br />
109<br />
143<br />
156<br />
55*<br />
165<br />
*before impairment of goodwill of CHF 74 million<br />
61<br />
70<br />
09<br />
08<br />
07<br />
06<br />
05<br />
09<br />
08<br />
07<br />
06<br />
05<br />
09<br />
08<br />
07<br />
06<br />
05<br />
09<br />
08<br />
07<br />
06<br />
05<br />
Net debt<br />
15<br />
0 40 80 120 160 200<br />
Cash flow from operating activities in CHF million<br />
73<br />
103<br />
111<br />
143<br />
188<br />
0 40 80 120 160 200<br />
Branches<br />
139<br />
152<br />
156<br />
857<br />
851<br />
825<br />
809<br />
791<br />
167<br />
0 200 400 600 800 1 000<br />
Employees<br />
7729<br />
7888<br />
7811<br />
7370<br />
7285<br />
0 2 000 4 000 6 000 8 000 10 000
CHF million 2009 2008 Change<br />
Gross sales 1 548 1 607 (3.7%)<br />
Change adjusted for currency in % 0.2% 1.0%<br />
Change adjusted for expansion and currency in % (2.6%) (2.1%)<br />
Net sales 1 310 1 364 (3.9%)<br />
Operation earnings before depreciation and impairment (EBITDA) 71 113 (36.8%)<br />
Operation earnings (EBIT) 4 48 (91.4%)<br />
Net profit of the year (14) 12 (211.3%)<br />
Net cash flow from operating activities 188 103 81.4%<br />
Net cash provided/ (used) in investing activities (46) (79) (42.5%)<br />
Free cash flow 142 24 485.7%<br />
Number of stores at year-end 857 851 0.7%<br />
Sales area at year-end in m 2 670 985 666 162 0.7%<br />
Number of employees at year-end 1) 7 729 7 888 (2.0%)<br />
Average number of full-time employees on an annual basis 1) 5 036 5 071 (0.7%)<br />
Net sales per average number of full-time employees in CHF 1) 260 176 268 974 (3.3%)<br />
Number of clothing articles sold in 1000 69 698 63 713 9.1%<br />
Average net sales per article in CHF 18.8 21.4 (12.1%)<br />
Share of turnover in %:<br />
– women‘s wear 58% 58% –<br />
– men‘s wear 32% 32% –<br />
– children‘s wear 10% 10% –<br />
CHF million 31.12.2009 31.12.2008<br />
Net debt 15 152<br />
Shareholders‘ equity 484 495<br />
Balance sheet total 818 892s<br />
Shareholders' equity in % of balance sheet total 59% 56%<br />
1) Excluding apprentices<br />
GrOup key<br />
OperatING FIGureS
2<br />
3<br />
5<br />
7<br />
9<br />
13<br />
14<br />
15<br />
16<br />
17<br />
18<br />
20<br />
26<br />
Key Financials<br />
HigHligHts<br />
chairman’s Message<br />
ceO’s Report<br />
group Report<br />
Overview of Regions<br />
switzerland Region<br />
germany Region<br />
austria/slovenia Region<br />
Benelux Region<br />
cee Region<br />
corporate social Responsibility<br />
charles Vögele Holding ag<br />
CONTENTS<br />
29<br />
cORpORate gOVeRnance<br />
Financial RepORt
Currency-adjusted gross sales at previous year’s<br />
level. With the economic environment still diffi-<br />
cult, gross sales fell from CHF 1 607 million to<br />
CHF 1 548 million. After adjusting for currency in-<br />
fluence, there was an increase of 0.2%, and<br />
after adjusting for both currency movements and<br />
changes in retail area there was a fall of 2.6%.<br />
13<br />
Inventories reduced by 13 million items during the<br />
year under review. During 2009, inventories were<br />
reduced by 13 million items, worth CHF 109 million.<br />
A modified discounting policy ensures that from<br />
the end of March 2010 there will be no articles older<br />
than 18 months.<br />
Operating expenses reduced by CHF 19 million.<br />
Thanks to prompt cost-saving measures, currencyadjusted<br />
operating expenses were reduced by<br />
CHF 19 million to CHF 731 million.<br />
EBITDA at CHF 71 million despite clear-out of old<br />
stock. The clear-out of old stock and the modified<br />
discounting policy knocked about CHF 40 million<br />
off gross profit. Despite the substantial stock clearance,<br />
EBITDA came to CHF 71 million.<br />
Net result of CHF – 14 million. The one-off, largescale<br />
streamlining of inventories also had an<br />
effect on the net result, turning it into a loss of<br />
CHF – 14 million.<br />
KEY FINANCIALS<br />
2<br />
142<br />
Free cash flow up significantly to CHF 142 million.<br />
Free cash flow rose by CHF 118 million, from<br />
CHF 24 million to CHF 142 million, mainly thanks to<br />
the targeted reduction of old stock and cautious<br />
investment activity at a low level.<br />
Solid equity ratio of 59%. The equity ratio rose from<br />
56 to 59%, reflecting the very good balance sheet<br />
structure.<br />
15<br />
Net debt at lowest-ever CHF 15 million. Net debt<br />
was reduced from CHF 152 million to CHF 15 million.<br />
The company’s CHF 250 million credit facility is<br />
available in full and is secured until mid-2012.
Own sourcing offices in India and Bangladesh. At the<br />
beginning of November 2009, Charles Vögele Group<br />
took procurement in India and Bangladesh into its<br />
own hands. Purchasing activities in Hong Kong and<br />
Shanghai were brought in-house three years ago.<br />
Introduction of state-of-the-art store design concept.<br />
In September 2009, the new store design concept<br />
was introduced in the Metzingen store in Germany.<br />
Two more pilot stores were opened in Weinfelden<br />
Advertising campaigns made more emotional for<br />
specific target groups. From autumn 2009, the company’s<br />
advertising campaigns were made more<br />
emotional for specific target groups and the mar-<br />
HIgHLIgHTS<br />
3<br />
This puts the company in control of another link<br />
in the value chain – a significant competitive advantage<br />
for a vertically integrated business.<br />
and Lancy in Switzerland. The lessons learned<br />
from these stores are being put into practice at the<br />
end of March 2010 in the new flagship store in<br />
Zurich.<br />
keting mix was adjusted accordingly. The aim is to<br />
improve the image of the overall brand while also<br />
sharpening up the profile of the Casablanca, Biaggini<br />
and Kingfield brands.<br />
Key Facts<br />
Chairman’s Message<br />
CEO’s Report<br />
group Report<br />
Regional Report<br />
Corporate Social Responsibility<br />
Corporate governance<br />
Financial Report
Dear shareholders<br />
CHAIRMAN’S MESSAgE<br />
The 2009 financial year was marked by the con-<br />
tinuing difficult economic climate in all European<br />
markets. Rising unemployment weighed down<br />
on consumer sentiment, and this had a particularly<br />
harsh effect on the clothing sector. Many of our<br />
competitors responded to this market environment<br />
with price cuts or further expansion to compen-<br />
sate for the decline in sales.<br />
Business performance 2009<br />
The fact that Charles Vögele Group managed to<br />
generate gross sales of CHF 1 548 million (previous<br />
year: CHF 1 607 million) in this highly competitive<br />
environment can be attributed not least to its positioning.<br />
In difficult economic times, customers<br />
attach particular importance to value for money;<br />
their purchasing tends to be driven more by need<br />
than by fashion. However, the substantial and<br />
exceptional clear-out of old stock and the switch<br />
to a new discounting policy resulted in a net loss<br />
for 2009 of CHF – 14 million. This was expected and<br />
planned for: the massive clear-out is an essential<br />
precondition for the achievement of our strategic<br />
objectives.<br />
Changes in the Board of Directors and<br />
Group Management<br />
2009 was a year of change for Charles Vögele Group<br />
on all fronts. There were comings and goings on<br />
both senior management bodies. More detailed infor-<br />
mation about the changes made in the first half of<br />
the year was given in the 2009 half-year report. As<br />
announced, Markus Voegeli has been the new CFO<br />
since October 2009. He succeeds Dr. Felix Thöni.<br />
Dr. Dirk Seifert (COO) is also leaving the company,<br />
and the search for his successor has begun.<br />
We would like to thank our departing colleagues for<br />
their hard work in the management team and for<br />
Charles Vögele Group in general. We wish them all<br />
the best for the future.<br />
5<br />
Implementing the findings from the strategic review<br />
Following the Shareholders’ Meeting of April 2009,<br />
the Board of Directors carried out a strategic review<br />
in collaboration with Group Management. Based<br />
on the findings of this review, strategic objectives<br />
were defined and numerous operational measures<br />
were initiated (see pages 9 to 12).<br />
The branch portfolio is being reviewed as part of<br />
our potential-oriented expansion strategy. The<br />
greatest potential was identified in our main markets,<br />
and our declared goal is to keep building<br />
on our strong position in these markets, and to<br />
increase like-for-like sales.<br />
Outlook<br />
In view of the negative earnings position, and in line<br />
with the company's dividend policy, the Board of<br />
Directors will not be proposing a distribution of<br />
profits at the Shareholders' Meeting. The operating<br />
environment for the clothing market is unlikely to<br />
improve significantly this year. If unemployment<br />
continues to rise, this will have a noticeable impact<br />
on consumer behaviour. Nevertheless, the Board of<br />
Directors and Group Management are confident<br />
that the measures taken will move the group back<br />
into profit this financial year. The medium-term aim<br />
is an EBITDA margin of 10%.<br />
In the name of the Board of Directors I would like to<br />
thank you for your trust and loyalty, and I would like<br />
to thank our employees for their commitment.<br />
Yours sincerely<br />
Alain Caparros, Chairman of the Board of Directors<br />
Key Facts<br />
Chairman’s Message<br />
CEO’s Report<br />
group Report<br />
Regional Report<br />
Corporate Social Responsibility<br />
Corporate governance<br />
Financial Report
Dear shareholders<br />
2009 was one of the most turbulent years in<br />
Charles Vögele Group’s 55-year history. The whole<br />
company underwent a thorough renewal at all<br />
levels. Some of the measures introduced since I<br />
entered my position in February 2009 have al-<br />
ready been completed. At the beginning of November,<br />
for example, we took procurement in India<br />
and Bangladesh into our own hands. This puts<br />
Charles Vögele Group in control of another link in<br />
the value chain – a significant competitive ad-<br />
vantage for a vertically integrated company like<br />
ours. No less important for us were the development<br />
of a new store design concept and the infusion<br />
of more emotion into our advertising.<br />
Clear-out of old items reduces net profit<br />
Gross sales fell from CHF 1 607 million to<br />
CHF 1 548 million. The sell-off of the superfluous<br />
old stock identified in March (12 million items)<br />
is proceeding as planned. Two-thirds have already<br />
been sold thanks to additional price reductions.<br />
The clear-out and the modified discounting policy<br />
cut gross profit by about CHF 40 million. The<br />
gross profit margin went down temporarily from<br />
65.3% to 61.2%. We were able to cut operating<br />
costs (after adjusting for currency movements) by<br />
CHF 19 million to CHF 731 million by taking action<br />
promptly. Nevertheless it was impossible to stop<br />
EBITDA slipping from CHF 113 million to CHF 71 mil-<br />
lion, with the EBITDA margin going down from<br />
8.3% to 5.4%. After deducting depreciation, EBIT<br />
came in at CHF 4 million (previous year CHF 48<br />
million), a fall of CHF 44 million. Finance costs fell<br />
to CHF 8 million. Net profit for the year was CHF<br />
– 14 million.<br />
Strong free cash flow, low net debt<br />
Cash flow increased by CHF 85 million from the<br />
previous year’s CHF 103 million to CHF 188 million,<br />
thanks mainly to the clear-out of old stock. With<br />
investment activities at a low level, free cash flow<br />
was up by a substantial CHF 118 million, from<br />
CHF 24 million to CHF 142 million. There was a further<br />
reduction in net debt: at CHF 15 million,<br />
CEO’S REpORT<br />
7<br />
compared with CHF 152 million in the previous<br />
year, this item was lower than at any time since the<br />
company was first listed on the stock market. Its<br />
high equity ratio of 59% is further evidence of how<br />
solid the Group’s finances are.<br />
Changes to organisational and process structures<br />
Thanks to its strong balance sheet, the group was<br />
able to fund all the measures it initiated along the<br />
whole value chain from its own resources. Not only<br />
will the changes to the organisational and process<br />
structures have a positive effect on costs, they will<br />
also make the group’s processes faster and more<br />
efficient. This is allowing us to double the tempo of<br />
new collections from 4 to 8 a year, which in turn<br />
enables us continuously to present new colours and<br />
fashions on the sales floor.<br />
Purchasing is being reorganised by core competence<br />
into three departments: Brand Management,<br />
Procurement and Merchandise Management. This<br />
will help us to meet the rising standards required in<br />
brand management and procurement. In addition,<br />
Merchandise Management and Logistics are being<br />
centralised, which will help to make processes faster<br />
and more efficient.<br />
I would like to thank you, our valued shareholders,<br />
for your loyalty to the Charles Vögele Group. I would<br />
also like to thank all my colleagues for their great<br />
commitment and for their willingness to tackle the<br />
changes we face with such fortitude. Thanks also<br />
to our partners and suppliers for the good work we<br />
have done together.<br />
Yours sincerely<br />
André Maeder, CEO<br />
Key Facts<br />
Chairman’s Message<br />
CEO’s Report<br />
group Report<br />
Regional Report<br />
Corporate Social Responsibility<br />
Corporate governance<br />
Financial Report
From left to right:<br />
Markus Voegeli, CFO<br />
André Maeder, CEO<br />
Werner Lange, CPO<br />
8
RENEwAL AT ALL LEvELS<br />
since the end of March 2009, the company has been<br />
engaged in a massive, exceptional clear-out of old stock.<br />
this is the absolute prerequisite for a series of opera-<br />
tional initiatives along the whole value chain.<br />
The clear-out of old stock that began at the end of<br />
March 2009 was the absolute prerequisite for<br />
a series of measures initiated by the Board of Directors<br />
and Group Management in response to the<br />
findings of their strategic review.<br />
Major streamlining of old stock<br />
At the end of March 2009, around 12 million items<br />
of Charles Vögele’s inventories – over 30% of<br />
the total – were old stock. Over the whole of 2009,<br />
additional discounts were used to reduce inven-<br />
tories across the group by 13 million items worth<br />
CHF 109 million. The modified discount management<br />
system will ensure that from the end of March 2010<br />
onward there will be no items older than 18 months.<br />
The clear-out of old stock and the modified<br />
discounting policy reduced gross profit by about<br />
CHF 40 million.<br />
Because old items will no longer have to be stored<br />
temporarily prior to their return to the stores,<br />
storage facilities that were used exclusively for the<br />
management of old stock can now be closed down.<br />
Furthermore, the way is now clear for operational<br />
measures that will help Charles Vögele Group secure<br />
sustainable success. These measures are chang-<br />
ing organisational and process structures along the<br />
entire value chain – a renewal at all levels.<br />
New specialisation in purchasing<br />
Purchasing is being reorganised by core competence<br />
into three departments: Brand Management, Procurement<br />
and Merchandise Management. This will<br />
help us meet rising expectations of collection pro-<br />
9<br />
duction and procurement. It has also resulted in<br />
clear responsibilities, simpler more efficient and<br />
faster processes, and an organisational structure<br />
more suited to growth.<br />
Department 1: Brand Management<br />
Changes to organisational and process structures<br />
have facilitated a doubling of the collection tempo<br />
from 4 to 8 a year for the three brands Casablanca,<br />
Biaggini and Kingfield. With fewer old items on<br />
the sales floors from now on, stores will always be<br />
able to present the very latest colours and fashions.<br />
Collections, organised by theme, will be more<br />
visible. The sales space that is being freed up can<br />
be used to expand existing ranges or introduce<br />
new ones: accessories to increase our fashion credentials,<br />
external brands as an additional, style-<br />
creating element in selected branches. In autumn<br />
2010, Charles Vögele Group will be introducing<br />
its own underwear collection for the first time in its<br />
history. Socks have been offered as pick-up items<br />
since 2009.<br />
Department 2: Procurement<br />
The doubling of the collection tempo is having<br />
a profound influence on procurement. Specialisation<br />
is needed in this area too in order to increase capacity<br />
and speed. Specialisation also ensures that the<br />
actual manufacture of the collections is optimised<br />
in terms of supplier selection, quality and price.<br />
Key Facts<br />
Chairman’s Message<br />
CEO’s Report<br />
Group Report<br />
Regional Report<br />
Corporate Social Responsibility<br />
Corporate governance<br />
Financial Report
Renewal at all leVels<br />
> > >><br />
vALUE CHAIN<br />
BRAND MANAGEMENT/PROCUREMENT MERCHANDISING<br />
>> Basis FOR tHe intRODuctiOn OF OpeRatiOnal MeasuRes<br />
SUBSTANTIAL CLEAR-OUT OF OLD STOCk<br />
since the end of March 2009, the company has been engaged in a massive, exceptional clear-out of old stock.<br />
this is the absolute prerequisite for a series of operational initiatives along the whole value chain. a modified<br />
discount management system will now ensure that no item is older than 18 months.<br />
>><br />
>> cleaR aReas OF RespOnsiBility anD FasteR pROcesses<br />
SPECIALISATION OF PURCHASING<br />
purchasing is being split into three core competences: Brand Management, procurement and Merchandising.<br />
>> iMpROVing FasHiOn cReDentials<br />
EXISTING RANGES ARE BEING EXPANDED<br />
accessories are being expanded to improve the company’s<br />
fashion credentials. additional external brands used as<br />
style-creating elements.<br />
>> incReasing tHe aVeRage spenD<br />
peR Visit<br />
NEW RANGES ESTABLISHED<br />
Vertical grandiosa shops are being developed in most stores,<br />
socks offered as pick-up articles, and an own underwear collection<br />
will be launched in autumn 2010.<br />
>> cOntinuOus new cOlOuRs<br />
anD FasHiOns<br />
COLLECTION TEMPO DOUBLED<br />
the tempo of collections for the three brands casablanca,<br />
Biaggini and Kingfield has been doubled from 4 to 8 a year.<br />
>> iMpROVeD Quality<br />
anD cOntROl<br />
OWN SOURCING OFFICES OPENED IN INDIA<br />
AND BANGLADESH<br />
at the start of november 2009, the procurement operations<br />
that were handled via external agents in india and Bangladesh<br />
were integrated into the group.<br />
10<br />
>> ensuRing tHe aVailaBility OF essentials<br />
PROPORTION OF NEVER-OUT-OF-STOCk ITEMS<br />
IS DOUBLED<br />
the proportion of essential articles (nOs) that always have to<br />
be available on the shop floor is being doubled to 15%.<br />
>> FasHiOn tHeMes MORe VisiBle<br />
FASHION THEMES ARE ALLOCATED TO BRANDS<br />
Fashion themes are being allocated to brands on the sales floor.<br />
>> FasteR anD MORe pRecise stOcK cOntROl<br />
MERCHANDISE MANAGEMENT IS BEING<br />
CENTRALISED<br />
Merchandise Management is being centralised so that<br />
items can be allocated to branches quickly and flexibly<br />
(region-specific).
vALUE CHAIN<br />
SUPPLy CHAIN MANAGEMENT POS/EXPANSION<br />
>> Basis FOR tHe intRODuctiOn OF OpeRatiOnal MeasuRes >><br />
>> FasteR anD MORe eFFicient DistRiButiOn<br />
LOGISTICS CENTRALISED<br />
logistics are being centralised. the flow of goods will in future<br />
be managed via three regional distribution centres. Delivery to<br />
individual stores is via distribution hubs.<br />
11<br />
>> new, HigH-pOtential DistRiButiOn<br />
cHannel<br />
INTRODUCTION OF E-COMMERCE<br />
Fast-growing e-commerce is being introduced as a new<br />
distribution channel.<br />
>> iMpROVing tHe iMage anD<br />
sHaRpening tHe BRanD pROFile<br />
EMOTIONALISED ADVERTISING<br />
From autumn 2009, the company’s advertising has been made<br />
more emotional for specific target groups and the marketing<br />
mix has been adjusted accordingly.<br />
>> custOMeR-FRienDly aMBience<br />
incReases Feel-gOOD FactOR<br />
NEW STORE DESIGN CONCEPT<br />
a state-of-the-art store design was introduced in september<br />
2009. it is gradually being implemented throughout the store<br />
portfolio.<br />
NEW SMALLER STORE FORMAT<br />
stores of 300 to 500 m2 >> eXpansiOn pOtential Despite<br />
satuRateD MaRKets<br />
offering part-ranges are being introduced<br />
in city locations and shopping centres.<br />
>> liKe-FOR-liKe gROwtH anD Quality-<br />
DRiVen eXpansiOn<br />
EXPANSION POTENTIAL IN ALL FORMATS<br />
AND LOCATIONS<br />
the branch portfolio is being streamlined and expanded in<br />
line with a potential analysis and profitability guidelines. there<br />
is potential across all three size formats and in all locations.<br />
Key Facts<br />
Chairman’s Message<br />
CEO’s Report<br />
Group Report<br />
Regional Report<br />
Corporate Social Responsibility<br />
Corporate governance<br />
Financial Report<br />
>>
Own sourcing offices in India and Bangladesh<br />
At the beginning of November 2009, Charles Vögele<br />
Group took purchasing in India and Bangladesh<br />
into its own hands. For the previous 15 years, procurement<br />
had been handled through agents of<br />
Singapore-based Texline Associates Pte. Ltd. Procurement<br />
activities in Hong Kong and Shanghai<br />
were brought in-house three years ago. This integra-<br />
tion into its own organisation puts Charles Vögele<br />
Group in control of another link in the value chain –<br />
a significant competitive advantage for a verti-<br />
cally integrated company like ours. About 85% of<br />
the clothing produced by Asian manufacturers<br />
will henceforth be managed through our own procurement<br />
offices, making processes more effi-<br />
cient and improving quality control at the manu-<br />
facturers.<br />
Department 3: Merchandising<br />
Merchandise Management is being centralised so<br />
items can be allocated to branches quickly and<br />
flexibly (region-specific). The proportion of neverout-of-stock<br />
items is being doubled to 15%. The<br />
discounting policy is being modified to ensure that<br />
from the end of March 2010 there will be no stock<br />
older than 18 months on the sales floor.<br />
Logistics<br />
Like Merchandise Management, Logistics are also<br />
being centralised. This will not only make distribution<br />
faster and more efficient, but also more cost-ef-<br />
fective. The planned doubling of the collection tempo<br />
will have a profound influence on logistics. Warehouse<br />
cycle times have to be reduced and items<br />
need to be delivered as and when they are needed.<br />
In order to meet these requirements, the decen-<br />
tralised warehousing for new articles is being phased<br />
out over the next two years and replaced by three<br />
regional distribution centres. The cargo ports in<br />
Koper (Slovenia) and Hamburg supply these centres<br />
directly with articles from the Far East. These are<br />
then sent out to the individual stores from the re-<br />
gional distribution centres via hubs.<br />
Renewal at all leVels<br />
12<br />
Point of Sale/Expansion<br />
From autumn 2009, the company’s advertising<br />
campaigns were made more emotional for specific<br />
target groups, and the marketing mix was adjusted.<br />
The aim is to improve the image of the overall brand<br />
while also sharpening the profile of the Casablanca,<br />
Biaggini and Kingfield brands. In September 2009,<br />
a new store design concept was introduced for<br />
the first time in the new Metzingen store in Germany.<br />
Two more pilot stores were opened in Weinfelden<br />
and Lancy in Switzerland. Lessons learned from these<br />
stores are being put into practice at the end of<br />
March 2010 in the new flagship store in Zurich.<br />
Further expansion potential<br />
As well as the new presentation of collections on<br />
the sales floor and the new overall image, changes<br />
are taking place elsewhere in the business too.<br />
Charles Vögele’s whole branch portfolio is being re-<br />
viewed as part of its potential-oriented expansion<br />
strategy. The existing portfolio is being continuously<br />
optimised, with new locations being added especially<br />
in the main markets of Switzerland, southern<br />
and western Germany and Austria. In addition,<br />
store formats of 300 to 500 m 2 are being rented in<br />
city locations and shopping centres. These smaller<br />
stores offer partial ranges. Previously the store<br />
portfolio only included store formats larger than<br />
800 m 2 . The introduction of e-commerce adds<br />
another, forward-looking sales channel. All of these<br />
developments are allowing Charles Vögele Group<br />
to expand despite the fact that some markets are<br />
saturated.
OvERvIEw OF REgIONS<br />
Charles Vögele Group is one of Europe’s leading<br />
vertical fashion retailers. It offers the latest fashions<br />
at great prices to people in the prime of their lives<br />
who want to feel good. Attractively presented items,<br />
combined with friendly, knowledgeable advice,<br />
create a relaxed and enjoyable shopping experience,<br />
Charles Vögele has 857 outlets in five regions<br />
encompassing nine countries: Switzerland, Germany,<br />
Charles Vögele Group (The 2009 financial year)<br />
Austria/<br />
Slovenia<br />
295<br />
Benelux<br />
204<br />
Gross sales Branches Employees*<br />
CEE<br />
67<br />
Germany<br />
509<br />
Switzerland<br />
473<br />
Benelux<br />
166<br />
Austria/<br />
Slovenia<br />
155<br />
CEE<br />
53<br />
13<br />
Austria, Slovenia, the Netherlands, Belgium, Hungary,<br />
the Czech Republic and Poland. In 2009 the Group<br />
generated gross sales of CHF 1.5 billion with approx-<br />
imately 7 700 employees.<br />
Switzerland<br />
169<br />
Germany<br />
314<br />
Benelux<br />
1 025<br />
Austria/<br />
Slovenian<br />
1 159<br />
CEE<br />
455<br />
Germany<br />
2 888<br />
*without central services<br />
Switzerland<br />
1 790<br />
Key Facts<br />
Chairman’s Message<br />
CEO’s Report<br />
group Report<br />
Regional Report<br />
Corporate Social Responsibility<br />
Corporate governance<br />
Financial Report
The overall market for outerwear in Switzerland<br />
shrank by 2.3% during the 2009 financial year. As<br />
leading clothing retailers continued to expand<br />
and consumers became very cautious in their behav-<br />
iour, competitive pressure intensified. Good value<br />
for money became the crucial purchasing criterion<br />
for many people. Charles Vögele Group benefited<br />
from this trend owing to its positioning in the midprice<br />
segment.<br />
Expansion strategy for the Switzerland Region<br />
The Switzerland Region has good market penetration<br />
in its home market. Its main priority at the<br />
moment is to optimise its locations and add new<br />
ones in specific areas. The Switzerland Region<br />
generated gross sales of CHF 473 million, compared<br />
with CHF 478 million in 2008.<br />
Developing the store portfolio<br />
In 2009, four new stores were opened in Switzerland<br />
and one store was moved to a better location.<br />
The store portfolio increased from 165 to 169.<br />
The branches in Weinfelden (retail park) and Lancy<br />
(shopping centre) are pilots for the new store<br />
design concept. Lessons learned from these stores<br />
will be taken into account in the design of the<br />
new flagship store in Zurich.<br />
switZeRlanD RegiOn<br />
169<br />
14<br />
09<br />
08<br />
07<br />
06<br />
05<br />
09<br />
08<br />
07<br />
06<br />
05<br />
09<br />
08<br />
07<br />
06<br />
05<br />
Gross sales in CHF million<br />
Net sales in CHF million<br />
473<br />
428<br />
478<br />
436<br />
489<br />
452<br />
488<br />
451<br />
515<br />
477<br />
0 150 300 450 600 750<br />
Branches<br />
169<br />
165<br />
163<br />
161<br />
159<br />
0 40 80 120 160 200<br />
Employees<br />
Full-time equivalents<br />
1155<br />
1263<br />
1283<br />
1286<br />
1298<br />
1790<br />
1932<br />
2093<br />
2073<br />
2077<br />
0 500 1 000 1 500 2 000 2 500
Germany’s economic downturn was at its worst during<br />
the six months of winter 2008/2009. The<br />
economy shrank for the first time in six years – by<br />
5%. The overall market for outerwear stagnated;<br />
famous companies like Karstadt, Hertie and Escada<br />
had to file for insolvency.<br />
Expansion strategy for the Germany Region<br />
There is a lot of potential for expansion in south-<br />
ern and western Germany. This is where new locations<br />
are being developed. In the north and east<br />
of the country all locations have been evaluated and<br />
measures have been taken to increase profitability.<br />
In the case of unprofitable locations, stores have been<br />
closed. Gross sales in the Germany region fell during<br />
the period under review from CHF 535 million to<br />
CHF 509 million.<br />
Developing the store portfolio<br />
As part of the streamlining of the store portfolio,<br />
23 branches were closed in the Germany Region in<br />
2009, though 11 new stores were opened in south-<br />
ern and western Germany. The pilot project for the<br />
new store design was started in September 2009<br />
in Metzingen.<br />
geRMany RegiOn<br />
314<br />
15<br />
09<br />
08<br />
07<br />
06<br />
05<br />
09<br />
08<br />
07<br />
06<br />
05<br />
09<br />
08<br />
07<br />
06<br />
05<br />
Gross sales in CHF million<br />
Net sales in CHF million<br />
418<br />
440<br />
458<br />
451<br />
509<br />
535<br />
554<br />
528<br />
541<br />
465<br />
0 150 300 450 600 750<br />
Branches<br />
314<br />
326<br />
321<br />
325<br />
338<br />
0 80 160 240 320 400<br />
Employees<br />
Full-time equivalents<br />
1654<br />
1662<br />
1661<br />
1699<br />
1719<br />
2590<br />
2606<br />
2888<br />
2975<br />
2848<br />
0 800 1 600 2 400 3 200 4 000<br />
Key Facts<br />
Chairman’s Message<br />
CEO’s Report<br />
group Report<br />
Regional Report<br />
Corporate Social Responsibility<br />
Corporate governance<br />
Financial Report
The economic downturn had a significant impact<br />
on the Austria/Slovenia Region too. Unemployment<br />
continued to go up, which depressed consumer<br />
sentiment. Lower purchasing power had a particularly<br />
direct effect on fashion retailing. In this difficult<br />
environment, Charles Vögele Group was able to<br />
maintain its market share, making it one of Austria’s<br />
three leading clothes companies.<br />
Expansion Strategy in the Austria/Slovenia Region<br />
In the Austria/Slovenia Region, the streamlining<br />
of the store portfolio began in 2009. Unprofitable<br />
stores were either closed or moved to new locations<br />
with higher levels of passing trade. Gross sales<br />
fell by 7% from CHF 316 million to CHF 295 million.<br />
Developing the store portfolio<br />
The branches in Oberwart, Leibnitz and Vösendorf<br />
were moved to better-frequented locations. In<br />
November 2009, a new store was opened in a shopping<br />
centre in Salzburg. Four unprofitable stores<br />
were closed during the year under review. At the<br />
end of 2009 the branch portfolio comprised<br />
155 stores (previous year: 155)<br />
austRia/slOVenia RegiOn<br />
155<br />
16<br />
09<br />
08<br />
07<br />
06<br />
05<br />
09<br />
08<br />
07<br />
06<br />
05<br />
09<br />
08<br />
07<br />
06<br />
05<br />
Gross sales in CHF million<br />
Net sales in CHF million<br />
241<br />
258<br />
269<br />
295<br />
316<br />
325<br />
304<br />
252<br />
312<br />
258<br />
0 100 200 300 400 500<br />
Branches<br />
155<br />
155<br />
154<br />
151<br />
144<br />
0 40 80 120 160 200<br />
Employees<br />
Full-time equivalents<br />
861<br />
926<br />
934<br />
911<br />
909<br />
1159<br />
1222<br />
1290<br />
1232<br />
1264<br />
0 300 600 900 1 200 1 500
The entire market within the Benelux Region<br />
shrank. The outerwear market in Belgium only contracted<br />
by 0.2%, but the Dutch market was 3%<br />
smaller than in the previous year. Consumer sentiment<br />
was impaired by the continued rise in the<br />
unemployment rate.<br />
Expansion strategy for the Benelux Region<br />
In the Benelux Region, the focus was on optimising<br />
the store portfolio. In the Netherlands in particular<br />
many stores are in poorly-frequented locations<br />
or are in need of renovation. Most of these unprofitable<br />
stores were closed. New openings in 2009<br />
were primarily in Belgium. Gross sales fell from<br />
CHF 216 million to CHF 204 million.<br />
Developing the store portfolio<br />
4 stores were closed and 9 opened in the Benelux<br />
Region during the year under review. 3 branches<br />
were turned into outlets prior to closure in the first<br />
quarter of 2010. At the end of the year under re-<br />
view, the branch portfolio consisted of 166 stores<br />
(previous year: 161).<br />
BeneluX RegiOn<br />
166<br />
17<br />
09<br />
08<br />
07<br />
06<br />
05<br />
09<br />
08<br />
07<br />
06<br />
05<br />
09<br />
08<br />
07<br />
06<br />
05<br />
Gross sales in CHF million<br />
Net sales in CHF million<br />
158<br />
147<br />
170<br />
180<br />
184<br />
176<br />
189<br />
0 50 100 150 200 250<br />
Branches<br />
681<br />
687<br />
704<br />
673<br />
676<br />
150<br />
204<br />
161<br />
166<br />
160<br />
158<br />
216<br />
221<br />
0 40 80 120 160 200<br />
Employees<br />
Full-time equivalents<br />
1025<br />
1067<br />
1074<br />
1062<br />
1052<br />
0 250 500 750 1 000 1 250<br />
Key Facts<br />
Chairman’s Message<br />
CEO’s Report<br />
group Report<br />
Regional Report<br />
Corporate Social Responsibility<br />
Corporate governance<br />
Financial Report
The economic environment in the CEE Region varied<br />
greatly from country to country. Poland found<br />
itself in the best position, and the Czech Republic<br />
also held up relatively well. Since it was already<br />
suffering a downturn before the crisis, Hungary was<br />
once again particularly hard hit by the economic<br />
and financial turbulence.<br />
Expansion strategy for the CEE Region<br />
Within the CEE Region, most growth is taking place<br />
in Poland. Following expansion especially in<br />
the first half of 2009, gross sales increased from<br />
CHF 62 million to CHF 67 million.<br />
Developing the store portfolio<br />
9 stores were opened in the CEE Region during the<br />
year under review. Rental contracts for these<br />
branches had already been concluded at the end of<br />
2008. At the end of 2009, the branch portfolio<br />
comprised 53 stores (previous year: 44).<br />
cee RegiOn<br />
53<br />
18<br />
09<br />
08<br />
07<br />
06<br />
05<br />
09<br />
08<br />
07<br />
06<br />
05<br />
09<br />
08<br />
07<br />
06<br />
05<br />
Gross sales in CHF million<br />
Net sales in CHF million<br />
14<br />
11<br />
0 20 40 60 80 100<br />
Branches<br />
14<br />
37<br />
30<br />
27<br />
50<br />
54<br />
62<br />
44<br />
53<br />
0 15 30 45 60 75<br />
Employees<br />
Full-time equivalents<br />
68<br />
153<br />
138<br />
222<br />
267<br />
67<br />
381<br />
380<br />
455<br />
0 120 240 360 480 600
CORPORATE SOCIAL<br />
RESPONSIBILITY<br />
Charles Vögele Group takes a conscientious approach<br />
to the use of natural resources and actively fulfils its<br />
social responsibilities. It has been supporting sustainable<br />
social projects in the countries where its clothes are<br />
manufactured for several years.<br />
Respect foR the enviRonment<br />
collection development/procurement<br />
In its 857 stores, the Charles Vögele Group mainly<br />
sells its own collections, which are produced<br />
by external manufacturers. Since the beginning<br />
of November 2009, Charles Vögele has had its<br />
own procurement offices in India and Bangladesh.<br />
Procurement activities in Hong Kong and Shang-<br />
hai were brought in-house three years ago. Having<br />
these operations integrated into its own organisation<br />
represents a significant competitive advantage<br />
for a vertically integrated business, giving<br />
Charles Vögele control of an additional link in the<br />
value chain. This leads to more efficient proc-<br />
esses and improved quality control. The group<br />
sources 85% of its clothes from South East Asia<br />
and 15% from Europe.<br />
supply chain<br />
The clothes are nearly always taken from the production<br />
locations to Europe by boat, which is the<br />
most environmentally friendly form of transportation.<br />
External logistics partners ship the containers from<br />
various ports in South East Asia directly to regional<br />
distribution centres. From there the goods are distributed<br />
to individual stores by road or rail.<br />
20<br />
Charles Vögele Group’s efforts to protect the environment<br />
focus mainly on the way it operates and<br />
maintains its stores, especially with regard to<br />
energy consumption. For example, we always use<br />
the latest and most energy-efficient in-store<br />
lighting systems.<br />
In Switzerland and Germany, energy use in individual<br />
stores is subject to strict internal bench-<br />
marking to ensure that hidden or excessively high<br />
sources of consumption can be identified and dealt<br />
with as quickly as possible. Over the next few years<br />
this system will gradually be introduced in our other<br />
sales organisations too. Because the great majority<br />
of stores are housed in rented premises, the company<br />
has limited opportunity to influence environmental<br />
aspects when these buildings are being<br />
constructed.
Value-Added Statement<br />
CHF 1000 2009 2008<br />
Net sales 1 310 248 1 363 965<br />
Other operating income 4 836 3 085<br />
Financial income 386 929<br />
Group services 1 315 470 1 367 979<br />
Purchased materials and services (934 642) (933 483)<br />
Gross value added 380 828 434 496<br />
Depreciation and amortisation (67 189) (65 227)<br />
Net value added 313 639 369 269<br />
Distribution of net value added<br />
Employees 309 169 320 785<br />
Government 10 835 20 717<br />
Lenders 7 378 15 421<br />
Shareholders (based on proposed appropriation of earnings by the Board of Directors) – 4 191<br />
Company (13 743) 8 155<br />
Total 313 639 369 269<br />
In Switzerland, Charles Vögele is a member of the<br />
“Energie-Agentur der Wirtschaft” programme,<br />
which commits the company to active reduction of<br />
CO 2 emissions and optimised energy efficiency.<br />
The goals agreed within the programme are audited<br />
by the Swiss government.<br />
material flows<br />
Charles Vögele Group uses its finely knit distribution<br />
network not only to get the clothes into its branches<br />
and to distribute consumables and marketing material,<br />
but also to set up intelligent material flows that<br />
help the company recycle waste. Internal trans-<br />
portation materials and interim packaging, such as<br />
boxes and plastic crates, are made to be reused<br />
as many times as possible within the system. On their<br />
return journeys, trucks that would otherwise be<br />
empty take plastic covers and other disposable packaging<br />
materials back to the sales organisations’<br />
central warehouses, where they are prepared for<br />
appropriate disposal.<br />
21<br />
taking care of people and the environment<br />
All suppliers that produce clothing for Charles<br />
Vögele Group have to follow strict, clearly defined<br />
guidelines with regard to manufacturing methods,<br />
materials and compliance with local environmental<br />
protection rules. These guidelines, based on the<br />
new version of Germany’s consumer protection legislation<br />
of 23 December 1997, form an integral part<br />
of the suppliers’ handbook and are binding for all<br />
supplier organisations. Charles Vögele regularly<br />
carries out spot tests and has the selected items analysed<br />
by external, independent laboratories to<br />
ensure that all regulations are adhered to and that<br />
all products are safe for customers.<br />
Key Facts<br />
Chairman’s Message<br />
CEO’s Report<br />
Group Report<br />
Regional Report<br />
Corporate Social Responsibility<br />
Corporate Governance<br />
Financial Report
social Responsibility<br />
employees<br />
Charles Vögele Group employed 7 729 employees<br />
during the year under review (previous year:<br />
7 888). The number of full-time equivalent posts<br />
came to 5 071 (previous year: 5 036).<br />
hR development<br />
The vast majority of Charles Vögele Group’s employees<br />
are in direct daily contact with clients. Our<br />
people on the sales floor act as the company’s calling<br />
cards. Their friendliness when serving customers<br />
and their accommodating and competent advice turn<br />
a visit to a Vögele store into a special shopping<br />
experience. This is why the company puts such<br />
emphasis on permanent training and development<br />
for its employees. Training and development<br />
help employees to reach their personal objectives<br />
and ensure that there is well-qualified young<br />
management talent available in all areas of the company.<br />
In addition to external training courses in<br />
various skills and specialisations, much attention is<br />
paid to internal training within the stores. Consequently,<br />
when new stores are opened, talented employees<br />
can be offered attractive career prospects.<br />
This also ensures that the corporate culture is extended<br />
to new locations.<br />
career prospects for trainees<br />
Charles Vögele Group feels it is important to help<br />
young people embark upon a career in the clothing<br />
industry and to encourage talent in a targeted<br />
manner. During the year under review, 550 young<br />
people attended a relevant training programme<br />
(previous year: 557). The large number who successfully<br />
passed their final exams pays testament to<br />
<strong>REPORT</strong><br />
22<br />
the impressive achievements of these young employees,<br />
especially since they managed to gain these<br />
excellent results in such an intense working environment.<br />
The following achievements deserve special<br />
mention:<br />
– Switzerland: 35 trainees scored higher than a 5<br />
(out of a possible 6)<br />
– Austria: 3 trainees passed with merit<br />
– Germany: 15 trainees scored a 2 or higher<br />
social compliance<br />
Charles Vögele Group is committed to socially fair<br />
production methods throughout the group. As far<br />
back as in 1996, the company issued binding guidelines<br />
on social matters and working conditions<br />
(Charles Vögele Code of Vendor Conduct), which had<br />
to be obeyed by all suppliers. During the second<br />
half of 2004, the Charles Vögele Code of Conduct<br />
was replaced by the BSCI Code of Conduct (see<br />
www.bsci-eu.com).
usiness social compliance initiative (bsci)<br />
The Business Social Compliance Initiative (BSCI)<br />
was established in Brussels on 26 March 2004.<br />
Under the overall management of the Foreign Trade<br />
Association (FTA), it is supported by European<br />
companies from various industries (food, non-food,<br />
etc.). The Initiative has been recognized by the<br />
relevant EU Commission since the early phases of its<br />
development, and since 2005 has also received<br />
active support in the form of EU development funding.<br />
Charles Vögele Group has been an official<br />
member of the FTA since 1 January 2004, but was<br />
already working with the association on devel-<br />
oping the Business Social Compliance Initiative in<br />
2003. As a founding member, Charles Vögele<br />
Group played a significant role in putting the BSCI<br />
into practice.<br />
The BSCI Code of Conduct is based on the principle<br />
that companies producing goods for Charles<br />
Vögele must follow all the laws and regulations that<br />
apply in their home country. There are also detailed<br />
contractual stipulations covering the environment,<br />
discrimination, forced labour, child labour, working<br />
hours, wages, working conditions, employee accommodation<br />
and freedom of assembly. These comply<br />
with the International Labour Organisation’s conventions,<br />
the United Nations’ Universal Declaration<br />
of Human Rights, the UN Convention on Children’s<br />
Rights, the UN Convention on the Elimination of<br />
All Forms of Discrimination against Women (CEDAW),<br />
the UN Global Compact and OECD regulations.<br />
These rules, which also continue to be a fixed component<br />
of the Charles Vögele supplier contract,<br />
govern compliance with minimum social standards.<br />
Furthermore, Charles Vögele Group has been<br />
an official member of the New York-based human<br />
rights organisation Social Accountability International<br />
(SAI) since 2001. This organisation publishes<br />
and administrates the internationally recognized<br />
Social Accountability 8000 Social Standard.<br />
23<br />
benefits of the business social compliance initiative<br />
(bsci)<br />
Many of the BSCI’s 430 current member companies<br />
have signed up to the initiative, even though they<br />
had previously worked with their own codes of conducts,<br />
each of which differed slightly from the<br />
others. The aim of the initiative is to avoid duplication<br />
in the testing of suppliers that work for several<br />
producers.<br />
BSCI members have agreed on the joint BSCI<br />
Code of Conduct, which is also based on the conventions<br />
of the International Labour Organisation (ILO)<br />
and which forms the basis for auditing. Audits are<br />
carried out using a uniform questionnaire formu-<br />
lated to reflect SA8000 guidelines. The resulting<br />
data is recorded centrally in the BSCI database<br />
and then made available to members.<br />
This procedure creates a rational, uniform platform<br />
for auditing, and helps manufacturers and<br />
their clients save valuable resources. The whole process<br />
ensures compliance with a comprehensive<br />
set of minimum social standards.<br />
Key Facts<br />
Chairman’s Message<br />
CEO’s Report<br />
Group Report<br />
Regional Report<br />
Corporate Social Responsibility<br />
Corporate Governance<br />
Financial Report
sci workshops and audits in 2009<br />
Since 2004, Charles Vögele Group has sent the<br />
new BSCI Code of Conduct to all its suppliers, and<br />
they have had to confirm their acceptance with<br />
a formal receipt. The BSCI Code of Conduct has thus<br />
become part of the standard supply contract. The<br />
company then sends all suppliers the BSCI Self Assessment<br />
Dossier, which contains key information<br />
about the supplier and serves as the basis for audits.<br />
The BSCI head office in Brussels regularly holds<br />
introductory workshops for clothing suppliers in various<br />
countries and cities. The following workshops<br />
were held in 2009:<br />
– Mumbai (India), 2 February<br />
– Chennai (India), 5 February<br />
– Ho Chi Minh City (Vietnam), 19 May<br />
– Hangzhou (China), 25 May<br />
– Guangzhou (China), 1 June<br />
– Dhaka (Bangladesh), 5 October<br />
– Istanbul (Turkey), 21 October<br />
– Ningbo (China), 2 November<br />
– Guangzhou (China), 5 November<br />
Charles Vögele Group invites its suppliers to workshops<br />
in the relevant locations. In parallel with these<br />
workshops, the company audits its own A and B<br />
suppliers. These audits are performed with SAI-certified<br />
specialist firms (Specialized Technology Resources<br />
[STR]; ALGI). Charles Vögele helps suppliers<br />
implement the BSCI Code of Conduct by paying<br />
the costs of the initial audit and the reaudit following<br />
implementation of any corrective measures (Corrective<br />
Action Plan). In accordance with the BSCI’s<br />
extended specifications, since 2008 Charles Vögele<br />
Group has offered its suppliers active training to<br />
help them achieve the standards set out in the BSCI<br />
Code of Conduct. Individual training programmes<br />
<strong>REPORT</strong><br />
24<br />
are defined following the first re-audits and re-<br />
sulting Corrective Action Plans (CAP). The first of<br />
these programmes was carried out during the<br />
2009 financial year. The training programmes are<br />
another way in which Charles Vögele helps sup-<br />
pliers comply with the required BSCI standards.<br />
Audits and reaudits were carried out in the fol-<br />
lowing countries during the year under review: Bangladesh,<br />
China, India, Indonesia, Cambodia and<br />
Pakistan.<br />
social projects in 2009<br />
Charles Vögele Group supports social projects<br />
in the countries where its clothes are manufactured.<br />
It pays particular attention to the sustainability<br />
of these activities: the company mainly supports<br />
projects that have self-supporting structures<br />
after the start-up phase and that can survive on<br />
their own in the longer run. One approach is to<br />
give direct backing to a selected project defined by<br />
a supplier or its employees; another is to support<br />
regional communities located close to several manufacturers.<br />
Projects are selected in close collaboration<br />
with local NGOs and workers’ representatives.<br />
Areas such as health promotion, profes-<br />
sional training, kindergartens and schools for young<br />
people are a particular priority.<br />
In 2005, Charles Vögele Group decided to support<br />
community projects in Bangladesh that directly<br />
benefit the local population – and local textile workers<br />
in particular. The following projects run by the<br />
Swiss development organisation Swisscontact are<br />
currently being supported.<br />
2006 2007 2008 2009<br />
Audits and reaudits 40 43 40 53
Health service in Kamrangir Char, Dhaka<br />
This health project improves access to vital basic<br />
medical services in the slums of Dhaka. The<br />
aim is to provide as many slumdwellers as possi-<br />
ble with access to a doctor and medicines in<br />
return for a small payment where feasible. With<br />
better healthcare, the local people, including<br />
textiles industry workers, stay healthier and so<br />
can earn a living. Since the project began in<br />
autumn 2005, health awareness in the slums of<br />
Kamrangir Char has improved. Training ses-<br />
sions have been held on health promotion and hygiene,<br />
as well as campaigns about seasonal<br />
diseases – how they affect people and how they<br />
can be prevented.<br />
Information has also been distributed to increase<br />
health awareness among slumdwellers. Partic-<br />
ular emphasis is put on healthcare for mothers and<br />
children. Mothers and pregnant women are given<br />
specific advice on hygiene. Demand for all the training<br />
and information was very high in 2009. In May<br />
2009, additional health promotion campaigns were<br />
run in the slums. Project staff visited schools<br />
and religious institutions, as well as carrying out a<br />
door-to-door campaign.<br />
Charles Vögele has supported the project since<br />
September 2005, and it has now been extended<br />
until 31 January 2011. In 2009, 20 000 people made<br />
use of the services offered.<br />
Occupational training in the slums of Rayer<br />
Bazaar, Dhaka<br />
This project, based in a training centre with its<br />
own shop, gives slum dwellers practical training in<br />
sewing, cutting and embroidery. Disadvantaged<br />
people learn valuable professional skills that will improve<br />
their lives for the long term. Once they have<br />
finished the training, they can start to earn their own<br />
living. More than 80% of those who have completed<br />
the course now have a regular income. Even while<br />
training, participants can earn money from priv-<br />
ate work in order to save up for a sewing machine.<br />
When they have finished they can apply to work<br />
at Charles Vögele’s supplier companies.<br />
25<br />
There are two six-month training phases every<br />
year. The curriculum and the number and con-<br />
tent of lessons are regularly reviewed and adjusted.<br />
Thanks to the introduction of new disciplines –<br />
printing and batik techniques – the number of participants<br />
and the capacity has been increased.<br />
Between 1. September 2005 and 31. December 2009,<br />
780 peo-ple were trained on various courses, and<br />
now either work in the project’s own workshop, have<br />
found a job elsewhere, or have set up their own<br />
business. The project, which Charles Vögele con-<br />
tinues to support, has been extended until<br />
31 August 2011.<br />
Key Facts<br />
Chairman’s Message<br />
CEO’s Report<br />
Group Report<br />
Regional Report<br />
Corporate Social Responsibility<br />
Corporate Governance<br />
Financial Report
Key Figures<br />
26<br />
31.12.2009 31.12.2008<br />
Bearer shares Number 8 800 000 8 800 000<br />
Par value (reduction decided on April 1, 2009) CHF 3.50 4.00<br />
Share price as per closing date CHF 37.00 27.50<br />
Share price:<br />
ChARLES VöGELE hOLdING AG<br />
– year high CHF 48.05 98.90<br />
– year low CHF 28.00 27.50<br />
Average trading volume per day Number 19 692 22 780<br />
Free Float 1) % 90 95<br />
Basic earnings per share CHF (1.64) 1.46<br />
P/E Ratio Factor (22.60) 18.8<br />
EV/EBITDA Factor 4.8 3.5<br />
Stock capitalization CHF Mio. 326 242<br />
Book value per share CHF 55 57<br />
Reduction of par value of shares CHF – 0.50<br />
1) According to free-float declaration SIX<br />
2) Proposal to the <strong>Annual</strong> Shareholders’ Meeting<br />
share performance<br />
Price performance of Charles Vögele Holding AG<br />
bearer shares from 1 January 2009 to 24 February<br />
2010:<br />
[CHF]<br />
50<br />
45<br />
40<br />
35<br />
30<br />
25<br />
20<br />
01.01.09<br />
31.03.09<br />
30.06.09<br />
30.09.09<br />
Benchmark index SPI<br />
Daily closing price of Charles Vögele bearer shares<br />
Listing: SIX Swiss Exchange, Zurich<br />
Security number: 693 777<br />
ISIN code: CH 000 693 777<br />
Abbreviation: VCH<br />
Bloomberg: VCH SW<br />
Reuters: VCHZ.S<br />
31.12.09<br />
24.02.10
Corporate<br />
GovernanCe
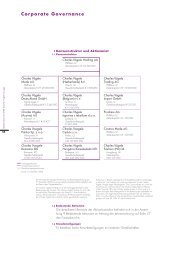
1 GROUP STRUCTURE AND SHAREHOLDERS<br />
1.1 Group structure<br />
<strong>REPORT</strong><br />
Good corporate governance is an important component<br />
of our corporate policy. Charles Vögele Group is<br />
committed to transparency and clearly defined responsibilities.<br />
It follows the Swiss Code of Best Practice<br />
for Corporate Governance, fulfilling all the statutory<br />
requirements as well as the applicable rules and standards<br />
of the SIX Swiss Exchange.<br />
Charles Vögele Mode AG<br />
Freienbach, CH<br />
Share capital, CHF 20 000 000<br />
Charles Vögele Deutschland GmbH<br />
Sigmaringen, D<br />
Partnership capital, EUR 15 340 000<br />
Charles Vögele (Austria) AG<br />
Kalsdorf, A<br />
Share capital, EUR 1 453 457<br />
Charles Voegele trgovina s<br />
tekstilom d.o.o.<br />
Ljubljana, SI<br />
Share capital, EUR 667 668<br />
Holding company<br />
Sales organisation<br />
Service organisation<br />
As at 31 December 2009<br />
Charles Vögele Holding AG<br />
Freienbach, CH<br />
Share capital, CHF 30 800 000<br />
Information on listing and stock market capitalisation as of 31 December<br />
2009 can be found on page 26 of the Activity Report along with other key<br />
figures relating to the company’s shares.<br />
Charles Vögele (Netherlands) B.V.<br />
Utrecht, NL<br />
Partnership capital, EUR 1 000 200<br />
Charles Vögele (Belgium) N.V.<br />
Turnhout, B<br />
Share capital, EUR 10 063 906<br />
Charles Voegele Polska Sp. z o.o.<br />
Warsaw, PL<br />
Partnership capital, PLN 4 000 000<br />
Charles Vögele Hungária<br />
Kereskedelmi Kft.,<br />
Budapest, HU<br />
Partnership capital, HUF 240 000 000<br />
Charles Voegele Ceská s.r.o.<br />
Prague, CZ<br />
Partnership capital ,CZK 30 000 000<br />
Charles Vögele Holding AG is the holding company for all group companies.<br />
Charles Vögele Trading AG is responsible for all group-wide services such as<br />
purchasing, IT, communications, accounts, financial control, legal services<br />
and risk management.<br />
29<br />
Charles Vögele Trading AG<br />
Freienbach, CH<br />
Share capital, CHF 10 000 000<br />
Charles Vögele Import GmbH<br />
Lehrte, D<br />
Partnership capital, EUR 25 000<br />
Prodress AG<br />
Freienbach, CH<br />
Share capital, CHF 100 000<br />
Cosmos Mode AG, Pfaeffikon<br />
Freienbach, CH<br />
Share capital, CHF 100 000<br />
Charles Voegele Fashion (HK) Ltd.<br />
Hong Kong, HK<br />
Share capital, HKD 100 000<br />
Charles Vögele Import GmbH is responsible for operational functions (storage<br />
logistics and quality control) at the distribution centre in Lehrte (D). Prodress AG<br />
is the internal advertising agency working exclusively for the Charles Vögele<br />
Group. Cosmos Mode AG owns the trademarks and administers the respective<br />
licenses. Charles Voegele Fashion (HK) Ltd. is the Charles Vögele Group‘s<br />
sourcing office in Asia. It coordinates the activities of the group‘s own sourcing<br />
offices in China, India and Bangladesh; it administers and monitors the local<br />
suppliers.<br />
Segment reporting is on page 29, section 5 of the Financial Report, and<br />
the overview of all consolidated companies is on page 59 section 42 of the<br />
Financial Report.<br />
Key Facts<br />
Chairman’s Message<br />
CEO’s Report<br />
Group Report<br />
Regional Report<br />
Corporate Social Responsibility<br />
Corporate Governance<br />
Financial Report
1.2 Significant shareholders<br />
2.3 Changes in capital<br />
For detailed information on the shareholder struc- A condensed overview of changes to the company’s<br />
ture please refer to note 9 “Important shareholders” capital during the financial years 2007–2009 can be<br />
in the notes to the financial statements on page 67<br />
of the Financial Report.<br />
found on page 9 of the Financial Report.<br />
2.4 Shares and participation certificates<br />
1.3 Cross-shareholdings<br />
As of 31 December 2009, the share capital of Charles<br />
There are no cross-shareholdings with other com- Vögele Holding AG amounted to 8 800 000 fully<br />
panies.<br />
paid-up bearer shares (securities number: 693 777/<br />
ISIN code: CH000 693 777) with a par value of<br />
2 CAPITAL STRUCTURE<br />
CHF 3.50 each. There are no restrictions on the trans-<br />
2.1 Share capital<br />
fer of shares. As stipulated in Art. 659a of the<br />
As of 31 December 2009, the share capital of Charles Swiss Code of Obligations, every share entitles the<br />
Vögele Holding AG amounted to CHF 30 800 000 holder to receive dividends and to vote at the<br />
and was made up of 8 800 000 fully paid-up bearer Shareholders’ Meeting. There are no participation<br />
shares (securities number: 693 777/ISIN code:<br />
CH000 693 777) with a par value of CHF 3.50 each.<br />
certificates.<br />
2.5 Bonus participation certificates<br />
There are no bonus participation certificates.<br />
As of 31 December 2009, the Charles Vögele Group<br />
held 434 907 of its own shares (as of 31 December<br />
2008: 417 641 shares), which are earmarked to meet<br />
the obligations of the existing management share<br />
option plan. Detailed information on pur-chases and<br />
sales of shares and on the relevant opening and<br />
closing totals can be found on page 67 section 8 of<br />
the Financial Report.<br />
2.2 Authorised and conditional capital<br />
Charles Vögele Holding AG’s articles of association<br />
include a provision authorising the Board of Directors<br />
to increase the company’s share capital by a maximum<br />
of CHF 924 000, excluding shareholders’ subscription<br />
rights, through the issue of 264 000<br />
shares with a par value of CHF 3.50 each. This authorisation<br />
lasts for an indefinite period of time. These<br />
shares are to be used exclusively for management<br />
share option plan participants (please also refer<br />
to note 35.1 “Management share option plan” in the<br />
notes to the consolidated financial statements on<br />
page 48 of the Financial Report).<br />
30<br />
2.6 Restrictions on transferability and nominee<br />
registrations<br />
There are no restrictions on transferability or nominee<br />
registrations.<br />
2.7 Convertible bonds and options<br />
There are no convertible bonds. The only options<br />
are those associated with the management share<br />
option plan (note 35.1, page 48 of the Financial<br />
Report).
From left to right:<br />
Prof. Dr. Peter Littmann<br />
Alain Caparros<br />
Hans Ziegler<br />
Jan C. Berger<br />
32
3 BOARD OF DIRECTORS<br />
3.1 Members of the Board of Directors<br />
Alain Caparros, 1956, French<br />
Chairman since 1 April 2009,<br />
term of office 2009-2010, first elected in 2007<br />
Business economist. CEO of REWE Group since 2006. From<br />
1991 Vice Chairman of Yves Rocher in Paris; from 1994 to<br />
1999 Managing Director of Aldi France. 1999 CEO of ALDIS<br />
ASP in France and simultaneously Member of the Executive<br />
Board of BON APPETIT Group Switzerland from 2001. From<br />
2003, CEO of the BON APPETIT Group Switzerland, which<br />
was subsequently taken over by REWE.<br />
Hans Ziegler, 1952, Swiss<br />
Vice Chairman since 1 April 2009,<br />
term of office 2008-2010, first elected in 2008<br />
Business economist. Independent management consultant<br />
since 1997 with international mandates in crisis management,<br />
restructurings and repositionings; Delegate of the Board of<br />
Directors and CEO of OC Oerlikon Corporation AG. From 1988<br />
to 1991 CFO and CIO at the Usego-Waro Group, and from 1991<br />
to 1995 head of group finance, IT and group development at the<br />
Globus Group. From 1996 to 1997 Chairman of the Board of<br />
Directors and CEO of the Distefora Group (previously Interdiscount).<br />
From 2000 to 2005 CFO and Member of the Board<br />
of Directors of the Pragmatica Group. In 2003 CEO of the<br />
Erb Group.<br />
Jan C. Berger, 1946, Dutch<br />
Term of office 2008-2010, first elected in 2008<br />
Studied marketing and science and attended various management<br />
courses at Babson College, Harvard and Nyenrode<br />
Business School. Independent retail consultant since 2006,<br />
and member of the boards of directors of several retail,<br />
educational and cultural organisations. From 1996 to 2006,<br />
CEO of the leading Dutch department store De Bijenkorf;<br />
this group includes department stores as well as clothing and<br />
DIY chains. Jan C. Berger is also a member of the advisory<br />
boards of the Amsterdam Fashion Institute and of Visual Retailing,<br />
an organisation that concentrates on the visual presentation<br />
of goods in the retail industry.<br />
33<br />
Prof. Dr. Peter Littmann, 1947, German<br />
Term of office 2007-2010, first elected in 2006<br />
Studied business administration and business engineering.<br />
Peter Littmann is the Managing Partner of Brandinsider<br />
Strategic Brand Consulting GmbH in Hamburg, and since 1993<br />
has been Honorary Professor in the Marketing Faculty of the<br />
University of Witten/Herdecke (Germany). He is also a Member<br />
of the Board of Directors of Nyenrode University, the Netherlands,<br />
and a member of the Harvard University Art Museum’s<br />
Visiting Committee, Cambridge, USA. From 1993 to 1997,<br />
he was Chairman of the Managing Board of Hugo Boss AG; prior<br />
to this he worked from 1982 to 1993 for the international<br />
textiles company Vorwerk & Co, latterly as President and CEO.<br />
Member of the Board of Directors of Bata Shoe Corporation<br />
from 1996 to 2005.<br />
Changes to the Board of Directors during the year<br />
under review:<br />
Bernd H. J. Bothe, Dr. Felix R. Ehrat, Daniel Sauter and Carlo<br />
Vögele did not make themselves available for re-election at the<br />
<strong>Annual</strong> Shareholders‘ Meeting on 1 April 2009, so the size<br />
of the Board was reduced to the four above-mentioned Board<br />
Members. Alain Caparros has been Chairman since 1 April<br />
2009.<br />
None of the Members of the Board of Directors, except for Bernd H. J. Bothe,<br />
worked in any executive functions within the Group during the year under<br />
review or in the previous three years. Unless otherwise stated, the non-executive<br />
Members of the Board of Directors have no other significant links with<br />
the Group. With regard to the other business relationships and interests that<br />
link Members of the Board of Directors to the company, please refer to the<br />
Additional fees and remuneration section of note 39 Related party transactions<br />
in the notes to the consolidated financial statements on page 54 and 55 of<br />
the Financial Report.<br />
Key Facts<br />
Chairman’s Message<br />
CEO’s Report<br />
Group Report<br />
Regional Report<br />
Corporate Social Responsibility<br />
Corporate Governance<br />
Financial Report
3.2 Other activities and interests<br />
Under the Corporate Governance Directive, the other<br />
activities and interests of the Members of the<br />
Board of Directors only have to be listed if they are<br />
significant or substantial. The company believes<br />
that the activities of the present Members of the<br />
Board of Directors are basically only significant<br />
if they relate to their work on management or supervisory<br />
bodies of listed Swiss or foreign companies,<br />
or unlisted and important Swiss or foreign companies<br />
in the clothing retail business or other industries.<br />
The Members of the Board of Directors are not<br />
involved in any other substantial activities or interests.<br />
Alain Caparros<br />
No other Board positions in listed companies or<br />
clothing retail companies.<br />
Hans Ziegler<br />
Chairman of the Board of Directors of Swisslog<br />
Holding AG and of Schlatter Holding AG. Delegate<br />
of the Board of Directors and CEO of OC Oerlikon<br />
Corporation AG.<br />
Jan C. Berger<br />
Member of the Board of Directors of the Shopex<br />
Group, of NEVI, of the Centraal Museum in Utrecht<br />
and of the Koetsier Foundation.<br />
Prof. Dr. Peter Littmann<br />
Member of the Board of Directors of Rodenstock<br />
GmbH, Rabenhorst KG, Schleich AG, Ruckstuhl AG<br />
and Marc’O Polo AG.<br />
In addition to these activities, some Members of the<br />
Board of Directors are involved in activities outside<br />
their fields of responsibility in corporations, institutions,<br />
and private and public sector foundations,<br />
as well as holding official functions and political offices,<br />
none of which, however, are of material<br />
significance to Charles Vögele Holding AG.<br />
BOARD OF DIRECTORS<br />
34<br />
3.3 Elections and terms of office<br />
The Board of Directors of Charles Vögele Holding AG<br />
consists of at least three and no more than nine<br />
members. Its members are elected singly by the<br />
Shareholders’ Meeting for a term of office of one<br />
year, a “year in office” being defined as the period<br />
between two <strong>Annual</strong> Shareholders’ Meetings.<br />
Reelection is permitted. If a Member departs before<br />
the end of his or her term of office, his or her<br />
successor takes over for the remainder of the departing<br />
Member’s term of office. The Board of Directors<br />
designates a chairman and a secretary, neither of<br />
whom has to be a Member of the Board of Directors<br />
or a shareholder (details of initial appointment and<br />
term of office are included in section 3.1 Members<br />
of the Board of Directors on page 33).<br />
3.4 Internal organisational structure<br />
The Board of Directors passes resolutions on all<br />
matters affecting the company that the law, the<br />
articles of association or the organisational regulations<br />
do not assign to the responsibility of another<br />
corporate body. In particular, the Board of Directors’<br />
responsibilities include the stipulation and review<br />
of the company’s strategy, the appointment and dismissal<br />
of persons to whom the overall management<br />
of the company is entrusted (especially the CEO), the<br />
organisational structure, and the financial and<br />
accounting system. The Board of Directors is also<br />
responsible for supervising the people charged<br />
with management of the company to ensure that<br />
their actions comply with the law, the articles of<br />
association, the regulations and directives. The Board<br />
of Directors is responsible for producing the annual<br />
report, as well as for reporting to the <strong>Annual</strong> Shareholders’<br />
Meeting and implementing its resolutions.<br />
It is authorised to prepare and execute the resolutions<br />
and to delegate the supervision of business<br />
to the committees of the Board of Directors or to<br />
individual Board Members. It can assign the management<br />
of the company’s business in whole or in<br />
part to individual Board Members or to other people.
According to the organisational regulations, the<br />
Board of Directors meets as often as business<br />
requires, but at least four times in each financial<br />
year. Nine meetings, one of which was a two-day<br />
strategy meeting, and two telephone conferences<br />
were held during the year under review. Each<br />
meeting lasts for about a day. Members of Group<br />
Management are always present at the meetings;<br />
department heads and other employees or third<br />
parties attend as required.<br />
The Board of Directors has had a permanent secretariat<br />
since 2004. In October 2009 the Board of<br />
Directors appointed the head of the newly created<br />
internal legal department as the Secretary to the<br />
Board. She takes the minutes of all full Board and<br />
committee meetings and advises the Board on<br />
legal issues, but she is not a Member of the Board.<br />
Chairman of the Board of Directors<br />
The Chairman of the Board of Directors is always<br />
appointed by the Board at the end of the <strong>Annual</strong><br />
Shareholders’ Meeting for a one-year term of office.<br />
The Chairman ensures good cooperation between<br />
the Board of Directors, its committees and the CEO.<br />
Vice-Chairman of the Board of Directors<br />
The Vice Chairman of the Board of Directors is<br />
always appointed by the Board after the <strong>Annual</strong><br />
Shareholders’ Meeting for a one-year term of<br />
office. The Vice-Chairman of the Board of Directors<br />
supports the Chairman of the Board of Directors<br />
and can be given specific responsibilities by the<br />
full Board.<br />
35<br />
Board of Directors' committees<br />
The Board of Directors of Charles Vögele Holding AG<br />
generally takes all of its decisions collectively.<br />
Since the Board was reduced to four members on<br />
1 April 2009, the Members of the Board form the<br />
committees described below as a body. The committees‘<br />
business is dealt with directly as part of<br />
the full Board meetings. The chairmen of each committee<br />
prepare the topics to be discussed in<br />
advance with Group Management and other internal<br />
specialists, present their recommendations to the<br />
Board of Directors as a whole for decision, and then<br />
are responsible for implementing these decisions<br />
and monitoring the resulting actions.<br />
The committees are made up as follows and fulfil<br />
the following tasks stipulated in the organisational<br />
regulations:<br />
– Audit Committee<br />
Hans Ziegler (Chairman since 1 April 2009)<br />
The Audit Committee helps the Board of Directors<br />
supervise the accounting and financial reporting<br />
systems, and monitor compliance with the law by the<br />
company and by the Group companies that it<br />
directly or indirectly controls. The committee supervises<br />
internal and external auditing procedures,<br />
and also monitors adherence to statutory rules and<br />
regulations by ordering regular reports from management.<br />
If the external audit mandate comes up for<br />
review, the Audit Committee evaluates possible<br />
alternatives and submits a proposal to the Board of<br />
Directors. The Audit Committee also monitors the<br />
content and formal correctness of external communications<br />
on all financial matters. It normally<br />
meets three to five times a year for between half a<br />
day and a whole day. The CEO, the CFO and the<br />
Group auditors, as well as other Members of Group<br />
Management and department heads, are invited<br />
as required. In 2009 one half-day meeting and several<br />
work sessions were held.<br />
Key Facts<br />
Chairman’s Message<br />
CEO’s Report<br />
Group Report<br />
Regional Report<br />
Corporate Social Responsibility<br />
Corporate Governance<br />
Financial Report
– Nomination and Compensation Committee<br />
Prof. Dr. Peter Littmann (Chairman since<br />
1 April 2009)<br />
The Nomination and Compensation Committee<br />
reviews the performance of the CEO and the other<br />
Members of Group Management. Together with<br />
the CEO it evaluates any new members of the most<br />
senior level of management and submits proposals<br />
accordingly to the Board of Directors. It also submits<br />
proposals to the Board of Directors about remuneration<br />
for Group Management and Members of the<br />
Board of Directors It formulates management share<br />
option plans for the Board of Director, Group Management<br />
and senior managers, and is the Group<br />
Management’s point of contact for all major human<br />
resources issues in the Charles Vögele Group.<br />
The CEO and the Head of Human Resources are<br />
asked to attend as required. In 2009, there were<br />
no separate committee meetings. The topics dealt<br />
with by the Nomination and Compensation Committee<br />
were discussed at the full Board meetings.<br />
– Strategy Committee<br />
Jan C. Berger (Chairman since 1 April 2009)<br />
The Strategy Committee periodically reviews<br />
Group strategy and the implementation by Group<br />
Management of the Board of Directors’ strategic<br />
guidelines. Working in close collaboration with Group<br />
Management, it submits proposals to the Board<br />
of Directors on changes to Group strategy as well as<br />
on major new additional business activities for<br />
the Group and/or the relinquishment of existing<br />
activities. It meets two or three times a year for<br />
at least a half or a full day. The CEO is asked to attend<br />
as required. During 2009, there were three half-day<br />
meetings and one two-day meeting with the whole<br />
Board.<br />
BOARD OF DIRECTORS<br />
36<br />
3.5 Allocation of responsibilities to the Board<br />
of Directors and Group Management<br />
The allocation of responsibilities to the Board of<br />
Directors and Group Management is defined in the<br />
organisational regulations of Charles Vögele<br />
Holding AG, which were completely revised as at<br />
26 October 2009. The Board of Directors delegates<br />
the management and representation of the<br />
company entirely to Group Management under<br />
the leadership of the CEO, unless stipulated otherwise<br />
by the law, the articles of association or the<br />
organisational regulations.<br />
In essence, the responsibilities and powers reserved<br />
for the Board of Directors by the internal organisational<br />
regulations are as follows: overall leadership<br />
of the company and the issuing of the necessary<br />
directives; defining and adjusting corporate strategy,<br />
financial and investment policy, the organisation<br />
and principles of accounting, financial control and<br />
planning; the appointment and dismissal of the<br />
persons entrusted with managing the Group and<br />
representing the company as set out in the Commercial<br />
Register entry, as well as succession planning<br />
for the Board of Directors and Group Management;<br />
supervision of Group Management, including with<br />
regard to compliance with the law, articles of<br />
association, regulations and directives; approval of<br />
business that the Group Management must or<br />
chooses to present to the Board; defining the payments<br />
made to Members of Group Management<br />
on the basis of a recommendation from the Nomination<br />
and Compensation Committee; approval of<br />
mass redundancies pursuant to Art. 335d of the<br />
Swiss Code of Obligations; and finally, the production<br />
of the <strong>Annual</strong> Report, preparations for the <strong>Annual</strong><br />
Shareholders‘ Meeting and implementation of its<br />
resolutions.<br />
Group Management has the authority to make decisions<br />
on the transactions assigned to it, although<br />
certain transactions require the consent of the Board<br />
of Directors if they are outside normal business<br />
operations or exceed the thresholds shown in the<br />
Competence Regulations. This mainly refers to
the following types of business: changes in the<br />
company‘s strategic direction; entry into new markets,<br />
areas of activity or fundamentally important<br />
locations, and withdrawal from existing ones; medium-term<br />
planning, annual budgets and investment<br />
planning; purchase and sale of subsidiaries and divisions;<br />
property transactions; agreement, extension<br />
and alteration of long-term borrowings; acquisition<br />
of non-current assets and/or other capital spending<br />
outside the approved budget; agreeing, cancelling<br />
or amending contracts with major shareholders<br />
or related persons; selecting, appointing, setting<br />
salaries for, dismissing and making termination<br />
agreements with employees, and making agreements<br />
with employees that differ significantly from the<br />
internal guidelines; taking on long-term credit, loans<br />
(incl. mortgages) or issuing bonds; guarantee<br />
commitments, letters of comfort, security, indemnifications<br />
and assumptions of liability of any sort<br />
for other companies or other legal entities and natural<br />
persons (apart from group companies); granting<br />
credits or loans to third parties outside the group;<br />
conducting court actions, concluding settlements<br />
or waiving company claims.<br />
3.6 Information and control instruments<br />
for Group Management<br />
The Board of Directors receives a monthly written<br />
report from Group Management that includes, among<br />
other items, the latest monthly figures, a financial<br />
statement up to the relevant month-end, plus further<br />
key figures relating to business activities. The<br />
Board of Directors also receives weekly sales figures<br />
for the individual sales organisations. The CEO<br />
informs the Chairman of the Board of Directors regularly<br />
in person about the current state of business<br />
and other key matters. At each Board meeting, Group<br />
Management informs the full Board of Directors<br />
about the current course of business.<br />
Group Management also makes available any additional<br />
information requested by the Board of<br />
Directors. This reporting is based on the budget<br />
approved by the Board of Directors, which is com-<br />
37<br />
pared every month against the latest business<br />
performance. Investments are approved en masse<br />
as part of the budget process, though single investments<br />
of more than CHF 2 million must be approved<br />
by the Board of Directors on an individual basis<br />
before they are made definitively. Any two Members<br />
of the Board of Directors and Group Management<br />
have collective signature power.<br />
Group Internal Audit reports to the CFO in organisational<br />
terms, but has a direct functional link to<br />
the Audit Committee. Internal Audit‘s reports are<br />
submitted to the Audit Committee. Internal Audit’s<br />
tasks continue to include branch audits, control<br />
functions relating to stocktaking, and training for<br />
branch heads. In addition, it is also responsible<br />
for process controlling with regard to procurement,<br />
distribution logistics and purchasing. Group Management<br />
and Internal Audit submit a report to the<br />
Audit Committee about the measures taken.<br />
Every year, the Board of Directors reviews a risk<br />
overview presented by Group Management.<br />
This overview details the main risks that could<br />
affect the company. It contains statements about<br />
the likelihood of the relevant risks occurring, as<br />
well as about the likely implications. This risk overview<br />
forms the basis for a list of measures that<br />
Group Management proposes and the Board of<br />
Directors approves. The implementation of these<br />
measures is reviewed annually.<br />
Key Facts<br />
Chairman’s Message<br />
CEO’s Report<br />
Group Report<br />
Regional Report<br />
Corporate Social Responsibility<br />
Corporate Governance<br />
Financial Report
From left to right:<br />
Markus Voegeli, CFO<br />
André Maeder, CEO<br />
Werner Lange, CPO<br />
38
4 GROUP MANAGEMENT<br />
Group Management is responsible for the operational<br />
management of the Charles Vögele Group.<br />
During the year under review, Group Management<br />
consisted of the Chief Executive Officer (CEO -<br />
from 18 August 2008 to 15 February 2009 Bernd H.<br />
J. Bothe; from 16 February 2009 André Maeder),<br />
the Chief Financial Officer (CFO - until 30 June 2009<br />
Dr. Felix Thöni; from 1 October 2009 Markus<br />
Voegeli), as well as the Chief Operating Officer<br />
(COO - Dr. Dirk Seifert) and the Chief Purchasing<br />
Officer (CPO - Werner Lange). The CEO heads<br />
Group Management with authority to issue directives.<br />
4.1 Members of Group Management<br />
André Maeder<br />
1959, Chief Executive Officer (CEO) since 16 February 2009,<br />
Swiss. Degree in retail business management. Member of the<br />
Group Executive Board of Hugo Boss from 2004 to 2009.<br />
Deputy CEO of S. Oliver Group 2002/2003; from 1995 to 2002,<br />
COO of Harrods. Worked for Charles Vögele from 1989 to<br />
1995 in various functions including head of purchasing.<br />
Markus Voegeli<br />
1961, Chief Financial Officer (CFO) since 1 October 2009,<br />
Swiss. Degree in economics. Before working as a freelance<br />
financial consultant from 2004 to 2008, he was CFO of<br />
the listed Valora Group, and from 2000 until 2004 he was CFO<br />
and then CEO of the start-up company Mediservice AG. Prior<br />
to this he worked for various Swissair group companies for<br />
13 years including CFO of Nuance Global Traders in Australia<br />
and Asia.<br />
Dr. Dirk Seifert<br />
1970, Chief Marketing & Sales Officer since 1 January 2008,<br />
Chief Operating Officer (COO) from 1 March 2009, German<br />
Doctorate in economics. From mid-2005 until the end of 2007<br />
Managing Director of Quelle GmbH and before that Global<br />
Chief Operating Officer of Esprit.<br />
Werner Lange<br />
1959, Chief Purchasing Officer (CPO) since 1 July 2007, German.<br />
Degree in retail business management. From 2003 to 2007,<br />
purchasing manager at Adler Modemärkte GmbH. Previously<br />
manager for purchasing and distribution in the menswear<br />
department at Karstadt. From 2000 to 2002, manager of the<br />
children and young fashion department at Karstadt.<br />
39<br />
Changes in Group Management<br />
During the year under review the following changes were<br />
made within Group Management:<br />
– As Chairman of the Board of Directors, Bernd H. J. Bothe<br />
took over the post of CEO on 18 August 2008 ad interim until<br />
15 February 2009.<br />
– André Maeder has been responsible for operational management<br />
of the Group as CEO since 16 February 2009.<br />
– Dr. Felix Thöni was CFO from 1 January 2003 until 30 June<br />
2009.<br />
– Markus Voegeli was appointed CFO on 1 October 2009.<br />
4.2 Other activities and interests<br />
The Members of Group Management do not conduct<br />
any major additional activities outside their<br />
areas of responsibility in corporations, institutions,<br />
or foundations organised under private or public<br />
law. Neither do they have any permanent executive<br />
or advisory functions in any major Swiss or foreign<br />
companies, interest groups, or political parties, or<br />
hold official posts or political offices.<br />
4.3 Management contracts<br />
There are no management contracts.<br />
Key Facts<br />
Chairman’s Message<br />
CEO’s Report<br />
Group Report<br />
Regional Report<br />
Corporate Social Responsibility<br />
Corporate Governance<br />
Financial Report
5 COMPENSATION, SHAREHOLDINGS<br />
AND LOANS<br />
5.1 Remuneration and profit-sharing programmes:<br />
content and procedures<br />
The Board of Directors’ Nomination and Compensation<br />
Committee is responsible for formulating<br />
compensation and profit-sharing programmes for<br />
Members of the Board of Directors and Group<br />
Management, and – with regard to the Management<br />
Share Option Plan – for members of the second<br />
level of management. The Committee recommends<br />
the levels at which compensation and profit shares<br />
should be set and submits these recommendations<br />
for decision by the Board of Directors.<br />
Members of the Board of Directors have a right of<br />
co-determination with regard to their own compensation.<br />
When the Board of Directors as a whole is<br />
deciding on compensation and profit shares for the<br />
other Members of Group Management, the CEO<br />
participates in the discussion and has a vote.<br />
Compensation for the Board of Directors and Group<br />
Management is reviewed every year by the whole<br />
Board of Directors as proposed by the Nomination<br />
and Compensation Committee unless contracts<br />
extend over several years. The basic aim when setting<br />
compensation for the Board of Directors and<br />
Group Management is to incentivise members of<br />
these bodies as effectively as possible to secure<br />
long-term increases in consolidated after-tax profit.<br />
Compensation for the Board of Directors and Group<br />
Management is made up of a fixed and a variable<br />
component. For Members of the Board of Directors<br />
the fixed part is a cash payment that varies according<br />
to function (Chairman, Vice-Chairman, Member).<br />
GROUP MANAGEMENT<br />
40<br />
For Members of Group Management the fixed part<br />
comprises a cash payment plus the use of a company<br />
car for business and private purposes. For Members<br />
of the Board of Directors the variable portion<br />
comprises a fixed percentage of 0.1 % of the aftertax<br />
consolidated profit. The variable portion paid to<br />
the Members of Group Management is partly<br />
defined by a fixed percentage of the after-tax consolidated<br />
profit, partly by their own individually<br />
agreed targets. The fixed element is paid out to<br />
Members of the Board of Directors every quarter,<br />
and to Members of Group Management twelve<br />
times a year.<br />
In order to link the interests of the Members of the<br />
Board of Directors, Group Management and members<br />
of the second level of management with those<br />
of shareholders, a management share option plan<br />
was defined for these groups in 2002. For further<br />
details of the timing of this option scheme, allocation<br />
criteria and individual parameters such as subscription<br />
ratios, underlying values, strike prices,<br />
maturities and blocking periods, please see note 35.1<br />
Management share option plan in the notes to the<br />
consolidated financial statements on page 48 of the<br />
financial section. Members of the Board of Directors,<br />
Group Management and the second level of management<br />
subscribed to options under the existing<br />
management share options plan during the year<br />
under review. Detailed information is given in note<br />
39 Related party transactions in the notes to the<br />
consolidated financial statements on page 53 of the<br />
financial section.<br />
Persons who left the Board of Directors or Group<br />
Management during the year under review received<br />
no additional payments or benefits in connection<br />
with their departure.<br />
Further information is also available in the “Nomination<br />
and Compensation Committee” part of section<br />
3.4 “Internal organisational structure” on page 36.
6 SHAREHOLDERS’ PARTICIPATION RIGHTS<br />
6.1 Voting right restrictions and representation<br />
The Company’s articles of association contain no<br />
restrictions on voting rights and comply with the law<br />
with regard to proxy voting.<br />
6.2 Statutory quorums<br />
The <strong>Annual</strong> Shareholders’ Meeting passes resolutions<br />
and conducts votes, unless mandatory statutory<br />
regulations dictate otherwise, by an absolute<br />
majority of the shareholders’ votes legally represented<br />
and validly cast, excluding spoilt votes<br />
and regardless of the number of shareholders present<br />
and the number of votes they represent. Each<br />
share entitles the holder to one vote at the <strong>Annual</strong><br />
Shareholders’ Meeting.<br />
6.3 Calling the <strong>Annual</strong> Shareholders’ Meeting<br />
The <strong>Annual</strong> Shareholders’ Meeting takes place no<br />
later than six months after the end of each company<br />
financial year. It is called by the Board of Directors.<br />
Shareholders are invited to the meeting by an<br />
invitation published in due time in the daily and<br />
financial media and the Swiss Commercial Gazette<br />
(Schweizerisches Handelsamtsblatt).<br />
6.4 Agenda items<br />
Shareholders who represent at least 0.5% of the<br />
share capital can make a request no later than<br />
45 days prior to the day of the meeting for items to<br />
be added to the agenda. The request has to be<br />
made in writing and state the motion that is to be<br />
put to the vote. One or more shareholders who<br />
between them represent at least 10% of the share<br />
capital can call an Extraordinary Shareholders’<br />
Meeting between annual meetings.<br />
41<br />
6.5 Entries in the share register<br />
The share capital of Charles Vögele Holding AG<br />
consists exclusively of bearer shares, so no share<br />
register is maintained.<br />
7 CHANGES IN CONTROL AND DEFENSIVE<br />
MEASURES<br />
There are no provisions (such as opting-out or<br />
opting-up clauses), either in the articles of association<br />
or in contracts of employment, or in any<br />
other agreements or plans, that relate to changes in<br />
control of the Company or defensive measures to<br />
prevent such a change.<br />
Key Facts<br />
Chairman’s Message<br />
CEO’s Report<br />
Group Report<br />
Regional Report<br />
Corporate Social Responsibility<br />
Corporate Governance<br />
Financial Report
8 AUDITORS<br />
8.1 Duration of mandate and term of office<br />
of the lead auditors<br />
The auditor for the Charles Vögele Group and Charles<br />
Vögele Holding AG is since April 2003 PricewaterhouseCoopers<br />
AG (PwC). It was confirmed as auditor<br />
for one year at the <strong>Annual</strong> Shareholders’ Meeting<br />
of 1 April 2009. Since 29 April 2003, the mandate to<br />
audit Charles Vögele Group and Charles Vögele<br />
Holding AG has been managed by Matthias von Moos,<br />
partner at PwC, Zug.<br />
8.2 Audit fee<br />
The auditor of Charles Vögele Holding AG is paid a fee<br />
totalling CHF 624 000 for carrying out the audit<br />
mandate in the business year 2009 plus CHF 105 550<br />
for additional audit-related services. The audit<br />
contract is for one year, and the appointment of<br />
Charles Vögele Holding AG’s auditor must be<br />
decided by the <strong>Annual</strong> Shareholders’ Meeting.<br />
8.3 Additional fees<br />
The Group auditor is paid a fee totalling CHF 97 600<br />
for tax consultancy services.<br />
8.4 Supervisory and control instruments<br />
for the auditors<br />
The external auditor carries out the statutory audit<br />
of Charles Vögele Holding AG and the Group’s<br />
individual companies, and also audits the Group’s<br />
consolidated accounts under IFRS. The external<br />
auditor does all this through an interdisciplinary team<br />
with international IFRS expertise and know ledge<br />
of the retail sector. Audit results for the individual<br />
companies and the Group are discussed twice<br />
a year with Group Management and the managements<br />
of the individual companies, as well as<br />
with the Audit Committee. A comprehensive report<br />
is prepared for Charles Vögele Holding AG and<br />
for the Group in accordance with art. 728b para. 1<br />
of the Swiss Code of Obligations and submitted<br />
to the Board of Directors. This contains the main<br />
points from the reports to the Audit Committee<br />
43<br />
and Group Management. In addition, recommendations<br />
are made to the Shareholders’ Meeting<br />
to adopt the annual financial statements and the<br />
consolidated financial statements.<br />
In addition to the audit of the annual accounts and<br />
the review of the half-year accounts, the external<br />
auditor analyses the strategic audit plan and examines<br />
internal processes. The results of these reviews<br />
are distributed in the form of a management letter<br />
to the Audit Committee and Group Management; the<br />
results are also discussed at a meeting with the<br />
Audit Committee. Where necessary, the external<br />
auditor may make recommendations or propose<br />
possible new audit requirements on the basis of<br />
these reviews.<br />
Each year, the Audit Committee assesses the<br />
performance, fees and independence of the auditor<br />
and suggests to the Board of Directors which<br />
external auditor should be proposed to the <strong>Annual</strong><br />
Shareholders‘ Meeting for election. Each year<br />
the Audit Committee also assesses the scope of<br />
external auditing, the audit plans and the relevant<br />
processes and discusses the results of the audit<br />
with the external auditors.<br />
There were three meetings between the external<br />
auditor and the Audit Committee during the year<br />
under review. The CEO attended some of the time<br />
and the CFO all of the time. According to the statutory<br />
provisions, the external audit company’s lead<br />
auditor must be rotated at least every seven years.<br />
Key Facts<br />
Chairman’s Message<br />
CEO’s Report<br />
Group Report<br />
Regional Report<br />
Corporate Social Responsibility<br />
Corporate Governance<br />
Financial Report
9 INFORMATION POLICY<br />
The Charles Vögele Group follows a transparent<br />
and open communications policy and is bound by<br />
the rules on ad hoc publicity. Shareholders are<br />
regularly and continually kept informed by the following<br />
means:<br />
– <strong>Annual</strong> report in German and English: this is<br />
published in accordance with statutory provisions<br />
no later than 20 days prior to the <strong>Annual</strong> Shareholders’<br />
Meeting, and is held at the company’s<br />
registered offices.<br />
– Half-year report and accounts in German and<br />
English: these are usually published in August<br />
each year.<br />
– <strong>Annual</strong> results media and analysts’ conference:<br />
this accompanies the presentation of the results,<br />
usually in March; there is also a conference on<br />
the interim results in August.<br />
– Ad hoc media releases as necessary.<br />
– Publication of media releases on the internet at<br />
www.charles-voegele.com under the Media<br />
Releases link.<br />
Detailed information on the company is always<br />
available to shareholders and other interested<br />
mem bers of the public on our website at<br />
www.charles-voegele.com.<br />
An overview of contact addresses and the relevant<br />
timetable for shareholder information can be<br />
found on page xx of the Activity Report, as well as<br />
on our website at www.charles-voegele.com, under<br />
the Investor Relations or Financial Calendar links.<br />
10 SIGNIFICANT EVENTS SINCE<br />
31 DECEMBER 2009<br />
No significant events occurred after 31 December<br />
2009.<br />
GROUP MANAGEMENT<br />
44
FINANCIAL <strong>REPORT</strong>
Content<br />
2 Financial Commentary<br />
6 Consolidated Income Statement, Consolidated<br />
Statement of Comprehensive Income<br />
7 Consolidated Balance Sheet<br />
8 Consolidated Statement of Cash Flows<br />
9 Consolidated Statement of Changes in Equity<br />
10 Notes to the Consolidated Financial Statements<br />
General information<br />
Summary of significant accounting policies<br />
22 Financial risk management<br />
27 Critical accounting estimates and assumptions<br />
29 Segment information<br />
30 Personnel expenses<br />
33 Rental expenses, Advertising and promotion expenses,<br />
General operating expenses, Other operating income<br />
34 Depreciation and impairment, Financial income, Financial expenses,<br />
Foreign exchange differences, Income tax<br />
37 Earnings per share, Cash and cash equivalents<br />
38 Receivables, advance payments and prepaid expenses<br />
39 Inventories, Assets held for sales<br />
40 Property, plant and equipment<br />
41 Financial assets<br />
42 Intangible assets<br />
44 Financial instruments by category (assets)<br />
Short-term financial liabilities, Other liabilities and accruals<br />
45 Finance lease liabilities, Provisions<br />
46 Mortgages, Loans<br />
47 Financial instruments by category (liabilities)<br />
48 Share capital, Treasury shares, Distribution to shareholders,<br />
Incentive and share ownership plans<br />
51 Contingent liabilities, Forward foreign exchange contracts<br />
53 Rental commitments, Related party transactions<br />
58 Risk assessment according to the Swiss Code of Obligations,<br />
Post balance sheet events<br />
59 Structure of the Charles Vögele Group<br />
60 Report of the statutory auditors<br />
1
FINANCIAL COMMENTARY<br />
Despite a very difficult market environment, a fall in net sales (largely as a result<br />
of currency influences) and a comprehensive clear-out of old stock, Charles Vögele<br />
Group still managed to post positive operating earnings (EBIT) of CHF 4 million in<br />
2009. This was made possible mainly by strict control of marketing expenditure<br />
and general operating costs. After finance costs and taxes, however, the company<br />
reported a net loss for 2009 of CHF 14 million. The sell-off of surplus old stock,<br />
which began in the second quarter, went as planned and made a significant contribution<br />
to the Group’s excellent cash position. Net debt fell to the historically low<br />
level of CHF 15 million, while inventories were CHF 109 million lower than the previous<br />
year at CHF 173 million. This puts Charles Vögele in an excellent financial<br />
position to change its business model and modernize its image – and to fund these<br />
changes from its own resources.<br />
> Group result<br />
Net sales fell 3.9% to CHF 1 310 million in 2009. However, currency-adjusted sales<br />
were more or less comparable (– 0.2%). Expansion had a CHF 32 million, or 2.4%,<br />
impact on sales.<br />
> Gross profit, inventories and cash flow all affected by the clear-out of old stock<br />
In May 2009, the Board of Directors, in response to a proposal by Management,<br />
approved a fundamental change in the direction of the company’s sell-off strategy.<br />
The revised discounting policy should ensure that in future all items are completely<br />
sold off within 18 months of their launch. This will open up more floor<br />
space for the latest seasonal items and create a broader product range. Another<br />
benefit is that the numerous warehouses for old stock, and the sorting and<br />
commissioning that go with them, will become superfluous. Approximately 12 million<br />
items, or more than a third of the inventory, worth more than CHF 80 million,<br />
were identified as surplus to requirements and should be cleared out by the end of<br />
March 2010. By the end of the year, two-thirds of the problem items were sold<br />
as plan-ned. The larger discounts had a CHF 40 million negative impact on gross<br />
profit. As well as the aggressive marketing of old items, the latest season’s items<br />
were also sold off in line with the new discounting policy. Thanks to lower purchasing<br />
volumes of the latest items, these stocks were also reduced. The reduction of<br />
inventories was an important component in the much higher cash flow, which was<br />
up CHF 85 million to CHF 188 million.<br />
Management focused on cost reductions throughout the year. Spending, especially<br />
on marketing and general operating expenses, was reduced significantly.<br />
Currency influences came to CHF 28 million, while the cost reductions associated<br />
with old items amounted to around CHF 7 million.<br />
2
Given the circumstances, the Group’s operating earnings (EBIT) of CHF 4 million<br />
can be seen as a positive result, despite being approximately CHF 43 million lower<br />
than the previous year’s figure. After taxes, the Group posted a loss of CHF<br />
14 million, a decline of CHF 26 million compared with profit recorded in 2008.<br />
> Switzerland Region<br />
In Switzerland, net sales fell by 1.9%, which is slightly better than the market<br />
as a whole (– 2.3%). In the course of the clear-out of old stock, the gross profit was<br />
down by approximately 6.0%, or CHF 15 million. More than half of the reduction<br />
was offset by lower costs. With income of CHF 49 million, Switzerland remains the<br />
Group’s most important earner.<br />
> Germany Region<br />
Net sales in Germany fell 5.0% in Swiss franc terms to CHF 418 million. After<br />
ad-justing for currency movements, sales were practically the same as in the prior<br />
year (– 0.1%). Despite efforts on the costs side, it proved impossible to compensate<br />
for the margin-driven decline, resulting in EBIT of minus CHF 18 million for the<br />
year. At the same time, the branch portfolio was streamlined, with the number of<br />
stores going down by 12 to 314.<br />
> Austria/Slovenia Region<br />
Austria/Slovenia saw net sales decrease by a disappointing 6.5% in Swiss franc<br />
terms. In local currency terms the fall was – 1.8%, which was worse than the<br />
shrinkage of the overall market (– 0.3%). Including the effect of the clear-out of<br />
old stock, gross profit margin was 3.7% lower than the prior year. Thanks to<br />
cost savings, however, a positive operating result of CHF 2 million has been achieved<br />
in 2009. The expansion continued in Slovenia, with two new stores opening,<br />
while the number of stores in Austria went down by two.<br />
> Benelux Region<br />
Net sales in the Benelux Region in 2009 were 5.8% lower than in the prior year.<br />
However, after adjusting for currency influences, the market position remained<br />
more or less the same – 1%. The region suffered disproportionately from the<br />
reduction of old stock, reporting a negative EBIT of CHF – 14 million at the end of<br />
the year, despite cost cuttings by CHF 2 million (currency-adjusted). In Belgium,<br />
the number of branches increased by 6 to 52, while in the Netherlands there were<br />
114 stores (previous year: 115).<br />
> CEE Region<br />
The CEE countries saw net sales go up by 7.2%, or 27% in local currency terms.<br />
However, most of this increase was driven by expansion, with the number of stores<br />
in all countries going up (from 44 to a total of 53). Negative currency effects on<br />
some cost components, the massive influence of the financial crisis on consumer<br />
behaviour, and price competition combined with the clear-out of old stock led to<br />
a further deterioration in EBIT to CHF – 15 million.<br />
3<br />
Financial Commentary<br />
Income Statement and Balance Sheet<br />
Cash Flow and Changes in equity<br />
notes<br />
Statutory Auditors
Finance costs and taxes<br />
Lower net debt and a favourable interest rate environment led to a CHF 8 million<br />
improvement in financial results. Even though the group posted a (pre-tax) net<br />
loss for the year, the remained tax expense is driven by the profitable Swiss Group<br />
companies.<br />
> Liquidity, cash flow and balance sheet ratios<br />
Consistent implementation of the decision to clear out old stock, and the simultaneous<br />
change in the policy on selling off items led to a reduction in inventories<br />
of 13 million items, or more than a third of the total. The capital tied up in inventories<br />
thus fell by CHF 109 million. Operating cash flow went up by CHF 85 million<br />
to CHF 188 million, and free cash flow went up to CHF 142 million thanks to the lower<br />
investment activity. Some of the cash that became available was used to reduce<br />
borrowings from the syndicated facility. As a result, the equity ratio was increased<br />
further to a healthy 59% despite the negative Group result.<br />
> Outlook<br />
In view of the negative earnings position, and in line with the company’s divi-<br />
dend policy, the Board of Directors will not be proposing a dividend payment at<br />
the Shareholders’ Meeting.<br />
Over the next two years, management will be focusing on the following areas:<br />
measures derived from the strategic review to verticalize and improve business<br />
and supply chain processes; implementing the new image in the stores; continuing<br />
the range initiatives; and making the switch to the modified discounting policy.<br />
The portfolio of stores is being further streamlined, and new stores are only<br />
being planned selectively in the established main markets.<br />
In a slowly recovering economic environment, management is planning to dou-<br />
ble the EBITDA margin to 10% in the medium term. A positive net profit is expected<br />
again in 2010, despite the fact that the clear-out of old stock will continue until<br />
March 2010.<br />
4
from January 1 to December 31<br />
CONSOLIDATED INCOME STATEMENT<br />
CHF 1000 Note 2009 2008 1)<br />
Net sales 1 310 248 1 363 965<br />
Cost of goods 19.1 (508 232) (473 191)<br />
Personnel expenses 6 (309 169) (320 785)<br />
Rental expenses 7 (241 621) (236 604)<br />
Advertising and promotion expenses 8 (91 360) (118 815)<br />
General operating expenses 9 (93 129) (104 474)<br />
Other operating income 10 4 536 2 686<br />
Operating earnings before depreciation and impairment (EBITDA) 71 273 112 782<br />
In % of net sales 5.4% 8.3%<br />
Depreciation and impairment 11 (67 189) (65 227)<br />
Operating earnings (EBIT) 4 084 47 555<br />
In % of net sales 0.3% 3.5%<br />
Financial income 12 386 929<br />
Financial expenses 13 (7 826) (10 526)<br />
Exchange gains/(losses), net 14 448 (4 895)<br />
Profit before income tax (2 908) 33 063<br />
In % of net sales (0.2%) 2.4%<br />
Income tax expenses 15 (10 835) (20 717)<br />
Net profit/(loss) of the year (13 743) 12 346<br />
In % of net sales (1.0%) 0.9%<br />
Basic earnings per share 16 (1.64) 1.46<br />
Diluted earnings per share 16 (1.64) 1.46<br />
The Notes on pages 10 to 59 are an integral part of these consolidated financial statements.<br />
1) Restatement see Note 2.2 to 2.3.<br />
from January 1 to December 31<br />
CONSOLIDATED STATEMENT OF COMPREhENSIVE INCOME<br />
CHF 1000 2009 2008 1)<br />
Net profit/(loss) (13 743) 12 346<br />
Currency translation differences of foreign subsidiaries (897) (21 165)<br />
Change of fair value of cash flow hedges after taxes 6 662 644<br />
Total other comprehensive income 5 765 (20 521)<br />
Total comprehensive income (7 978) (8 175)<br />
The Notes on pages 10 to 59 are an integral part of these consolidated financial statements.<br />
1) Restatement see Note 2.2 to 2.3.<br />
6
CHF 1000 Note 31.12.2009 31.12.2008 1) 1.1.2008<br />
Assets<br />
Current assets<br />
Cash and cash equivalents 17 127 649 47 947 42 076<br />
Receivables, advance payments<br />
and prepaid expenses 18 17 737 34 816 47 715<br />
Derivative financial instruments 24 4 221 6 321 79<br />
Inventories 19 173 022 282 628 288 741<br />
Assets held for sale 20 5 983 – –<br />
Total current assets 328 612 371 712 378 611<br />
Long-term assets<br />
Property, plant and equipment 21 400 354 428 414 443 402<br />
Financial assets 22 600 1 157 712<br />
Intangible assets 23 82 777 83 144 79 168<br />
Deferred tax assets 15 5 638 7 240 15 115<br />
Total long-term assets 489 369 519 955 538 397<br />
Total assets 817 981 891 667 917 008<br />
Liabilities and shareholders’ equity<br />
Current liabilities<br />
Short-term financial liabilities 25, 27 3 383 2 845 19 085<br />
Trade payables 47 926 53 303 61 714<br />
Derivative financial instruments 31 4 255 12 268 10 416<br />
Other liabilities and accruals 26 83 720 77 040 68 602<br />
Short-term tax liabilities 9 431 8 127 9 684<br />
Short-term provisions 28 6 063 456 535<br />
Total current liabilities 154 778 154 039 170 036<br />
Long-term liabilities<br />
Long-term lease liabilities 27 33 103 37 298 44 333<br />
Long-term provisions 28 6 747 6 874 7 273<br />
Deferred tax liabilities 15 32 708 38 629 40 431<br />
Mortgages 29 106 500 110 000 95 000<br />
Loans 30 – 49 458 39 303<br />
Total non current liabilities 179 058 242 259 226 340<br />
Shareholders’ equity<br />
as of December 31<br />
CONSOLIDATED BALANCE ShEET<br />
Share capital 32 30 800 35 200 52 800<br />
Treasury shares 33 (33 784) (33 428) (31 106)<br />
Other reserves 173 789 173 789 173 789<br />
Retained earnings 313 340 319 808 325 149<br />
Total shareholders’ equity 484 145 495 369 520 632<br />
Total liabilities and shareholders’ equity 817 981 891 667 917 008<br />
The Notes on pages 10 to 59 are an integral part of these consolidated financial statements.<br />
1) Restatement see Note 2.2 to 2.3.<br />
7<br />
Financial Commentary<br />
Income Statement and Balance Sheet<br />
Cash Flow and Changes in equity<br />
notes<br />
Statutory Auditors
from January 1 to December 31<br />
CONSOLIDATED STATEMENT OF CASh FLOwS<br />
CHF 1000 Note 2009 2008 1)<br />
Net profit/(loss) for the year (13 743) 12 346<br />
Adjustments:<br />
– Tax expenses 15 10 835 20 717<br />
– Net financial expenses 12, 13, 14 6 992 14 492<br />
– Depreciation and impairment 11 67 189 65 227<br />
– Profit on disposal of assets (49) (300)<br />
– Other non-cash expenses 1 659 3 019<br />
Change in long-term provisions 5 495 311<br />
Change in inventories 109 881 (13 057)<br />
Change in net working capital 10 895 33 317<br />
Operating earnings after changes in net working capital 199 154 136 072<br />
Financial income received 2 523 929<br />
Financial expenses paid (6 956) (16 618)<br />
Taxes paid (7 033) (16 929)<br />
Cash flow from operating activities 187 688 103 454<br />
Investments in intangible assets 23.1 (3 324) (6 956)<br />
Disposals of intangible assets 23.1 40 –<br />
Investments in property, plant and equipment 21.1 (44 627) (72 259)<br />
Disposals of property, plant and equipment 2 291 529<br />
(Investments in)/Disposals of financial assets 80 (500)<br />
Net cash provided/(used) by investing activities (45 540) (79 186)<br />
Change in bank loans 30 (50 000) 10 000<br />
Change in finance lease liabilities (3 663) (4 797)<br />
Purchase of treasury shares 33 (6 509) (6 223)<br />
Disposals of treasury shares 33 5 795 3 048<br />
Change in mortgages 29 (3 500) 15 000<br />
Distribution to shareholders 34 (4 191) (16 932)<br />
Net cash provided/(used) by financing activities (62 068) 96<br />
Net increase/(decrease) in cash and cash equivalents 80 080 24 364<br />
Net cash and cash equivalents at the beginning of the period 17 47 947 27 128<br />
Effect of exchange rate changes (378) (3 545)<br />
Net increase/(decrease) in cash and cash equivalents 80 080 24 364<br />
Net cash and cash equivalents at the end of the period 17 127 649 47 947<br />
The Notes on pages 10 to 59 are an integral part of these consolidated financial statements.<br />
1) Restatement see Note 2.2 to 2.3.<br />
8
CHF 1000 Note<br />
Share<br />
capital<br />
from January 1 to December 31<br />
CONSOLIDATED STATEMENT OF ChANGES IN EquITY<br />
Treasury<br />
shares<br />
Share<br />
premium<br />
reserve<br />
9<br />
Retained<br />
earnings<br />
Currency<br />
translation<br />
differences<br />
Valuation<br />
financial<br />
instruments<br />
Valuation<br />
share<br />
option<br />
plan Total<br />
Balance 31.12.2007 32 52 800 (31 106) 173 789 335 970 (4 697) (6 824) 3 350 523 282<br />
Effect of changes<br />
in accounting policies 2.2 – – – (2 634) (16) – – (2 650)<br />
Balance 31.12.2007<br />
restated 52 800 (31 106) 173 789 333 336 (4 713) (6 824) 3 350 520 632<br />
Comprehensive<br />
income 1) – – – 12 346 (21 165) 644 – (8 175)<br />
Value of<br />
granted options 35 – – – – – – 3 019 3 019<br />
Value of exercised/<br />
expired options 35 – – – 506 – – (506) –<br />
Disposals of<br />
treasury shares 33 – 3 233 – (185) – – – 3 048<br />
Purchase of<br />
treasury shares 33 – (6 223) – – – – – (6 223)<br />
Par value reduction 34 (17 600) 668 – – – – – (16 932)<br />
Balance 31.12.2008 32 35 200 (33 428) 173 789 346 003 (25 878) (6 180) 5 863 495 369<br />
Balance 31.12.2008 32 35 200 (33 428) 173 789 346 003 (25 878) (6 180) 5 863 495 369<br />
Comprehensive<br />
income – – – (13 743) (897) 6 662 – (7 978)<br />
Value of<br />
granted options 35 – – – – – – 1 659 1 659<br />
Value of exercised/<br />
expired options 35 – – – 1 169 – – (1 169) –<br />
Disposals of<br />
treasury shares 33 – 5 944 – (149) – – – 5 795<br />
Purchase of<br />
treasury shares 33 – (6 509) – – – – – (6 509)<br />
Par value reduction 34 (4 400) 209 – – – – – (4 191)<br />
Balance 31.12.2009 32 30 800 (33 784) 173 789 333 280 (26 775) 482 6 353 484 145<br />
The Notes on pages 10 to 59 are an integral part of these consolidated financial statements.<br />
1) Restatement see Note 2.2 to 2.3.<br />
Financial Commentary<br />
Income Statement and Balance Sheet<br />
Cash Flow and Changes in Equity<br />
notes<br />
Statutory Auditors
NOTES TO ThE CONSOLIDATED FINANCIAL STATEMENTS<br />
1 General information<br />
Charles Vögele Holding AG, together with its subsidiary companies, forms the<br />
Charles Vögele Group, an independent European fashion retail group with sales<br />
outlets in Switzerland, Germany, the Netherlands, Belgium, Austria, Slovenia,<br />
Poland, Hungary and the Czech Republic.<br />
Charles Vögele Holding AG is a corporation that is domiciled in Pfäffikon SZ,<br />
Switzerland, and listed on the SIX Swiss Exchange.<br />
2 Summary of significant accounting policies<br />
2.1 Preparation of the financial statements<br />
The consolidated financial statements in this report are based on the individual<br />
financial statements of Charles Vögele Group companies, which are all prepared<br />
in accordance with standard Group guidelines. The Group’s accounts have been<br />
prepared in accordance with the International Financial Reporting Standards (IFRS)<br />
on the basis of historical cost convention, except derivative financial instruments<br />
which are recorded at fair value. Note 4 explains the most important accounting<br />
assumptions and estimates.<br />
2.2 Changes in accounting policies<br />
> New IFRS standards and interpretations<br />
The following new IFRS standards, changes to existing standards and interpretations<br />
of existing standards, valid since January 1, 2009, affect these annual<br />
financial statements and have been applied:<br />
– IFRS 1: First-time adoption of International Financial Reporting Standard<br />
(amendment)<br />
– IFRS 7: Financial instruments (amendment)<br />
– IFRS 8: Operating segments (new)<br />
– IAS 1: Presentation of financial statements (amendment)<br />
– IFRIC 13: Customer loyalty programmes (new)<br />
The changes that have a material effect on these 2009 financial statements are<br />
explained below.<br />
> IFRS 8: Operating segments<br />
Based on the new IFRS 8 standard, valid from January 1, 2009, segment reporting<br />
has been restated and now is inline with the company’s internal reporting to the<br />
Board of Directors and Group Management. In order to give a more comprehensive<br />
view of the individual segments’ financial performances, net income previously<br />
shown under central services has been allocated proportionately to the individual<br />
segments. The new segment reporting covers the five segments Switzerland,<br />
Germany, Austria/Slovenia, Benelux and CEE (Poland, Hungary and Czech Republic).<br />
The new standard affects the structure of segment reporting but has no ef-<br />
fect on the Group’s asset, financial or earnings situation. The comparative figures<br />
shown in the segment reporting have been adjusted accordingly.<br />
10
IFRIC 13: Customer loyalty programmes<br />
According to the new interpretation IFRIC 13 (Customer loyalty programmes),<br />
which was made compulsory from January 1, 2009, unused vouchers distributed<br />
as part of a loyalty card programme must be deferred according to the “deferred<br />
revenue method” at fair value. Instead of deferring the purchase cost, which has<br />
been the practice previously, deferral must now be based on revenue. This change<br />
has increased the liabilities shown for loyalty card programmes in previous periods,<br />
leading to a retrospective adjustment in the previous year’s figures (see Note 2.3).<br />
> Changes to IFRS standards valid for future reporting periods<br />
The Charles Vögele Group has assessed the potential impact of new standards<br />
and interpretations which became or will become effective after January 1, 2009.<br />
The Group concluded that with the exception of IFRS 9 “Financial Instruments –<br />
Classification and Measurement” none of the standards or interpretations which<br />
have been published by the time of the release of these financial statements will<br />
have a significant effect on the Group’s result and financial position. IFRS 9 needs<br />
to be adopted by January 1, 2013. This standard will change the classification<br />
and measurement of financial instruments and hedging requirements. The Charles<br />
Vögele Group is evaluating the potential impact of this new standard on the con-<br />
solidated financial statements.<br />
2.3 Overview of changes and corrections in the prior period<br />
The retrospective changes and corrections in the prior period described in Note<br />
2.2 are shown in the following overviews:<br />
11<br />
Financial Commentary<br />
Income Statement and Balance Sheet<br />
Cash Flow and Changes in equity<br />
Notes<br />
Statutory Auditors
CHF 1000<br />
Consolidated Income Statement<br />
12<br />
2008<br />
published IFRIC 13<br />
2008<br />
restated<br />
Net sales 1 368 874 (4 909) 1 363 965<br />
Cost of goods (474 785) 1 594 (473 191)<br />
Personnel expenses (320 785) – (320 785)<br />
Rental expenses (236 604) – (236 604)<br />
Advertising and promotion expenses (118 815) – (118 815)<br />
General operating expenses (104 474) – (104 474)<br />
Other operating income 2 686 – 2 686<br />
Operating earnings before depreciation and impairment (EBITDA) 116 097 (3 315) 112 782<br />
In % of net sales 8.5% 8.3%<br />
Depreciation and impairment (65 227) – (65 227)<br />
Operating earnings (EBIT) 50 870 (3 315) 47 555<br />
In % of net sales 3.7% 3.5%<br />
Financial income 929 – 929<br />
Financial expenses (10 526) – (10 526)<br />
Exchange gains/(losses), net (4 895) – (4 895)<br />
Profit before income tax 36 378 (3 315) 33 063<br />
In % of net sales 2.7% 2.4%<br />
Income tax expenses (20 937) 220 (20 717)<br />
Net profit/(loss) of the year 15 441 (3 095) 12 346<br />
In % of net sales 1.1% 0.9%<br />
Basic earnings per share 1.83 1.46<br />
Diluted earnings per share 1.83 1.46<br />
CHF 1000<br />
Assets<br />
Consolidated Balance Sheet (condensed)<br />
31.12.2008<br />
published IFRIC 13<br />
31.12.2008<br />
restated<br />
Total current assets 371 712 – 371 712<br />
Total long-term assets 519 955 – 519 955<br />
Total assets 891 667 – 891 667<br />
Liabilities and shareholders’ equity<br />
Current liabilities (accruals) 148 202 5 837 154 039<br />
Long-term liabilities (deferred tax liabilities) 242 690 (431) 242 259<br />
Shareholders’ equity (retained earnings) 500 775 (5 406) 495 369<br />
Total liabilities and shareholders’ equity 891 667 – 891 667
CHF 1000<br />
Consolidated Statement of Cash Flows (condensed)<br />
13<br />
2008<br />
published IFRIC 13<br />
2008<br />
restated<br />
Net profit for the year 15 441 (3 095) 12 346<br />
Adjustments:<br />
– Tax expenses 20 937 (220) 20 717<br />
– Net financial expenses 14 492 – 14 492<br />
– Depreciation and impairment 65 227 – 65 227<br />
– Profit on disposal of assets (300) – (300)<br />
– Other non-cash expenses 3 019 – 3 019<br />
Change in long-term provisions 311 – 311<br />
Change in inventories (13 057) – (13 057)<br />
Change in net working capital 30 002 3 315 33 317<br />
Financial income received 929 – 929<br />
Financial expenses paid (16 618) – (16 618)<br />
Taxes paid (16 929) – (16 929)<br />
Cash flow from operating activities 103 454 – 103 454<br />
Consolidated statement of Comprehensive Income<br />
This table has been applied for the first time in these financial statements because<br />
of the changes in IAS 1 (Presentation of financial statements).<br />
CHF 1000 2008 IFRIC 13<br />
2008<br />
restated<br />
Net profit/(loss) 15 441 (3 095) 12 346<br />
Currency translation differences of foreign subsidiaries (21 504) 339 (21 165)<br />
Change of fair value of cash flow hedges after taxes 644 – 644<br />
Total other comprehensive income (20 860) 339 (20 521)<br />
Comprehensive income (5 419) (2 756) (8 175)<br />
2.4 Basis of consolidation<br />
The consolidated financial statements comprise the financial statements of<br />
Charles Vögele Holding AG and its Swiss and international Group companies.<br />
The Capital consolidation is performed using the purchase method in accordance<br />
with the new valuation method, meaning that the acquisition cost of investments<br />
due for consolidation is set off against their proportionate operating equity capital<br />
at the time of acquisition.<br />
Assets and liabilities as well as the expenses and income of the companies<br />
which Charles Vögele Holding AG controls directly or indirectly, and in which it has<br />
a voting interest exceeding 50 %, are included in full in the consolidated financial<br />
statements. The interest of minority shareholders in net assets and net income is<br />
disclosed separately in the consolidated balance sheet and income statement.<br />
The Charles Vögele Group does not have any minority interests.<br />
Financial Commentary<br />
Income Statement and Balance Sheet<br />
Cash Flow and Changes in equity<br />
Notes<br />
Statutory Auditors
The Charles Vögele Group does not have any associated companies (minority<br />
stake with voting rights of 20 – 50 %).<br />
Intercompany receivables and payables, income and expenses between companies<br />
included in the consolidation, and intercompany profits within the Group<br />
are eliminated.<br />
The companies included in the sope of consolidation are listed in Note 42.<br />
2.5 Scope of consolidation<br />
There were no changes in the scope of consolidation in the 2009 financial year.<br />
Change in 2008: Charles Voegele Romania SRL was founded as part of the effort<br />
to establish Romania as a pilot market. It is 100% owned by Charles Vögele<br />
Holding AG and is fully consolidated. This company is inactive because the expansion<br />
in Romania is not going ahead.<br />
2.6 Segment reporting<br />
The Charles Vögele Group is a centrally managed group with a flat organizational<br />
structure operating solely in the fashion trade. The centralization and scalability<br />
of the concept are fundamental cornerstones of the Group’s strategy. Segment<br />
reporting matches the internal reporting to the Board of Directors and Group<br />
Management (CODM), it covers the five segments Switzerland, Germany, Austria/<br />
Slovenia, Benelux and CEE (Poland, Hungary, Czech Republic).<br />
2.7 Foreign currency translation<br />
The consolidated financial statements are prepared in CHF. For the individual<br />
Group companies, the respective local currency is the functional currency.<br />
Foreign currency transactions are translated into the functional currency at the<br />
exchange rate prevailing on the date of the transaction. Gains and losses that<br />
result from foreign currency transactions, or from the translation at the year-end<br />
rate of monetary assets and liabilities denominated in foreign currencies, are<br />
recorded in the income statement.<br />
On consolidation, all assets and liabilities in balance sheets prepared in foreign<br />
currencies are translated into the Group’s reporting currency using year-end<br />
exchange rates. Income and expenses recorded in income statements prepared<br />
in foreign currencies are translated into the Group’s reporting currency at av-<br />
erage exchange rates for the year. Exchange differences arising from those translations<br />
are allocated directly to retained earnings in the balance sheet. The average<br />
rates of exchange for the year are not significantly different from the trans-<br />
action rates. Foreign currency differences arising from the valuation of long-<br />
term loans with equity character between Group companies are – like net invest-<br />
ments in a foreign operation – recorded in equity, with no effect in the income<br />
statement, until repayment.<br />
14
When a Group company is sold, the currency translation differences booked<br />
to equity are offset against the net sales proceeds and charged to the income<br />
statement.<br />
The following CHF exchange rates are used for the Group’s major currencies:<br />
2009 ISO code Unit<br />
15<br />
Balance<br />
sheet<br />
Income<br />
statement<br />
Euro EUR 1 1.48 1.51<br />
Hong Kong HKD 1 0.13 0.14<br />
China CNY 1 0.15 0.16<br />
USA USD 1 1.03 1.09<br />
Hungary HUF 100 0.55 0.54<br />
Poland PLN 100 36.10 34.95<br />
Czech Republic CZK 100 5.51 5.72<br />
Romania RON 100 35.03 35.23<br />
2008 ISO code Unit<br />
Balance<br />
sheet<br />
Income<br />
statement<br />
Euro EUR 1 1.49 1.59<br />
Hong Kong HKD 1 0.14 0.14<br />
China CNY 1 0.15 0.16<br />
USA USD 1 1.06 1.08<br />
Hungary HUF 100 0.56 0.63<br />
Poland PLN 100 35.67 45.17<br />
Czech Republic CZK 100 5.59 6.36<br />
Romania RON 100 37.08 43.14<br />
2.8 Net sales and revenue recognition<br />
Net sales include all revenues from the sale of goods and commission business,<br />
less discounts, sales tax and deductions including credit card commissions<br />
and other price discounts. Earnings are recorded at the cash desk when the goods<br />
are handed over to customers.<br />
> Customer loyalty programme<br />
Award credits granted in connection with the customer loyalty programme are<br />
recognized as reductions in sales at the time granted. Discount vouchers that have<br />
not yet been redeemed are shown on the balance sheet as liabilities.<br />
Financial Commentary<br />
Income Statement and Balance Sheet<br />
Cash Flow and Changes in equity<br />
Notes<br />
Statutory Auditors
2.9 Cost of goods<br />
The cost of goods sold includes the purchase price less discounts for products<br />
sold in the current period, transport costs, inventory differences, changes in value<br />
adjustments on inventory and the cost of conditioning new goods. This item in-<br />
cludes no personnel costs.<br />
2.10 Employee pension plans<br />
Within the Charles Vögele Group there are various defined benefit and defined<br />
contri bution pension plans based on the regulations of the different countries<br />
concerned.<br />
For defined benefit pension plans the coverage surplus or deficit recorded in<br />
the balance sheet is equivalent to the present value of defined benefit obligations<br />
(DBO) on the balance sheet date less the fair value of plan assets, adjusted for<br />
unrecorded actuarial gains and losses and for unrecognized past service costs.<br />
The DBO is calculated at least every three years by an independent actuary<br />
using the projected unit credit method. Actuarial gains and losses as well as alter-<br />
ations to asset limits are booked to the income statement over the employees’<br />
remaining average employment period as long as they exceed 10 % of the value of<br />
plan assets or 10 % of benefit-related liabilities. If there is a surplus, the future<br />
economic benefit of this surplus is assessed and if required capitalized and value<br />
adjusted in further periods.<br />
For defined contribution plans, the Group pays contributions to a public or private<br />
pension insurance scheme either on the basis of a legal or contractual obligation,<br />
or voluntarily. The Group has no further payment obligations beyond the payment<br />
of these contributions. Contributions are recorded under personnel expenses<br />
when they fall due.<br />
2.11 Financial expenses<br />
Interest costs are charged directly to the income statement.<br />
2.12 Cash and cash equivalents<br />
Cash and cash equivalents include cash held at stores and cash balances from<br />
current business activity with original maturities of less than three months. Cash<br />
held on sight at banks is managed through a Group-wide cash-pooling system.<br />
Foreign currency positions are valued at the exchange rate as of December 31.<br />
2.13 Receivables and advance payments<br />
Charles Vögele Group normally does not carry customer receivables since the vast<br />
majority of sales to customers are cash sales. Receivables and advance payments<br />
are recognized initially at fair value (normally the nominal value) less necessary<br />
value adjustments. A value adjustment is made when it becomes probable that the<br />
receivable cannot be collected. Receivables are usually derecognized in full if the<br />
creditor is subject to insolvency or bankruptcy proceedings.<br />
16
2.14 Inventories<br />
Inventories are valued at the lower of cost or net realizable value. Purchase costs<br />
include the actual purchase price plus transport and other procurement costs,<br />
less discounts received, and are defined on the basis of the average cost method.<br />
The net realizable value is the estimated sales revenue that can be achieved in<br />
normal business, less the necessary cost to sell. An inventory valuation system is<br />
used to take into account the ageing structure of the inventory. Purchases of<br />
goods in foreign currencies are converted at the exchange rate on the date of the<br />
transaction or at the hedged exchange rate of the goods purchased.<br />
2.15 Derivative financial instruments and hedge accounting<br />
Derivatives are initially recognized at fair value on the date of purchase and sub-<br />
sequently remeasured at their fair value. With the excep tion of derivative financial<br />
instruments which meet the requirements of a cash flow hedge, all adjustments<br />
are recognized in financial income or expense.<br />
In order to recognize a transaction as a hedge, the Charles Vögele Group documents<br />
at the inception of the transaction the relationship between hedging in stru -<br />
ments and hedged items, including the risk management strategy and an assessment<br />
of effectiveness.<br />
The Charles Vögele Group uses hedge accounting for cash flow hedges which are<br />
classified as highly effective, for which the effect can be measured reliably and for<br />
which future cash flows have a high probability to occur.<br />
The effective portion of changes in the fair value of the hedging instrument, designated<br />
as a cash flow hedge, is recognized in equity. The ineffective portion of the<br />
change in value is recognized in the income statement.<br />
The amounts shown under shareholders’ equity are charged to the income statement<br />
in the period in which the underlying transaction is also booked, except in the<br />
case of non-monetary assets in the initial valuation on purchase costs.<br />
When a hedging instrument expires or is sold, or when a hedge no longer meets<br />
the criteria for hedge accounting, any cumulative gain or loss existing in equity at<br />
that time remains in equity and is recognized when the underlying transaction is<br />
ultimately recognized in the income statement. When a forecast transaction is no<br />
longer expected to occur, the cumulative recorded gain or loss in equity is immediately<br />
transferred to the income statement.<br />
17<br />
Financial Commentary<br />
Income Statement and Balance Sheet<br />
Cash Flow and Changes in equity<br />
Notes<br />
Statutory Auditors
2.16 Property, plant and equipment<br />
> Land and buildings<br />
Land and buildings include properties in Switzerland that are used mainly as stores,<br />
as well as distribution centres in Switzerland, Germany and Austria. Land and<br />
buildings are recognized at acquisition cost less accumulated depreciation for build-<br />
ings and any impairments (see Note 2.19). This valuation is periodically checked<br />
by an independent external expert. Buildings are depreciated on a straight-line basis<br />
over a period of 40 years. Buildings in leasehold are depreciated over the leasehold<br />
period up to a maximum of 40 years. Land is not depreciated.<br />
> Equipment<br />
Equipment includes store fittings, technical warehouse equipment, computer<br />
hardware, office fixtures and fittings and other tangible assets used in operations.<br />
They are capitalized if the company derives a future economic benefit associ-<br />
ated with them. Valuation is at acquisition cost less accumulated depreciation and<br />
impairments if necessary (see Note 2.19). The depreci ation period is carried out<br />
using the straight-line method and is normally based on their estimated useful live<br />
as follows:<br />
Building and equipment such as fixtures and<br />
fittings of stores, warehouses and offices: 10 years<br />
Computer hardware: 5 years<br />
2.17 Financial instruments (assets)<br />
All purchases and sales of financial assets are recognized on the day the Group<br />
commits to the purchase or sale. Financial assets that are not recorded in the<br />
income statement at fair value are recognized on purchase at fair value plus trans-<br />
action costs. Financial assets that are recorded in the income statement at fair<br />
value are initially recognized at fair value, which is usually equivalent to the pur-<br />
chase price, and transaction costs are charged to the income statement. Financial<br />
assets are derecognized as soon as the rights to cash flows from the asset<br />
expire or are transferred and the Group has assigned all the material risks and<br />
benefits associated with ownership thereof.<br />
Financial assets are divided into the following four categories. The choice of<br />
category depends on the purpose for which the financial asset was acquired.<br />
18
Financial assets at fair value through profit or loss<br />
This category includes derivative financial instruments that are not designated to<br />
hedge accounting. Any changes in value are recognized in the income statement.<br />
> Loans and receivables<br />
Loans and receivables are non-derivative financial assets with determinable pay-<br />
ments that are not quoted on an active market. They are shown under current<br />
assets provided their maturity is not more than twelve months after the balance<br />
sheet date. Otherwise they are shown as long-term assets. In the Group balance<br />
sheet, the position “Receivables, advance payments and prepaid expenses” (see<br />
Note 18) is recorded under this category. Loans and receivables are recognized<br />
at amortized cost.<br />
> Financial assets held to maturity<br />
Held-to-maturity financial assets are non-derivative financial assets with fixed or<br />
determinable payments and fixed maturities that Charles Vögele Group has the<br />
positive intention and ability to hold to maturity. Charles Vögele Group did not hold<br />
any assets in this category in the 2009 and 2008 financial years.<br />
> Available-for-sale financial assets<br />
Available-for-sale financial assets are non-derivative financial assets that have<br />
been assigned to this category or that have not been assigned to any of the other<br />
categories. They are carried as long-term assets unless there is a plan to sell<br />
them within twelve months of the balance sheet date. The investments shown for<br />
2009 and 2008 are recorded under this category (see Note 22).<br />
2.18 Intangible assets<br />
> Goodwill<br />
Goodwill represents the excess of the cost of an acquisition of a company or of<br />
business activities in the form of net assets over the fair value of the Group’s share<br />
of the net identifiable assets of the acquired company or business activities at<br />
the date of acquisition. Goodwill is tested annually for impairment (see Note 2.19).<br />
> Other intangible assets<br />
Other intangible assets include IT software, trademarks and licenses. They are<br />
capitalized if the company derives a future economic benefit from them, and if their<br />
historical purchase costs can be valued reliably.<br />
Other intangible assets have a defined useful life and are carried at cost less accu-<br />
mulated depreciation and any impairments (see Note 2.19). IT software is depreciated<br />
using the straight-line method over five years; licenses and trademarks are<br />
depreciated over their estimated useful life.<br />
19<br />
Financial Commentary<br />
Income Statement and Balance Sheet<br />
Cash Flow and Changes in equity<br />
Notes<br />
Statutory Auditors
2.19 Impairment of assets<br />
All capitalized assets are reviewed annually for indications that the carrying amount<br />
may not be recoverable. When there is evidence of impairment, an impairment<br />
test is carried out. An impairment test is also carried out on goodwill positions even<br />
if there is no evidence of impairment (see Note 2.18). This test identifies the<br />
recoverable amount; if this is less than the carrying amount, an impairment cost<br />
equivalent to the difference between the carrying amount and the recoverable<br />
amount is charged to the income statement as an impairment cost.<br />
> Recoverable amount<br />
The recoverable amount is the higher of the value in use and the fair value less<br />
costs to sell.<br />
> Value in use<br />
The value in use is the present value of estimated future cash flow that can be<br />
expected from the continued use of the asset and from its disposal at the end of<br />
its useful life.<br />
> Fair value less cost to sell<br />
The fair value less costs to sell is the amount for which an asset can be sold in<br />
a transaction under normal market conditions between knowledgeable and willing<br />
contracting parties, less cost to sell.<br />
2.20 Deferred taxes<br />
Deferred taxes, which are calculated using the liability method, are used for all<br />
temporary differences arising between the tax value of assets and liabilities and<br />
their carrying amounts in the IFRS financial statements. Deferred taxes are<br />
deter mined using tax rates (and tax laws) that apply on the balance sheet date,<br />
or that have been enacted by the balance sheet date and are expected to apply<br />
when the related deferred income tax asset is realized or the deferred income<br />
tax liability is settled.<br />
Deferred tax assets from loss carry-forwards are recognized to the extent that it<br />
is probable that a taxable profit will be available in the foreseeable future against<br />
which the temporary differences can be utilized.<br />
Deferred tax liabilities arising from temporary differences relating to investments<br />
in subsidiaries are applied, except where the timing of the reversal of the temporary<br />
difference can be controlled by the Group and it is probable that the temporary<br />
difference will not be reversed in the foreseeable future.<br />
2.21 Trade payables<br />
Trade payables are valued at the foreign exchange rate as of December 31.<br />
20
2.22 Financial liabilities<br />
Financial liabilities include short-term financial liabilities, liabilities from finance<br />
leases, mortgages and loans. They are recognized initially at fair value, net of<br />
transac tion costs incurred. They are subsequently stated at amortized cost; any<br />
difference between the proceeds (net of transaction costs) and the redemption<br />
value is recognized as financial income or expense in the income statement over<br />
the period of the borrowings using the effective interest method.<br />
Financial liabilities are classified as short-term liabilities as long as the contractual<br />
term is less than twelve months and the Group does not have an unconditional<br />
right to defer settlement of the liability for at least twelve months after the balance<br />
sheet date.<br />
2.23 Provisions<br />
Provisions are recognized in the balance sheet when a present legal or constructive<br />
obligation based on an event which has occurred in the past, when it is likely that<br />
a outflow of resources will occur if the liability is met, and when the amount of the<br />
liability can be assessed reliably.<br />
If interest represents a significant part of the expected expenses, the provisions<br />
are recognized on a discounted value basis.<br />
2.24 Leasing<br />
> Finance leasing<br />
Leasing objects that are financed over the estimated useful life of the asset, and<br />
where ownership is transferred to the Group after expiry of the usually non-cancellable<br />
contract, are shown as finance leases and under tangible assets (see Note<br />
21.2). Acquisition costs are depreciated using the straight-line method over the use-<br />
ful life or contractual life of the asset, whichever is shorter. The liabilities are re-<br />
corded on the balance sheet at discounted present value. All other leasing com mitments<br />
are classified as operating leasing.<br />
> Operating leasing<br />
Operating leasing includes leases where all risks and rewards associated with own-<br />
ership of the asset rest with an independent third party. Operating lease payments<br />
are charged to the income statement.<br />
2.25 Treasury shares<br />
The costs of treasury shares of Charles Vögele Holding AG purchased by any Group<br />
company are deducted from the Group’s shareholders’ equity (see “Trea sury<br />
shares” under the consolidated statement of changes in Group equity) until the<br />
shares are cancelled, reissued or disposed of. Where such shares are subse-<br />
quently sold or reissued, the difference between the proceeds and the original<br />
purchase price is included in equity with no effect on the income statement.<br />
21<br />
Financial Commentary<br />
Income Statement and Balance Sheet<br />
Cash Flow and Changes in equity<br />
Notes<br />
Statutory Auditors
2.26 Valuation of share option plan<br />
The Group operates an equity-settled, share-based compensation plan (see Note<br />
35). The fair value of issued options is recognized proportionally over the vest-<br />
ing period under personnel expenses in the income statement and under shareholders’<br />
equity. Fair value is assessed using the Enhanced American Model (EA<br />
Model), which is inline with generally accepted valuation methods for determining<br />
share option prices and which takes into account all the factors and assumptions<br />
that reasonable contracting market participants would consider when setting<br />
prices. When options are exercised or expire, the fair value originally booked to<br />
shareholders’ equity is charged against retained earnings.<br />
3 Financial risk management<br />
Charles Vögele Group is exposed to various financial risks, including market risks<br />
(currency and interest rate risks), credit risks and liquidity risks. Charles Vögele<br />
Group’s general risk management is focused on the unpredictability of developments<br />
on the financial market and its aim is to reduce the potential negative<br />
impact on financial results. The tools that the Group uses to do this include derivative<br />
financial instruments.<br />
Financial risk management is carried out by the Treasury Department. The<br />
Group Treasurer identifies, values and hedges the financial risks within the given<br />
guidelines.<br />
3.1 Currency risks<br />
Charles Vögele Group’s main currency exposures are to the USD and EUR. The<br />
USD risk is limited to the purchase of goods since only purchases and no sales are<br />
made in USD. In order to reduce this risk the Group enters into forward foreign<br />
exchange contracts and currency swaps. These cover almost 100 % of USD require-<br />
ments based on planned purchases of goods for the spring/summer and autumn/<br />
winter seasons. The EUR and other foreign currencies are consolidated at Group<br />
level, continuously monitored and hedged where necessary.<br />
Subsequent sensitivity analyses show the material foreign currency risks to which<br />
Charles Vögele Group is exposed on the balance sheet date, as well as the implications<br />
for the consolidated result and shareholders’ equity.<br />
22
CHF 1000 EUR/CHF USD/CHF HUF/CHF HKD/CHF CZK/CHF<br />
Total group foreign currency exposures 31.12.2009 120 396 (5 379) 4 748 (1 675) 1 596<br />
Average between annual high and low<br />
exchange rate compared to balance sheet rate 3.0% 11.0% 11.0% 10.0% 10.0%<br />
Total effect on group earnings<br />
in 2009 at increasing foreign currency rate 3 612 (592) 522 (168) 160<br />
Total effect on group earnings<br />
in 2009 at declining foreign currency rate (3 612) 592 (522) 168 (160)<br />
Derivative financial instruments as cash flow hedges (194 784) 166 122<br />
Total effect on consolidated group equity as of<br />
31.12.2009 at increasing foreign currency rate<br />
Total effect on consolidated group equity as of<br />
(5 844) 18 273 – – –<br />
31.12.2009 at declining foreign currency rate 5 844 (18 273) – – –<br />
CHF 1000 EUR/CHF USD/CHF PLN/CHF HUF/CHF EUR/HUF<br />
Total group foreign currency exposures 31.12.2008 60 827 (4 000) 1 809 3 697 (2 154)<br />
Average between annual high and low<br />
exchange rate compared to balance sheet rate 7.0% 11.0% 21.0% 17.0% 11.0%<br />
Total effect on group earnings<br />
in 2008 at increasing foreign currency rate 4 258 (440) 380 628 (237)<br />
Total effect on group earnings<br />
in 2008 at declining foreign currency rate (4 258) 440 (380) (628) 237<br />
Derivative financial instruments as cash flow hedges (111 704) 170 258<br />
Total effect on consolidated group equity as of<br />
31.12.2008 at increasing foreign currency rate<br />
Total effect on consolidated group equity as of<br />
(7 819) 18 728 – – –<br />
31.12.2008 at declining foreign currency rate 7 819 (18 728) – – –<br />
3.2 Interest risks<br />
Charles Vögele Group has no significant interest-bearing assets, so changes in<br />
market interest rates have little effect on earnings or operating cash flows.<br />
Charles Vögele Group’s interest rate risk stems mainly from its bank loans, mortgages<br />
and leasing liabilities. Long-term interest-bearing financial liabilities with<br />
variable interest rates expose the Group to a cash flow interest risk, while fixed-rate<br />
liabilities represent a fair value interest risk. The mortgages, leasing liabilities<br />
and loans are mainly fixed-rate liabilities. The loans outstanding at the end of the<br />
year are not representative of the year as a whole. The company’s funding requirements<br />
increase at the start of a selling season as products are purchased,<br />
and then decline proportionally towards the end of the season as the products<br />
are sold. At the end of the year, most financial liabilities had fixed interest rates, so<br />
changes in interest rates had no significant effect on the income statement or<br />
shareholders’ equity.<br />
The Group Management sets itself the goal of covering on average about 50 % of<br />
its borrowing needs with long-term fixed-rate instruments. Interest rate hedging<br />
transactions are used where necessary.<br />
23<br />
Financial Commentary<br />
Income Statement and Balance Sheet<br />
Cash Flow and Changes in equity<br />
Notes<br />
Statutory Auditors
3.3 Credit risks<br />
Credit risks can arise from the following balance sheet positions: cash and cash<br />
equivalents, receivables and advance payments, and financial assets. Charles<br />
Vögele Group is not exposed to any material credit risk since the vast majority of<br />
sales to customers are settled in cash or by the major debit and credit cards.<br />
Processing and payment is carried out through local financial services providers<br />
within two or three days. Financial institutions and financial services providers<br />
usually have to have at least an “A” rating before Charles Vögele Group will consider<br />
using them for banking business. Any risks arising from cash and cash<br />
equivalents are further minimized by the use of a variety of local financial services<br />
providers rather than a single banking institution.<br />
Risks can arise from cash at the stores and in transporting these cash takings to<br />
the financial institutions. Cash holdings (takings, change) in the stores are kept in<br />
safes and kept to a minimum through regular or as-needed transfers of the cash<br />
takings. The risk of theft by own or third-party personnel has been reduced further<br />
by the installation of an effective internal control system. Cash holdings in the<br />
safes are insured to an appropriate level against theft and acts of God, and are re-<br />
placed if lost. When choosing firms to transport money and valuables, Charles<br />
Vögele Group’s selection criteria are based on quality, transparency, security and<br />
comprehensive insurance protection.<br />
Receivables from tax refunds (value added tax) are secured by regularly verifying<br />
that declarations are formally correct and by submitting the necessary declarations<br />
on time. Prepayments to suppliers and other claims are checked regularly<br />
and any identified credit risk is taken into account through a value adjustment<br />
(see Note 2.13).<br />
3.4 Liquidity risks<br />
Subject to seasonal fluctuations in monthly revenues and the pre-financing of goods<br />
purchasing, cash flow varies greatly across the financial year. A continuously up-<br />
dated liquidity plan is in place to manage these liquidity risks. This plan is based on<br />
the annual budgeted figures for sales, costs and investments. In order to meet<br />
the necessary short-term liabilities, Charles Vögele Group keeps a permanent liq-<br />
uidity reserve of about CHF 30 to 50 million.<br />
24
On the balance sheet date, Charles Vögele Group had the following liquidity reserves:<br />
CHF 1000 31.12.2009 31.12.2008<br />
Net cash and cash equivalents at the end of the period 127 649 47 947<br />
Syndicated credit line agreement 250 000 250 000<br />
./. Credit lines used – (50 000)<br />
Additional credit lines 22 256 22 334<br />
./. Credit lines used – –<br />
Total cash reserves and unused credit lines 399 905 270 281<br />
The following future cash outflows are expected from the financial liabilities shown<br />
at the balance sheet date:<br />
CHF 1000 < 1 year 1 – 5 years > 5 years Total<br />
Short-term bank liabilities – – – –<br />
Trade payables 47 926 – – 47 926<br />
Other liabilities and accruals (excl. vouchers) 64 497 – – 64 497<br />
Finance lease liabilities, gross 4 795 20 040 20 460 45 295<br />
Mortgages 28 161 85 590 – 113 751<br />
Loans – – – –<br />
Total as of 31.12.2009 145 379 105 630 20 460 271 469<br />
CHF 1000 < 1 year 1 – 5 years > 5 years Total<br />
Short-term bank liabilities – – – –<br />
Trade payables 53 303 – – 53 303<br />
Other liabilities and accruals (excl. vouchers) 58 671 – – 58 671<br />
Finance lease liabilities, gross 4 610 28 745 17 123 50 478<br />
Mortgages 3 581 55 113 63 000 121 694<br />
Loans 132 50 000 – 50 132<br />
Total as of 31.12.2008 120 297 133 858 80 123 334 278<br />
25<br />
Financial Commentary<br />
Income Statement and Balance Sheet<br />
Cash Flow and Changes in equity<br />
Notes<br />
Statutory Auditors
The following future cash outflows are expected from the forward currency<br />
contracts outstanding on the balance sheet date:<br />
CHF 1000 < 1 year 1 – 5 years > 5 years Total<br />
Balance 31.12.2009<br />
Derivative for cash flow hedges:<br />
– Cash outflow (contract value) 48 512 – – 48 512<br />
– Cash inflow (fair value) (56 013) – – (56 013)<br />
Derivative for trading purposes:<br />
– Cash outflow (contract value) – – – –<br />
– Cash inflow (fair value) – – – –<br />
CHF 1000 < 1 year 1 – 5 years > 5 years Total<br />
Balance 31.12.2008<br />
Derivative for cash flow hedges:<br />
– Cash outflow (contract value) 77 879 – – 77 879<br />
– Cash inflow (fair value) (68 886) – – (68 886)<br />
Derivative for trading purposes:<br />
– Cash outflow (contract value) 16 067 – – 16 067<br />
– Cash inflow (fair value) (14 149) – – (14 149)<br />
3.5 Capital risks<br />
The primary aim of capital management is to ensure that Charles Vögele Group can<br />
continue to operate sustainably and so meet the needs of its various stakehold-<br />
ers over the long term. The company’s capital structure takes appropriate account<br />
of the business risks inherent in the Group’s business model.<br />
In order to achieve these objectives, Charles Vögele Group can adjust its dividend<br />
payments, capital refunds to shareholders, issue new shares, take out loans with<br />
financial institutions, pay such loans back ahead of schedule, place financing on the<br />
capital market or sell assets in order to reduce debts.<br />
Charles Vögele Group monitors its capital structure on the basis of net debt. Net<br />
debt itself is calculated as the sum of short- and long-term loans from financial<br />
institutions, mortgages and lease liabilities, less cash and cash equivalents. Charles<br />
Vögele Group’s goal is to ensure that the relation between net debt and EBITDA does<br />
not exceed factor two. At the balance sheet date, the key figures were as follows:<br />
26
CHF 1000 31.12.2009 31.12.2008<br />
Short-term financial liabilities 3 383 2 845<br />
Finance lease liabilities 33 103 37 298<br />
Mortgages 106 500 110 000<br />
Loans – 49 458<br />
Cash and cash equivalents (127 649) (47 947)<br />
Net liability 15 337 151 654<br />
EBITDA 71 273 112 782<br />
Net liability/EBITDA (factor) 0.22 1.34<br />
Shareholders’ equity 484 145 495 369<br />
Net liability/Shareholders’ equity (factor) 0.03 0.31<br />
3.6 Determining fair value<br />
The publicly quoted market price on the balance sheet date is used to determine<br />
the fair value of financial instruments that are traded on an active market (Level 1).<br />
If no quotations from an active market are available for financial instruments, their<br />
fair value is determined using valuation methods or models, though the underlying<br />
assumptions must wherever possible be based on observable market prices or<br />
other market quotations (Level 2).<br />
For financial instruments whose fair value cannot be determined directly from<br />
an active market or indirectly using valuation methods or models, valuation methods<br />
that give the most realistic possible valuation must be used (Level 3).<br />
The following overview shows the financial instruments valued at fair value on the<br />
balance sheet date:<br />
CHF 1000 Level 1 Level 2 Level 3 Total<br />
Derivative financial instruments in assets – 4 221 – 4 221<br />
Derivative financial instruments in liabilities – 4 255 – 4 255<br />
Short-term financial receivables and liabilities are recognized at nominal value less<br />
any value adjustments. Owing to the short-term maturities involved, this is roughly<br />
equivalent to the fair value.<br />
4 Critical accounting estimates and assumptions<br />
When preparing the consolidated financial statements, estimates and assumptions<br />
have to be made which are based on historical experience and other factors,<br />
including expectations of future events that are believed to be reasonable under<br />
the circumstances.<br />
These estimates and assumptions are continuously reviewed. Estimates have to be<br />
revised when the circumstances on which they were based change, or if new infor-<br />
mation or additional findings are available. Such changes are made in the reporting<br />
period in which the estimate were revised.<br />
27<br />
Financial Commentary<br />
Income Statement and Balance Sheet<br />
Cash Flow and Changes in equity<br />
Notes<br />
Statutory Auditors
The estimates and assumptions that have a significant risk of causing a material<br />
adjustment to the carrying amounts of assets and liabilities within the next financial<br />
year are discussed below.<br />
4.1 Goodwill<br />
Following the implementation of IFRS 8 the goodwill previously managed at Group<br />
level was divided up and allocated to the cash-generating units.<br />
In accordance with the accounting and valuation methods stated in Notes 2.18 and<br />
2.19, the Group tests annually whether the goodwill carried in the balance sheet has<br />
suffered an impairment. The recoverable amounts of cash-generating units have<br />
been determined based on value-in-use calculations. These calculations are based<br />
on assumptions about the expected free cash flow (see Note 23.2).<br />
4.2 Income tax<br />
In order to determine the assets and liabilities from current and deferred income<br />
taxes, estimates have to be made because there are many transactions and calculations<br />
for which the ultimate tax determination is uncertain during the ordi nary<br />
course of business. Some of these estimates are based on interpretation of existing<br />
tax laws and rules. Where the final tax outcome of these matters is dif ferent<br />
from the amounts that were initially recorded, such differences will influence the<br />
income tax and deferred tax provisions in the period in which such deter mination<br />
is made (see Note 15).<br />
4.3 Legal cases<br />
Charles Vögele Group is involved in a number of legal cases. It sets up provi sions for<br />
ongoing and pending lawsuits if independent experts are of the opinion that a financial<br />
risk is probable and the amount at risk can be estimated reliably (see Note<br />
28). The estimated risk connected with these pending lawsuits is covered in full.<br />
4.4 Inventories<br />
At the balance sheet date, estimations have to be made for the valuation of inventories.<br />
Beside the existing inventory valuation system, which takes into account the<br />
ageing structure of the inventory, the net realizable value is estimated. The estima-<br />
tions are considering planned sales promotions and are based on the most reliable<br />
evidence available to estimate the net realizable amount (see Note 2.14 and 19.1).<br />
28
5 Segment information<br />
Switzerland Germany Austria/Slovenia<br />
CHF 1000 2009 2008 2009 2008 2009 2008<br />
Gross sales 473 443 478 275 508 706 534 741 294 908 315 611<br />
Net sales 427 639 435 767 418 380 440 323 240 822 257 623<br />
Segment profit (EBITDA) 69 977 74 729 3 704 18 206 11 081 19 977<br />
EBITDA in % of net sales 16.4% 17.1% 0.9% 4.1% 4.6% 7.8%<br />
Depreciation and impairment (21 362) (19 597) (21 696) (22 798) (9 380) (9 743)<br />
Segment profit (EBIT) 48 615 55 132 (17 992) (4 592) 1 701 10 234<br />
EBIT in % of net sales 11.4% 12.7% (4.3%) (1.0%) 0.7% 4.0%<br />
31.12.2009 31.12.2008 31.12.2009 31.12.2008 31.12.2009 31.12.2008<br />
Net inventories 50 650 83 097 64 352 97 749 28 945 50 146<br />
Benelux CEE 1) Group<br />
CHF 1000 2009 2008 2009 2008 2009 2008<br />
Gross sales 204 010 215 993 66 873 62 174 1 547 940 1 606 794<br />
Net sales 169 732 180 162 53 675 50 090 1 310 248 1 363 965<br />
Segment profit (EBITDA) (3 281) 4 951 (10 208) (5 081) 71 273 112 782<br />
EBITDA in % of net sales (1.9%) 2.7% (19.0%) (10.1%) 5.4% 8.3%<br />
Depreciation and impairment (10 397) (10 383) (4 354) (2 706) (67 189) (65 227)<br />
Segment profit (EBIT) (13 678) (5 432) (14 562) (7 787) 4 084 47 555<br />
EBIT in % of net sales (8.1%) (3.0%) (27.1%) (15.5%) 0.3% 3.5%<br />
Net financial income – – – – (6 992) (14 492)<br />
Profit before income tax – – – – (2 908) 33 063<br />
Tax expenses – – – – (10 835) (20 717)<br />
Net profit – – – – (13 743) 12 346<br />
31.12.2009 31.12.2008 31.12.2009 31.12.2008 31.12.2009 31.12.2008<br />
Net inventories 24 999 37 457 9 318 12 788 178 264 281 237<br />
Goods in transit – – – – 41 657 49 162<br />
Group eliminations – – – – (47 186) (48 217)<br />
Total Group inventories, net 2) – – – – 172 735 282 182<br />
1) CEE: Poland, Hungary, Czech Republic.<br />
2) Difference to the balance sheet value of TCHF 287 (2008: TCHF 446) is related to heating oil.<br />
29<br />
Financial Commentary<br />
Income Statement and Balance Sheet<br />
Cash Flow and Changes in Equity<br />
Notes<br />
Statutory Auditors
6 Personnel expenses<br />
CHF 1000 2009 2008<br />
Wages and salaries 253 351 261 197<br />
Social security costs 44 048 44 058<br />
Other personnel expenses 11 770 15 530<br />
Total 309 169 320 785<br />
6.1 Defined contribution retirement plans<br />
The Dutch Group company has an independent industry pension plan. As there is<br />
no reliable basis for allocating the plan’s assets to the individual participating<br />
companies, this plan is treated in these financial statements as a defined contribution<br />
plan.<br />
The cost of pension liabilities charged through personnel expenses in Belgium and<br />
the Netherlands amounted to CHF 2.3 million in 2009 and CHF 2.2 million in 2008.<br />
6.2 Defined benefit retirement plans<br />
All Swiss Group companies have legally separate pension schemes with an independent<br />
external provider who carries full reinsurance cover. According to local law<br />
these are defined contribution plans, but under IFRS they are treated as defined<br />
benefit plans. Pensioner data was recorded and assessed for the first time dur-<br />
ing the revaluation dated December 31, 2008. If the pension insurance contract is<br />
terminated, all pensioners except old-age pensioners (i.e. people receiving disability,<br />
spouse or child pensions) will be transferred to the new pension scheme.<br />
Consequently, the relevant policy reserve was included in the calculation of pension<br />
obligations and of pension assets at the end of the current year.<br />
The actuarial valuations are based on the following weighted average assumptions:<br />
30<br />
2009 2008<br />
Discount rate 3.5% 3.5%<br />
Expected return on plan assets 4.3% 4.3%<br />
Expected future salary increases 1.0% 1.0%<br />
Expected future pension increases 0.5% 0.5%<br />
Actuarial base EVK 2000 EVK 2000<br />
Average retirement age in years M65 / F64 M65 / F64<br />
Life expectancy at assumed retirement age in years M18 / F21 M18 / F21
The pension liabilities and plan assets are as follows:<br />
CHF 1000 2009 2008<br />
Present value of funded obligation (DBO), as of January 1 (95 774) (87 221)<br />
Pension obligations (disability, spouse and child pensions) 0 (9 503)<br />
Service cost (7 961) (7 961)<br />
Interest cost (3 326) (3 114)<br />
Benefits paid 17 433 12 445<br />
Actuarial gain/(loss) on obligations – (420)<br />
Present value of funded obligation (DBO), as of December 31 (89 628) (95 774)<br />
Fair value of plan assets, as of January 1 82 439 87 231<br />
Actuarial capital for pension obligations (disability, spouse and child pensions) 0 9 503<br />
Expected return on plan assets 3 133 3 443<br />
Employees’ contributions 3 781 3 955<br />
Employer’s contributions 4 652 4 491<br />
Benefits paid (17 433) (12 445)<br />
Actuarial gain/(loss) on plan assets 4 016 (13 739)<br />
Fair value of plan assets, as of December 31 80 588 82 439<br />
The expenses recognized in the income statement that result from the actuarial<br />
calculation of the liabilities of defined benefit retirement plans are as follows:<br />
CHF 1000 2009 2008<br />
Service cost 7 961 7 961<br />
Interest cost 3 326 3 114<br />
Expected return on plan assets (3 133) (3 443)<br />
Amortization of actuarial losses/(gains) 536 824<br />
Increase/(decrease) of the unrecognised surplus – (10)<br />
Net periodic pension cost 8 690 8 446<br />
Employees’ contributions (3 781) (3 955)<br />
Expenses recognized in the income statement 4 909 4 491<br />
Premiums owed are actuarially calculated and are based on prevailing conditions.<br />
31<br />
Financial Commentary<br />
Income Statement and Balance Sheet<br />
Cash Flow and Changes in Equity<br />
Notes<br />
Statutory Auditors
The surpluses and deficits shown in the balance sheet for coverage of pension<br />
liabilities of defined benefit retirement plans are as follows:<br />
CHF 1000 31.12.2009 31.12.2008 31.12.2007 31.12.2006 31.12.2005<br />
Present value of funded obligations (DBO) (89 628) (95 774) (87 221) (85 379) (80 929)<br />
Fair value of plan assets 80 588 82 439 87 231 88 620 83 426<br />
Over-/(under-)coverage (9 040) (13 335) 10 3 241 2 497<br />
Not capitalized portion of the over-coverage – – (10) (3 241) (2 497)<br />
Not recognized actuarial gains/(losses) 8 783 13 335 – – –<br />
Net asset/(liability) in balance sheet,<br />
as of December 31 (257) – – – –<br />
Experience-based-adjustments<br />
on plan liabilities – (420) – – –<br />
Experience-based-adjustments<br />
on plan assets 4 016 (13 739) (3 865) 300 3 317<br />
Total actuarial gains/(losses) 4 016 (14 159) (3 865) 300 3 317<br />
The under- and overfundings shown above refer to the Swiss pension scheme.<br />
The unrecorded actuarial losses of CHF 8.8 million recognized as at December 31,<br />
2009 do not exceed the corridor (10% of assets or pension obligations, which-<br />
ever is higher) of CHF 9.0 million. No amortisation of the deficit is therefore required<br />
in 2010.<br />
Movements in the net liabilities for the defined benefit retirement plan shown in<br />
the balance sheet are as follows:<br />
CHF 1000 2009 2008<br />
Net liability in balance sheet, as of January 1 – –<br />
Expense recognized in the profit and loss statement 4 909 4 491<br />
Employer’s contributions (4 652) (4 491)<br />
Net liability in balance sheet, as of December 31 257 –<br />
The asset allocation for pension assets is as follows:<br />
32<br />
2009 2008<br />
Cash 5.8% 7.8%<br />
Bonds 41.5% 46.3%<br />
Equities 22.9% 22.0%<br />
Property 8.3% 8.5%<br />
Reinsurer (pensions) 10.1% 10.7%<br />
Other 11.4% 4.7%<br />
Total 100.0% 100.0%<br />
The Pension fund assets as at December 31, 2009, and December 31, 2008, do not<br />
include any of the company’s own shares.<br />
The effective return on assets amounted to CHF 7.1 million (previous year: loss on<br />
assets of CHF 10.3 million). The expected employer payments for the 2010 financial<br />
year are estimated at CHF 4.7 million.
The pension liability of the German Group company is governed by national regulations<br />
and is a defined benefit scheme. No additional calculation based on IFRS<br />
accounting principles of provisions for future liabilities are made, because in the<br />
context of the consolidated financial statements the liabilities relate to an immateriel<br />
group of 16 employees (2008: 17 employees). No contributions from the<br />
Group company were booked in 2009.<br />
7 Rental expenses<br />
CHF 1000 2009 2008<br />
Rent 181 274 178 588<br />
Incidental expenses, cleaning, maintenance 60 347 58 016<br />
Total 241 621 236 604<br />
The CHF 5.0 million year-on-year increase in rental expenses is due primarily to the<br />
expansion of the branch network, index adjustments and price increases related to<br />
incidental expenses.<br />
8 Advertising and promotion expenses<br />
Advertising and promotion expenses include costs for product-oriented advertising,<br />
sales promotions, public relations and market research by external providers.<br />
The CHF 27.5 million reduction compared to prior year is mainly due to the optimisation<br />
of the marketing mix and to cost-saving measures. Charles Vögele Group<br />
also decided not to stage any major events.<br />
9 General operating expenses<br />
General operating expenses include operating lease expenses amount ing to<br />
CHF 3.9 million (2008: CHF 3.8 million). Operating leases mainly concern vehicles.<br />
10 Other operating income<br />
CHF 1000 2009 2008<br />
Operating real estate income, net 1 722 1 625<br />
Redemption compensation less costs for store closings 817 722<br />
Insurance payments 1 013 –<br />
Energy cost refunds of previous years 932 –<br />
Other income 52 339<br />
Total 4 536 2 686<br />
33<br />
Financial Commentary<br />
Income Statement and Balance Sheet<br />
Cash Flow and Changes in Equity<br />
Notes<br />
Statutory Auditors
11 Depreciation and impairment<br />
CHF 1000 2009 2008<br />
Depreciation 63 860 64 702<br />
Impairment losses for store fixtures and fittings (see Note 21.1) 3 329 525<br />
Total 67 189 65 227<br />
12 Financial income<br />
CHF 1000 2009 2008<br />
Interest income 333 921<br />
Interest income from securities 53 8<br />
Total 386 929<br />
13 Financial expenses<br />
CHF 1000 2009 2008<br />
Interest expenses on current accounts and loans 1 498 4 445<br />
Interest charges on mortgages 3 813 3 610<br />
Interest on leases 2 040 2 471<br />
Impairment of financial assets 475 –<br />
Total 7 826 10 526<br />
14 Foreign exchange differences<br />
CHF 1000 2009 2008<br />
(Expense)/income from foreign exchange contracts 240 409<br />
Other exchange gains/(losses) 208 (5 304)<br />
Total (expense)/income from exchange gains/(losses) 448 (4 895)<br />
15 Income tax<br />
15.1 Composition of income tax expense<br />
CHF 1000 2009 2008<br />
Current income taxes 15 682 15 778<br />
Change in deferred income taxes (5 957) 5 529<br />
Income tax from previous years 1 110 (590)<br />
Total income tax expense 10 835 20 717<br />
34
15.2 Analysis of tax expense<br />
CHF 1000 2009 2008<br />
Profit before income taxes (2 908) 33 063<br />
Taxes on current profit calculated on the expected<br />
group tax rate of 21% (2008: 22%) (611) 7 274<br />
Reconciliation:<br />
– Effect of profits and losses with different tax rates (6 042) (4 864)<br />
– Adjustments of deferred taxes from previous years (942) 921<br />
– Effect of deferred tax assets not capitalized 16 876 11 757<br />
– Impairment of capitalized tax loss carry-forwards – 5 555<br />
– Effect of other non-taxable transactions 444 664<br />
– Taxes payable (refunds) from previous years 1 110 (590)<br />
Total tax expense 10 835 20 717<br />
CHF 1000<br />
The above table shows the transition from expected tax expense to reported tax<br />
expense. The expected Group tax rate is calculated from a normalized expected<br />
profit structure for all Group companies. The pronounced difference in the year<br />
under review between reported and expected tax expense is due primarily to the<br />
non-capitalisation of deferred tax assets of CHF 16.9 million from Group companies<br />
posting losses (see Note 15.5). The reported tax expense results mainly from<br />
profit making subsidiaries.<br />
15.3 Deferred taxes in the balance sheet<br />
35<br />
31.12.2009<br />
Assets<br />
31.12.2009<br />
Liabilities<br />
31.12.2008<br />
Assets<br />
31.12.2008<br />
Liabilities<br />
Deferred taxes from:<br />
– Various receivables – – 1 –<br />
– Inventories 5 596 (8 580) 7 316 (15 990)<br />
– Goodwill 18 015 – 20 568 –<br />
– Other long-term assets 67 (12 906) 7 (13 924)<br />
– Real estate – (9 852) – (9 864)<br />
– Derivative financial instruments 63 (697) 1 180 (2 297)<br />
– Intercompany loans 2 369 – 2 377 –<br />
– Accruals 154 – 585 –<br />
– Provisions 1 226 – 1 302 –<br />
– Treasury shares – (2 553) – (332)<br />
– Loss carry-forwards 121 620 – 103 975 –<br />
Total deferred taxes, gross 149 110 (34 588) 137 311 (42 407)<br />
Impairment of deferred tax assets (141 592) – (126 293) –<br />
Total deferred taxes 7 518 (34 588) 11 018 (42 407)<br />
Offset of assets and liabilities (1 880) 1 880 (3 778) 3 778<br />
Total deferred taxes, net 5 638 (32 708) 7 240 (38 629)<br />
Financial Commentary<br />
Income Statement and Balance Sheet<br />
Cash Flow and Changes in Equity<br />
Notes<br />
Statutory Auditors
The deferred tax assets on goodwill shown in the table relate to acquisitions of<br />
business activities (in the form of net assets) in Germany and the Nether-<br />
lands. This goodwill was already completely amortized or written off in previous<br />
years under IFRS. Goodwill amortization is accepted under tax rules.<br />
15.4 Change in deferred taxes, net<br />
CHF 1000 2009 2008<br />
Total deferred tax assets/(liabilities), net, as of January 1 (31 389) (25 527)<br />
Recognized in income statement:<br />
– Change in tax rates from previous years (21) 836<br />
– Adjustments of deferred taxes from previous years (14) (86)<br />
– Impairment of capitalized tax loss carry-forwards – (5 555)<br />
– Changes in temporary differences 5 561 (513)<br />
Recognized in shareholders’ equity:<br />
– Changes in deferred taxes on valuation of financial instruments<br />
(see Note 37.1) (1 176) (113)<br />
Effect of exchange rates (31) (431)<br />
Total deferred tax assets/(liabilities), net, as of December 31 (27 070) (31 389)<br />
The calculation of deferred taxes is based on future (if known) national tax rates.<br />
15.5 Tax-relevant loss carry-forwards<br />
CHF 1000 31.12.2009 31.12.2008<br />
Expiring in the next 5 years 62 499 49 151<br />
Expiring in 5 to 9 years 52 453 47 146<br />
Available without limitation 329 488 271 579<br />
Total tax loss carry-forwards 444 440 367 876<br />
Calculated potential tax assets thereof 122 828 103 975<br />
Valuation allowances (122 828) (103 975)<br />
Net tax asset from loss carry-forwards – –<br />
The table above shows the tax-relevant loss carry-forwards, which largely represent<br />
market entry costs and are capitalized if sufficient taxable profit is likely to be<br />
generated in the foreseeable future. During the 2008 financial year, capitalized<br />
net tax assets from tax loss carry-forwards in Germany totalling CHF 5.6 million<br />
were written down in full (see Note 15.2).<br />
The new deferred tax assets from tax loss carry-forwards arising in the 2009 and<br />
2008 financial years were not capitalized as it is not certain that they can be used<br />
in the foreseeable future.<br />
36
16 Earnings per share<br />
37<br />
2009 2008<br />
Net income CHF 1 000 (13 743) 12 346<br />
Weighted average number of shares number 8 376 485 8 427 649<br />
Adjustment for potentially dilutive share options number – 31 354<br />
Weighted average number of shares for diluted earnings per share number 8 376 485 8 459 003<br />
Basic earnings per share CHF (1.64) 1.46<br />
Diluted earnings per share CHF (1.64) 1.46<br />
17 Cash and cash equivalents<br />
CHF 1000 31.12.2009 31.12.2008<br />
Petty cash, postal account balances and cash at banks 127 671 47 440<br />
Clearing accounts of points of sale (22) 507<br />
Total cash and cash equivalents recognized in the balance sheet 127 649 47 947<br />
The average interest rate on postal account balances and cash at banks, which<br />
have maturities of less than three months, was 0.125 % (2008: 0.3 %).<br />
Financial Commentary<br />
Income Statement and Balance Sheet<br />
Cash Flow and Changes in Equity<br />
Notes<br />
Statutory Auditors
18 Receivables, advance payments and prepaid expenses<br />
CHF 1000 31.12.2009 31.12.2008<br />
Receivables:<br />
– Tax refunds (value added tax) 3 414 10 571<br />
– Income taxes 79 7 968<br />
– Other receivables 8 587 6 830<br />
– Credit card sales 2 901 2 878<br />
– Reclaimable withholding taxes 21 51<br />
Total receivables, gross 15 002 28 298<br />
Value adjustments (910) (325)<br />
Total receivables, net 14 092 27 973<br />
Advance payments and prepaid expenses:<br />
– Advance payments for advertising campaigns – 2 596<br />
– Other advance payments and prepaid expenses 3 645 4 247<br />
Total advance payments and prepaid expenses 3 645 6 843<br />
Total receivables, advance payments and prepaid expenses 17 737 34 816<br />
18.1 Value adjustments on receivables<br />
CHF 1000 2009 2008<br />
Balance 1.1. (325) (210)<br />
Payments 21 –<br />
Receivables written off during the year as uncollectible 110 23<br />
(Creation)/release of impairments (715) (149)<br />
Effect of exchange rates (1) 11<br />
Balance 31.12. (910) (325)<br />
Charles Vögele Group normally does not carry customer receivables since the vast<br />
majority of sales to customers are cash sales. Sales transacted by debit and cred-<br />
it card are paid by the local financial institutions and service providers within two to<br />
three days. Payments are monitored systematically and continuously. Many years<br />
of experience show that credits from credit card sales shown at the balance sheet<br />
date have a good credit rating, accordingly no value adjustments are necessary.<br />
Receivables from tax refunds (value added tax) are secured by carrying out regular<br />
verifications and by submitting the necessary declarations on time. No receivables<br />
were overdue on the balance sheet date.<br />
38
Other receivables are not related to regular sales of goods but to various individual<br />
items that are monitored periodically and notice is given where necessary. On<br />
the balance sheet date they were tested for impairment and written down where<br />
necessary.<br />
The book value of receivables and advance payments is equivalent to their fair<br />
value.<br />
19 Inventories<br />
CHF 1000 31.12.2009 31.12.2008<br />
Current inventory, gross 142 169 267 161<br />
Inventory valuation allowance (37 668) (59 823)<br />
Current inventory (current and previous seasons), net 104 501 207 338<br />
Upcoming season 68 234 74 844<br />
Heating oil 287 446<br />
Total 173 022 282 628<br />
19.1 Value adjustments on inventories<br />
CHF 1000 2009 2008<br />
Balance, as of January 1 (59 823) (69 098)<br />
(Creation)/Release of value adjustments affecting cost of goods, net 22 353 4 298<br />
Effect of exchange rates (198) 4 977<br />
Balance, as of December 31 (37 668) (59 823)<br />
The release of CHF 22.4 million of value adjustments during the 2009 financial<br />
year (previous year: CHF 4.3 million) resulted mainly from the substantial and<br />
exceptional clearance of old stock begun at the start of April 2009. The net realizable<br />
value of some of the inventories was adjusted on December 31, 2009, by<br />
means of an additional value adjustment of CHF 10 million.<br />
20 Assets held for sale<br />
This position concerns a property in Switzerland that will no longer be needed for<br />
operations.<br />
39<br />
Financial Commentary<br />
Income Statement and Balance Sheet<br />
Cash Flow and Changes in Equity<br />
Notes<br />
Statutory Auditors
21 Property, plant and equipment<br />
21.1 Changes in values<br />
CHF 1000 Land Buildings Equipment Total<br />
Balance 1.1.2008<br />
Acquisition cost 60 645 219 544 563 688 843 877<br />
Accumulated depreciation/impairment (9 399) (91 793) (299 283) (400 475)<br />
Net book amount 1.1.2008 51 246 127 751 264 405 443 402<br />
Year 2008<br />
Opening net book amount 51 246 127 751 264 405 443 402<br />
Effect of exchange rates (675) (4 001) (20 095) (24 771)<br />
Additions – 1 256 71 003 72 259<br />
Disposals – (25) (3 474) (3 499)<br />
Depreciation – (5 524) (52 928) (58 452)<br />
Impairment – – (525) (525)<br />
Reclassification – (13) 13 –<br />
Closing net book amount 50 571 119 444 258 399 428 414<br />
Balance 31.12.2008<br />
Acquisition cost 59 970 214 387 537 888 812 245<br />
Accumulated depreciation/impairment (9 399) (94 943) (279 489) (383 831)<br />
Net book amount 31.12.2008 50 571 119 444 258 399 428 414<br />
Year 2009<br />
Opening net book amount 50 571 119 444 258 399 428 414<br />
Effect of exchange rates (21) (94) (809) (924)<br />
Additions – 28 44 599 44 627<br />
Disposals – (41) (3 767) (3 808)<br />
Depreciation – (5 406) (52 187) (57 593)<br />
Impairment – – (3 329) (3 329)<br />
Reclassification (4 760) (2 273) – (7 033)<br />
Closing net book amount 45 790 111 658 242 906 400 354<br />
Balance 31.12.2009<br />
Acquisition cost 55 189 209 678 558 642 823 509<br />
Accumulated depreciation/impairment (9 399) (98 020) (315 736) (423 155)<br />
Net book amount 31.12.2009 45 790 111 658 242 906 400 354<br />
See Note 11 for information about impairment costs in respect of planned shop<br />
closings.<br />
As of December 31, 2009, CHF 114.0 million of the land and buildings are pledged<br />
as security for mortgages (December 31, 2008: CHF 117.5 million).<br />
The fire insurance value of physical assets is CHF 775.4 million as at December 31,<br />
2009, (December 31, 2008: CHF 747.9 million).<br />
40
21.2 Finance leases<br />
The carrying amount of tangible assets includes the following leased assets:<br />
CHF 1000 Land Buildings Equipment Total<br />
Acquisition cost 5 917 53 995 6 118 66 030<br />
Accumulated depreciation – (19 018) (4 006) (23 024)<br />
Balance 31.12.2008 5 917 34 977 2 112 43 006<br />
Additions 2008 – – – –<br />
Reclassification – – – –<br />
Acquisition cost 5 896 53 807 6 099 65 802<br />
Accumulated depreciation – (20 509) (4 682) (25 191)<br />
Balance 31.12.2009 5 896 33 298 1 417 40 611<br />
Additions 2009 – – – –<br />
Reclassification – – – –<br />
Financial leases for land and buildings includes Charles Vögele Group’s distribution<br />
centres in Lehrte and Sigmaringen in Germany, as well as in Kalsdorf in Austria.<br />
Furnishings and fittings relating to the warehouses and offices of these locations are<br />
included in leased assets and classified as “Equipment”. As in 2008, there were no<br />
additions or disposals in 2009.<br />
22 Financial assets<br />
CHF 1000 31.12.2009 31.12.2008<br />
Investments 115 170<br />
Loans 485 987<br />
Total Financial assets 600 1 157<br />
The position “Investments” comprises interests in non-consolidated companies<br />
(mainly parking garages) with shareholdings below 20 %.<br />
41<br />
Financial Commentary<br />
Income Statement and Balance Sheet<br />
Cash Flow and Changes in Equity<br />
Notes<br />
Statutory Auditors
23 Intangible assets<br />
23.1 Changes intangible assets<br />
CHF 1000 Goodwill<br />
Balance 1.1.2008<br />
42<br />
Other<br />
intangible<br />
assets Total<br />
Acquisition cost 72 919 24 117 97 036<br />
Accumulated depreciation – (17 868) (17 868)<br />
Net book amount 1.1.2008 72 919 6 249 79 168<br />
Year 2008<br />
Opening net book amount 72 919 6 249 79 168<br />
Effect of exchange rates – – –<br />
Additions – 6 956 6 956<br />
Disposals – – –<br />
Depreciations – (2 980) (2 980)<br />
Impairments – – –<br />
Closing net book amount 72 919 10 225 83 144<br />
Balance 31.12.2008<br />
Acquisition cost 72 919 25 664 98 583<br />
Accumulated depreciation 0 (15 439) (15 439)<br />
Net book amount 31.12.2008 72 919 10 225 83 144<br />
Year 2009<br />
Opening net book amount 72 919 10 225 83 144<br />
Effect of exchange rates – – –<br />
Additions – 3 324 3 324<br />
Disposals – (40) (40)<br />
Depreciations – (3 651) (3 651)<br />
Impairments – – –<br />
Closing net book amount 72 919 9 858 82 777<br />
Balance 31.12.2009<br />
Acquisition cost 72 919 26 992 99 911<br />
Accumulated depreciation 0 (17 134) (17 134)<br />
Net book amount 31.12.2009 72 919 9 858 82 777
23.2 Impairment test on goodwill<br />
CHF 1000 31.12.2009 31.12.2008<br />
Goodwill share Switzerland 36 728 –<br />
Goodwill share Germany 6 520 –<br />
Goodwill share Austria 29 671 –<br />
Total of LBO 72 919 72 919<br />
The test is based on the following assumptions<br />
Switzerland:<br />
– Growth rate of the residual 1.0% 1.0%<br />
– Pre-tax discount rate (WACC) 6.6% 7.3%<br />
Germany:<br />
– Growth rate of the residual 1.5% 1.5%<br />
– Pre-tax discount rate (WACC) 9.2% 7.9%<br />
Austria:<br />
– Growth rate of the residual 1.5% 1.5%<br />
– Pre-tax discount rate (WACC) 7.7% 7.7%<br />
Following the redefinition of the segments (IFRS 8) the goodwill previously managed<br />
at Group level was divided up and allocated to the cash-generating units.<br />
Value in use was calculated using the discounted free cash flow model. The free cash<br />
flow projections are based on the budget and two-year plan approved by Group<br />
Man agement and the Board of Directors. These reflect Management’s estimates of<br />
operating results. The various measures initiated to increase like-for-like sales<br />
and to improve profitability were taken into account. Cash flows that go beyond this<br />
planning period were extrapolated using the above parameters.<br />
Even after incorporating a sensitivity analysis of sales and results, the test showed<br />
that the disclosed goodwill has retained its value.<br />
23.3 Other intangible assets<br />
“Other intangible assets” covers brand rights, licences and software. Brand rights<br />
and licences have already been fully written down in previous years. The recorded<br />
net book value reflects IT software exclusively.<br />
43<br />
Financial Commentary<br />
Income Statement and Balance Sheet<br />
Cash Flow and Changes in Equity<br />
Notes<br />
Statutory Auditors
CHF 1000<br />
24 Financial instruments by category (assets)<br />
Loans and<br />
receivables<br />
Assets<br />
at fair<br />
value<br />
through<br />
profit<br />
and loss<br />
44<br />
Derivatives<br />
used<br />
for<br />
hedging<br />
Available<br />
for<br />
sale/others<br />
Other non<br />
financial<br />
assets Total<br />
Cash and cash equivalents 127 649 – – – – 127 649<br />
Receivables, advance payments and<br />
prepaid expenses 14 092 – – – 3 645 17 737<br />
Derivative financial instruments – – 4 221 – – 4 221<br />
Financial assets (see Note 22) 485 – – 115 – 600<br />
Balance 31.12.2009 142 226 – 4 221 115 3 645 150 207<br />
Cash and cash equivalents 47 947 – – – – 47 947<br />
Receivables, advance payments and<br />
prepaid expenses 27 973 – – – 6 843 34 816<br />
Derivative financial instruments – 1 918 4 403 – – 6 321<br />
Financial assets (see Note 22) 987 – – 170 – 1 157<br />
Balance 31.12.2008 76 907 1 918 4 403 170 6 843 90 241<br />
The maximum risk of default is equal to the assets shown in the balance sheet.<br />
25 Short-term financial liabilities<br />
CHF 1000 31.12.2009 31.12.2008<br />
Short-term lease liabilities (see Note 27) 3 383 2 845<br />
Total 3 383 2 845<br />
26 Other liabilities and accruals<br />
CHF 1000 31.12.2009 31.12.2008<br />
Sales tax 19 566 16 216<br />
Vouchers 19 223 18 369<br />
Accruals:<br />
– Personnel expenses 22 246 19 881<br />
– Rental expenses 5 313 5 004<br />
– Other accruals 17 372 17 570<br />
Total 83 720 77 040
CHF 1000<br />
27 Finance lease liabilities<br />
45<br />
Residual<br />
term<br />
< 1 year<br />
Residual<br />
term<br />
1 – 5 years<br />
Residual<br />
term<br />
> 5 years Total<br />
Lease commitments, gross 4 794 20 040 20 461 45 295<br />
Discounted (1 411) (4 941) (2 457) (8 809)<br />
Balance 31.12.2009 3 383 15 099 18 004 36 486<br />
Lease commitments, gross 4 609 28 745 17 123 50 477<br />
Discounted (1 764) (5 643) (2 927) (10 334)<br />
Balance 31.12.2008 2 845 23 102 14 196 40 143<br />
CHF 1000 31.12.2009 31.12.2008<br />
Disclosure:<br />
– Short-term financial liabilities (due < 1 year; see Note 25) 3 383 2 845<br />
– Lease liabilities 33 103 37 298<br />
Total 36 486 40 143<br />
CHF 1000<br />
The average discount rate of finance lease commitments amounted to 5.7 %<br />
(2008: 5.6 %).<br />
28 Provisions<br />
Personnel<br />
provisions<br />
Other<br />
provisions Total<br />
Balance 1.1.2008 7 543 265 7 808<br />
Increase 320 526 846<br />
Usage (124) (27) (151)<br />
Decrease (181) (203) (384)<br />
Reclassification – – –<br />
Effect of exchange rates (761) (28) (789)<br />
Balance 31.12.2008 6 797 533 7 330<br />
Increase 3 001 3 286 6 287<br />
Usage (130) – (130)<br />
Decrease (443) (460) (903)<br />
Reclassification 242 – 242<br />
Effect of exchange rates (33) 17 (16)<br />
Balance 31.12.2009 9 434 3 376 12 810<br />
CHF 1000 31.12.2009 31.12.2008<br />
Disclosure:<br />
– Short-term provisions 6 063 456<br />
– Long-term provisions 6 747 6 874<br />
Total 12 810 7 330<br />
“Personnel provisions” are mainly associated with pension liabilities and settlements<br />
to be paid to employees of various Group companies.<br />
Financial Commentary<br />
Income Statement and Balance Sheet<br />
Cash Flow and Changes in Equity<br />
Notes<br />
Statutory Auditors
CHF 1000<br />
The increases and decreases are attributable to alterations to pension and settlement<br />
liabilities recognized in the income statement. Usage reflects the annual<br />
pension payments that are offset by the provisions. The decreases in the year under<br />
review and previous year were mainly attributable to provisions that were no<br />
longer required.<br />
“Other provisions” mainly includes estimated cash outflows connected with legal<br />
matters.<br />
The precise timing of the estimated outflows of funds from “Other provisions”<br />
is difficult to ascertain and largely out of the company’s control. The Management<br />
assumes that the outflow will occur within the next one to three years.<br />
29 Mortgages<br />
Balance 1.1.2008 95 000<br />
Increase in mortgages 15 000<br />
Balance 31.12.2008 110 000<br />
Repayment of mortgages (3 500)<br />
Balance 31.12.2009 106 500<br />
The mortgages reflect long-term fixed-interest bank loans with residual terms<br />
between one and five years. The average interest rate on mortgages amounted<br />
to 3.5 % in 2009 (2008: 3.6 %).<br />
30 Loans<br />
CHF 1000 31.12.2009 31.12.2008<br />
Long-term loans, gross – 50 000<br />
Credit procurement costs – (542)<br />
Long-term loans, net – 49 458<br />
The financial costs incurred in connection with the loan agreements (see below)<br />
are amortized in accordance with the residual term to maturity and credit utilization<br />
over the remaining lifetime of the loan contract.<br />
The carrying amount of the loans outstanding as at December 31, 2008, is approximately<br />
in line with market value as the interest rates are adjusted annually.<br />
The annual adjustment of the margin reflects the market’s risk assessment of<br />
the company.<br />
46
CHF 1000<br />
At the end of June 2007, Charles Vögele Group signed a new syndicated credit<br />
agreement of CHF 250 million. The loan is for a term of five years. The utilized<br />
credit line at the balance sheet date, is shown in the chart about liquidity reserves<br />
(see Note 3.4). The interest rate is based on LIBOR plus a margin of between<br />
30 and 115 basis points depending on a key financial ratio of the Group (net debt/<br />
EBITDA; see also the overview of cash reserves in Note 3.5). The target ratio<br />
was met on the balance sheet date. The average interest rate in the year under<br />
review was 1.1 % (2008: 3.3 %).<br />
31 Financial instruments by category (liabilities)<br />
Liabilities<br />
at fair value<br />
through profit<br />
and loss<br />
47<br />
Derivatives<br />
used for<br />
hedging<br />
Other<br />
financial<br />
liabilities<br />
at amortized<br />
cost<br />
Other nonfinancial<br />
liabilities Total<br />
Trade payables – – 47 926 – 47 926<br />
Other liabilities and accruals – – 64 497 19 223 83 720<br />
Derivative financial instruments – 4 255 – – 4 255<br />
Mortgages – – 106 500 – 106 500<br />
Loans – – – – –<br />
Balance 31.12.2009 – 4 255 218 923 19 223 242 401<br />
Trade payables – – 53 303 – 53 303<br />
Other liabilities and accruals – – 58 671 18 369 77 040<br />
Derivative financial instruments – 12 268 – – 12 268<br />
Mortgages – – 110 000 – 110 000<br />
Loans – – 49 458 – 49 458<br />
Balance 31.12.2008 – 12 268 271 432 18 369 302 069<br />
Financial Commentary<br />
Income Statement and Balance Sheet<br />
Cash Flow and Changes in Equity<br />
Notes<br />
Statutory Auditors
32 Share capital<br />
The reduction in the share capital is due to the <strong>Annual</strong> Shareholders’ Meeting’s<br />
decision on April 1, 2009, to reduce the par value of Charles Vögele Holding AG<br />
shares by CHF 0.50 per share, from CHF 4.00 to CHF 3.50. The remaining share<br />
capital comprises 8 800 000 fully paid-in bearer shares with a par value of<br />
CHF 3.50 each.<br />
The articles of association of Charles Vögele Holding AG include a provision autho<br />
rizing the Board of Directors to make a conditional increase in the share cap ital<br />
of up to CHF 0.9 million, divided into 264 000 fully paid-in bearer shares with a<br />
par value of CHF 3.50 each, without giving rise to any pre-emptive rights for existing<br />
shareholders. These shares may only be used for the management share option<br />
plan (see Note 35 on the management share option plan).<br />
33 Treasury shares<br />
As of December 31, 2009, treasury shares comprise 434 907 shares (December 31,<br />
2008: 417 641) held by the Charles Vögele Group and earmarked for share participations<br />
by the Management of the Charles Vögele Group (see Note 35).<br />
34 Distribution to shareholders<br />
For the 2008 financial year, on July 3, 2009, a par value reduction of CHF 0.50<br />
(for the 2007 financial year on July 4, 2008, a par value reduction of CHF 2.00)<br />
was paid for each Charles Vögele Holding AG bearer share.<br />
At the <strong>Annual</strong> Shareholders’ Meeting on April 14, 2010, the Board of Directors will<br />
propose that no dividend be paid for the 2009 financial year because of the net loss.<br />
35 Incentive and share ownership plans<br />
In order to link the interests of the members of its Board of Directors, Group Management<br />
and employees with those of its shareholders, the Group offered a number<br />
of opportunities for certain employees to purchase shares.<br />
35.1 Management share option plan 2002<br />
The 2002 option plan for members of the Board of Directors, Group Management,<br />
and the second management level replaced all former management share option<br />
plans. The option plan (equity-based remuneration settled through equity instruments)<br />
is financed through treasury shares. The award of options is proposed<br />
by the Personnel and Compensation Com mittee and approved by the Board of<br />
Directors. Allocation criteria are based on the rank and function of the indivi -<br />
dual employees. Each option entitles the holder to acquire one share. Initially the<br />
number of shares that could be issued under this plan was limited to 3% of the<br />
company’s ordinary share capital, but this was increased in 2005 by the Board of<br />
Directors of Charles Vögele Holding AG to 5% of the available shares. The dura tion<br />
of the option plan is not limited. The duration of the options of each tranche expires<br />
after five years, with a vesting period of three years from the date they are<br />
awarded. On leaving the Board of Directors, board members receive their allocated<br />
48
Granting year<br />
of tranche<br />
options in full. On leaving the company, members of Group Management and the<br />
second level of management receive their allocated options pro rata temporis<br />
on the basis of the three- year vesting period. However, the three-year vesting period<br />
continues to apply in all cases.<br />
The annual tranches still outstanding are detailed in the following table:<br />
Number of<br />
outstanding<br />
options as of<br />
1.1.2009<br />
Number of<br />
granted<br />
options<br />
Number of<br />
expired<br />
options<br />
Number of<br />
exercised<br />
options<br />
49<br />
Number of<br />
outstanding<br />
options as of<br />
31.12.2009<br />
Exercise<br />
price in CHF<br />
Duration<br />
until<br />
2004 46 734 – (43 734) (3 000) 0 41.05 2009 2007<br />
2005 74 917 – (10 300) – 64 617 95.55 2010 2008<br />
2006 95 780 – (14 538) – 81 242 90.00 2011 2009<br />
2007 96 110 – (19 937) – 76 173 119.00 2012 2010<br />
2008 100 000 – (5 825) – 94 175 65.05 2013 2011<br />
2009 – 118 700 – – 118 700 39.50 2014 2012<br />
Total 413 541 118 700 (94 334) (3 000) 434 907<br />
Further allocations under this plan are usually determined at the meeting held by<br />
the Board of Directors to discuss the half-year financial statements. The exercise<br />
price is determined by the volume-weighted closing price on the 30 trading days<br />
prior to the allocation date and the 10 trading days after this date.<br />
The changes in the number of outstanding share options and the relevant weighted<br />
average exercise prices are shown in the following table:<br />
2009<br />
Weighted<br />
average<br />
exercise<br />
price in CHF<br />
2009<br />
Number of<br />
options<br />
2008<br />
Weighted<br />
average<br />
exercise<br />
price in CHF<br />
Vesting<br />
period<br />
until<br />
2008<br />
Number of<br />
options<br />
Balance 1.1. 86.18 413 541 88.45 368 246<br />
Granted options 39.50 118 700 65.05 100 000<br />
Expired options 68.48 (94 334) 104.34 (11 905)<br />
Exercised options 41.05 (3 000) 51.30 (42 800)<br />
Balance 31.12. 76.72 434 907 86.18 413 541<br />
Exercisable as at 31.12. 92.46 145 859 74.61 121 651<br />
Financial Commentary<br />
Income Statement and Balance Sheet<br />
Cash Flow and Changes in Equity<br />
Notes<br />
Statutory Auditors
The weighted average share price for options exercised during the reporting period<br />
can be seen on the following table:<br />
Granting year of tranche Exercise period<br />
50<br />
Number of<br />
exercised<br />
options<br />
Weighted<br />
average<br />
share price<br />
during exercise<br />
period<br />
in CHF<br />
2003 1.1. – 29.8.2008 32 500 83.08<br />
2004 1.1. – 31.12.2008 10 300 75.45<br />
Total 2008 42 800<br />
2004 1.1. – 24.8.2009 3 000 35.79<br />
Total 2009 3 000<br />
Tranche<br />
The above-mentioned tranches are serviced exclusively by treasury shares purchased<br />
by the Charles Vögele Group for this purpose (see Note 33).<br />
The weighted average remaining contractual term of the 434 907 options outstanding<br />
on December 31, 2009 was 36 months (previous year 413 541 options and 36<br />
months). Exercise prices ranged between CHF 39.50 and CHF 119.00 per option<br />
(previous year: between CHF 41.05 and CHF 119.00).<br />
The fair value of the options as determined by the Enhanced American Model was<br />
calculated using the following key parameters:<br />
Share price<br />
at granting day<br />
in CHF<br />
Expected<br />
volatility<br />
Risk-free<br />
interest rate<br />
Expected<br />
dividend yield<br />
Fair value per<br />
option in CHF<br />
24.08.2004 36.50 34.27% 1.94% 1.46% 6.86<br />
29.08.2005 93.00 34.01% 1.57% 1.51% 20.40<br />
26.08.2006 90.00 35.96% 2.49% 1.73% 23.39<br />
23.08.2007 117.50 30.55% 3.01% 1.71% 27.12<br />
22.08.2008 61.80 35.99% 2.96% 1.71% 14.93<br />
21.08.2009 40.00 48.53% 1.39% 1.72% 12.48<br />
The expected volatility was determined from the mean value of the average implied<br />
volatility and historical volatility over six months.<br />
The weighted average of the fair values of options issued during the year under<br />
review is CHF 12.48 (previous year CHF 14.93).<br />
During the year under review CHF 1.7 million (previous year CHF 3.0 million) was<br />
charged through personnel expenses for the proportional fair value of options.
36 Contingent liabilities<br />
36.1 Outstanding merchandise orders and letters of credit<br />
As of December 31, 2009, future commitments resulting from merchandise<br />
orders not yet included in the balance sheet amounted to CHF 136.2 million<br />
(December 31, 2008: CHF 124.6 million). As of December 31, 2009, letters of credit<br />
not in cluded in the balance sheet amounted to CHF 31.2 million (December 31,<br />
2008: CHF 26.4 million).<br />
37 Forward foreign exchange contracts<br />
The forward foreign exchange contracts open on the balance sheet date are shown<br />
in Note 3.4 under liquidity risks.<br />
37.1 Derivatives for cash flow hedges<br />
As at December 31, 2009, open forward foreign exchange contracts for cash flow<br />
hedges were as follows: CHF 199.7 million (previous year: CHF 213.7 million) for<br />
purchase of merchandise in USD and to cover the exchange rate risks for purchasing<br />
merchandise for the following year’s collection; CHF 255.7 million (previous year<br />
CHF 135.8) to hedge intra-Group deliveries of goods in EUR to sales organizations<br />
in the eurozone.<br />
These derivative financial instruments are valued at their replacement value.<br />
Any changes in the fair value arising from the valuation on the balance sheet date<br />
are recognized under equity as “Valuation financial instruments” until the hedged<br />
underlying transaction has occured.<br />
The valuation difference from ineffective hedge transactions is debited or credited<br />
directly to “Exchange gains/(losses)” in the income statement. There were no<br />
material ineffective hedge transactions during the year under review.<br />
51<br />
Financial Commentary<br />
Income Statement and Balance Sheet<br />
Cash Flow and Changes in Equity<br />
Notes<br />
Statutory Auditors
Movement in valuation differences not affecting income statement<br />
CHF 1000 Equity<br />
Balance 1.1.2008<br />
Valuation financial instruments before tax (8 028)<br />
Deferred tax 1 204<br />
Valuation financial instruments net of tax 1.1.2008 (6 824)<br />
Year 2008<br />
Opening balance (6 824)<br />
Disposal through purchase of goods recognized in cost of goods in<br />
income statement 8 028<br />
Valuation of outstanding financial instruments as of 31.12.2008 (7 271)<br />
Change in deferred tax (113)<br />
Valuation net of tax 31.12.2008 (6 180)<br />
Closing balance 31.12.2008<br />
Valuation financial instruments before tax (7 271)<br />
Deferred tax 1 091<br />
Valuation financial instruments net of tax 31.12.2008 (6 180)<br />
Year 2009<br />
Opening balance (6 180)<br />
Disposal through purchase of goods recognized in cost of goods in<br />
income statement 7 271<br />
Valuation of outstanding financial instruments as of 31.12.2009 567<br />
Change in deferred tax (1 176)<br />
Valuation financial instruments net of tax 31.12.2009 482<br />
Closing balance 31.12.2009<br />
Valuation financial instruments before tax 567<br />
Deferred tax (85)<br />
Valuation financial instruments net of tax 31.12.2009 482<br />
37.2 Derivatives for trading purposes<br />
The valuation of currency swaps and forward foreign exchange contracts at<br />
fair value resulted in a profit of CHF 0.4 million as of December 31, 2009<br />
(December 31, 2008: profit of CHF 1.9 million), which was included in the income<br />
statement under “Exchange gains or losses”.<br />
52
38 Rental commitments<br />
For rental contracts (operating leasing) with fixed rental terms, the following<br />
minimum payments are to be expected (excluding renewal options):<br />
CHF 1000 31.12.2009 31.12.2008<br />
Maturity < 1 year 180 070 174 970<br />
Maturity 1 – 5 years 494 241 478 087<br />
Maturity > 5 years 224 308 225 160<br />
Total 898 619 878 217<br />
39 Related party transactions<br />
The Board of Directors of Charles Vögele Holding AG and the Top Management<br />
of Charles Vögele Group constitute the key management personnel pursuant to<br />
IAS 24.<br />
The amounts reported or deferred in these annual financial statements were used<br />
to calculate the payments shown below.<br />
The remuneration of the Board of Directors and Group Management amounted to:<br />
53<br />
Board of<br />
Directors<br />
Top<br />
Management Total<br />
2009 Number of members as of 31.12.2009 4 4<br />
Salaries, professional fees, bonuses and other<br />
remunerations in CHF 1 000 1) 819 3 868 4 687<br />
Number of Management options 17 200 49 300 66 500<br />
Value of Management options in CHF 1 000 2) 216 615 831<br />
2008 Number of members as of 31.12.2008 8 4<br />
Salaries, professional fees, bonuses and other<br />
remunerations in CHF 1 000 1 210 3 720 4 930<br />
Number of Management options 34 400 26 400 60 800<br />
Value of Management options in CHF 1 000 2) 512 394 906<br />
1) Salary of the timely overlap from three months between the employment and resignation<br />
of two members of Group Management is included.<br />
2) Valuation: fair value according IFRS, details see page 50.<br />
Financial Commentary<br />
Income Statement and Balance Sheet<br />
Cash Flow and Changes in Equity<br />
Notes<br />
Statutory Auditors
CHF 1000<br />
Details of total payments to members of the Board of Directors pursuant to the<br />
Swiss Code of Obligations (CO) for the 2009 financial year:<br />
Alain<br />
Caparros<br />
Chairman 1)<br />
54<br />
Hans<br />
Ziegler<br />
Vice-<br />
Chairman 2)<br />
Jan C.<br />
Berger<br />
Member<br />
Peter<br />
Littmann<br />
Member<br />
Total<br />
Board of<br />
Directors<br />
Salaries (gross) 251 161 93 93 598<br />
Bonus (gross) – – – – –<br />
Employer’s social security costs – 14 10 10 34<br />
Lump-sum expenses 2 2 2 2 8<br />
Management options 3) 54 54 54 54 216<br />
Consultancy fees – – 41 4) – 41<br />
Total payments 2009 to the remaining<br />
members of the Board of Directors 307 231 200 159 897<br />
CHF 1000<br />
Bernd H.J.<br />
Bothe<br />
Chairman 1)<br />
Dr. Felix<br />
R. Ehrat<br />
Vice-<br />
Chairman 2)<br />
Daniel J.<br />
Sauter<br />
Member<br />
Carlo<br />
Vögele<br />
Member<br />
Total<br />
Board of<br />
Directors<br />
Salaries (gross) 76 46 23 23 168<br />
Bonus (gross) – – – – –<br />
Employer’s social security costs – 2 1 4 7<br />
Lump-sum expenses 1 1 1 1 4<br />
Management options 3) – – – – –<br />
Total payments 2009 to the resigned<br />
members of the Board of Directors,<br />
excluding consultancy fees 77 49 25 28 179<br />
Consultancy fees – 119 5) – – 119<br />
Total payments 2009 to the resigned members<br />
of the Board of Directors 77 168 25 28 298<br />
1) Bernd H.J. Bothe was Chairman until April 1, 2009.<br />
After his resignation Alain Caparros took over the position.<br />
2) Dr. Felix R. Ehrat was Vice-Chairman until April 1, 2009.<br />
After his resignation Hans Ziegler took over the position.<br />
3) Valuation: fair value according IFRS, details see page 50.<br />
4) Fees from Retailize BV<br />
5) Fees from Bär & Karrer AG until April 1, 2009
CHF 1000<br />
Details of total payments to members of the Board of Directors pursuant to the<br />
Swiss Code of Obligations (CO) for the 2008 financial year:<br />
Alain<br />
Caparros<br />
Member<br />
55<br />
Hans<br />
Ziegler<br />
Member<br />
Jan C.<br />
Berger<br />
Member<br />
Peter<br />
Littmann<br />
Member<br />
Total<br />
Board of<br />
Directors<br />
Salaries (gross) 93 70 70 93 326<br />
Bonus (gross) 15 12 12 15 54<br />
Employer’s social security costs – 11 11 12 34<br />
Lump-sum expenses 2 2 2 2 8<br />
Management options 1) 64 64 64 64 256<br />
Total payments 2008 to the remaining<br />
members of the Board of Directors 174 159 159 186 678<br />
CHF 1000<br />
Bernd H.J.<br />
Bothe<br />
Chairman<br />
Dr. Felix<br />
R. Ehrat<br />
Vice-<br />
Chairman<br />
Daniel J.<br />
Sauter<br />
Member<br />
Carlo<br />
Vögele<br />
Member<br />
Total<br />
Board of<br />
Directors<br />
Salaries (gross) 303 183 93 93 672<br />
Bonus (gross) 15 15 15 15 60<br />
Employer’s social security costs – 17 12 19 48<br />
Lump-sum expenses 2 2 2 2 8<br />
Management options 1) 64 64 64 64 256<br />
Total payments 2008 to the resigned<br />
members of the Board of Directors,<br />
excluding consultancy fees 384 281 186 193 1 044<br />
Consultancy fees – 281 2) – – 281<br />
Total payments 2008 to the resigned members<br />
of the Board of Directors 384 562 186 193 1 325<br />
1) Valuation: fair value according IFRS, details see page 50.<br />
2) Fees from Bär & Karrer AG<br />
Financial Commentary<br />
Income Statement and Balance Sheet<br />
Cash Flow and Changes in Equity<br />
Notes<br />
Statutory Auditors
CHF 1000<br />
Details of total payments to the Top Management pursuant to the Swiss Code of<br />
Obligations (CO) for the 2009 financial year:<br />
56<br />
André<br />
Maeder<br />
CEO<br />
Total Top Management<br />
1)<br />
Salaries (gross) 785 2 599<br />
Bonus (gross) 709 784<br />
Employer’s social security and insurance costs 146 443<br />
Lump-sum expenses – 12<br />
Company car 2) 4 30<br />
Management options 3) 286 615<br />
Total 2009 1 930 4 483<br />
1) Salary of Bernd H.J. Bothe for his function as interim CEO for the period<br />
of January to mid February 2009 is included.<br />
Salary of the timely overlap between the employment and resignation<br />
of two members of Group Management is included.<br />
2) Private use (tax value: 9.6% of acquisition value).<br />
3) Valuation: fair value according IFRS, details see page 50.<br />
CHF 1000<br />
Details of total payments to the Top Management pursuant to the Swiss Code of<br />
Obligations (CO) for the 2008 financial year:<br />
Daniel<br />
Reinhard<br />
CEO 1)<br />
Total Top Management<br />
2)<br />
Salaries (gross) 938 2 679<br />
Bonus (gross) 135 620<br />
Employer’s social security and insurance costs 97 375<br />
Lump-sum expenses – 12<br />
Company car 3) 10 34<br />
Management options 4) – 394<br />
Total 2008 1 180 4 114<br />
1) Three monthly salaries for the year 2009 are included.<br />
2) Salary of Bernd H.J. Bothe for his function as interim CEO for the period<br />
of mid August to December 2008 is included.<br />
3) Private use (tax value: 9.6% of acquisition value).<br />
4) Valuation: fair value according IFRS, details see page 50.<br />
2009<br />
Disclosure of Board of Directors’ shareholdings pursuant to the Swiss Code of<br />
Obligations (CO) as at December 31, 2009:<br />
Alain<br />
Caparros<br />
Chairman<br />
Hans<br />
Ziegler<br />
Vice-<br />
Chairman<br />
Jan C.<br />
Berger<br />
Member<br />
Peter<br />
Littmann<br />
Member<br />
Total<br />
Board of<br />
Directors<br />
Number of shares – – – – –<br />
In percentage of share capital – – – – –<br />
Value of shares in CHF 1 000 – – – – –<br />
Number of Management options 12 900 8 600 8 600 17 200 47 300<br />
In percentage of share capital 0.15% 0.10% 0.10% 0.19% 0.55%<br />
Value of Management options in CHF 1 000 1) 37 37 37 38 149<br />
1) Valuation: according to Swiss tax rules.
2008<br />
Disclosure of Board of Directors’ shareholdings pursuant to the Swiss Code of<br />
Obligations (CO) as at December 31, 2008:<br />
Bernd H.J.<br />
Bothe<br />
Chairman<br />
57<br />
Dr. Felix<br />
R. Ehrat<br />
Vice-<br />
Chairman<br />
Jan C.<br />
Berger<br />
Member<br />
Alain<br />
Caparros<br />
Member<br />
Peter<br />
Littmann<br />
Member<br />
Number of shares 7 500 10 500 – – –<br />
In percentage of share capital 0.09% 0.12% – – –<br />
Value of shares in CHF 1 000 206 289 – – –<br />
Number of Management options 16 300 19 300 4 300 8 600 12 900<br />
In percentage of share capital 0.19% 0.22% 0.05% 0.10% 0.15%<br />
Value of Management options in CHF 1 000 1) 7 8 6 6 7<br />
2008<br />
Daniel J.<br />
Sauter<br />
Member<br />
Carlo<br />
Vögele<br />
Member<br />
Hans<br />
Ziegler<br />
Member<br />
Total<br />
Board of<br />
Directors<br />
Number of shares 6 500 195 877 100 220 477<br />
In percentage of share capital 0.07% 2.23% 0.00% 2.51%<br />
Value of shares in CHF 1 000 179 5 387 3 6 064<br />
Number of Management options 19 300 16 300 4 300 101 300<br />
In percentage of share capital 0.22% 0.19% 0.05% 1.17%<br />
Value of Management options in CHF 1 000 1) 8 7 6 55<br />
1) Valuation: according to Swiss tax rules.<br />
2009<br />
Disclosure of Group Management’s shareholdings pursuant to the Swiss Code of<br />
Obligations (CO) as at December 31, 2009:<br />
André<br />
Maeder<br />
CEO<br />
Werner<br />
Lange<br />
CPO<br />
Dr. Dirk<br />
Seifert<br />
COO<br />
Markus<br />
Voegeli<br />
CFO<br />
Total Top Management<br />
Number of shares – – – 1 200 1 200<br />
In percentage of share capital – – – 0.01% 0.01%<br />
Value of shares in CHF 1 000 – – – 44 44<br />
Number of Management options 22 900 26 400 17 600 8 800 75 700<br />
In percentage of share capital 0.26% 0.30% 0.20% 0.10% 0.86%<br />
Value of Management options in CHF 1 000 1) 148 77 76 57 358<br />
1) Valuation: according to Swiss tax rules.<br />
2008<br />
Disclosure of Group Management’s shareholdings pursuant to the Swiss Code of<br />
Obligations (CO) as at December 31, 2008:<br />
Werner<br />
Lange<br />
CPO<br />
Dr. Dirk<br />
Seifert<br />
COO<br />
Dr. Felix<br />
Thöni<br />
CFO<br />
Total Top Management<br />
Number of shares – – 8 100 8 100<br />
In percentage of share capital – – 0.09% 0.09%<br />
Value of shares in CHF 1 000 – – 223 223<br />
Number of Management options 17 600 8 800 39 400 65 800<br />
In percentage of share capital 0.20% 0.10% 0.45% 0.75%<br />
Value of Management options in CHF 1 000 1) 13 12 15 40<br />
1) Valuation: according to Swiss tax rules.<br />
Financial Commentary<br />
Income Statement and Balance Sheet<br />
Cash Flow and Changes in Equity<br />
Notes<br />
Statutory Auditors
40 Risk assessment according to the Swiss Code of Obligations<br />
Financial risk assessment and management is an integral part of the Charles Vögele<br />
Group-wide enterprise risk management and is governed by policies reviewed by<br />
the Board of Directors. The policies provide guidance on operational risk limits and<br />
monitoring procedures. Such monitoring procedures contain regular review of<br />
accounting policy, significant accounting matters, and items requiring significant<br />
management judgments and estimates. The implementation of the accounting<br />
policy, the adherence to the regulation and the monitoring on a daily risk basis are<br />
carried out by the relevant financial departments. Regular reporting on the re-<br />
view of the financial risk situation is performed by the relevant accounting and controlling<br />
functions.<br />
Charles Vögele Group has established a fully integrated risk process that captures<br />
and evaluates the Group’s most important external and internal risks. The key risks<br />
are entered in a risk matrix that shows both the potential degree of impact and<br />
likelihood of each individual risk. Based on the company’s risk tolerance, Group<br />
Management either initiates measures to reduce the degree of impact and/or<br />
the likelihood of the risk occurring, or deliberately takes on specific risks. Group<br />
Management periodically evaluates and updates the key risks. Charles Vögele<br />
Holding AG’s Board of Directors evaluates the effectiveness of the risk management<br />
system every year.<br />
41 Post balance sheet events<br />
The present financial statements take into consideration events occurring between<br />
the balance sheet date and March 4, 2010. There were no significant post bal ance<br />
sheet events. The 2009 financial statements, which were discussed between the<br />
Audit Committee and representatives of Group Management and approved by<br />
the Charles Vögele Holding AG Board of Directors on March 4, 2010, are published<br />
on March 9, 2010, and presented to the <strong>Annual</strong> Shareholders’ Meeting on April 14,<br />
2010, for approval.<br />
58
42 Structure of the Charles Vögele Group as of December 31, 2009<br />
Share/<br />
Company Currency Partnership capital<br />
Charles Vögele Holding AG<br />
Pfäffikon SZ, CH<br />
Holding CHF 30 800 000<br />
100 % Charles Vögele Trading AG<br />
Pfäffikon SZ, CH<br />
Central services CHF 10 000 000<br />
100 % Charles Vögele Store Management AG<br />
Pfäffikon SZ, CH<br />
Central services (dormant) CHF 250 000<br />
100 % Prodress AG<br />
Pfäffikon SZ, CH<br />
Central services CHF 100 000<br />
100 % Cosmos Mode AG<br />
Pfäffikon SZ, CH<br />
Central services CHF 100 000<br />
100 % Mac Fash GmbH<br />
Pfäffikon SZ, CH<br />
Central services (dormant) CHF 20 000<br />
100 % Charles Vögele Import GmbH<br />
Lehrte, DE<br />
Central services EUR 25 000<br />
100 % Charles Vögele Fashion (HK) Ltd.<br />
Hongkong, HK<br />
Central services HKD 100 000<br />
100 % Charles Vögele Mode AG<br />
Pfäffikon SZ, CH<br />
Sales organization CHF 20 000 000<br />
100 % Charles Vögele Deutschland GmbH<br />
Sigmaringen, DE<br />
Sales organization EUR 15 340 000<br />
100 % Charles Vögele (Netherlands) B.V.<br />
Utrecht, NL<br />
Sales organization EUR 1 000 200<br />
100 % Charles Vögele (Belgium) N.V.<br />
Turnhout, BE<br />
Sales organization EUR 10 063 906 1)<br />
100 % Charles Vögele (Austria) AG<br />
Kalsdorf, AT<br />
Sales organization EUR 1 453 457<br />
100 % Charles Voegele trgovina s tekstilom d.o.o.<br />
Lubljana, SI<br />
Sales organization EUR 667 668<br />
100 % Charles Voegele Polska Sp. z o.o.<br />
Warsaw, PL<br />
Sales organization PLN 4 000 000<br />
100 % Charles Vögele Hungária Kereskedelmi Kft.<br />
Vecsés, HU<br />
Sales organization HUF 240 000 000<br />
100 % Charles Voegele Ceska s.r.o.<br />
Prague, CZ<br />
Sales organization CZK 30 000 000<br />
100 % Charles Voegele Romania SRL<br />
Bucaresti, RO<br />
Sales organization (dormant) RON 4 000 000<br />
Changes in the scope of consolidation, see Note 2.5.<br />
1) Decreased by EUR 2 725 393 following refinancing in 2008.<br />
59<br />
Financial Commentary<br />
Income Statement and Balance Sheet<br />
Cash Flow and Changes in Equity<br />
Notes<br />
Statutory Auditors
Report of the statutory auditors to the general meeting<br />
of Charles Vögele Holding AG, Pfäffikon SZ<br />
> Report of the statutory auditors on the consolidated financial statements<br />
As statutory auditors, we have audited the consolidated financial statements of<br />
Charles Vögele Holding AG, which comprise the income statement, statement of<br />
comprehensive income, balance sheet, cash flow statement, statement of changes<br />
in equity and notes (pages 6 to 59), for the year ended December 31, 2009.<br />
> Board of Directors’ Responsibility<br />
The Board of Directors is responsible for the preparation and fair presentation of<br />
the consolidated financial statements in accordance with the International<br />
Financial Reporting Standards (IFRS) and the requirements of Swiss law. This<br />
responsibility includes designing, implementing and maintaining an internal<br />
control system relevant to the preparation and fair presentation of consolidated<br />
financial statements that are free from material misstatement, whether due<br />
to fraud or error. The Board of Directors is further responsible for selecting and<br />
applying appropriate accounting policies and making accounting estimates that<br />
are reasonable in the circumstances.<br />
> Auditor’s Responsibility<br />
Our responsibility is to express an opinion on these consolidated financial statements<br />
based on our audit. We conducted our audit in accordance with Swiss<br />
law and Swiss Auditing Standards as well as the International Standards on Auditing.<br />
Those standards require that we plan and perform the audit to obtain<br />
reasonable assurance whether the consolidated financial statements are free from<br />
material misstatement.<br />
An audit involves performing procedures to obtain audit evidence about the amounts<br />
and disclosures in the consolidated financial statements. The procedures selec-<br />
ted depend on the auditor’s judgment, including the assessment of the risks of<br />
material misstatement of the consolidated financial statements, whether due<br />
to fraud or error. In making those risk assessments, the auditor considers the inter-<br />
nal control system relevant to the entity’s preparation and fair presentation of<br />
the con solidated financial statements in order to design audit procedures that are<br />
appropriate in the circumstances, but not for the purpose of expressing an opinion<br />
on the effectiveness of the entity’s internal control system. An audit also in-<br />
cludes evaluating the appropriateness of the accounting policies used and the<br />
reason ableness of accounting estimates made, as well as evaluating the overall<br />
presentation of the consolidated financial statements. We believe that the<br />
audit evidence we have obtained is sufficient and appropriate to provide a basis<br />
for our audit opinion.<br />
60
Opinion<br />
In our opinion, the consolidated financial statements for the year ended December<br />
31, 2009, give a true and fair view of the financial position, the results of operations<br />
and the cash flows in accordance with the International Financial Reporting<br />
Standards (IFRS) and comply with Swiss law.<br />
> Report on other legal requirements<br />
We confirm that we meet the legal requirements on licensing according to the Auditor<br />
Oversight Act (AOA) and independence (article 728 CO and article 11 AOA) and<br />
that there are no circumstances incompatible with our independence.<br />
In accordance with article 728a paragraph 1 item 3 CO and Swiss Auditing Standard<br />
890, we confirm that an internal control system exists which has been designed<br />
for the preparation of consolidated financial statements according to the instructions<br />
of the Board of Directors.<br />
We recommend that the consolidated financial statements submitted to you be<br />
approved.<br />
PricewaterhouseCoopers AG<br />
Matthias von Moos Hanspeter Abegg<br />
Audit expert Audit expert<br />
Auditor in Charge<br />
Zurich, March 4, 2010<br />
61<br />
Financial Commentary<br />
Income Statement and Balance Sheet<br />
Cash Flow and Changes in Equity<br />
Notes<br />
Statutory Auditors
CONTENT<br />
64 Income Statement<br />
65 Balance Sheet<br />
66 Notes to the Financial Statements<br />
Basis for the financial statements<br />
Financial income and expenses<br />
Impairment of loans to subsidiaries<br />
Cash and cash equivalents<br />
Receivables from and liabilities to subsidiaries<br />
Investments<br />
Share capital<br />
67 Movement in treasury shares<br />
Major shareholders<br />
68 Contingent liabilities<br />
Pledged assets<br />
Board of Directors and Group Management:<br />
Total payments and shareholdings<br />
Risk assessment according to the Swiss Code of Obligations<br />
69 Proposed Appropriation of Retained Earnings<br />
70 Report of the statutory auditors<br />
63
CHF 1000 Note 2009 2008<br />
Income<br />
Dividends 1 35 001<br />
Financial income 2 12 955 13 870<br />
Total income 12 956 48 871<br />
Expenses<br />
from January 1 to December 31<br />
INCOME STATEMENT HOlDING<br />
Administration expenses (2 196) (2 889)<br />
Financial expenses 2 (7 181) (20 469)<br />
Impairment of loans to subsidiaries 3 (6 472) (5 271)<br />
Exchange loss, net (2 199) (14 401)<br />
Total expenses (18 048) (43 030)<br />
(Loss)/profit before income tax (5 092) 5 841<br />
Tax expenses (19) (22)<br />
Net (loss)/profit of the year (5 111) 5 819<br />
64
CHF 1000 Note 31.12.2009 31.12.2008<br />
Assets<br />
Current assets<br />
Cash and cash equivalents 4 13 939 2 377<br />
Receivables from subsidiaries 5 38 267 64 739<br />
Other receivables and prepaid expenses 87 7 124<br />
Total current assets 52 293 74 240<br />
Long-term assets<br />
Loans to subsidiaries 5 373 015 381 602<br />
Investments 6 582 912 574 662<br />
Total long-term assets 955 927 956 264<br />
Total assets 1 008 220 1 030 504<br />
Liabilities and shareholders’ equity<br />
Short-term liabilities<br />
Accounts payable third parties 63 7<br />
Accounts payable subsidiaries 5 644 248 656 455<br />
Accrued liabilities 62 684<br />
Current tax liabilities 17 17<br />
Total short-term liabilities 644 390 657 163<br />
Shareholders’ equity<br />
as of December 31<br />
BAlANCE SHEET HOlDING<br />
Share capital 7 30 800 35 200<br />
Legal reserves 173 789 173 789<br />
Free reserves 110 000 110 000<br />
Reserve for treasury shares 8 33 784 33 428<br />
Retained earnings:<br />
– Retained earnings as of January 1 20 924 17 428<br />
– Decrease/(Increase) of reserve for treasury shares (356) (2 323)<br />
– Net profit of the year (5 111) 5 819<br />
Total retained earnings 15 457 20 924<br />
Total shareholders’ equity 363 830 373 341<br />
Total liabilities and shareholders’ equity 1 008 220 1 030 504<br />
65<br />
Income Statement and Balance Sheet<br />
Notes<br />
Earnings<br />
Group Auditors
NOTES TO THE FINANCIAl STATEMENTS<br />
1 Basis for the financial statements<br />
Charles Vögele Holding AG is based in Pfäffikon, municipality of Freienbach, in the<br />
Canton of Schwyz, Switzerland, and its purpose is the holding and administration<br />
of investments of the Charles Vögele Group. The financial statements are presented<br />
in accordance with Swiss law.<br />
The integration of the financial statements of Charles Vögele Holding AG into the<br />
consolidated financial statements of the Charles Vögele Group has been made<br />
in accordance with the accounting principles explained in the Notes to the consoli<br />
dated financial statements.<br />
2 Financial income and expenses<br />
The financial income arises largely from the interest income from cash pooling and<br />
from interest on loans granted to subsidiary companies. These are counterbalanced<br />
by financial expenses in the form of interest on cash pooling and on interest<br />
on accounts payable to subsidiary companies and third parties.<br />
3 Impairment of loans to subsidiaries<br />
Impairments of loans to Group companies concern value adjustments on Group<br />
loans to subsidiaries in Germany and Poland.<br />
4 Cash and cash equivalents<br />
This position includes sight deposits at banks.<br />
5 Receivables from and liabilities to subsidiaries<br />
Current asset receivables and short-term payables due from and to Group companies<br />
are resulting mainly from the Group’s cash pooling system.<br />
Loans to Group companies serve to finance various subsidiaries and are value<br />
adjusted if necessary (see Note 3).<br />
6 Investments<br />
The complete structure of the Charles Vögele Group’s long-term investments<br />
is documented in Note 42 of the Notes to the consolidated financial statements.<br />
7 Share capital<br />
The reduction in the share capital is due to the <strong>Annual</strong> Shareholders’ Meeting’s<br />
decision on April 1, 2009, to reduce the par value of Charles Vögele Holding AG<br />
shares by CHF 0.50 per share, from CHF 4.00 to CHF 3.50. The remaining share<br />
capital comprises 8 800 000 fully paid-in bearer shares with a par value of<br />
CHF 3.50 per share.<br />
66
The company’s articles of association include a provision authorizing the Board<br />
of Directors to carry out a conditional increase of the share capital of up to<br />
CHF 0.9 million, divided into 264 000 fully paid-in bearer shares with a par value<br />
of CHF 3.50 each, without giving rise to any pre-emptive rights for existing<br />
share holders. The shares may only be used for the management share option plan<br />
(see Note 35 on the management share option plan in the Notes to the consolidated<br />
financial statements).<br />
8 Movement in treasury shares<br />
67<br />
Price in CHF<br />
Number<br />
of shares<br />
Treasury shares 31.12.2007 370 546<br />
Disposal of treasury shares by Charles Vögele Trading AG February–June 2008 47.00 – 87.00 (47 449)<br />
Purchase of treasury shares by Charles Vögele Trading AG June 2008 86.17 10 649<br />
Disposal of treasury shares by Charles Vögele Trading AG August–September 2008 45.00 – 84.72 (20 205)<br />
Purchase of treasury shares by Charles Vögele Trading AG September 2008 59.78 104 100<br />
Treasury shares 31.12.2008 417 641<br />
Purchase of treasury shares by Charles Vögele Trading AG August 2009 39.36 17 266<br />
Treasury shares 31.12.2009 434 907<br />
Shareholders<br />
For the holdings of treasury shares in the Charles Vögele Group as of December 31,<br />
2009, a reserve was formed in Charles Vögele Holding AG to the amount of<br />
the purchase value of CHF 33.8 million (December 31, 2008: CHF 33.4 million).<br />
9 Major shareholders<br />
All of the company’s shares are bearer shares. Consequently, the company maintains<br />
no share register. The following is based on information supplied to the<br />
company under stock exchange regulations and other information available to<br />
the company.<br />
Share of<br />
capital<br />
as of<br />
31.12.2009 1)<br />
Share of<br />
capital<br />
as of<br />
31.12.2008 1)<br />
As announ-<br />
ced on<br />
Laxey Partners Ltd., Onchan, Isle of Man, IM3 1NA, GB 2)
10 Contingent liabilities<br />
CHF 1000 31.12.2009 31.12.2008<br />
Rental- and other guarantees to third parties 29 078 31 728<br />
Guarantees to financing banks 384 359 384 723<br />
In addition, letters of comfort were issued to subsidiary companies.<br />
11 Pledged assets<br />
In connection with the syndicated refinancing agreement signed in June 2007<br />
(see Note 30 in the notes to the consolidated financial statements), Charles Vögele<br />
Holding AG issued a guarantee towards the lending banks.<br />
12 Board of Directors and Group Management: Total payments and<br />
shareholdings<br />
Disclosure of total payments and shareholdings pursuant to the Swiss Code of<br />
Obligations (CO) is made in the Notes to the consolidated financial statements<br />
(see Note 39).<br />
13 Risk assessment according to the Swiss Code of Obligations<br />
Charles Vögele Holding AG is fully integrated into the Group-wide risk assessment<br />
process of the Charles Vögele Group. This Group risk assessment process addresses<br />
the nature and scope of business activities and its specific risks. For detailed<br />
information refer to the disclosure in the consolidated financial statements (Note 40)<br />
of this annual report.<br />
68
CHF 1000<br />
as of December 31, 2009<br />
PROPOSED APPROPRIATION OF RETAINED EARNINGS<br />
The Board of Directors proposes to the <strong>Annual</strong> Shareholders’ Meeting of April 14,<br />
2010, to carry forward the retained earnings of CHF 15.5 million.<br />
Retained earnings as of 31.12.2009 15 457<br />
Balance to be carried forward 15 457<br />
Since the legal reserves have reached 20 % of the share capital, there will be no<br />
further allocation to the legal reserves.<br />
69<br />
Income Statement and Balance Sheet<br />
Notes<br />
Earnings<br />
Group Auditors
Report of the statutory auditors to the general meeting<br />
of Charles Vögele Holding AG, Pfäffikon SZ<br />
> Report of the statutory auditors on the financial statements<br />
As statutory auditors, we have audited the financial statements of Charles Vögele<br />
Holding AG, which comprise the income statement, balance sheet and Notes<br />
(pages 64 to 68), for the year ended December 31, 2009.<br />
> Board of Directors’ Responsibility<br />
The Board of Directors is responsible for the preparation of the financial statements<br />
in accordance with the requirements of Swiss law and the company’s articles of<br />
incorporation. This responsibility includes designing, implementing and maintaining<br />
an internal control system relevant to the preparation of financial statements that<br />
are free from material misstatement, whether due to fraud or error. The Board of<br />
Directors is further responsible for selecting and applying appropriate accounting<br />
policies and making accounting estimates that are rea-sonable in the circumstances.<br />
> Auditor’s Responsibility<br />
Our responsibility is to express an opinion on these financial statements based<br />
on our audit. We conducted our audit in accordance with Swiss law and Swiss<br />
Auditing Standards. Those standards require that we plan and perform the audit<br />
to obtain reasonable assurance whether the financial statements are free from<br />
material misstatement.<br />
An audit involves performing procedures to obtain audit evidence about the<br />
amounts and disclosures in the financial statements. The procedures selected<br />
depend on the auditor’s judgment, including the assessment of the risks of<br />
material misstatement of the financial statements, whether due to fraud or error.<br />
In making those risk assessments, the auditor considers the internal control<br />
system relevant to the entity’s preparation of the financial statements in order to<br />
design audit procedures that are appropriate in the circumstances, but not for<br />
the purpose of expressing an opinion on the effectiveness of the entity’s internal<br />
control system. An audit also includes evaluating the appropriateness of the<br />
accounting policies used and the reasonableness of accounting estimates made,<br />
as well as evaluating the overall presentation of the financial statements. We<br />
believe that the audit evidence we have obtained is sufficient and appropriate to<br />
provide a basis for our audit opinion.<br />
70
Opinion<br />
In our opinion, the financial statements for the year ended December 31, 2009,<br />
comply with Swiss law and the company’s articles of incorporation.<br />
> Report on other legal requirements<br />
We confirm that we meet the legal requirements on licensing according to the<br />
Auditor Oversight Act (AOA) and independence (article 728 CO and article 11 AOA)<br />
and that there are no circumstances incompatible with our independence.<br />
In accordance with article 728a paragraph 1 item 3 CO and Swiss Auditing Standard<br />
890, we confirm that an internal control system exists which has been designed<br />
for the preparation of financial statements according to the instructions of<br />
the Board of Directors.<br />
We further confirm that the proposed appropriation of available earnings complies<br />
with Swiss law and the company’s articles of incorporation. We recommend that the<br />
financial statements submitted to you be approved.<br />
PricewaterhouseCoopers AG<br />
Matthias von Moos Hanspeter Abegg<br />
Auditor expert Auditor expert<br />
Auditor in charge<br />
Zurich, March 4, 2010<br />
71<br />
Income Statement and Balance Sheet<br />
Notes<br />
Earnings<br />
Group Auditors
FINANCIAl CAlENDAR/CONTACTS<br />
APRIl 14, 2010<br />
GENERAl MEETING OF SHAREHOlDERS<br />
BUSINESS YEAR RESUlTS 2009<br />
AUGUST 24, 2010<br />
MEDIA AND ANAlYST CONFERENCE<br />
HAlF-YEAR RESUlTS 2010<br />
MARCH 8, 2011<br />
MEDIA AND ANAlYST CONFERENCE<br />
BUSINESS YEAR RESUlTS 2010<br />
APRIl 13, 2011<br />
GENERAl MEETING OF SHAREHOlDERS<br />
BUSINESS YEAR RESUlTS 2010<br />
The <strong>Annual</strong> Report of the Charles Vögele Group is<br />
published in English and German. The original<br />
language is German.<br />
All statements in this report which do not refer to<br />
historical facts are statements related to the future<br />
which offer no guarantee with regard to fu-<br />
72<br />
ture performance; they are subject to risks and<br />
uncertainties including, but not confined to, future<br />
global economic conditions, exchange rates,<br />
legal provisions, market conditions, activities by<br />
competitors and other factors outside the<br />
company’s control.<br />
CONTACTS<br />
PubliSher<br />
Charles Vögele Holding AG<br />
8808 Pfaeffikon SZ<br />
Switzerland<br />
DeSigN<br />
hilda design matters, Zurich<br />
PhOTOgrAPhY<br />
Charles Vögele, Fashion Photos<br />
Andreas Mader, Zell, Pages 10/12/14/38/44<br />
TYPeSeTTiNg AND PriNTiNg<br />
Neidhart + Schön Group, Zurich<br />
CONTACT<br />
Charles Vögele Holding AG<br />
Investor Relations<br />
P.O. Box 58<br />
Gwattstrasse 15<br />
8808 Pfaeffikon SZ<br />
Switzerland<br />
T + 41 55 416 71 00<br />
F + 41 55 410 12 82<br />
investor-relations@charles-voegele.com<br />
www.charles-voegele.com