Retirement Advantage Presentation Piece - Putnam Investments
Retirement Advantage Presentation Piece - Putnam Investments
Retirement Advantage Presentation Piece - Putnam Investments
You also want an ePaper? Increase the reach of your titles
YUMPU automatically turns print PDFs into web optimized ePapers that Google loves.
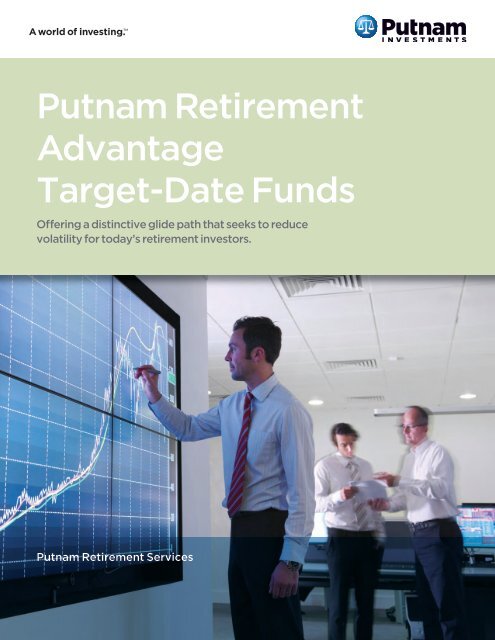
<strong>Putnam</strong> <strong>Retirement</strong><br />
<strong>Advantage</strong><br />
Target-Date Funds<br />
Offering a distinctive glide path that seeks to reduce<br />
volatility for today’s retirement investors.<br />
<strong>Putnam</strong> <strong>Retirement</strong> Services
Volatile markets demand innovative<br />
solutions for retirement savings.<br />
Since the 2008–2009 bear market, volatility has rattled retirement investors’ portfolios. Many retirement funds with aggressive<br />
glide paths were irreparably damaged. Today, this market volatility remains a constant threat. For those near or in retirement,<br />
mitigating risk related to volatility should be a top priority. To pursue your retirement goals in today’s unpredictable market<br />
environment, it is essential to focus on risk-adjusted returns and long-term performance.<br />
We focus on the transition to retirement as a critical moment.<br />
Protecting against losses early in<br />
retirement can pave the way to a more<br />
resilient retirement.<br />
Avoiding big losses early in retirement helps savings<br />
continue to grow even while generating income.<br />
Total income withdrawn: $134,351<br />
Average return: 11.01%<br />
Ending balance: $328,364<br />
$328,364<br />
$100,000<br />
Best return: 37.58%<br />
Worst return: -37.00%<br />
’91 ’92 ’93 ’94 ’95 ’96 ’97 ’98 ’99 ’00 ’01 ’02 ’03 ’04 ’05 ’06 ’07 ’08 ’09 ’10<br />
30% 8% 10% 1% 38% 23% 33% 29% 21% -9% -12% -22% 29% 11% 5% 16% 5% -37% 26% 15%<br />
Returns represented by the S&P 500 Index. Annualized returns are represented in blue. Example assumes a $5,000 withdrawal in year 1, increased by 3% in<br />
each subsequent year to adjust for inflation. This illustration is hypothetical and not indicative of any fund or product. You cannot invest directly in an index.
The 2008–2009 bear market hit the average target-date retirement fund with<br />
steep and dramatic losses, dropping an average of 22.45% that calendar year.<br />
0<br />
Return (%)<br />
-10<br />
-20<br />
-30<br />
A<br />
B<br />
C<br />
Source: Morningstar 2012. Past performance is not indicative of future results.<br />
D<br />
E<br />
F<br />
Average 2010<br />
fund (universe)<br />
Losses early in retirement might<br />
never be recovered.<br />
A large loss at the onset of retirement keeps<br />
the nest egg from growing.<br />
Total income withdrawn: $134,352<br />
Average return: 11.01%<br />
Ending balance: $101,795<br />
$100,000<br />
$101,795<br />
Best return: 37.58%<br />
Worst return: -37.00%<br />
’10 ’09 ’08 ’07 ’06 ’05 ’04 ’03 ’02 ’01 ’00 ’99 ’98 ’97 ’96 ’95 ’94 ’93 ’92 ’91<br />
15% 26% -37% 5% 16% 5% 11% 29% -22% -12% -9% 21% 29% 33% 23% 38% 1% 10% 8% 30%
Four compelling reasons to consider<br />
<strong>Putnam</strong> <strong>Retirement</strong> <strong>Advantage</strong> Funds.<br />
With <strong>Retirement</strong> <strong>Advantage</strong> Funds, you’ll get a distinctive glide path, dynamic portfolio<br />
building blocks, and competitively low expenses under the leadership of our veteran<br />
Global Asset Allocation team.<br />
Whether near or in retirement, losses are more difficult to recoup and the effects can linger for years. <strong>Putnam</strong> <strong>Retirement</strong><br />
<strong>Advantage</strong> Funds are designed to pursue more consistent returns and lower volatility. While traditional thinking has favored<br />
funds that delivered top results in rising markets, today’s heightened volatility has focused attention on funds that are able<br />
to perform in flat or declining markets. <strong>Putnam</strong> <strong>Retirement</strong> <strong>Advantage</strong> Funds are intended to reduce volatility from equity<br />
risk near and in retirement.<br />
1<br />
Our glide path starts out more aggressively before growing more conservative as your<br />
target date nears.<br />
Our distinctive glide-path philosophy seeks to reduce risk, allowing the glide path to steepen and end lower than most<br />
competitors. As retirement approaches, the portfolio shifts from wealth-building equities to more conservative allocations<br />
and absolute return strategies.<br />
We consider a conservative glide path to be a cornerstone of a modern<br />
retirement plan that will withstand today’s volatile markets.<br />
100<br />
Equity allocation five<br />
years before target year<br />
Symbol<br />
Fund<br />
Equity allocation five<br />
years before target year<br />
Net<br />
Net<br />
equity<br />
equity<br />
allocation<br />
allocation<br />
(%)<br />
(%)<br />
75<br />
50<br />
<strong>Putnam</strong> <strong>Retirement</strong><br />
<strong>Advantage</strong> Funds<br />
Fund A glide path<br />
Fund B glide path<br />
Fund C glide path<br />
Fund D glide path<br />
Fund E glide path<br />
31.00%<br />
35.07%<br />
54.64%<br />
60.95%<br />
55.59%<br />
31.23%<br />
25<br />
Fund F glide path<br />
54.43%<br />
2055 2050 2045<br />
2040 2035 2030 2025 2020 2015 Maturity<br />
Target retirement year (the year a a plan participant turns 65)<br />
Chart shown for illustrative purposes only. Source: <strong>Putnam</strong> <strong>Investments</strong>.
2<br />
Balanced<br />
We dynamically allocate across asset classes, not across a portfolio of existing funds.<br />
The portfolios invest in a mix of asset classes, global markets, industry sectors, large and small companies,<br />
and investment styles.<br />
Equity<br />
Balanced<br />
Equity<br />
• A dynamic strategy with the flexibility to respond to changes in macro opportunities<br />
• An investment process that synthesizes top-down, quantitative, and fundamental analysis<br />
• The application of forecasting expertise to active return strategies<br />
Conservative<br />
Income Strategies<br />
Balanced<br />
Equity<br />
Balanced<br />
Equity<br />
Conservative<br />
Balanced<br />
Growth<br />
Conservative<br />
Conservative<br />
U.S. Large-Cap Growth Growth Stocks<br />
U.S. Large Value Stocks<br />
GAA Balanced Portfolio<br />
Seeking total return, the portfolio<br />
strives to achieve results competitive<br />
with the stock<br />
Equity<br />
market, but Conservative with less<br />
volatility.<br />
U.S. Small- and Mid-Cap Growth Stocks<br />
GAA Growth Portfolio<br />
Income Strategies<br />
Seeking capital appreciation, the<br />
portfolio strives to outperform the<br />
stock market over a full market cycle<br />
with less volatility.<br />
GAA Conservative<br />
Portfolio<br />
Seeking total return consistent<br />
with preservation.<br />
Balanced<br />
Growth<br />
Income Strategies Growth<br />
International Bonds<br />
U.S. Money Markets<br />
Conservative<br />
Emerging U.S. Markets Large-Cap Growth Stocks<br />
Income Strategies<br />
Income Strategies<br />
Equity<br />
Income Strategies<br />
International Bonds<br />
GAA Income<br />
Strategies Portfolio<br />
Seeking current income with a<br />
secondary objective of capital<br />
appreciation.<br />
GAA Equity Portfolio<br />
Seeking capital appreciation.<br />
GAA Money Market<br />
Portfolio<br />
Seeking capital preservation.<br />
U.S. Small and MidCap Value Stocks<br />
Commodities U.S. Large Value Stocks<br />
U.S. Money Markets<br />
International Equity Stocks<br />
U.S. large-cap growth stocks<br />
U.S. Investment<br />
Growth<br />
Grade Bonds<br />
U.S. large-cap value stocks<br />
U.S. High Yield Bonds<br />
U.S. small-and mid-cap growth stocks<br />
U.S. small-and mid-cap value stocks<br />
International equity stocks<br />
U.S. investment-grade bonds<br />
U.S. Large-Cap high-yield Growth bonds Stocks<br />
U.S. Large Value Stocks<br />
U.S. Small- and Mid-Cap Growth Stocks<br />
Diversification across multiple U.S. High dimensions<br />
Yield Bonds<br />
U.S. Small and MidCap Value Stocks<br />
International Equity Stocks<br />
Asset class/Strategy<br />
U.S. Large-Cap Investment Growth Grade Bonds Stocks<br />
U.S. All-Cap Large High Yield Value Bonds Equity Stocks<br />
U.S. Small- and Mid-Cap Growth Stocks<br />
U.S. Small-Cap Growth Equity<br />
U.S. Small and MidCap Value Stocks<br />
U.S. Small-Cap Value Equity<br />
International Equity Stocks<br />
U.S. Investment Grade Bonds<br />
International Core Equity<br />
U.S. High Yield Bonds<br />
High-Yield Convertibles<br />
REITs<br />
International U.S. Small- High Yield and Mid-Cap Bonds Growth Stocks<br />
International bonds<br />
REITs U.S. Small and MidCap Value Stocks<br />
U.S. money markets<br />
High Yield International Convertibles Equity Stocks<br />
Emerging-market stocks<br />
Growth<br />
U.S. Investment Large-Cap Growth Grade Bonds Stocks<br />
Commodities<br />
U.S. High Large Yield Value Bonds Stocks<br />
International high-yield bonds<br />
U.S. Small- and Mid-Cap Growth Stocks<br />
REITs<br />
U.S. Small and MidCap Value Stocks<br />
International High-yield Bondsconvertible bonds<br />
International Equity Stocks<br />
U.S. Money Markets<br />
U.S. Investment Grade Bonds<br />
Emerging Markets<br />
Commodities<br />
International High Yield Bonds<br />
International REITs Bonds<br />
U.S. High Money Yield Convertibles<br />
Markets<br />
U.S. Large-Cap Growth Stocks<br />
Emerging Markets<br />
U.S. Large Value Stocks<br />
Commodities<br />
U.S. Small- and Mid-Cap Growth Stocks<br />
International High Yield Bonds<br />
U.S. Small and MidCap Value Stocks<br />
REITs<br />
International Equity Stocks<br />
High Yield Convertibles<br />
U.S. Investment Grade Bonds<br />
U.S. High Yield Bonds<br />
Asset class/Strategy<br />
U.S. FIxed Income<br />
High-Yield Fixed Income<br />
International Fixed Income<br />
GTAA Overlay<br />
Currency Overlay<br />
Index Options Overlay<br />
Emerging Markets<br />
Commodities<br />
International High Yield Bonds<br />
REITs International Bonds<br />
High U.S. Money Yield Convertibles<br />
Markets<br />
Emerging Markets<br />
Commodities<br />
International High Yield Bonds<br />
REITs<br />
High Yield Convertibles<br />
International Bonds<br />
U.S. Money Markets<br />
Emerging Markets<br />
Commodities<br />
International High Yield Bonds<br />
REITs<br />
High Yield Convertibles
3<br />
Our Global Asset Allocation team takes a comprehensive approach —<br />
maintaining full control of every aspect of the funds’ investments.<br />
Unlike a typical fund-of-funds structure where managers invest independently and may choose the same securities,<br />
our veteran team, with its years of experience in multi-asset investing, actively manages all security selections in the<br />
funds — delivering a comprehensive approach that can reduce unintended risk from overlapping holdings.<br />
“<br />
In managing <strong>Putnam</strong> <strong>Retirement</strong> <strong>Advantage</strong> Funds,<br />
we want to deploy any tool we can to help protect<br />
investors from the risk of sharp portfolio drawdowns<br />
at the threshold of retirement.<br />
”<br />
Featured from left to right:<br />
James A. Fetch<br />
(industry since 1994)<br />
Robert J. Kea, CFA<br />
(industry since 1988)<br />
Joshua B. Kutin, CFA<br />
(industry since 1998)<br />
Robert J. Schoen<br />
(industry since 1990)<br />
Jason R. Vaillancourt, CFA<br />
(industry since 1993)
4<br />
Because <strong>Retirement</strong> <strong>Advantage</strong> Funds are collective investment trusts, this lowercost<br />
expense structure is not available to retail investors.<br />
Other cost savings include:<br />
• Expense ratio is the same for all target dates — starting at 50 basis points<br />
• Four classes of units for each fund provide pricing flexibility<br />
• Fees adjust based on plan needs and total assets under management<br />
Class<br />
Management fee<br />
Financial advisor, other marketing<br />
and servicing expenses,<br />
and/or plan administrative costs<br />
Minimum<br />
total plan size<br />
I 50 bps 0 bps $50,000,000<br />
II 60 bps 0 to 10 bps $10,000,000<br />
III 75 bps 0 to 25 bps $5,000,000<br />
IV 90 bps 0 to 40 bps $5,000,000<br />
V 115 bps 0 to 65 bps $3,000,000
A BALANCED APPROACH<br />
Since 1937, when George <strong>Putnam</strong> created a diverse<br />
mix of stocks and bonds in a single, professionally<br />
managed portfolio, <strong>Putnam</strong> has championed the<br />
balanced approach.<br />
A WORLD OF INVESTING<br />
Today, we offer investors a world of equity, fixedincome,<br />
multi-asset, and absolute-return portfolios<br />
to suit a range of financial goals.<br />
A COMMITMENT TO EXCELLENCE<br />
Our portfolio managers seek superior results over time,<br />
backed by original, fundamental research on a global<br />
scale. We believe in the value of experienced financial<br />
advice, in providing exemplary service, and in putting<br />
clients first in all we do.<br />
Your clients should carefully consider the investment<br />
objectives, risks, charges, and expenses of a fund<br />
before investing. To request the offering document<br />
of the fund, call <strong>Putnam</strong> Dealer Marketing Services at<br />
1-800-354-4000. Your clients should read the offering<br />
document carefully before investing.<br />
FOR DEALER USE ONLY — Not for public distribution.<br />
DC368 281843 5/13<br />
One Post Office Square<br />
Boston, MA 02109<br />
1-800-719-9914<br />
putnam.com


