

Monthly Bulletin July 2009 - Banque de France
Monthly Bulletin July 2009 - Banque de France
Monthly Bulletin July 2009 - Banque de France

You also want an ePaper? Increase the reach of your titles
YUMPU automatically turns print PDFs into web optimized ePapers that Google loves.
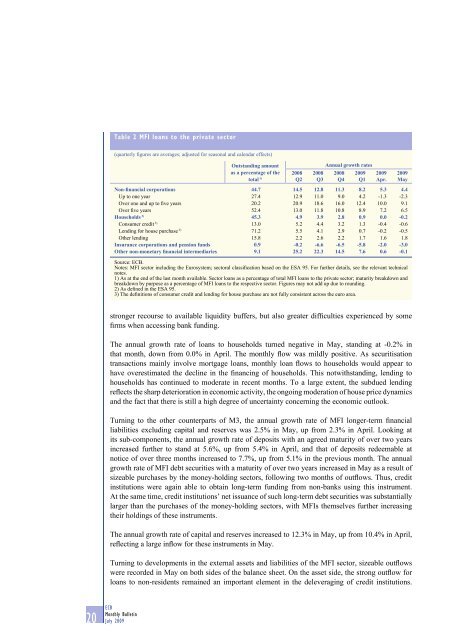
Table 2 MFI loans to the private sector<br />
(quarterly figures are averages; adjusted for seasonal and calendar effects)<br />
Outstanding amount<br />
as a percentage of the<br />
total 1)<br />
Annual growth rates<br />
2008 2008 2008 <strong>2009</strong> <strong>2009</strong> <strong>2009</strong><br />
Q2 Q3 Q4 Q1 Apr. May<br />
Non-financial corporations 44.7 14.5 12.8 11.3 8.2 5.3 4.4<br />
Up to one year 27.4 12.9 11.0 9.0 4.2 -1.3 -2.3<br />
Over one and up to five years 20.2 20.9 18.6 16.0 12.4 10.0 9.1<br />
Over five years 52.4 13.0 11.8 10.8 8.9 7.2 6.5<br />
Households 2) 45.3 4.9 3.9 2.8 0.9 0.0 -0.2<br />
Consumer credit 3) 13.0 5.2 4.4 3.2 1.3 -0.4 -0.6<br />
Lending for house purchase 3) 71.2 5.5 4.1 2.9 0.7 -0.2 -0.5<br />
Other lending 15.8 2.2 2.6 2.2 1.7 1.6 1.8<br />
Insurance corporations and pension funds 0.9 -0.2 -6.6 -6.5 -5.8 -2.0 -3.0<br />
Other non-monetary financial intermediaries 9.1 25.2 22.3 14.5 7.6 0.6 -0.1<br />
Source: ECB.<br />
Notes: MFI sector including the Eurosystem; sectoral classification based on the ESA 95. For further <strong>de</strong>tails, see the relevant technical<br />
notes.<br />
1) As at the end of the last month available. Sector loans as a percentage of total MFI loans to the private sector; maturity breakdown and<br />
breakdown by purpose as a percentage of MFI loans to the respective sector. Figures may not add up due to rounding.<br />
2) As <strong>de</strong>fined in the ESA 95.<br />
3) The <strong>de</strong>finitions of consumer credit and lending for house purchase are not fully consistent across the euro area.<br />
stronger recourse to available liquidity buffers, but also greater difficulties experienced by some<br />
firms when accessing bank funding.<br />
The annual growth rate of loans to households turned negative in May, standing at -0.2% in<br />
that month, down from 0.0% in April. The monthly flow was mildly positive. As securitisation<br />
transactions mainly involve mortgage loans, monthly loan flows to households would appear to<br />
have overestimated the <strong>de</strong>cline in the financing of households. This notwithstanding, lending to<br />
households has continued to mo<strong>de</strong>rate in recent months. To a large extent, the subdued lending<br />
reflects the sharp <strong>de</strong>terioration in economic activity, the ongoing mo<strong>de</strong>ration of house price dynamics<br />
and the fact that there is still a high <strong>de</strong>gree of uncertainty concerning the economic outlook.<br />
Turning to the other counterparts of M3, the annual growth rate of MFI longer-term financial<br />
liabilities excluding capital and reserves was 2.5% in May, up from 2.3% in April. Looking at<br />
its sub-components, the annual growth rate of <strong>de</strong>posits with an agreed maturity of over two years<br />
increased further to stand at 5.6%, up from 5.4% in April, and that of <strong>de</strong>posits re<strong>de</strong>emable at<br />
notice of over three months increased to 7.7%, up from 5.1% in the previous month. The annual<br />
growth rate of MFI <strong>de</strong>bt securities with a maturity of over two years increased in May as a result of<br />
sizeable purchases by the money-holding sectors, following two months of outflows. Thus, credit<br />
institutions were again able to obtain long-term funding from non-banks using this instrument.<br />
At the same time, credit institutions’ net issuance of such long-term <strong>de</strong>bt securities was substantially<br />
larger than the purchases of the money-holding sectors, with MFIs themselves further increasing<br />
their holdings of these instruments.<br />
The annual growth rate of capital and reserves increased to 12.3% in May, up from 10.4% in April,<br />
reflecting a large inflow for these instruments in May.<br />
Turning to <strong>de</strong>velopments in the external assets and liabilities of the MFI sector, sizeable outflows<br />
were recor<strong>de</strong>d in May on both si<strong>de</strong>s of the balance sheet. On the asset si<strong>de</strong>, the strong outflow for<br />
loans to non-resi<strong>de</strong>nts remained an important element in the <strong>de</strong>leveraging of credit institutions.<br />
20 ECB<br />
<strong>Monthly</strong> <strong>Bulletin</strong><br />
<strong>July</strong> <strong>2009</strong>


