10/24/12 Powerpoint Presentation (PDF Download) - Van Etten ...
10/24/12 Powerpoint Presentation (PDF Download) - Van Etten ...
10/24/12 Powerpoint Presentation (PDF Download) - Van Etten ...

Create successful ePaper yourself
Turn your PDF publications into a flip-book with our unique Google optimized e-Paper software.
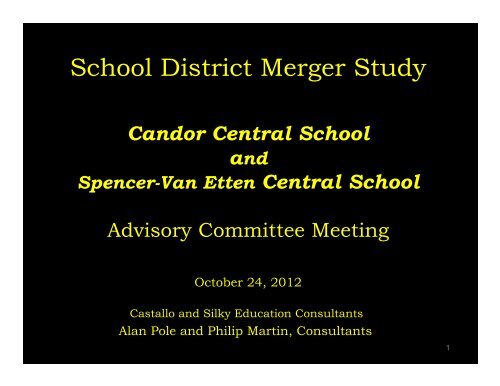
School District Merger Study<br />
Candor Central School<br />
and<br />
Spencer-<strong>Van</strong> <strong>Etten</strong> Central School<br />
Advisory Committee Meeting<br />
October <strong>24</strong>, 20<strong>12</strong><br />
Castallo and Silky Education Consultants<br />
Alan Pole and Philip Martin, Consultants<br />
1
Why Consider Reorganization<br />
Increase course offerings for students<br />
Upgrade facilities and equipment<br />
More cost effective administrative<br />
structure<br />
Eliminate duplication of facilities,<br />
equipment, and staff<br />
Consolidate and coordinate support<br />
functions<br />
Reduce taxes<br />
2
Why Reorganization May be<br />
Difficult<br />
Fear of losing local identity<br />
Perception the communities are<br />
incompatible<br />
Uncertainty over board representation<br />
Less personal attention for students<br />
Busing time for some students may be<br />
increased<br />
Fear of losing job security by employees<br />
Natural resistance to change<br />
3
The Merger Study Process Begins<br />
Both Boards of Education have<br />
passed a resolution to do a<br />
merger study with each other<br />
Advisory committee has been<br />
appointed<br />
Consulting firm has been<br />
engaged to conduct the study<br />
4
Purpose of the Merger Study<br />
To paint a clear picture of each<br />
district so that its neighbor has a<br />
good understanding of the assets and<br />
liabilities it brings to the merger, and<br />
To develop a set of recommendations<br />
for the new board of education to<br />
consider regarding district<br />
organization, staffing, finances,<br />
transportation, and educational<br />
programming should a merger occur.<br />
5
The Merger Study<br />
Provides information for school district<br />
officials, the communities, and the<br />
Commissioner on enrollments, staffing,<br />
program, transportation, facilities,<br />
finances, etc.<br />
Facilitated by consultants<br />
Overseen by school/community advisory<br />
committee of 14-18 people<br />
Report is the responsibility of the consultants<br />
Both Boards of Education decide how to<br />
proceed with the final study<br />
6
Parameters for the Study<br />
Scope of the Study: Use data to provide objective information on:<br />
-Adding classes/reducing staff<br />
-Creating building configurations by grade level<br />
-Adding bus runs/drivers<br />
-Calculating potential staffing savings<br />
-Assessing financial impact of the merger<br />
Outside the Study Scope: Make decisions for the merged district:<br />
-Name, colors, or mascot for the new district<br />
-Identifying classes to be added/staff reduced<br />
-Developing bus routes with stops<br />
-Deciding when staff savings might be realized<br />
-Deciding how financial decisions will be made<br />
7
The School/Community Advisory Committee<br />
8 people from each school community<br />
4 community members<br />
2 teachers<br />
1 building administrator<br />
1 support staff<br />
Superintendents serve as resources to the<br />
committee<br />
Function is to advise the Boards and the<br />
consultants, communicate with the<br />
public, and prepare informative<br />
materials<br />
8
Expectations of Committee Members<br />
Attend all committee meetings<br />
Freely express their points of view<br />
Be a key communicator with<br />
stakeholder groups<br />
Be respectful of the committee and<br />
and the study process<br />
Be a positive contributing member in<br />
other related committee activities<br />
9
The Consultants<br />
Bring an outside, unbiased perspective<br />
Have no local stake in the outcome<br />
Will conduct the study in a fair manner<br />
Will ensure that the process is open<br />
Will maintain contact with the State<br />
Education Department and the District<br />
Superintendents<br />
Will produce meeting notes after each<br />
committee meeting<br />
Will be responsible for the final report<br />
<strong>10</strong>
Recommendations in the Report<br />
Will benefit student learning<br />
Will be sensitive to the unique cultural<br />
contexts of the school districts<br />
Will be independent of special interest<br />
groups<br />
Will be educationally sound<br />
Will be fiscally responsible and realistic<br />
Will not recommend whether or not a<br />
merger should occur<br />
11
Common Reactions About the Study Process<br />
The consultants are here to sell a merger<br />
The consultants favor one district…..or the<br />
other<br />
This is all happening too quickly<br />
There is not enough information on which<br />
to make a decision<br />
The advisory committee meetings are too<br />
long…..or too short<br />
<strong>12</strong>
Committee Meeting Schedule<br />
(6:30 meetings; 5:45 tours)<br />
• October <strong>24</strong>-Overview & Enrollments (SVE)<br />
• November 28-Program (Candor)<br />
• December <strong>12</strong>-Facilities (SVE)<br />
• January 16-Transportation (Candor)<br />
• February 27-Staffing (SVE)<br />
• March 27-Finances (Candor)<br />
• April <strong>24</strong>-Review Draft Report (SVE)<br />
• May 22-If Necessary (Candor)<br />
13
Time Line for the Study/Merger<br />
(Draft)<br />
September 20<strong>12</strong>-Boards meet to begin study<br />
May 2013-Study completed<br />
June 2013-Study reviewed by S.E.D.<br />
July 2013-Study presented to Boards<br />
August-September 2013-Public information and<br />
discussion<br />
October 2013-Boards decide to go forth<br />
November 2013-Advisory referendum<br />
January 2014-Final referendum<br />
April 2014-Vote for new Board members<br />
May 2014-Budget vote<br />
July 1, 2014-New district begins operation<br />
14
Informing the Public<br />
District newsletters<br />
Newspaper articles<br />
District web sites<br />
Notes from advisory committee meetings<br />
PowerPoint presentations from advisory<br />
committee meetings<br />
Open advisory committee meetings-for<br />
observation and limited comment only<br />
Joint press release announcing the study<br />
and the advisory committee<br />
15
Questions<br />
16
Live Births<br />
Source: NYS Department of Health<br />
Calendar Year Candor Spencer-<strong>Van</strong> <strong>Etten</strong><br />
2002 62 66<br />
2003 56 62<br />
2004 60 66<br />
2005 52 54<br />
2006 54 69<br />
2007 50 54<br />
2008 52 57<br />
2009 49 37<br />
20<strong>10</strong> 47 63<br />
2011 44 54
Table 2.2<br />
Candor Enrollment History and Projection<br />
Grade 2002<br />
-03<br />
2007<br />
-08<br />
2008<br />
-09<br />
2009<br />
-<strong>10</strong><br />
20<strong>10</strong><br />
-11<br />
2011<br />
-<strong>12</strong><br />
20<strong>12</strong><br />
-13<br />
2013<br />
-14<br />
2014<br />
-15<br />
2015<br />
-16<br />
2016<br />
-17<br />
2017<br />
-18<br />
2018<br />
-19<br />
2019<br />
-20<br />
Birth Data 62 56 60 52 54 50 52 49 47 44<br />
Pre-K<br />
K 75 64 55 80 68 58 57 62 59 56 63 57<br />
1 61 67 68 57 73 66 58 57 62 59 56 63 57<br />
2 57 54 62 59 51 71 59 53 52 56 54 51 57 52<br />
3 71 59 53 60 60 54 70 59 53 52 56 54 51 57<br />
4 66 73 64 51 56 58 56 70 59 53 52 56 54 51<br />
5 59 68 75 58 50 57 58 55 69 58 52 51 55 53<br />
6 93 55 74 79 64 54 59 62 59 74 62 56 55 59<br />
7 74 54 54 53 83 61 57 56 59 56 70 59 53 52<br />
8 79 64 51 52 69 86 59 59 58 61 58 73 61 55<br />
9 79 67 63 63 55 65 83 61 61 60 63 60 76 63<br />
<strong>10</strong> 91 70 65 65 53 53 63 80 59 59 58 60 58 73<br />
11 77 92 62 61 59 54 50 59 75 55 55 55 56 55<br />
<strong>12</strong> 83 70 88 88 69 56 49 54 63 80 59 59 59 60<br />
Ungraded 0 0 6 5 9 4 4 4 4 4 4<br />
Elementary<br />
Ungraded 8 0 0 0 0 0 4 4 4 4 4 4<br />
Secondary<br />
Total 973 857 834 832 815 802 786 795 796 787 766 762<br />
K-<strong>12</strong><br />
Total 482 440 451 450 427 427 421 422 417 4<strong>12</strong> 399 392<br />
K-6<br />
Total<br />
7-<strong>12</strong><br />
483 417 383 382 388 375 361 373 379 375 367 370 367 362
Table2.3<br />
Spencer-<strong>Van</strong> <strong>Etten</strong> Enrollment History and Projection<br />
Grade 2002<br />
-03<br />
2007<br />
-08<br />
2008<br />
-09<br />
2009<br />
-<strong>10</strong><br />
20<strong>10</strong><br />
-11<br />
2011<br />
-<strong>12</strong><br />
20<strong>12</strong><br />
-13<br />
2013<br />
-14<br />
2014<br />
-15<br />
2015<br />
-16<br />
2016<br />
-17<br />
2017<br />
-18<br />
2018<br />
-19<br />
2019<br />
-20<br />
Births 66 62 66 54 69 54 57 37 63 54<br />
Pre-K 32 50 50 50 42 55<br />
K 73 69 57 64 63 90 58 62 40 69 59 58<br />
1 90 88 70 65 68 55 84 58 62 40 69 59 58<br />
2 77 70 69 70 75 76 60 87 60 64 41 71 61 60<br />
3 93 62 85 69 69 73 81 63 91 63 67 43 75 64<br />
4 81 67 69 81 69 76 77 84 66 95 66 70 45 78<br />
5 91 69 61 71 79 71 81 77 84 66 95 66 70 45<br />
6 89 89 69 59 69 85 71 81 77 84 66 95 66 70<br />
7 91 79 83 67 60 70 85 70 80 76 83 65 94 65<br />
8 94 88 76 85 66 62 71 85 70 80 76 83 65 94<br />
9 117 94 84 80 93 68 60 72 87 71 82 78 85 66<br />
<strong>10</strong> 96 85 91 88 81 95 73 61 73 89 72 84 80 87<br />
11 72 89 83 93 81 70 88 69 57 69 84 68 79 75<br />
<strong>12</strong> 79 81 84 77 96 75 74 86 68 56 68 82 67 77<br />
Ungraded<br />
Elementary<br />
Ungraded 25<br />
Secondary<br />
Total 1168 <strong>10</strong>30 981 969 969 966 963 955 915 922 928 922<br />
K-<strong>12</strong><br />
Total 594 514 480 479 492 526 5<strong>12</strong> 5<strong>12</strong> 480 481 463 462<br />
K-6<br />
Total<br />
7-<strong>12</strong><br />
549 516 501 490 477 440 451 443 435 441 465 460 470 464
Table 2.4<br />
Combined Enrollment Projections 2013-14 to 2019-20<br />
School Year<br />
Grade 20<strong>12</strong>-<br />
13<br />
2013-<br />
14<br />
2014-<br />
15<br />
2015-<br />
16<br />
2016-<br />
17<br />
2017-<br />
18<br />
2018<br />
-19<br />
2019<br />
-20<br />
K 115 1<strong>24</strong> 99 <strong>12</strong>5 <strong>12</strong>2 115<br />
1 142 115 1<strong>24</strong> 99 <strong>12</strong>5 <strong>12</strong>2 115<br />
2 119 140 1<strong>12</strong> <strong>12</strong>0 95 <strong>12</strong>2 118 1<strong>12</strong><br />
3 151 <strong>12</strong>2 144 115 <strong>12</strong>3 97 <strong>12</strong>6 <strong>12</strong>1<br />
4 133 154 <strong>12</strong>5 148 118 <strong>12</strong>6 99 <strong>12</strong>9<br />
5 139 132 153 1<strong>24</strong> 147 117 <strong>12</strong>5 98<br />
6 130 143 136 158 <strong>12</strong>8 151 <strong>12</strong>1 <strong>12</strong>9<br />
7 142 <strong>12</strong>6 139 132 153 1<strong>24</strong> 147 117<br />
8 130 144 <strong>12</strong>8 141 134 156 <strong>12</strong>6 149<br />
9 143 133 148 131 145 138 161 <strong>12</strong>9<br />
<strong>10</strong> 136 141 132 148 130 144 138 160<br />
11 138 <strong>12</strong>8 132 1<strong>24</strong> 139 <strong>12</strong>3 135 130<br />
<strong>12</strong> <strong>12</strong>3 140 131 136 <strong>12</strong>7 141 <strong>12</strong>6 137<br />
Ungraded 8 8 8 8 8 8<br />
Total 1,749 1,750 1,711 1,709 1,694 1,684<br />
K-6 933 934 897 893 862 854<br />
7-<strong>12</strong> 8<strong>12</strong> 816 814 816 832 830 837 826
Table 2.5<br />
Number of Home Schooled Students from 2008-09 to 20<strong>12</strong>-13<br />
School Year Candor Spencer-<strong>Van</strong> <strong>Etten</strong><br />
2008-09 25 28<br />
2009-<strong>10</strong> 29 36<br />
20<strong>10</strong>-11 33 37<br />
2011-<strong>12</strong> 27 35<br />
20<strong>12</strong>-13 28 41<br />
Average 28.4 35.4
Table 2.7<br />
Students Attending Non-Public Schools<br />
School Year Candor Spencer-<strong>Van</strong> <strong>Etten</strong><br />
2008-09 17 43<br />
2009-<strong>10</strong> 15 76<br />
20<strong>10</strong>-11 23 76<br />
2011-<strong>12</strong> 26 72<br />
20<strong>12</strong>-13 16 68<br />
The Non-Public Schools include North Spencer<br />
Christian Academy, Tioga Center Christian<br />
School, Horseheads Christian School, St.<br />
Patrick’s School (Owego), Montessori School<br />
(Ithaca), and Zion Lutheran School (Owego).
Students Attending Charter Schools<br />
This year 4 Candor and 8 Spencer-<strong>Van</strong> <strong>Etten</strong><br />
students attend the New Roots Charter School<br />
in Ithaca.
Questions<br />
<strong>24</strong>