Part III
Part III
Part III

You also want an ePaper? Increase the reach of your titles
YUMPU automatically turns print PDFs into web optimized ePapers that Google loves.
Hedging Programs<br />
in a Turbulent Market<br />
May 21 2008<br />
Peter Sun, CFA, FSA, MAAA<br />
Milliman, Inc
Agenda<br />
1. Overview of Capital Market Conditions<br />
2. Analysis of Hedging Program Performances<br />
3. Illustrative Hedging Effectiveness Example<br />
4. Conclusion and Discussion<br />
2
3<br />
Overview of Capital Market Conditions
We Have Experienced a Tough Time!<br />
• “Subprime” was the word of the year for 2007!<br />
High profile write-downs at well known financial institutions<br />
The crisis is global in nature – US, Europe, Asia<br />
The crisis of confidence started with subprime and expanded to credit<br />
products and their liquidity<br />
The crisis is characterized by<br />
- Equity market drop<br />
- Reduction of interest rates<br />
- Sudden increase of both realized and implied volatility<br />
4
Volatility is the Key<br />
15 separate days since July of 2007 when the daily volatility falls in<br />
the 2% tail of the highest volatility days the U.S. has experienced<br />
since going off of the gold standard<br />
Weekly realized volatility is not extreme<br />
US government intervention and foreign infusion of capital has<br />
prevented the market from a melt down<br />
The past several months is far from dooms-day scenarios<br />
5
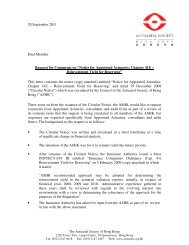
S&P 500 Volatility<br />
S&P Weekly Realized Volatility<br />
Annualized Realized Volatility<br />
40.00%<br />
35.00%<br />
30.00%<br />
25.00%<br />
20.00%<br />
15.00%<br />
10.00%<br />
5.00%<br />
Experienced volatility has been low in the past 5 years.<br />
0.00%<br />
4/1998 4/1999 4/2000 4/2001 4/2002 4/2003 4/2004 4/2005 4/2006 4/2007 4/2008<br />
<br />
The low volatilities experienced in the past 5 years make the recent market conditions appear<br />
severe<br />
6
7<br />
Analysis of Hedging Program Performances
Good News: Hedging Programs have Generally<br />
Performed as Anticipated<br />
Most well designed hedging programs have to withstand much more<br />
severe scenarios<br />
– September 11 th<br />
– Black Monday<br />
– Japan bubble burst<br />
– Other stress scenarios<br />
The turbulence experienced in the past several months is severe, but<br />
not nearly as extreme as the stress scenarios<br />
Hedging will never be perfect, but they have been generally effective<br />
8
Profile of Survey <strong>Part</strong>icipants<br />
<br />
16 respondents in the US, Europe and Asia<br />
<br />
Direct writers and reinsurers<br />
<br />
Over $468 billion of asset under management<br />
<br />
Most have foreign exposure<br />
Respondent Size<br />
Under $1 billion<br />
18%<br />
$1 to 10 billion<br />
12%<br />
Above $10 billion<br />
68%<br />
9
Hedge Program Objective<br />
Hedge programs could have conflicting objectives<br />
Selection of hedge program objectives reflects management risk<br />
preference and appetite<br />
Trade-off of objectives are often needed<br />
Most respondents do not plan to change hedge objectives<br />
There is a movement towards fair value hedge objectives<br />
Distrubtion of Hedge Objectives<br />
source: Milliman survey<br />
Combination<br />
25%<br />
Statutory cash<br />
value 6.25%<br />
Economical<br />
37.5%<br />
IFRS 6.25%<br />
US GAAP 25%<br />
10
Hedge Strategies<br />
Almost all use a dynamic hedging strategy<br />
More sophisticated companies opportunistically use a combination of<br />
strategies<br />
Almost all companies incorporate a delta hedging strategy.<br />
Some also layer on rho and vega hedging strategies<br />
69% of respondents do not hedge all exposures<br />
Combination 25%<br />
Distribution of Hedge Strategies<br />
source: Milliman survery<br />
VAR 6.25%<br />
Static 6.25%<br />
Dynamic 62.5%<br />
11
Hedge Performance<br />
Most hedge programs performed as expected<br />
88% of respondents experiencing gains or unanticipated losses of<br />
less than 10 basis points (bps) of account value<br />
Only 2 respondents have unanticipated loss of over 30bps of AV<br />
Results are comforting and not surprising given the capital market<br />
experience<br />
Loss between 30<br />
and 40bps of AV<br />
6%<br />
Loss less than<br />
10bps of AV 18%<br />
Loss more than<br />
50bps of AV 6%<br />
Gain 12%<br />
No gain or loss 56%<br />
12
Hedge Performance<br />
Reasons for positive deviation are mostly due to positive basis<br />
mismatch<br />
Reasons for negative deviation are varied<br />
– Basis mismatch<br />
– Realized volatility<br />
– Cross-Greek movements<br />
– Operational hedging issues due to increased cost of OTC hedging<br />
instruments or lack of capacity<br />
Most hedge programs did not experience operational issues<br />
13<br />
– There is report of structured derivatives becoming less available
Future Directions<br />
Most respondents expect the recent market down turn to negatively<br />
impact VA sale<br />
– The availability of guarantees are expected to reduce the impact<br />
– Some respondents even expect increased sales due to the guarantees<br />
Operational efficiency improvement<br />
– Enhanced vega/rho hedging<br />
– Increased frequency of in-force updates<br />
– Expansion of hedging coverage<br />
– Reductions in derivative execution costs through increased use of<br />
exchange-traded instruments<br />
– Better fund selection process<br />
14
Illustrative Hedging Effectiveness Example<br />
15
Description of Block<br />
$ 1 billion of GMWB<br />
Projected over the past 8-month market conditions<br />
Fair value accounting under US FAS133<br />
Hedging strategies tested<br />
– No hedging<br />
– Delta<br />
– Delta, rho<br />
– Delta, rho, and vega<br />
16
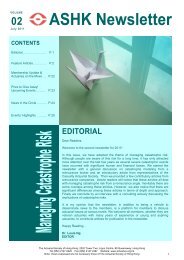
Delta Only Hedging<br />
$15,000,000<br />
Hedge Program Net P&L - No Hedging vs. Delta Hedging<br />
$10,000,000<br />
$5,000,000<br />
$-<br />
7/13/07<br />
7/27/07<br />
8/10/07<br />
8/24/07<br />
9/7/07<br />
9/21/07<br />
10/5/07<br />
10/19/07<br />
11/2/07<br />
11/16/07<br />
11/30/07<br />
12/14/07<br />
12/28/07<br />
1/11/08<br />
1/25/08<br />
2/8/08<br />
2/22/08<br />
3/7/08<br />
P&L<br />
$(5,000,000)<br />
$(10,000,000)<br />
$(15,000,000)<br />
No Hedging Delta<br />
It is clear the reduction in P&L volatility is quite limited.<br />
17
3/7/08<br />
2/22/08<br />
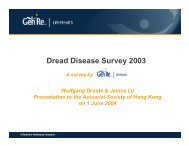
Delta/Rho Hedging<br />
$15,000,000<br />
Hedge Program Net P&L - No Hedging vs. Delta-Rho Hedging<br />
$10,000,000<br />
$5,000,000<br />
$-<br />
7/13/07<br />
7/27/07<br />
8/10/07<br />
8/24/07<br />
9/7/07<br />
9/21/07<br />
10/5/07<br />
10/19/07<br />
11/2/07<br />
11/16/07<br />
11/30/07<br />
12/14/07<br />
12/28/07<br />
1/11/08<br />
1/25/08<br />
2/8/08<br />
P&L<br />
$(5,000,000)<br />
$(10,000,000)<br />
$(15,000,000)<br />
No Hedging Delta-Rho<br />
This is an improvement over delta only strategy.<br />
18
3/7/08<br />
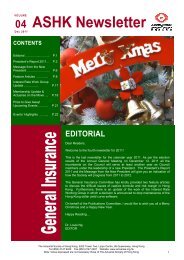
Delta/Vega/Rho Strategy<br />
$15,000,000<br />
Hedge Program Net P&L - No Hedging vs. Delta-Rho-Vega Hedging<br />
$10,000,000<br />
$5,000,000<br />
$-<br />
7/13/07<br />
7/27/07<br />
8/10/07<br />
8/24/07<br />
9/7/07<br />
9/21/07<br />
10/5/07<br />
10/19/07<br />
11/2/07<br />
11/16/07<br />
11/30/07<br />
12/14/07<br />
12/28/07<br />
1/11/08<br />
1/25/08<br />
2/8/08<br />
P&L<br />
2/22/08<br />
$(5,000,000)<br />
$(10,000,000)<br />
$(15,000,000)<br />
No Hedging Delta-Rho-Vega<br />
Significant reduction in P&L volatility<br />
19
Comparison of Results<br />
Weekly P&L 2007-07-13 to 2008-03-14<br />
Total Standard Deviation<br />
No Hedging $ (49,385,593) $<br />
4,578,505<br />
Delta $ (37,317,437) $<br />
3,957,001<br />
Delta-Rho $ (13,828,580) $<br />
2,015,162<br />
Delta-Rho-Vega $ (9,177,679) $<br />
1,122,716<br />
20
Selection of a Hedging Strategy<br />
More sophisticated strategies can offer improved protection<br />
More sophisticated strategies also tends to be more expensive<br />
Cost/benefit analysis is needed<br />
– Portfolio size<br />
– Accounting practice<br />
Must withstand stress scenarios with tolerable deviations<br />
21
Contacts<br />
Milliman Ltd.<br />
Unit 3904 AIA Tower,<br />
North Point, Hong Kong<br />
Tel. 852-2147-9678<br />
wing.wong@milliman.com<br />
peter.sun@milliman.com<br />
david.wang@milliman.com<br />
www.milliman.com<br />
22