Why focus on speed? - libdoc.who.int - World Health Organization
Why focus on speed? - libdoc.who.int - World Health Organization
Why focus on speed? - libdoc.who.int - World Health Organization

Create successful ePaper yourself
Turn your PDF publications into a flip-book with our unique Google optimized e-Paper software.
1<br />
<str<strong>on</strong>g>Why</str<strong>on</strong>g> <str<strong>on</strong>g>focus</str<strong>on</strong>g> <strong>on</strong> <strong>speed</strong>
1<str<strong>on</strong>g>Why</str<strong>on</strong>g> <str<strong>on</strong>g>focus</str<strong>on</strong>g> <strong>on</strong> <strong>speed</strong><br />
1.1 Road traffic crashes and injury involving <strong>speed</strong> .. . . 3<br />
1.1.1 Speed, energy transfer and injury .. . . . . . . . . . . . . . . . . . . 3<br />
1.1.2 How does <strong>speed</strong> affect road traffic collisi<strong>on</strong>s and injury . . 6<br />
1.1.3 What factors c<strong>on</strong>tribute to <strong>speed</strong>ing.. . . . . . . . . . . . . . . 10<br />
1.2 What is <strong>speed</strong> management.. . . . . . . . . . . . . . . . . . . 11<br />
1.2.1 Aims of <strong>speed</strong> management .. . . . . . . . . . . . . . . . . . . . . . 11<br />
1.2.2 Setting <strong>speed</strong> limits..............................13<br />
1.2.3 Safe systems and the role of <strong>speed</strong>..................14<br />
1.2.4 Benefits of <strong>speed</strong> management .. . . . . . . . . . . . . . . . . . . 17<br />
Summary.......................................... 19<br />
References .. . . . . . . . . . . . . . . . . . . . . . . . . . . . . . . . . . . . . . . 20
Speed management: a road safety manual<br />
This module provides background informati<strong>on</strong> <strong>on</strong> why <strong>speed</strong> is a risk factor in<br />
road traffic crashes and injury, and the importance of tackling it with a range of<br />
different measures. In order to successfully promote, design and implement a <strong>speed</strong><br />
management programme, it is important to understand the role of <strong>speed</strong> in road<br />
traffic crashes, and the relati<strong>on</strong>ship between <strong>speed</strong> and the severity of those crashes.<br />
Such informati<strong>on</strong> is important in persuading political leaders, stakeholders and the<br />
public to support a <strong>speed</strong> management programme.<br />
The module is divided <strong>int</strong>o two secti<strong>on</strong>s:<br />
1.1 Road traffic crashes and injury involving <strong>speed</strong>: This secti<strong>on</strong> describes the<br />
nature of crashes and <strong>speed</strong> related injury. It dem<strong>on</strong>strates how unsafe motor vehicle<br />
<strong>speed</strong>s can increase both the risk of a collisi<strong>on</strong> and the severity of injury to crash<br />
victims. The impact of <strong>speed</strong> <strong>on</strong> vulnerable road users, particularly in developing<br />
countries, is described. Reas<strong>on</strong>s why people drive at unsafe <strong>speed</strong>s are discussed.<br />
1.2 What is <strong>speed</strong> management This secti<strong>on</strong> discusses the definiti<strong>on</strong> of <strong>speed</strong><br />
management – an active approach that requires (or persuades) drivers to adopt<br />
<strong>speed</strong>s that offer mobility without compromising safety. The Safe-system approach<br />
aims to achieve a road transport system that anticipates and allows for human error,<br />
while minimising the risk of death or serious injury. Benefits of <strong>speed</strong> management<br />
are discussed, and the impact of even small reducti<strong>on</strong>s in <strong>speed</strong> <strong>on</strong> safety is described.<br />
This manual does not suggest that higher <strong>speed</strong>s cannot be beneficial. Shorter journey<br />
times can provide ec<strong>on</strong>omic benefits and increased mobility. But policy-makers<br />
must trade these benefits against the increased costs of death and injury that might<br />
occur. This manual presents the road safety case for <strong>speed</strong> management, and offers<br />
practical advice <strong>on</strong> how to manage <strong>speed</strong>s in order to deliver road safety benefits.<br />
This manual does not c<strong>on</strong>sider <strong>speed</strong> related noise or air polluti<strong>on</strong>, or energy<br />
c<strong>on</strong>sumpti<strong>on</strong>. Although these issues are important, they are bey<strong>on</strong>d the scope of<br />
this manual.<br />
1 | <str<strong>on</strong>g>Why</str<strong>on</strong>g> <str<strong>on</strong>g>focus</str<strong>on</strong>g> <strong>on</strong> <strong>speed</strong><br />
1.1 Road traffic crashes and injury involving <strong>speed</strong><br />
1.1.1 Speed, energy transfer and injury<br />
Speed has been identified as a key risk factor in road traffic injuries, influencing both<br />
the risk of road traffic crashes and the severity of the injuries that result from them<br />
(1, 2, 3). Higher <strong>speed</strong>s lead to a greater risk of a crash and a greater probability of<br />
serious injury if <strong>on</strong>e occurs. This is because, as <strong>speed</strong> increases, so does the distance<br />
travelled during the driver’s reacti<strong>on</strong> time and the distance needed to stop. Also, at<br />
<strong>speed</strong>, the effects of drivers’ errors are magnified. In a crash, the higher the <strong>speed</strong><br />
3
Module 1: <str<strong>on</strong>g>Why</str<strong>on</strong>g> <str<strong>on</strong>g>focus</str<strong>on</strong>g> <strong>on</strong> <strong>speed</strong><br />
the greater the amount of mechanical (kinetic) energy that must be absorbed by the<br />
impact. Hence, there is more likelihood of serious injury.<br />
According to research (1, 2), harmful injury is the result of ‘energy <strong>int</strong>erchange’.<br />
During a collisi<strong>on</strong>, injury results from the transfer of energy to the human body in<br />
amounts and at rates that damage cellular structure, tissues, blood vessels and other<br />
bodily structures. This includes kinetic energy, for example when a motor vehicle<br />
user’s head strikes the windshield during a crash. Of the various forms of energy –<br />
kinetic, thermal, chemical, electrical and radiati<strong>on</strong> – kinetic energy transfer is the<br />
biggest c<strong>on</strong>tributor to injury. It is useful for road traffic injury preventi<strong>on</strong> researchers<br />
and practiti<strong>on</strong>ers to understand the biomechanics of kinetic energy injuries. This will<br />
help them develop measures that will limit the generati<strong>on</strong>, distributi<strong>on</strong>, transfer and<br />
effect of this energy during a road traffic collisi<strong>on</strong> (2).<br />
Regardless of whether the kinetic energy is generated by a motor vehicle crash,<br />
a gunshot or a fall, the force to which human tissue is subjected <strong>on</strong> impact is the<br />
product of the mass and velocity involved. The kinetic energy to be absorbed equals<br />
<strong>on</strong>e half of mass multiplied by the square of velocity – illustrating that the effect of<br />
velocity is greatly enhanced as velocity increases. The level of damage to the body<br />
will depend <strong>on</strong> the shape and rigidity of the colliding surface or object, but velocity<br />
usually plays the most critical role (4).<br />
In a crash, it is physically impossible for any occupant to securely hold an<br />
unrestrained object, such as a child. In a collisi<strong>on</strong> of just 50 km/h, the child’s weight<br />
will effectively increase by 20 times and a 5 kg baby will appear to weigh 100 kg<br />
within a split sec<strong>on</strong>d. Source: (5).<br />
Vulnerable road users such as pedestrians,<br />
cyclists, moped riders and motorcyclists<br />
have a high risk of severe or fatal injury<br />
when motor vehicles collide with<br />
them. This is because they are often<br />
completely unprotected or, in the case of a<br />
motorcyclist, have very limited protecti<strong>on</strong>.<br />
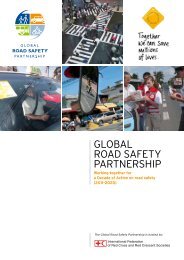
The probability that a pedestrian will be<br />
killed if hit by a motor vehicle increases<br />
dramatically with <strong>speed</strong>. In Figure 1.1 the<br />
probability of a fatal injury for a pedestrian<br />
colliding with a vehicle is illustrated.<br />
The research indicates that while most<br />
vulnerable (unprotected) road users survive if hit by a car travelling 30 km/h, the<br />
majority are killed if hit by a car travelling at 50 km/h (6).<br />
4
Speed management: a road safety manual<br />
Figure 1.1 Probability of fatal injury for a pedestrian colliding with a vehicle<br />
1 | <str<strong>on</strong>g>Why</str<strong>on</strong>g> <str<strong>on</strong>g>focus</str<strong>on</strong>g> <strong>on</strong> <strong>speed</strong><br />
100%<br />
80%<br />
60%<br />
© HJ Sommer, GTZ, 2003<br />
40%<br />
20%<br />
0%<br />
0 10 20 30 40 50 60 70<br />
Impact <strong>speed</strong> (km/h)<br />
Source: (6)<br />
In the majority of serious and fatal crashes, injuries are caused because loads and<br />
accelerati<strong>on</strong>s – exceeding those that the body can tolerate – are applied by some<br />
part of the car (7). The human tolerance to injury by a car will be exceeded if the<br />
vehicle is travelling at more than 30 km/h. Pedestrians, as illustrated above, incur a<br />
risk of about 80% of being killed at a collisi<strong>on</strong> <strong>speed</strong> of 50 km/h. For car occupants,<br />
wearing seat-belts and using well-designed cars generally can provide protecti<strong>on</strong> to<br />
a maximum of 70 km/h in fr<strong>on</strong>tal impacts, and 50 km/h in most side impacts (8).<br />
Higher <strong>speed</strong>s could be tolerated if the <strong>int</strong>erface between the road infrastructure<br />
and vehicle were well designed and crash protective – for example, by the provisi<strong>on</strong><br />
of crash cushi<strong>on</strong>s <strong>on</strong> sharp ends of roadside barriers. However, most road systems<br />
allow much higher <strong>speed</strong>s without the protective barriers between vehicles and<br />
roadside objects.<br />
The unpredictable nature of human behaviour in a complex traffic envir<strong>on</strong>ment<br />
means it is unrealistic to expect that all crashes can be prevented. But if greater<br />
attenti<strong>on</strong> were given to the tolerance of the human body to injury when designing<br />
the transport system, there could be substantial benefits when crashes do occur,<br />
meaning they might not lead to serious injury or death. Most traffic systems,<br />
however, are not designed <strong>on</strong> the basis of human tolerance. Separating cars and<br />
pedestrians by providing footways is very often not d<strong>on</strong>e. Speed limits of 30 km/h<br />
in shared-space residential areas are often not implemented. Historically, car and bus<br />
fr<strong>on</strong>ts have not been designed to provide protecti<strong>on</strong> for pedestrians against injury at<br />
collisi<strong>on</strong> <strong>speed</strong>s of 30 km/h or more.<br />
5
Module 1: <str<strong>on</strong>g>Why</str<strong>on</strong>g> <str<strong>on</strong>g>focus</str<strong>on</strong>g> <strong>on</strong> <strong>speed</strong><br />
1.1.2 How does <strong>speed</strong> affect road traffic collisi<strong>on</strong>s and injury<br />
Most road safety experts agree that the single most important c<strong>on</strong>tributor to road<br />
fatalities around the world is poor <strong>speed</strong> selecti<strong>on</strong>, comm<strong>on</strong>ly <strong>int</strong>erpreted as the use<br />
of inappropriate vehicle <strong>speed</strong>s, or ‘<strong>speed</strong>ing’.<br />
Definiti<strong>on</strong> of <strong>speed</strong>ing<br />
It is useful to establish a working definiti<strong>on</strong> of ‘<strong>speed</strong>ing’ for the purposes of<br />
police assessment of the role of <strong>speed</strong> in a crash.<br />
The definiti<strong>on</strong> for general applicati<strong>on</strong> in this manual is drawn from OECD, ECMT<br />
(2006) which is: “Speeding encompasses excessive <strong>speed</strong> (driving above the<br />
<strong>speed</strong> limit) or inappropriate <strong>speed</strong> (driving too fast for the c<strong>on</strong>diti<strong>on</strong>s, but<br />
within the limits).”<br />
Source: (6)<br />
Higher <strong>speed</strong>s increase the risk of a crash for a number of reas<strong>on</strong>s. It is more likely<br />
that a driver will lose c<strong>on</strong>trol of the vehicle, fail to anticipate <strong>on</strong>coming hazards in<br />
good time and also cause other road users to misjudge the <strong>speed</strong> of the vehicle. It is<br />
clear that the distance travelled in a given time – and so the distance travelled as a<br />
driver or rider reacts to an unsafe situati<strong>on</strong> <strong>on</strong> the road ahead – is greater for travel<br />
at a higher <strong>speed</strong>. In additi<strong>on</strong> the stopping distance for a vehicle, after a driver reacts<br />
and brakes, will be l<strong>on</strong>ger at a greater travel <strong>speed</strong>.<br />
Studies have shown that reacti<strong>on</strong> time can be a little as <strong>on</strong>e sec<strong>on</strong>d, but in <strong>on</strong>e trial<br />
(9) it was found that most resp<strong>on</strong>se times were between 1.5 and 4 sec<strong>on</strong>ds. The<br />
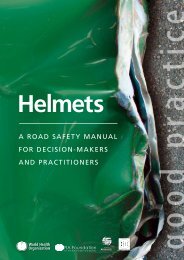
c<strong>on</strong>sequences of such factors are illustrated in Figure 1.2.<br />
The figure shows driver reacti<strong>on</strong> distances and braking distances in metres to<br />
illustrate what can happen if a child runs out <strong>int</strong>o the road at a po<strong>int</strong> about 13 metres<br />
in fr<strong>on</strong>t of a car. If the car is travelling at 30 km/h it can just stop before hitting the<br />
child, but if the <strong>speed</strong> of the car is 50 km/h, the distance covered in the driver’s<br />
reacti<strong>on</strong> time (14 metres) is more than the distance to the child. C<strong>on</strong>sequently,<br />
the child will be hit by the car travelling at 50 km/h and the chances of it<br />
surviving are small.<br />
Excessive and inappropriate <strong>speed</strong> is the biggest road safety problem in many<br />
countries (6). While identifying c<strong>on</strong>tributory factors in traffic crashes can be<br />
somewhat subjective, there are surveys (10) and studies (11) that suggest that as much<br />
as <strong>on</strong>e-third of collisi<strong>on</strong>s resulting in a fatality involve an element of excess <strong>speed</strong>.<br />
Speed is an aggravating factor in all crashes.<br />
6
Speed management: a road safety manual<br />
Figure 1.2 Illustrati<strong>on</strong> of the stopping distance in an emergency braking<br />
1 | <str<strong>on</strong>g>Why</str<strong>on</strong>g> <str<strong>on</strong>g>focus</str<strong>on</strong>g> <strong>on</strong> <strong>speed</strong><br />
Distance (metres)<br />
0 5 10 15 20 25 30 35 40 45 50 55 60 65<br />
30 km/h<br />
40 km/h<br />
50 km/h<br />
Reacti<strong>on</strong><br />
Braking<br />
© HJ Sommer, GTZ, 2003<br />
60 km/h<br />
70 km/h<br />
80 km/h<br />
Source: (6) adapted from the Australian Transport Safety Bureau<br />
CASE STUDY: Speed related crashes, New Zealand<br />
Frith et al (11) attributed 31% of all fatalities and 17%<br />
of all serious injuries in New Zealand to <strong>speed</strong>ing in<br />
the year 2002, based <strong>on</strong> police judgements. They<br />
further stated that these levels were likely to underestimate<br />
the full impact of <strong>speed</strong> <strong>on</strong> crashes and<br />
crash severity, given that <strong>speed</strong> c<strong>on</strong>tributes to the<br />
severity of crash outcomes regardless of the cause.<br />
They indicated that as a broad estimate, if the<br />
average <strong>speed</strong> <strong>on</strong> New Zealand’s rural roads were<br />
reduced by just 4 km/h, the total number of road<br />
crash deaths would decrease by about 15% and the<br />
total number injured by about 8% – meaning that<br />
about 45 deaths and 480 reported injuries would be<br />
avoided (the difference between the fatal and serious<br />
injury proporti<strong>on</strong>s reflects the greater impact of any<br />
<strong>speed</strong> reducti<strong>on</strong> <strong>on</strong> the most severe injuries).<br />
Small increases in <strong>speed</strong> result in large increases in crash risk<br />
Studies provide direct evidence that <strong>speed</strong>s just 5 km/h above average in 60 km/h<br />
urban areas, and 10 km/h above average in rural areas, are sufficient to double the<br />
risk of a casualty crash – roughly equivalent to the increase in risk associated with<br />
a blood alcohol c<strong>on</strong>centrati<strong>on</strong> of 0.05 g/100 ml (the blood alcohol limit for driving in<br />
many countries). The evidence also indicates that ‘moderate <strong>speed</strong>ing’ (within 10 or<br />
15 km/h of the posted limit), makes a large c<strong>on</strong>tributi<strong>on</strong> to serious road crashes –<br />
comparable to the c<strong>on</strong>tributi<strong>on</strong> of more extreme <strong>speed</strong>s – because it is so comm<strong>on</strong>.<br />
Source: (12, 13)<br />
7
Module 1: <str<strong>on</strong>g>Why</str<strong>on</strong>g> <str<strong>on</strong>g>focus</str<strong>on</strong>g> <strong>on</strong> <strong>speed</strong><br />
The problem of <strong>speed</strong>ing has increased over the years since the maximum <strong>speed</strong> that<br />
new cars are capable of is, in many cases, double the existing <strong>speed</strong> limit in rural areas.<br />
Many modern cars now are easily capable of <strong>speed</strong>ing, which was typically not the<br />
case when <strong>speed</strong> limits were first <strong>int</strong>roduced. It is therefore more of a challenge to<br />
c<strong>on</strong>vince drivers to drive within posted <strong>speed</strong> limits.<br />
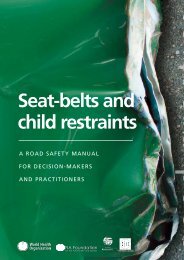
As Figure 1.3 dem<strong>on</strong>strates, the development of engine technologies over the past 40<br />
years has resulted in most cars having a top <strong>speed</strong> well in excess of maximum <strong>speed</strong><br />
limits (6). This presents challenges in managing travel <strong>speed</strong>s to within limits for<br />
both high-level and low-level <strong>speed</strong>ers.<br />
Figure 1.3 Percentage of vehicles sold in France capable of travelling more than<br />
150 km/h<br />
% of vehicles<br />
100<br />
90<br />
80<br />
70<br />
60<br />
50<br />
40<br />
30<br />
20<br />
10<br />
0<br />
1967 1972 1980 1987 2006<br />
Year<br />
© HJ Sommer, GTZ, 2003<br />
CASE STUDY: Effect of changes in <strong>speed</strong> limits<br />
A review of the studies <strong>on</strong> <strong>speed</strong> limit changes from<br />
several countries (South Africa, Belgium, Finland,<br />
France, UK, Germany, USA and New Zealand) where<br />
a <strong>speed</strong> limit was reduced or a new limit was <strong>int</strong>roduced<br />
found a reducti<strong>on</strong> in road crashes ranging from<br />
8% to 40% (14).<br />
Research in America (15) examined the effect of<br />
changes in <strong>speed</strong> limits <strong>on</strong> deaths <strong>on</strong> rural <strong>int</strong>erstate<br />
highways. Road crash deaths in the groups of states<br />
that raised their <strong>speed</strong> limits from 65 to 70–75 mph<br />
rose by 38% and 35% respectively, relative to fatality<br />
levels in the states that did not change their<br />
<strong>speed</strong> limits.<br />
8
Speed management: a road safety manual<br />
There is a sizeable body of research from around the world (but mainly c<strong>on</strong>ducted in<br />
higher income countries) that clearly dem<strong>on</strong>strates the relati<strong>on</strong>ship between <strong>speed</strong><br />
and risk (16, 17, 18). There is a c<strong>on</strong>sistent finding from the research that greater <strong>speed</strong><br />
increases crash, injury, and fatality rates, and that decreasing <strong>speed</strong> reduces these<br />
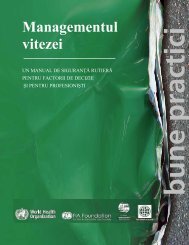
rates. One example is the Power model (19) that estimates the effects of changes in<br />
average <strong>speed</strong> <strong>on</strong> traffic crash incidence and severity. It suggests that a 5% increase in<br />
average <strong>speed</strong> leads to an approximate 10% increase in crashes involving injury, and a<br />
20% increase in those involving fatalities (Figure 1.4).<br />
1 | <str<strong>on</strong>g>Why</str<strong>on</strong>g> <str<strong>on</strong>g>focus</str<strong>on</strong>g> <strong>on</strong> <strong>speed</strong><br />
Figure 1.4 Illustrati<strong>on</strong> of the Power model and the relati<strong>on</strong>ship between percentage<br />
change in <strong>speed</strong> and the percentage change in crashes<br />
80<br />
Change in crashes %<br />
60<br />
40<br />
20<br />
0<br />
-20<br />
© HJ Sommer, GTZ, 2003<br />
Fatal crashes<br />
Fatal and serious<br />
injury crashes<br />
All injury crashes<br />
-40<br />
-60<br />
-20 -15 -10 -5 0 5 10 15 20<br />
Change in mean <strong>speed</strong> %<br />
This relati<strong>on</strong>ship results both from the laws of physics and the cognitive abilities of<br />
the driver/rider to deal with unexpected (but often predictable) circumstances. With<br />
higher <strong>speed</strong>s, the impact <strong>speed</strong> in a crash increases, as do the forces that the vehicle<br />
and occupants must absorb. Higher <strong>speed</strong>s also mean that road users have a lesser<br />
opportunity to take preventive acti<strong>on</strong>s.<br />
CASE STUDY: Raising and lowering the nati<strong>on</strong>al <strong>speed</strong> limit, USA<br />
Between 1987 and 1988, 40 states in the USA raised the <strong>speed</strong> limit <strong>on</strong> <strong>int</strong>erstate highways from 55 mph<br />
(88 km/h) to 65 mph (104 km/h). This resulted in an increase in average car <strong>speed</strong>s of about 3 mph (5 km/h).<br />
Over the same period there was an increase in deaths <strong>on</strong> these roads of between 20 and 25%.<br />
Source: (20)<br />
9
Module 1: <str<strong>on</strong>g>Why</str<strong>on</strong>g> <str<strong>on</strong>g>focus</str<strong>on</strong>g> <strong>on</strong> <strong>speed</strong><br />
1.1.3 What factors c<strong>on</strong>tribute to <strong>speed</strong>ing<br />
There are many reas<strong>on</strong>s why individual drivers <strong>speed</strong>. Travelling at higher <strong>speed</strong>s<br />
offers the immediate ‘reward’ (as a percepti<strong>on</strong>, if not in practice) of a shorter<br />
journey time. This benefit is reinforced every time a driver undertakes a journey and<br />
travels above the <strong>speed</strong> limit without any adverse c<strong>on</strong>sequence. Importantly, while<br />
<strong>speed</strong>ing is involved in a very high percentage of serious and fatal road crashes, from<br />
an individual driver’s po<strong>int</strong> of view, the chance of having a serious crash as a result<br />
of exceeding the <strong>speed</strong> limit is quite low, so the <strong>speed</strong>-crash threat may be less of a<br />
c<strong>on</strong>siderati<strong>on</strong> by drivers compared with the <strong>speed</strong>-penalty threat.<br />
The circumstances of individual trips can influence a driver’s choice of <strong>speed</strong>. For<br />
example, if the vehicle is owned by an employer, the driver may be tempted to drive<br />
at higher <strong>speed</strong>s. When an individual is under pressure or feels the need to rush,<br />
unsafe <strong>speed</strong>s may be selected. Sometimes drivers and riders <strong>speed</strong> just for fun.<br />
Drivers will frequently claim that they were unaware of the <strong>speed</strong> limit, hence the<br />
need for adequate signs, even though ignorance is no defence. Importantly, some<br />
researchers believe that people always tend to optimize the level of risk behaviour<br />
they engage in, such that they choose to drive faster <strong>on</strong> ‘safer’ roads, especially if they<br />
perceive little risk of enforcement activity. Others (21) have found that driving fast<br />
gives a sense of thrill or achievement.<br />
Most drivers c<strong>on</strong>sider themselves above average in terms of skill. A number of surveys<br />
c<strong>on</strong>ducted in various countries around the world (21) dem<strong>on</strong>strate that up to 90%<br />
of drivers think they are an above average, low-risk driver. For that reas<strong>on</strong>, drivers<br />
believe they can travel above the limit and not place themselves at high risk. In any<br />
event, many regard the limits as arbitrary and do not fully understand the greater<br />
risks associated with even small increases in <strong>speed</strong>.<br />
Additi<strong>on</strong>ally an important factor in many countries is pressure that is applied by<br />
fleet managers and employers to be more productive (i.e. drive faster) while public<br />
transport operators and the drivers themselves come under pressure to stick to<br />
challenging timetables, and even race to pick up passengers and goods.<br />
Increasing motorizati<strong>on</strong><br />
With greater motorizati<strong>on</strong> and ec<strong>on</strong>omic development there is an increasing demand<br />
to build roads to a higher standard in order to reduce journey times and c<strong>on</strong>gesti<strong>on</strong>.<br />
This means higher <strong>speed</strong>s – but with higher <strong>speed</strong>s the numbers and severity of<br />
accidents will increase for all types of road user unless appropriate acti<strong>on</strong> is taken.<br />
The <strong>World</strong> report <strong>on</strong> road traffic injury preventi<strong>on</strong> (22) illustrates these general trends<br />
and makes estimates based <strong>on</strong> them. These show that, while fatalities in high-income<br />
countries will fall by 27% over the period 2000–2020, globally there will be an<br />
increase of 67%. In south Asia, this increase is predicted to be 144%.<br />
10
Speed management: a road safety manual<br />
CASE STUDY: Commercial drivers pressured to <strong>speed</strong> and ‘race’, Ghana<br />
1 | <str<strong>on</strong>g>Why</str<strong>on</strong>g> <str<strong>on</strong>g>focus</str<strong>on</strong>g> <strong>on</strong> <strong>speed</strong><br />
Comments from taxi/bus drivers were obtained from<br />
surveys c<strong>on</strong>ducted in 2007 by Ghana’s TV Channel 2<br />
and the Nati<strong>on</strong>al Road Safety Commissi<strong>on</strong>:<br />
•“We drive at high <strong>speed</strong>s.”<br />
•“There is no enforcement of <strong>speed</strong>ing.”<br />
•“Because of the high sales targets, we are under<br />
pressure. You can’t do anything. You are always<br />
thinking of loading.”<br />
•“It may take two hours just to get to the (city) barrier<br />
so some lose their patience and start <strong>speed</strong>ing.”<br />
•“The law at the (bus) stati<strong>on</strong> is that if two ‘cars’ pass<br />
you, you have to start again (i.e. lose your place<br />
in the queue), but the owner does not understand<br />
this, hence we are always under pressure.”*<br />
* At the bus/taxi stati<strong>on</strong>s, drivers queue up for passengers<br />
in order, departing <strong>on</strong>ly when full. The drivers<br />
try to keep this order en route. However, if a bus is<br />
overtaken <strong>on</strong> the road by at least two of the buses that<br />
were originally behind him, he loses his positi<strong>on</strong> and is<br />
pushed two places back in the queue at the next bus<br />
stati<strong>on</strong>. This means further delay before the bus is<br />
full and ready to set off again. This results in <strong>speed</strong>ing<br />
and racing, because pay is dependent <strong>on</strong> number of<br />
trips and the number of passengers carried.<br />
1.2 What is <strong>speed</strong> management<br />
Speed management encompasses a range of measures aimed at balancing safety and<br />
efficiency of vehicle <strong>speed</strong>s <strong>on</strong> a road network (6). It aims to reduce the incidence<br />
of driving too fast for the prevailing c<strong>on</strong>diti<strong>on</strong>s, and to maximize compliance<br />
with <strong>speed</strong> limits. An appropriate <strong>speed</strong>, in the c<strong>on</strong>text of a Safe system, is a <strong>speed</strong><br />
level that c<strong>on</strong>siders traffic safety as the main goal, in the c<strong>on</strong>text of mobility and<br />
prevailing c<strong>on</strong>diti<strong>on</strong>s such as roadside development, the mix of users al<strong>on</strong>g the<br />
road, the frequency of access to the road (including <strong>int</strong>ersecti<strong>on</strong>s), the volume and<br />
mix of traffic, envir<strong>on</strong>mental c<strong>on</strong>cerns and the quality of life for residents living<br />
al<strong>on</strong>g the road.<br />
1.2.1 Aims of <strong>speed</strong> management<br />
Speed management aims to reduce the number of road traffic crashes and the serious<br />
injury and death that can result from them. Speed management needs to employ a<br />
range of measures that will include enforcement, engineering and educati<strong>on</strong>. The<br />
more widespread the measures, particularly enforcement, and the greater the range,<br />
severity and implementati<strong>on</strong> of sancti<strong>on</strong>s against <strong>speed</strong>ing, the more compliance will<br />
result. To achieve wide public acceptance of enforcement, <strong>speed</strong> limits need to be<br />
appropriate – and recognized as such by the public.<br />
In c<strong>on</strong>sidering how to influence <strong>speed</strong>, it is of value to be aware of factors affecting<br />
drivers’ choice of <strong>speed</strong>, as illustrated in Figure 1.5.<br />
11
Module 1: <str<strong>on</strong>g>Why</str<strong>on</strong>g> <str<strong>on</strong>g>focus</str<strong>on</strong>g> <strong>on</strong> <strong>speed</strong><br />
Figure 1.5 Factors affecting <strong>speed</strong> choice<br />
Driver factors<br />
Educati<strong>on</strong>/promoti<strong>on</strong><br />
Speed z<strong>on</strong>e/limit<br />
DRIVER<br />
SPEED CHOICE<br />
Vehicle factors<br />
© HJ Sommer, GTZ, 2003<br />
Road factors<br />
Enforcement and<br />
sancti<strong>on</strong>s<br />
Crash and injury risk<br />
Traffic c<strong>on</strong>diti<strong>on</strong>s<br />
Source: (23)<br />
Speed limit selecti<strong>on</strong> is a critical indicator of the safe <strong>speed</strong> for that secti<strong>on</strong> of road.<br />
This imposes a substantial resp<strong>on</strong>sibility <strong>on</strong> the limit-setting authority. In setting<br />
appropriate <strong>speed</strong> limits it is useful to have the following informati<strong>on</strong> for the secti<strong>on</strong><br />
of road under review:<br />
• <strong>speed</strong> measurements<br />
• measurements of traffic flow and mix<br />
• traffic crash data<br />
• informati<strong>on</strong> from the police <strong>on</strong> <strong>speed</strong>ing offences<br />
• the design <strong>speed</strong> and criteria used to build or rehabilitate the road<br />
• land use and property access adjoining the road<br />
• physical characteristics of the road and roadside<br />
• presence of vulnerable road users.<br />
This informati<strong>on</strong> will be useful in comparing proposed limits with the current travel<br />
<strong>speed</strong>s (including the <strong>speed</strong> distributi<strong>on</strong>) and crash rates. The purpose is to identify<br />
the scale of the change in travel <strong>speed</strong> necessary for safe operati<strong>on</strong>, and to identify the<br />
measures necessary to achieve this.<br />
Without substantial, and often expensive, traffic calming works, it is necessary to<br />
recognize that <strong>speed</strong> limits without enforcement and enforcement without suitable<br />
sancti<strong>on</strong>s usually result in ineffective <strong>speed</strong> management. C<strong>on</strong>sequently, <strong>speed</strong><br />
enforcement and sancti<strong>on</strong>s will generally always be needed to ensure compliance<br />
with <strong>speed</strong> limits.<br />
12
1.2.2 Setting <strong>speed</strong> limits<br />
Speed management: a road safety manual<br />
Speed limits are widely used to define acceptable <strong>speed</strong>s. They provide a basic<br />
indicator to road users of the maximum <strong>speed</strong> allowed under the law. In this sense,<br />
they can be described as representing a society’s judgement, through the legal process,<br />
of the balance between the various issues surrounding <strong>speed</strong> choice. Speed limits<br />
have evolved over time as societies have set different priorities for their road system.<br />
Figure 1.6 describes this evoluti<strong>on</strong> in Sweden.<br />
1 | <str<strong>on</strong>g>Why</str<strong>on</strong>g> <str<strong>on</strong>g>focus</str<strong>on</strong>g> <strong>on</strong> <strong>speed</strong><br />
Figure 1.6 Major factors determining <strong>speed</strong> limits, Sweden, 1960–1990<br />
Important <strong>speed</strong> limit criteria<br />
Injury-related criteria<br />
Social ec<strong>on</strong>omic criteria<br />
Accident-related criteria<br />
Drivers’ behaviour<br />
85 percentile<br />
1960 1970 1980 1990<br />
Source: (24)<br />
In the 1960s limits were set largely to reflect drivers’ behaviour and using the 85th<br />
percentile <strong>speed</strong> – in effect saying drivers were making rati<strong>on</strong>al choices and <strong>on</strong>ly<br />
those in the minority 15% would be judged as ‘<strong>speed</strong>ing’. As analyses of crash data<br />
revealed a growing <strong>speed</strong> related problem, limits were set that took <strong>int</strong>o account road<br />
design factors (sight distance, road curvature and so <strong>on</strong>). Ec<strong>on</strong>omic trade-off then<br />
was <strong>int</strong>roduced. With cost-benefit analysis of road projects using estimates of the<br />
‘value of time’ savings to justify investment, there was a natural trend towards faster<br />
roads. Finally, with the current philosophy of Visi<strong>on</strong> zero, the Swedish parliament has<br />
said that avoiding death and injury is an absolute priority, and the <strong>speed</strong> management<br />
system as a <strong>who</strong>le must be based <strong>on</strong> this philosophy.<br />
There are no absolute rights and wr<strong>on</strong>gs in selecting limits. It is for a government<br />
to determine its priorities, which most likely will change as a society develops. It is<br />
undeniable, however, that if a government wishes to reduce the death and injury<br />
toll in a country, then the Safe-system approach is the way to go. Such a system<br />
13
Module 1: <str<strong>on</strong>g>Why</str<strong>on</strong>g> <str<strong>on</strong>g>focus</str<strong>on</strong>g> <strong>on</strong> <strong>speed</strong><br />
cannot be achieved overnight, but by accepting the principles, and applying them as<br />
infrastructure, laws and enforcement develop, so the numbers and severity of crashes<br />
will be reduced. Secti<strong>on</strong> 3.1 discusses good practice regarding setting <strong>speed</strong> limits in<br />
this c<strong>on</strong>text.<br />
It should be noted that <strong>speed</strong> limits <strong>on</strong> their own will have <strong>on</strong>ly modest effects <strong>on</strong><br />
actual <strong>speed</strong>s. A study cited in the OECD/ECMT report (6) shows that, in places<br />
where <strong>speed</strong> limits are changed and no other acti<strong>on</strong>s such as law enforcement are<br />
taken, the change in average <strong>speed</strong> is <strong>on</strong>ly 25% of the change of the <strong>speed</strong> limit. Other<br />
informati<strong>on</strong> shows that if <strong>speed</strong> limits are changed either upwards or downwards<br />
by 10 km/h, the change in average <strong>speed</strong> is <strong>on</strong>ly 2–4 km/h. While these changes<br />
can improve safety records, it is important to have an effective enforcement strategy<br />
when dealing with the issue of <strong>speed</strong> (16).<br />
1.2.3 Safe systems and the role of <strong>speed</strong><br />
In all regi<strong>on</strong>s of the world, to prevent road death and disabling injury, a traffic system<br />
better adapted to the physical vulnerabilities of its users needs to be created – with<br />
the use of more crash-protective vehicles and roadsides. The Safe-system approach,<br />
as exemplified by Visi<strong>on</strong> zero (Sweden), Sustainable safety (Netherlands) and Safe<br />
system (Australia) (25, 26, 27, 28, 12) should set the framework for the l<strong>on</strong>g-term<br />
management of <strong>speed</strong>s <strong>on</strong> a nati<strong>on</strong>’s roads. Figure 1.7 illustrates the Safe system in<br />
c<strong>on</strong>ceptual terms.<br />
The aim of a safe system is to achieve a road system that allows for human error<br />
without leading to death or serious injury. It recognizes the limits of force that the<br />
human body can survive and <str<strong>on</strong>g>focus</str<strong>on</strong>g>es <strong>on</strong> systematically addressing various factors<br />
involved in specific crash types to reduce the risk of injury. Crashes are always likely<br />
to happen, even though there is a c<strong>on</strong>tinuing <str<strong>on</strong>g>focus</str<strong>on</strong>g> <strong>on</strong> preventi<strong>on</strong>. The Safe-system<br />
approach aims to minimize the severity of injury when a crash occurs and is based <strong>on</strong><br />
the premise that road users should not die because of system failings.<br />
One important cornerst<strong>on</strong>e in the Safe-system c<strong>on</strong>text is that the care of human life<br />
and health is c<strong>on</strong>sidered to be more important than anything else. This is clearly<br />
expressed within Visi<strong>on</strong> zero (25, 26) where an ethical approach to road safety is<br />
taken. The l<strong>on</strong>g-term goal is that no <strong>on</strong>e should be killed or seriously injured in road<br />
traffic. The moral basis of Visi<strong>on</strong> zero corresp<strong>on</strong>ds to the views often already adopted<br />
in c<strong>on</strong>necti<strong>on</strong> with rail, sea or air travel.<br />
The c<strong>on</strong>sequences for <strong>speed</strong> management of adopting a Safe-system approach result<br />
in, for example:<br />
• a 30 km/h <strong>speed</strong> limit being used in built-up areas where there is a mix of<br />
vulnerable road users and motor vehicle traffic<br />
14
Speed management: a road safety manual<br />
• a reducti<strong>on</strong> in the likelihood of fatal side-impact crashes at <strong>int</strong>ersecti<strong>on</strong>s (it is<br />
often preferable to build a roundabout instead of installing traffic lights, and it is<br />
advisable to limit approach <strong>speed</strong>s to less than 50 km/h)<br />
• a reducti<strong>on</strong> in the likelihood of fatal head-<strong>on</strong> crashes <strong>on</strong> two-way single<br />
carriageway roads (median barriers should be used with high volumes of traffic, or<br />
<strong>speed</strong> limits should be kept below 70 km/h).<br />
1 | <str<strong>on</strong>g>Why</str<strong>on</strong>g> <str<strong>on</strong>g>focus</str<strong>on</strong>g> <strong>on</strong> <strong>speed</strong><br />
Figure 1.7 A Safe-system model<br />
Admittance to<br />
system<br />
SAFER TRAVEL<br />
© HJ Sommer, GTZ, 2003<br />
Understanding<br />
crashes and risks<br />
Alert and compliant road users<br />
Safer <strong>speed</strong>s (lower<br />
<strong>speed</strong>s more forgiving of<br />
human error)<br />
Human tolerance<br />
to physical force<br />
Safer vehicles<br />
Safer roads and<br />
roadsides (more<br />
forgiving of human error)<br />
Educati<strong>on</strong> and<br />
informati<strong>on</strong> supporting<br />
road users<br />
Enforcement of<br />
road rules<br />
Source: (12)<br />
It should be the aim of low and middle-income countries first to stabilize any<br />
worsening situati<strong>on</strong>, and sec<strong>on</strong>d to create road safety policies rooted in ‘good<br />
practice’ as dem<strong>on</strong>strated by better-performing countries. Safe-system thinking can<br />
c<strong>on</strong>tribute to the immediate needs of low and middle-income countries and, as for<br />
all countries, to more rapid, l<strong>on</strong>g-term road safety improvement.<br />
The Safe-system approach requires system managers to understand crash causes<br />
in order to assess crash risk. It is critical that the key risk factors that c<strong>on</strong>tribute<br />
15
Module 1: <str<strong>on</strong>g>Why</str<strong>on</strong>g> <str<strong>on</strong>g>focus</str<strong>on</strong>g> <strong>on</strong> <strong>speed</strong><br />
significantly to crashes<br />
are identified and<br />
understood. To assist this<br />
aim, accurate crash and<br />
injury data collecti<strong>on</strong> and<br />
analysis systems need to<br />
be put in place if they do<br />
not already exist.<br />
The key elements in the<br />
Safe system are:<br />
• To manage <strong>speed</strong><br />
Carefully targeted, wide-scale infrastructure programmes, vehicle safety<br />
improvements and enforcing appropriate <strong>speed</strong> limits will reduce the likelihood<br />
of crashes occurring and/or reduce their severity to survivable levels. For example,<br />
it is not feasible to lower <strong>speed</strong>s <strong>on</strong> rural roads to 50 km/h (the <strong>speed</strong> at which<br />
a side-impact collisi<strong>on</strong> would be survivable) if there are trees or poles adjacent<br />
to the roadway. The answer lies in removal of the hazards or installati<strong>on</strong> of<br />
protective barriers. Other measures to reduce the likelihood of vehicle-c<strong>on</strong>trol<br />
loss, or vehicles leaving the road, could also be c<strong>on</strong>sidered, including provisi<strong>on</strong><br />
of sealed shoulders and audible edge lining, together with vehicles being<br />
equipped with electr<strong>on</strong>ic stability c<strong>on</strong>trol features. On the other hand, <strong>speed</strong><br />
limits of 30–50 km/h in areas of higher pedestrian crash risk (from vehicles) will<br />
substantially reduce pedestrian fatality risks.<br />
These examples assume that road users are complying with road rules. However,<br />
the challenges inherent in deterring n<strong>on</strong>-compliant behaviour are substantial, and<br />
in lower income countries improvements in training of new drivers and improved<br />
enforcement will all need to play a role.<br />
• Focus <strong>on</strong> the importance of vehicle safety<br />
Improving a country’s vehicle fleet offers major benefits, and as much as possible<br />
should be d<strong>on</strong>e to encourage the purchase and supply of safe vehicles. Today,<br />
most modern cars protect a seat-belted occupant up to about 70 km/h in a fr<strong>on</strong>tal<br />
collisi<strong>on</strong> (22) and up to about 50 km/h in side impacts. The European Transport<br />
Safety Council has estimated that if every car owner upgraded their vehicle<br />
overnight to the safest in its class, then fatalities <strong>on</strong> Europe’s roads would drop<br />
by 40–50% (29). It is likely that such a development in low and middle-income<br />
countries would result in far greater benefits.<br />
Improved pedestrian safety ratings for vehicles and improved object detecti<strong>on</strong><br />
technology will also lead to lower severity of crash outcomes. The benefits of<br />
<strong>int</strong>elligent <strong>speed</strong> adaptati<strong>on</strong> are now available to any country prepared to legislate<br />
for its provisi<strong>on</strong> in new vehicles, and to develop and ma<strong>int</strong>ain the necessary digital<br />
16
Speed management: a road safety manual<br />
maps of <strong>speed</strong> limits. This is an important opportunity for major reducti<strong>on</strong>s in<br />
road trauma, but str<strong>on</strong>g government leadership will be needed to bring it about.<br />
• Management of road and roadside/network safety<br />
While ensuring that new roads provide improved levels of safety, the real challenge<br />
is how to set and enforce <strong>speed</strong> limits <strong>on</strong> the existing road network. If the <strong>speed</strong>s<br />
are too high because of the road standard (high crash-risk) and infrastructure<br />
soluti<strong>on</strong>s are not cost effective (because of, for example, low volumes/low crash<br />
numbers) there will be a need to lower and enforce the existing <strong>speed</strong> limits.<br />
However, the public needs to be made aware of why this is being d<strong>on</strong>e and how<br />
they will benefit from such changes.<br />
1 | <str<strong>on</strong>g>Why</str<strong>on</strong>g> <str<strong>on</strong>g>focus</str<strong>on</strong>g> <strong>on</strong> <strong>speed</strong><br />
1.2.4 Benefits of <strong>speed</strong> management<br />
Promoting a successful <strong>speed</strong> management programme following a Safe-system<br />
approach clearly has many benefits. The most obvious <strong>on</strong>e is of course the reducti<strong>on</strong><br />
in the number of deaths and injuries resulting from crashes (6, 14).<br />
The safety benefits of lowered travel <strong>speed</strong>s include:<br />
• greater time to recognize hazards<br />
• reduced distance travelled while reacting to hazards<br />
• reduced stopping distance of the vehicle after braking<br />
• increased ability of other road users to judge vehicle <strong>speed</strong> and time before<br />
collisi<strong>on</strong><br />
• greater opportunity for other road users to avoid a collisi<strong>on</strong><br />
• less likelihood that a driver will lose vehicle c<strong>on</strong>trol.<br />
Tables 1.1 and 1.2 show the importance of small changes in average <strong>speed</strong> in<br />
producing safety benefits. They show the estimated safety effect of a reducti<strong>on</strong> of<br />
<strong>speed</strong> of 1 km/h and 2 km/h respectively, from different reference levels in percentage<br />
savings of different severities of crashes. The tables show that <strong>speed</strong> reducti<strong>on</strong>s have a<br />
greater effect for more severe crashes.<br />
17
Module 1: <str<strong>on</strong>g>Why</str<strong>on</strong>g> <str<strong>on</strong>g>focus</str<strong>on</strong>g> <strong>on</strong> <strong>speed</strong><br />
Table 1.1<br />
Applicati<strong>on</strong> of the Power model for different reference <strong>speed</strong>s when the<br />
average <strong>speed</strong> is reduced by 1 km/h<br />
Percentage (%) reducti<strong>on</strong> in crashes for 1 km/h reducti<strong>on</strong>s in average <strong>speed</strong>s<br />
Reference <strong>speed</strong> in km/h<br />
50 60 70 80 90 100 110 120<br />
All injury crashes 4.0 3.3 2.8 2.5 2.2 2.0 1.8 1.7<br />
Fatal and serious crashes 5.9 4.9 4.2 3.7 3.3 3.0 2.7 2.5<br />
Fatal crashes 7.8 6.5 5.6 4.9 4.4 3.9 3.6 3.3<br />
Table 1.2<br />
Applicati<strong>on</strong> of the Power model for different reference <strong>speed</strong>s when the<br />
average <strong>speed</strong> is reduced by 2 km/h<br />
Percentage (%) reducti<strong>on</strong> in crashes for 2 km/h reducti<strong>on</strong>s in average <strong>speed</strong>s<br />
Reference <strong>speed</strong> in km/h<br />
50 60 70 80 90 100 110 120<br />
All injury crashes 7.8 6.6 5.6 4.9 4.4 4.0 3.6 3.0<br />
Fatal and serious crashes 11.5 9.7 8.3 7.3 6.5 5.9 5.4 4.9<br />
Fatal crashes 15.1 12.7 10.9 9.6 8.6 7.8 7.1 6.5<br />
Source: (18)<br />
The tables clearly show the importance of even small reducti<strong>on</strong>s in <strong>speed</strong>. However,<br />
achieving such changes in average <strong>speed</strong> often require great effort. One reas<strong>on</strong> is that<br />
drivers’ percepti<strong>on</strong>s of a reas<strong>on</strong>able and acceptable <strong>speed</strong> tends to increase over time,<br />
because of faster cars and better roads. To achieve <strong>speed</strong> reducti<strong>on</strong>s in rural areas,<br />
public informati<strong>on</strong> activities and enforcement methods need to offset this<br />
development through increased effort and str<strong>on</strong>ger sancti<strong>on</strong>s.<br />
CASE STUDY: Reduced <strong>speed</strong> limit and safety outcomes, New Zealand<br />
During the 1973 fuel crisis, the New Zealand government reduced rural <strong>speed</strong> limits from 55 mph (88 km/h)<br />
to 50 mph (80 km/h), leading to an 8–10 km/h reducti<strong>on</strong> in average rural <strong>speed</strong>s. The drop in <strong>speed</strong> led to<br />
a significant drop in injuries, as compared with urban roads which were unaffected by the <strong>speed</strong> limit change<br />
(30). On main <strong>int</strong>ercity roads the number of deaths dropped by 37%, serious injuries decreased by 24% and<br />
minor injuries decreased by 22%. The corresp<strong>on</strong>ding reducti<strong>on</strong>s for urban areas were 15%, 9% and 4%.<br />
18
Speed management: a road safety manual<br />
Many governments have dem<strong>on</strong>strated a reluctance to enforce limits effectively, as<br />
there is c<strong>on</strong>siderable public reacti<strong>on</strong> to such measures. A commitment to support<br />
enforcement will be essential to achieving safe travel <strong>speed</strong>s by drivers.<br />
1 | <str<strong>on</strong>g>Why</str<strong>on</strong>g> <str<strong>on</strong>g>focus</str<strong>on</strong>g> <strong>on</strong> <strong>speed</strong><br />
CASE STUDY: Changes in <strong>speed</strong> limits and crashes, Australia<br />
In Australia, the <strong>speed</strong> limit <strong>on</strong> Melbourne’s rural and outer freeway network was increased from 100 km/h<br />
to 110 km/h in 1987 and then changed back to 100 km/h in 1989. Compared to a c<strong>on</strong>trol area where the<br />
<strong>speed</strong> limit remained the same, the injury crash rate per kilometre travelled increased by 24.6% when the<br />
<strong>speed</strong> limit increased, and decreased by 19.3% when the <strong>speed</strong> limit decreased (31).<br />
Summary<br />
• The risk of a crash and the likelihood of serious injury as a result of a crash both<br />
increase with higher vehicle <strong>speed</strong>s.<br />
• Reducing <strong>speed</strong> limits lowers the rate of crashes, serious injuries and fatalities.<br />
• Most unprotected road users survive if hit by a car travelling up to 30 km/h.<br />
• Most unprotected road users are killed if hit by a car travelling 50 km/h.<br />
• Speeding is a major road safety problem in many countries, c<strong>on</strong>tributing to at least<br />
<strong>on</strong>e-third of all crashes, and is an aggravating factor in almost all crashes.<br />
• Speed limits of 30km/h should be c<strong>on</strong>sidered for road lengths where there are<br />
high pedestrian movements al<strong>on</strong>g and across the road, and no adequate pedestrian<br />
segregati<strong>on</strong>.<br />
• The Power model estimates the percentage change in risk as a result of a percentage<br />
change in average <strong>speed</strong> (the relative <strong>speed</strong> change). For example, a 5% increase in<br />
average <strong>speed</strong> leads to approximately a 10% increase of all injury accidents, and a<br />
20% increase in fatal accidents.<br />
• The aim of a safe road system is to achieve a road transportati<strong>on</strong> system that allows<br />
for human error without it leading to death or serious injury.<br />
• Safe-system thinking can c<strong>on</strong>tribute to the immediate needs of low and middleincome<br />
countries and, for all countries, to more rapid, l<strong>on</strong>g-term road safety<br />
improvement.<br />
• Speed management is a central part of a Safe system. This c<strong>on</strong>sists of setting and<br />
enforcing appropriate <strong>speed</strong> limits, but also aims to c<strong>on</strong>vince drivers to choose<br />
appropriate <strong>speed</strong>s in the prevailing circumstances through educati<strong>on</strong> and<br />
publicity; it also advocates the selective use of engineering treatments.<br />
• Without a str<strong>on</strong>g, sustained public commitment to robust enforcement of <strong>speed</strong>s<br />
<strong>on</strong> the network by government, <strong>speed</strong> management programmes are unlikely to<br />
be effective.<br />
19
Module 1: <str<strong>on</strong>g>Why</str<strong>on</strong>g> <str<strong>on</strong>g>focus</str<strong>on</strong>g> <strong>on</strong> <strong>speed</strong><br />
References<br />
1. Gibs<strong>on</strong> JJ. The c<strong>on</strong>tributi<strong>on</strong> of experimental psychology to the formulati<strong>on</strong> of the problem of<br />
safety: a brief for basic research. Behavioral Approaches to Accident Research, 1961, 77–89. New<br />
York, Associati<strong>on</strong> for the Aid of Crippled Children.<br />
2. Hadd<strong>on</strong> W Jr. Energy damage and the ten countermeasure strategies. The Journal of Trauma,<br />
1973, 13 (No.4) 321–331.<br />
3. De Haven H. ‘Mechanical analysis of survival in falls from heights of fifty to <strong>on</strong>e hundred and<br />
fifty feet’. War Medicine, 1942, 6:586–596 (repr<strong>int</strong>ed in Injury Preventi<strong>on</strong>, 6:62–68).<br />
4. Christoffel T, Gallagher S. Injury Preventi<strong>on</strong> and Public <strong>Health</strong>: Practical Knowledge, Skills, and<br />
Strategies, 2nd editi<strong>on</strong>, 2006.<br />
5. Seat-belt campaign toolkit. L<strong>on</strong>d<strong>on</strong>, FIA Foundati<strong>on</strong>, 2004.<br />
6. OECD/ECMT Transport Research Centre: Speed Management report, Paris 2006 (available in<br />
English and French).<br />
7. Mackay GM. Reducing car crash injuries, folklore, science and promise. American Associati<strong>on</strong> for<br />
Automotive Medicine, 1983, No.5.<br />
8. Tingvall C, Haworth N. Visi<strong>on</strong> zero: an ethical approach to safety and mobility. Paper presented<br />
to the 6th Institute of Transport Engineers Internati<strong>on</strong>al C<strong>on</strong>ference <strong>on</strong> Road Safety and Traffic<br />
Enforcement: Bey<strong>on</strong>d 2000, Melbourne, 6–7 September 1999<br />
9. Evans L. Traffic Safety and the Driver, USA, Van Nostrand Reinhold, 1991.<br />
10. OECD/ECMT Transport Research Centre, Country reports <strong>on</strong> safety performance, results of a<br />
survey undertaken by the OECD/ECMT Working Group <strong>on</strong> Ambitious Road Safety Targets.<br />
(www.cemt.org/JTRC/index.htm).<br />
11. Frith et al. Road safety impacts of excessive and inappropriate vehicle <strong>speed</strong>, Austroads road safety<br />
handbook, Vol. 2, 2005.<br />
12. Australian Transport Council. Nati<strong>on</strong>al Road Safety Acti<strong>on</strong> Plan 2007–2008. (www.atcouncil.gov.<br />
au/documents/nrss_acti<strong>on</strong>plan_0708.aspx)<br />
13. Kloeden CN et al. Travelling <strong>speed</strong> and the risk of crash involvement. Canberra, Federal Office of<br />
Road Safety, CR172, 1997 (www.atsb.gov.au/publicati<strong>on</strong>s/1997/pdf/Speed_Risk_1.pdf ).<br />
14. Managing Speeds of Traffic <strong>on</strong> European Roads ( MASTER) Final report European Commissi<strong>on</strong>.<br />
Project of the 4th framework programme, 1998 (http://virtual.vtt.fi/master/).<br />
15. Patters<strong>on</strong>, TL et al. The effects of increasing rural <strong>int</strong>erstate <strong>speed</strong> limits in the USA. Traffic<br />
Injury Preventi<strong>on</strong>, 2002.<br />
16. Taylor MC et al. The effects of drivers` <strong>speed</strong> <strong>on</strong> the frequency of road accidents. Crowthorne,<br />
Berkshire, UK TRL Report No. 421. Transport Research Laboratory (TRL), 2000.<br />
17. Elvik R, Vaa T. The handbook of road safety measures. 2004, Amsterdam, Elsevier.<br />
18. Aarts L, van Schagen I. Driving <strong>speed</strong> and the risk of road crashes: A review. Accident, Analysis<br />
and Preventi<strong>on</strong>, 2006, 38:215–224.<br />
19. Nilss<strong>on</strong> G. Traffic safety dimensi<strong>on</strong>s and the power model to describe the effect of <strong>speed</strong> <strong>on</strong> safety.<br />
Bulletin 221, Sweden, Lund Institute of Technology, Lund University, 2004.<br />
20. Transportati<strong>on</strong> Research Board Managing <strong>speed</strong>. Review of the practice for setting and enforcing<br />
<strong>speed</strong> limits. Special report 254, Nati<strong>on</strong>al Academic Press, 1998.<br />
21. SARTRE 3 report, European drivers and road risk; Report <strong>on</strong> principal results. France, Institut de<br />
Recherche sur les Transport et leur Securite INRETS, 2004.<br />
20
Speed management: a road safety manual<br />
22. Peden M et al, eds. <strong>World</strong> report <strong>on</strong> road traffic injury preventi<strong>on</strong>. Geneva, <strong>World</strong> <strong>Health</strong><br />
Organizati<strong>on</strong>, 2004.<br />
23. Oxley J, Corben B. Effective <strong>speed</strong> management. Melbourne, M<strong>on</strong>ash University Accident Centre,<br />
VICROADS, 2002.<br />
24. Belin M. Trends in setting <strong>speed</strong> limits – Sweden as a case study. Sweden, Swedish Road<br />
Administrati<strong>on</strong>, Borlänge, 2007.<br />
25. Visi<strong>on</strong> zero – from c<strong>on</strong>cept to acti<strong>on</strong>. Sweden, Swedish Road Administrati<strong>on</strong>, Borlänge, 2000<br />
(www.vv.se).<br />
26. Safe traffic, Visi<strong>on</strong> zero <strong>on</strong> the move. Sweden, Swedish Road Administrati<strong>on</strong>, Borlänge, 2002<br />
(www.vv.se).<br />
27. Wegman, F, Aarts, L, eds. Advancing sustainable safety: Nati<strong>on</strong>al road safety explorati<strong>on</strong> for<br />
2005–2006.SWOV, 2006 (www.sustainablesafety.nl).<br />
28. Nati<strong>on</strong>al Road Safety Strategy 2001–2010. Australian Transport Council. (www.dotars.gov.au/<br />
index.aspx).<br />
29. Reducing traffic injuries resulting from excess and inappropriate <strong>speed</strong>. Brussels, European Transport<br />
Safety Council, 1995.<br />
30. Frith B, Toomath JB. The New Zealand open road <strong>speed</strong> limit. Accident Analysis and Preventi<strong>on</strong>,<br />
1982, 14:209–218.<br />
31. Sliogeris J. 110-kilometre per hour <strong>speed</strong> limit: Evaluati<strong>on</strong> of road safety effects, Melbourne, Report<br />
No. GR92–8, Vicroads, 1992.<br />
1 | <str<strong>on</strong>g>Why</str<strong>on</strong>g> <str<strong>on</strong>g>focus</str<strong>on</strong>g> <strong>on</strong> <strong>speed</strong><br />
21
22<br />
Module 1: <str<strong>on</strong>g>Why</str<strong>on</strong>g> <str<strong>on</strong>g>focus</str<strong>on</strong>g> <strong>on</strong> <strong>speed</strong>