Financial Statements - Mewah Group
Financial Statements - Mewah Group
Financial Statements - Mewah Group

Create successful ePaper yourself
Turn your PDF publications into a flip-book with our unique Google optimized e-Paper software.
MEWAH INTERNATIONAL INC.<br />
ANNUAL REPORT 2011<br />
Notes to the <strong>Financial</strong> <strong>Statements</strong><br />
For the financial year ended 31 December 2011<br />
3. Critical accounting estimates, assumptions and judgements (continued)<br />
(d)<br />
Uncertain tax positions<br />
The <strong>Group</strong> is subject to income taxes in numerous jurisdictions. In determining the income tax liabilities, management<br />
is required to estimate the amount of capital allowances, incentives and the deductibility of certain expenses (“uncertain<br />
tax positions”) at each tax jurisdiction. Where the final outcome of these matters is different from the amounts that were<br />
initially recorded, such as due to changes in tax rules or revised interpretations of existing tax laws and precedent such<br />
differences will impact the income tax provisions in the corresponding periods.<br />
(e)<br />
Useful lives of plant and equipment<br />
The cost of plant and equipment are depreciated on a straight-line basis over their useful lives, which management<br />
estimates to be of 20 years.<br />
These estimates could change significantly as a result of technical innovations.<br />
If the actual useful lives of these plant and equipment differ by 5% from management estimates, the carrying amount of<br />
the plant and equipment will be increased by US$622,000 or decreased by US$562,000 and correspondingly to profit or<br />
loss.<br />
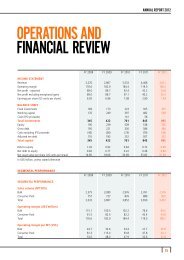
4. Revenue<br />
<strong>Group</strong><br />
2011 2010<br />
US$’000 US$’000<br />
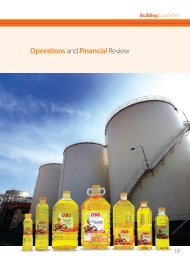
Sale of agricultural products including palm based edible oils<br />
and fats, and other consumer products 4,467,933 3,533,071<br />
5. Cost of sales<br />
<strong>Group</strong><br />
2011 2010<br />
US$’000 US$’000<br />
Cost of inventories 4,212,598 3,280,599<br />
Losses/(gains) from derivative financial instruments 31,139 (48,341)<br />
Labour costs and other overheads 38,577 34,563<br />
4,282,314 3,266,821<br />
76