Full Document: PDF 949KB - Te Puni Kokiri
Full Document: PDF 949KB - Te Puni Kokiri
Full Document: PDF 949KB - Te Puni Kokiri

You also want an ePaper? Increase the reach of your titles
YUMPU automatically turns print PDFs into web optimized ePapers that Google loves.
MÄTAURANGA KNOWLEDGE<br />
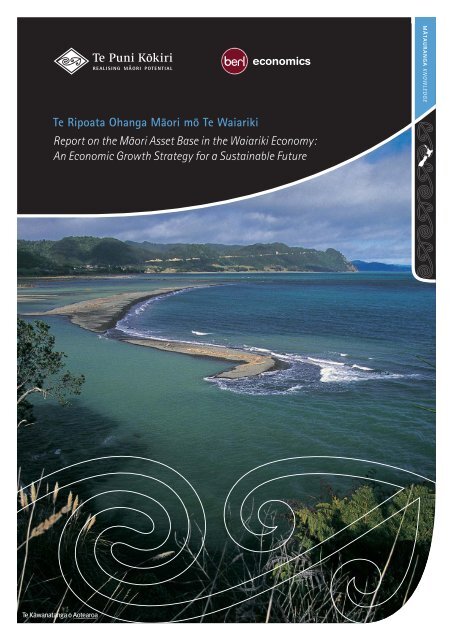
<strong>Te</strong> Ripoata Ohanga Mäori mö <strong>Te</strong> Waiariki<br />
Report on the Mäori Asset Base in the Waiariki Economy:<br />
An Economic Growth Strategy for a Sustainable Future
2<br />
REALISING MÄORI POTENTIAL<br />
RAWA RESOURCES<br />
1<br />
MÄTAURANGA KNOWLEDGE<br />
WHAKAMANA INFLUENCE<br />
TE IRA TANGATA LIFE QUALITY<br />
2 3 4<br />
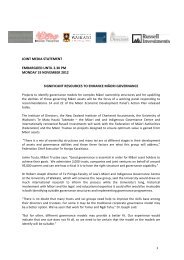
1 Rawa – The resources to realise potential.<br />
Mätauranga – The knowledge to realise potential.<br />
This area acknowledges the importance of knowledge to building confidence<br />
2<br />
and identity, growing skills and talents and generating innovation and creativity.<br />
K nowledge and skills are considered as a key enabler of Mäori potential as<br />
they underpin choice and the power to act to improve life quality.<br />
The four enablers of the Mäori Potential Approach<br />
are shown in the illustration above. All our written<br />
information has been organised within these enabler<br />
areas. The enablers are as described opposite.<br />
3 Whakamana – The authoritative capacity to realise potential.<br />
4 <strong>Te</strong> Ira Tangata – The quality of life to realise potential.<br />
DISCLAIMER This publication is intended to provide information on the matters contained herein. It has been<br />
written, edited and published and made available to all persons and entities strictly on the basis that its authors, editors<br />
and publishers are fully excluded from any liability or responsibility by all or any of them in any way to any person or<br />
entity for anything done or omitted to be done by any person or entity in reliance, whether totally or partially, on the contents<br />
of this publication for any purposes whatsoever.<br />
© <strong>Te</strong> <strong>Puni</strong> Kökiri<br />
ISBN 978-0-478-34502-5<br />
February 2010<br />
TE PUNI KÖKIRI<br />
REPORT ON THE MÄORI ASSET BASE IN THE WAIARIKI ECONOMY
MAI TE MANAHAUTÜ<br />
FROM THE CHIEF EXECUTIVE<br />
Opportunities abound for Mäori in Waiariki<br />
rohe to capitalise on the economic potential of<br />
their asset base.<br />
Mäori are fast moving from passive rent<br />
receivers to active business operators and<br />
partners. This paradigm shift is realising<br />
successful economic gains for Mäori across<br />
the rohe.<br />
Further investigation of the productive use and<br />
value of assets in this rohe will consolidate<br />
and nurture that potential. Concurrently Mäori<br />
will generate the skills and knowledge required<br />
for continuous improvement in social and<br />
economic well-being.<br />
The present strength of Mäori in the Waiariki<br />
rohe is their asset base. This asset base is<br />
currently concentrated in the primary industry<br />
and is driven by land ownership. Further, a<br />
substantial proportion of the asset base in this<br />
rohe is held in collective ownership.<br />
Over the last 10 years, the assets of Mäori<br />
entities have grown. This has created a<br />
challenge in terms of distributing income, and<br />
managing and further growing the asset.<br />
This report demonstrates, at a broad level,<br />
the significance of Mäori in the economic<br />
development of the Waiariki rohe, and the<br />
role Mäori can play in influencing economic<br />
change and direction in this rohe.<br />
<strong>Te</strong> <strong>Puni</strong> Kökiri intends that this report will<br />
assist in the development of robust strategies<br />
and resilient relationships, and contribute to<br />
strengthening Mäori economic development<br />
in the Waiariki region. It should be used<br />
in conjunction with other strategies and<br />
economic development projects, and be<br />
seen as a platform for encouraging further<br />
investigation and discussion.<br />
<strong>Te</strong> <strong>Puni</strong> Kökiri acknowledges Kel Sanderson,<br />
Fiona Stokes and Adrian Slack of Business<br />
Economic and Research Limited (BERL), the<br />
authors of this report.<br />
<strong>Te</strong> <strong>Puni</strong> Kökiri would also like to thank all<br />
those individuals and organisations who have<br />
contributed in numerous ways to this report.<br />
In particular, acknowledgement is given to<br />
the Bay of Plenty Mäori Economic Forum for<br />
their expert knowledge and guidance with the<br />
research and in the compilation of this report.<br />
Ngä mihinui<br />
Leith Comer<br />
Chief Executive<br />
1
CONTENTS<br />
2<br />
4 1 SUMMARY<br />
4 1.1 Mäori business assets<br />
5 1.2 Collectively owned assets<br />
6 1.3 Treaty of Waitangi settlement assets<br />
6 1.4 Networks and collaboration<br />
6 1.5 Opportunities for growth<br />
7 1.6 Looking ahead<br />
9 2 INTRODUCTION<br />
10 3 OVERALL ASSESSMENT OF ASSET BASE VALUE<br />
11 4 MÄORI BUSINESS ASSETS<br />
11 4.1 Mäori businesses<br />
16 5 COLLECTIVELY OWNED ASSETS<br />
17 5.1 Mäori land incorporations<br />
18 5.2 Ahu whenua trusts<br />
22 5.3 Mäori land incorporation and ahu whenua trust asset estimates<br />
24 5.4 Looking ahead<br />
25 6 TREATY OF WAITANGI SETTLEMENT ASSETS<br />
25 6.1 Treaty of Waitangi settlement assets<br />
29 6.2 Treaty of Waitangi forestry settlement assets<br />
30 6.3 Mäori Fisheries Act 2004 settlement assets<br />
32 7 NETWORKS AND COLLABORATION<br />
32 7.1 Networks<br />
33 7.2 Collaborations<br />
34 8 OPPORTUNITIES FOR GROWTH<br />
34 8.1 Capital for investment<br />
34 8.2 Human capital<br />
35 8.3 Influencing future directions<br />
38 9 APPENDIX 1: METHODOLOGY<br />
38 9.1 Data<br />
38 9.2 Definitions<br />
40 9.3 Rounding<br />
41 10 APPENDIX 2: DEMOGRAPHIC PROFILE<br />
41 10.1 Population at 2006<br />
43 10.2 Iwi profiles<br />
44 10.3 Income statistics<br />
47 10.4 Labour force and employment<br />
48 10.5 Industry and occupation<br />
TE PUNI KÖKIRI<br />
REPORT ON THE MÄORI ASSET BASE IN THE WAIARIKI ECONOMY
TABLES<br />
& FIGURES<br />
10 Table 3.1 Total estimated value of Mäori assets in the Waiariki economy, as at 2009<br />
12 Table 4.1 Mäori self-employed (without employees) and employers<br />
13 Table 4.2 Changes in New Zealand self-employed (without employees) businesses<br />
14 Table 4.3 Changes in New Zealand employers’ businesses<br />
15 Table 4.4 Industry profile of businesses, Bay of Plenty region and New Zealand<br />
17 Table 5.1 Mäori land incorporations in Waiariki Mäori Land Court District<br />
18 Table 5.2 Ahu whenua trusts in Waiariki Mäori Land Court District<br />
19 Table 5.3 Ahu whenua trust operational activities in Waiariki<br />
20 Figure 1 Bay of Plenty Settlement Hierarchy<br />
22 Table 5.4 Mäori land trusts and incorporations - asset value estimates<br />
26 Table 6.1 Settlement entity assets, value as at 2009<br />
29 Table 6.2 Forestry settlement assets, value as at 2009<br />
30 Table 6.3 Allocated fishery assets, value as at 2009<br />
41 Table 10.1 Bay of Plenty region and New Zealand resident population<br />
41 Table 10.2 <strong>Te</strong>rritorial authorities resident population<br />
42 Table 10.3 Bay of Plenty region age profile<br />
42 Table 10.4 <strong>Te</strong>rritorial authorities age profile<br />
43 Table 10.5 Bay of Plenty region iwi population profiles<br />
44 Table 10.6 Household incomes, Bay of Plenty region<br />
45 Table 10.7 Personal incomes, Bay of Plenty region<br />
46 Table 10.8 Source of income, Bay of Plenty region<br />
47 Table 10.9 Labour force status, Bay of Plenty region<br />
47 Table 10.10 Employment status, Bay of Plenty region<br />
48 Table 10.11 Employment by industry, Bay of Plenty region<br />
49 Table 10.12 Employment by occupation, Bay of Plenty region,<br />
3
1. SUMMARY<br />
4<br />
This report has been prepared by Business and<br />
Economic Research Limited (BERL) for the<br />
Bay of Plenty Mäori Economic Development<br />
Reference Group (the Reference Group).<br />
Our research objectives were to:<br />
• demonstrate the significance and role of<br />
Mäori in influencing economic change in<br />
the Waiariki rohe<br />
• inform future Mäori economic development<br />
plans that would enable Mäori selfdetermination<br />
and influence beyond the<br />
Waiariki rohe.<br />
The asset base of the Waiariki rohe includes<br />
the asset base of the following iwi: <strong>Te</strong><br />
Whänau-a-Apanui, Ngaitai, Whakatöhea,<br />
Tühoe, Ngäti Awa, Ngäti Tüwharetoa<br />
Bay of Plenty (BoP), Ngäti Pükenga,<br />
Ngaiterangi, Ngäti Ranginui, Ngäti Pikiao,<br />
Ngäti Rangiteaorere, Ngäti Rangitihi, Ngäti<br />
Rangiwewehi, Tapuika, Tühourangi, Waitaha,<br />
and Ngäti Whakaue. The asset base of Ngäti<br />
Tüwharetoa has not been included as part of<br />
the <strong>Te</strong> Arawa waka.<br />
The Waiariki rohe encompasses the territorial<br />
authorities of the Western Bay of Plenty<br />
District, Tauranga City, Rotorua District,<br />
Whakatäne District, Kawerau District, and<br />
Opotiki District.<br />
The present strength of Mäori in the Waiariki<br />
rohe is their asset base. This asset base is<br />
currently concentrated in the primary industry<br />
and is driven by land ownership. It has an<br />
estimated value of between $5.69 billion and<br />
$8.94 billion. Our mid-range conservative<br />
estimate is $6.63 billion. The land area of the<br />
Bay of Plenty region is 2,183,500 hectare.<br />
The land area in Waiariki owned by Mäori<br />
entities, including the Central North Island<br />
Iwi Collective is 685,000 hectare. 1 This area<br />
is 31.5 percent of the Bay of Plenty region.<br />
If investment in land ownership by these<br />
entities and the land owned by private Mäori<br />
landowners is included, the area would<br />
undoubtedly be greater than one-third of the<br />
land area of the Bay of Plenty region.<br />
These benchmark figures illustrate the significant<br />
role Mäori plays in the economy of this rohe.<br />
1.1 MÄORI BUSINESS ASSETS<br />
Our estimates of Mäori business assets rely on<br />
official data from the Statistics New Zealand<br />
2001 and 2006 Censuses of Population and<br />
Dwellings. Some of the data used in these<br />
estimates is only collected at Census time and<br />
only available for the Bay of Plenty region.<br />
Our estimates indicate Mäori businesses in the<br />
Bay of Plenty region employed nearly 1,500<br />
people who were self-employed (without<br />
employees) and approximately 5,400 employers<br />
with their employees in 2006. As a weighted<br />
average these businesses had approximately<br />
$300,000 worth of assets per person.<br />
The industries where Mäori in the Bay of<br />
Plenty region were predominantly selfemployed<br />
were property and business services,<br />
construction, agriculture, forestry and fishing,<br />
and retail trade. This trend is similar to<br />
national Mäori self-employment figures.<br />
The increase in the number of Mäori employers<br />
in the Bay of Plenty region between 2001<br />
and 2006 was also similar to national trends.<br />
1 This figure breaks down into: Mäori land incorporations 69,000 hectare; ahu whenua trusts 440,000 hectare; and CNI Iwi<br />
Collective 176,000 hectare. This figure was estimated from Mäori Land Court (MLC) data for Waiariki. BERL obtained information<br />
on individual trusts and incorporations and removed from our lists the main trusts and incorporations that are not located in the<br />
defined Waiariki area.<br />
TE PUNI KÖKIRI<br />
REPORT ON THE MÄORI ASSET BASE IN THE WAIARIKI ECONOMY
The number of Mäori employers in this region<br />
increased across all industries except mining,<br />
and electricity, gas and water supply. It is<br />
positive to see the number of Mäori employers<br />
increasing in business services and other highskilled<br />
industries.<br />
1.2 COLLECTIVELY OWNED ASSETS<br />
A substantial proportion of the asset base in<br />
this rohe is held in collective ownership through<br />
Mäori authorities, Mäori Trust Boards, Rünanga,<br />
and Treaty of Waitangi settlement entities.<br />
Mäori authorities refer to ahu whenua trusts,<br />
pütea trusts, whänau trusts, whenua töpü<br />
trusts, kai tiaki trusts, Mäori incorporations,<br />
and Mäori reservations. Of particular interest<br />
to this research are Mäori incorporations and<br />
ahu whenua trusts, which were established<br />
under <strong>Te</strong> Ture Whenua Mäori Act 1993 (the<br />
Mäori Land Act).<br />
The land administered by Mäori land<br />
incorporations and ahu whenua trusts in<br />
the Waiariki rohe totals more than 500,000<br />
hectares and is administered by approximately<br />
1,920 entities. 2<br />
We examined 12 Mäori land incorporations<br />
using a sample of annual reports and<br />
conducting interviews. This sample represents<br />
just under one quarter of the total number<br />
of Mäori land incorporations identified<br />
from the Mäori Land Court database. These<br />
incorporations have equity assets that range<br />
from just over $1.5 million to $70 million.<br />
The majority of these incorporations have<br />
diversified operations, with most having<br />
forestry interests of some sort – either as<br />
forest owners/operators, contracting forest<br />
managers or stumpage rights from leased land.<br />
Several of the incorporations run sheep and<br />
beef or dairy farms. These farms have farm<br />
managers or in the case of dairy operations<br />
share-milking arrangements. There were also<br />
examples of horticultural operations, including<br />
green and gold kiwifruit and avocado orchards.<br />
Some incorporations were also diversifying<br />
into operations that require substantial capital<br />
investment such as geothermal electricity<br />
generation or a retirement village complex to<br />
be built on incorporation land.<br />
We examined a sample of 34 annual reports<br />
from ahu whenua trusts and drew on<br />
information from study interviews on a further<br />
21 ahu whenua trusts in Waiariki. These 55<br />
trusts have equity assets that range from just<br />
over $200,000 to $115 million. The land assets<br />
owned by these trusts range from 10 hectares<br />
to 29,000 hectares. However, the location<br />
and use of this land substantially affects its<br />
monetary value.<br />
Our sample of trusts is indicative of the<br />
range of activities and asset base of the total<br />
number of trusts. However, it is difficult to<br />
estimate the total value of all trusts’ assets<br />
based on this sample. Almost one fifth of the<br />
trusts in this rohe are less than one hectare<br />
and over two fifths have between one and 19<br />
hectares. These small landholdings, and further<br />
research work completed by BERL, indicates<br />
the land may be urban land in settlements.<br />
Trusts and incorporations with urban land<br />
could have a major impact on the future<br />
development of these settlements in the<br />
Waiariki rohe.<br />
5<br />
2 This figure was estimated from MLC data for Waiariki. We obtained information on individual trusts and incorporations and<br />
removed from our lists the main trusts and incorporations that are not located in the defined Waiariki area.<br />
SUMMARY
6<br />
1.3 TREATY OF WAITANGI<br />
SETTLEMENT ASSETS<br />
At the time this report was completed, Treaty<br />
of Waitangi settlement assets in the Waiariki<br />
rohe have an approximate value of $349<br />
million. These settlements include the Central<br />
North Island Forests Iwi Collective, <strong>Te</strong> Arawa<br />
Lakes, Ngäti Tüwharetoa (Bay of Plenty), and<br />
Ngäti Awa. The value of settlement assets<br />
is easier to measure than the assets held by<br />
Mäori businesses or Mäori authorities.<br />
Pending Treaty of Waitangi settlements in the<br />
Waiariki rohe include <strong>Te</strong> Whänau-a-Apanui,<br />
Whakatöhea, and Tühoe to the east, and Ngäti<br />
Ranginui, Ngaiterangi, and Ngäti Pükenga in<br />
the west. These iwi are negotiating towards<br />
agreement in principle with the Crown, while<br />
Ngaitai are in the pre-negotiation stage with<br />
the Crown. The settlement of these claims<br />
could potentially add another $100million to<br />
the economy.<br />
Although these iwi and their associated Mäori<br />
Trust Boards or Rünanga have not settled<br />
claims with the Crown they have embarked on<br />
economic development projects. These projects<br />
are expected to gain momentum when the<br />
settlement assets become available.<br />
In addition, Ngäti Ranginui, Ngaiterangi,<br />
Whakatöhea, Tühoe, and Ngaitai are<br />
recognised Mandated Iwi Organisation (MIO)<br />
and have received their allocated fisheries<br />
assets. <strong>Te</strong> Whänau-a-Apanui has to date not<br />
joined this framework.<br />
1.4 NETWORKS AND<br />
COLLABORATION<br />
Mäori networks in the Waiariki rohe have a<br />
social and economic focus. These networks<br />
are often provided by Rünanga, iwi authorities<br />
or a Mäori Trust Board, but they may also be<br />
professional organisations representing the<br />
interests of a group of employers. Networks<br />
in this area may also involve collaborations<br />
between iwi.<br />
While we have not been able to provide an<br />
estimated value for these organisations, it is<br />
important to note the contribution they make<br />
to the social and economic well-being of their<br />
iwi and hapü members. Organisations like<br />
these will play a key role in informing future<br />
economic development plans that will enable<br />
Mäori self-determination and influence within<br />
and beyond the Waiariki rohe.<br />
1.5 OPPORTUNITIES FOR GROWTH<br />
Over the last 10 years many Mäori land<br />
incorporations and ahu whenua trusts in<br />
the Waiariki rohe have begun to receive<br />
an income from their farm and/or forestry<br />
interests, and new settlement entities have<br />
received financial and commercial redress. The<br />
assets of Mäori entities have therefore shifted<br />
from being relatively small to corporate<br />
sized. This has created a challenge in terms<br />
of distributing income, and managing and<br />
growing the asset.<br />
Previously many Mäori land incorporations<br />
and ahu whenua trusts have not made<br />
distributions to their owners. Now income is<br />
being generated and owners expect to receive<br />
something from their land. However, many<br />
Mäori land incorporations and ahu whenua<br />
trusts do not have procedures in place to deal<br />
with this, and this process will become more<br />
complicated in the future due to succession.<br />
Post-settlement governance entities are<br />
also grappling with the issue of distribution,<br />
and many have established social service<br />
TE PUNI KÖKIRI<br />
REPORT ON THE MÄORI ASSET BASE IN THE WAIARIKI ECONOMY
usinesses that focus on well-being.<br />
Mäori in the Waiariki rohe are therefore<br />
beginning to think strategically about<br />
managing and growing their asset base.<br />
Questions are being posed as to how this<br />
asset base can provide long-term social and<br />
economic benefits, particularly employment.<br />
These questions have a long-term<br />
intergenerational viewpoint and the answers<br />
are being posed as frameworks and project<br />
plans that indicate the steps necessary to<br />
achieve self determination.<br />
Mäori land incorporations and ahu whenua<br />
trusts have predominantly been conservative<br />
in their business investments in the past.<br />
Now, several of these entities have money<br />
to invest and are considering a wide variety<br />
of options. Some are investing in stock and<br />
improvements; some are investing in other<br />
land-based businesses such as kiwifruit or<br />
avocado orchards; some are moving from<br />
receiving rents and stumpage to managing the<br />
forest. As such, Mäori in the Waiariki rohe are<br />
moving from being passive rent receivers to<br />
active business operators and partners.<br />
This movement into business operations also<br />
means Mäori are getting involved in different<br />
parts of the value chain such as growing,<br />
marketing, processing, transport and logistics,<br />
and selling. One example of this is <strong>Te</strong> Awanui<br />
Huka Pak, a pack house and cool storage<br />
facility for kiwifruit and avocados.<br />
As a result of this strategic thinking a<br />
shift is slowly occurring within the current<br />
trustee governance model, and a more<br />
diverse leadership that spans representation,<br />
skills, age and gender is being introduced.<br />
This shift is occurring due to recognition<br />
from the current incumbents that the role<br />
and expectations of trustees is changing,<br />
particularly as trustees now need to take an<br />
active strategic leadership role. Further, there<br />
is the opportunity for the current incumbents<br />
to work with others to pass on knowledge,<br />
build leadership and in turn further grow the<br />
asset base for future generations.<br />
This governance model and the issues trustees<br />
are grappling with in many ways contrast with<br />
the governance of settlement entities. These<br />
entities are not overcoming legacy issues; they<br />
offer Mäori the opportunity to inject a new set<br />
of skills and diversity into tribal groups; and<br />
build on initiatives such as Futures Planning<br />
and education scholarships.<br />
The challenge now is to find and attract<br />
people home and reverse the diaspora. This<br />
could be facilitated through the creation of<br />
employment opportunities and sustainable<br />
communities that are well resourced with<br />
infrastructure and facilities.<br />
1.6 LOOKING AHEAD<br />
Land use information is considered key to<br />
many groups, particularly as the asset base is<br />
currently concentrated in the primary industry<br />
and land ownership. 3 Land use information<br />
has the potential to unlock unproductive land<br />
and open up marginal land. Water and road<br />
access often restricts land use and land value.<br />
Land use information could allow ahu whenua<br />
trusts and Mäori land incorporations to work<br />
together to resolve these issues. It could also<br />
provide direction on how to utilise the land<br />
to its greatest potential and take advantage<br />
of future opportunities. It could also enable<br />
7<br />
3 The primary industry includes agriculture, forestry, fishing and mining.<br />
SUMMARY
8<br />
informed decision-making about partnerships<br />
and collaborations with other groups that are<br />
involved in strategies such as carbon farming,<br />
geothermal, eco-tourism or horticulture.<br />
This report demonstrates, at a broad level,<br />
the significance of Mäori in the economic<br />
development of Waiariki, and the role Mäori<br />
can play in influencing economic change<br />
and direction in this area. It should be used<br />
in conjunction with other strategies and<br />
economic development projects that are being<br />
undertaken such as the three year action plan<br />
that is part of the Bay of Plenty Regional<br />
Strategy. This strategy considers Mäori<br />
economic development and land use a high<br />
priority for the Bay of Plenty region.<br />
This report is also a platform for further<br />
investigation. It should encourage further<br />
investigation and discussion between<br />
members of the Bay of Plenty Mäori<br />
Economic Development Reference Group<br />
and other groups in the rohe such as district<br />
and city councils, settlement entities, ahu<br />
whenua trusts, incorporations, professional<br />
organisations and networks, and other<br />
stakeholders in the primary industry.<br />
This report, and the projects highlighted in<br />
the Bay of Plenty Regional Strategy, illustrates<br />
areas where Mäori can work with partner<br />
agencies to meet current and future economic<br />
opportunities.<br />
Mäori are a sleeping giant in the Waiariki rohe<br />
but a paradigm shift is occurring. While the<br />
asset base is currently concentrated in the<br />
primary industry, there are clear indications<br />
of increasing diversification to high value<br />
investment decisions. This paradigm shift is<br />
being driven by land ownership, but ongoing<br />
settlements with the Crown are also changing<br />
the mix of assets. Further investigation of the<br />
productive use and value of these assets will<br />
see the giant awaken in this rohe, and Mäori<br />
generate the skills and knowledge required for<br />
continuous social and economic evolution.<br />
TE PUNI KÖKIRI<br />
REPORT ON THE MÄORI ASSET BASE IN THE WAIARIKI ECONOMY
2. INTRODUCTION<br />
This report has been prepared by Business and<br />
Economic Research Limited (BERL) for the<br />
Bay of Plenty Mäori Economic Development<br />
Reference Group (the Reference Group).<br />
The purpose of this report will be to:<br />
• Provide a quantitative description of the<br />
current Mäori economy and asset base<br />
• Identify opportunities that may provide<br />
significant strategic growth and<br />
development for Mäori in this area<br />
• Provide qualitative information on key<br />
organisations and existing or potential<br />
linkages that can and should be leveraged<br />
as part of any further strategies<br />
• Act as a platform for further research by<br />
identifying gaps, opportunities, and areas<br />
for further investigation and research.<br />
The knowledge, information researched and<br />
analyses will also provide Mäori with the<br />
opportunity to obtain leverage within the<br />
Bay of Plenty Regional Strategy. This regional<br />
strategy is sub-titled An Economic Growth<br />
Strategy for a Sustainable Future, and is<br />
relevant to the assets, aims and aspirations of<br />
Mäori communities and iwi in the Bay of Plenty.<br />
The asset base of the following iwi were<br />
examined: <strong>Te</strong> Whänau-a-Apanui, Ngaitai,<br />
Whakatöhea, Tühoe, Ngäti Awa, Ngäti<br />
Tüwharetoa (Bay of Plenty), Ngäti Pükenga,<br />
Ngaiterangi, Ngäti Ranginui, Ngäti Pikiao,<br />
Ngäti Rangiteaorere, Ngäti Rangitihi, Ngäti<br />
Rangiwewehi, Tapuika, Tühourangi, Waitaha,<br />
and Ngäti Whakaue. The asset base of Ngäti<br />
Tüwharetoa has not been included as part of<br />
the <strong>Te</strong> Arawa waka.<br />
The Waiariki rohe encompasses the territorial<br />
authorities of the Western Bay of Plenty<br />
district, Tauranga City, Rotorua District,<br />
Whakatäne District, Kawerau District, and<br />
Öpötiki District.<br />
The asset base of Mäori in the Waiariki rohe<br />
was identified, analysed and measured to<br />
illustrate the significant role Mäori plays<br />
in the economy of this rohe. This asset<br />
base is split into three components: Mäori<br />
business assets, collectively owned assets,<br />
and settlement assets. Section 3 provides our<br />
overall assessment of the asset base value.<br />
Mäori business assets are discussed in Section 4.<br />
This section discusses Mäori businesses and<br />
their assets in the Bay of Plenty region in<br />
2006, and the growth in Mäori businesses<br />
nationally from 2001 and 2006. Section 5<br />
discusses collectively owned Mäori assets such<br />
as those owned by Mäori land incorporations<br />
and ahu whenua trusts. Recent Treaty of<br />
Waitangi settlements have added to the asset<br />
base of Mäori in the Waiariki rohe. These<br />
settlements are discussed in Section 6 and<br />
include land, forestry, fisheries and geothermal<br />
settlement assets. Section 7 discusses<br />
networks and collaborations that are in place<br />
in the Waiariki rohe. Section 8 discusses<br />
opportunities for growth in the Waiariki<br />
rohe while Section 9 and 10 includes a brief<br />
methodology section and social and economic<br />
demographics of Mäori in the Waiariki rohe.<br />
These demographics are from official data<br />
sources and provide a snapshot of Mäori in<br />
this area in 2006.<br />
9<br />
INTRODUCTION
3. OVERALL ASSESSMENT OF ASSET BASE VALUE<br />
10<br />
This report assesses the value of the Mäori<br />
asset base in the Waiariki economy. Table 3.1<br />
summarises this assessment.<br />
This report is a platform for further<br />
investigation. The range between $5.69 and<br />
$8.93 billion is a benchmark and provides a<br />
broad indication of the current Mäori asset<br />
base. Our mid-range, conservative estimate is<br />
$6.63 billion. These figures demonstrate, at a<br />
broad level, the significance of Mäori in the<br />
economic development of Waiariki, and the<br />
role Mäori can play in influencing economic<br />
change and direction in this area.<br />
There are no good estimates in New Zealand<br />
of total asset values by region, let alone rohe.<br />
However, the share of land ownership by<br />
Mäori gives one indication of the importance<br />
of Mäori in the Waiariki economy.<br />
TABLE 3.1: TOTAL ESTIMATED VALUE OF MÄORI ASSETS IN THE WAIARIKI ECONOMY, AS AT 2009<br />
Asset holder<br />
Estimated value ($m)<br />
Land trusts and incorporations 2,500 - 5,700<br />
Mäori businesses 2,262<br />
CFL settlements 562<br />
Settlement entities - non-fisheries 349<br />
- <strong>Te</strong> Ohu Kai Moana 66<br />
Total 5,690 - 8,930<br />
Source: BERL<br />
The total land area of the Bay of Plenty region<br />
is 2,183,500 hectares. 4 The land area owned by<br />
Mäori entities in Waiariki is 685,000 hectares. 5<br />
This area is 31.5 percent of the Bay of Plenty<br />
region. If investment in land ownership by<br />
these entities and the land owned by private<br />
Mäori landowners is included, the area would<br />
undoubtedly be greater than one-third of the<br />
land area of the Bay of Plenty region.<br />
In brief, our assessment shows that the Mäori<br />
asset base is:<br />
• substantial and potentially much greater<br />
than previous estimates.<br />
• currently concentrated in the primary<br />
industry, but there are clear indications<br />
of increasing diversification to high<br />
value investment destinations, such as<br />
geothermal energy, boutique farming,<br />
aquaculture and eco-tourism.<br />
• driven by land ownership, but ongoing<br />
settlements with the Crown are also<br />
changing the mix and management of<br />
assets that comprise the asset base.<br />
Our initial assessment draws on a range of<br />
information sources, and has involved<br />
judgement and estimation to deliver an overall<br />
total figure. This initial assessment offers an<br />
opportunity to test the assumptions and<br />
judgements used in its preparation. The assessment<br />
highlights that further work is required<br />
to investigate the productive uses and value<br />
of Mäori assets in Waiariki in order to provide<br />
an accurate estimate of the asset base.<br />
4 The Bay of Plenty region includes parts of the South Waikato District, Western Bay of Plenty District, Tauranga City, Rotorua<br />
District, Taupö District, Whakatäne District, Kawerau District, and Öpötiki District. The Waiariki rohe excludes the South Waikato<br />
District and the Taupö District.<br />
5 This figure was estimated from MLC data for Waiariki. We obtained information on individual trusts and incorporations and<br />
removed from our lists the main trusts and incorporations that are not located in the defined Waiariki area. This figure breaks<br />
down into: Mäori land incorporations 69,000 hectare; ahu whenua trusts 440,000 hectare; and Central North Island Iwi Collective<br />
176,000 hectare.<br />
TE PUNI KÖKIRI<br />
REPORT ON THE MÄORI ASSET BASE IN THE WAIARIKI ECONOMY
4. MÄORI BUSINESS ASSETS<br />
This section estimates the assets that would<br />
have been employed in Mäori businesses at<br />
the time of the 2006 Census. Some of the<br />
data used in these estimates is only collected<br />
at Census time. Also, this information is<br />
only available for the Bay of Plenty region. 6<br />
Information on small to medium sized Mäori<br />
enterprises (SMEs) has also been difficult to<br />
obtain and would be an area of further work.<br />
Our estimates indicate Mäori businesses in the<br />
Bay of Plenty region employed approximately<br />
$2,300 million worth of assets in 2006. This<br />
is based on nearly 1,500 Mäori in this region<br />
being self-employed (without employees) and<br />
approximately 5,400 Mäori being employers<br />
with employees. 7 As a weighted average, these<br />
employers had approximately $300,000 worth<br />
of assets per person in their businesses.<br />
This estimate is based on data on the average<br />
number of employees per employer in each<br />
industry, and the Annual Enterprise Survey<br />
which indicates the assets employed per<br />
employee in an industry.<br />
Employment in the Waiariki rohe has grown<br />
by 3.0 percent per annum between 1998 and<br />
2008, while employment in New Zealand has<br />
grown by 2.4 percent over the same period.<br />
Gross Domestic Product (GDP) is currently<br />
$21,964 million in the Waiariki rohe. Between<br />
1998 and 2008, GDP in the Waiariki rohe<br />
grew by 3.9 percent per annum. In New<br />
Zealand, GDP grew by 3.3 percent during the<br />
same period. 8<br />
4.1 MÄORI BUSINESSES<br />
Approximately 1,467 Mäori were selfemployed<br />
(without employees) in the Bay of<br />
Plenty region in 2006. The industries where<br />
Mäori were predominantly self-employed<br />
in were property and business services,<br />
construction, agriculture, forestry and fishing,<br />
and retail trade. 9 This trend is similar to<br />
national figures, where Mäori self-employment<br />
is concentrated in the property and business<br />
services, construction, and agriculture, forestry<br />
and fishing industries.<br />
In 2006, there were 804 Mäori employers in<br />
the Bay of Plenty region. The majority of Mäori<br />
employers were again in the construction,<br />
agriculture, forestry and fishing, retail trade,<br />
and property and business services industries.<br />
There were also a sizeable number of Mäori<br />
employers in the accommodation, cafes and<br />
restaurants, and manufacturing industries.<br />
11<br />
6 The Bay of Plenty region includes parts of the South Waikato District, Western Bay of Plenty District, Tauranga City, Rotorua<br />
District, Taupö District, Whakatäne District, Kawerau District, and Öpötiki District. The Waiariki rohe excludes the South Waikato<br />
District and the Taupö District.<br />
7 Employed in the Statistics New Zealand Census of Population and Dwellings refers to people who are aged 15 years and over,<br />
usually resident in New Zealand, and employed either full or part time.<br />
8 BERL Regional Database, March 2009.<br />
9 The industry classifications used in this research are the Australian and New Zealand Standard Industrial Classification (ANZSIC)<br />
2006. This is a hierarchical classification with four levels: divisions (the broadest level), subdivisions, groups and classes. For the<br />
purposes of this research we have examined industries at the division level. This level provides a limited number of categories that<br />
show a broad picture of the economy and is suitable for the publication of summary tables of official statistics.<br />
MÄORI BUSINESS ASSETS
12<br />
Table 4.1 illustrates the number of Mäori who<br />
were self-employed (without employees), and<br />
employers in the Bay of Plenty region and<br />
in New Zealand in 2006. This information is<br />
broken down by industry.<br />
TABLE 4.1: MÄORI SELF-EMPLOYED (WITHOUT EMPLOYEES) AND EMPLOYERS 10<br />
Nationally in 2006 approximately 14,000 Mäori<br />
were self-employed (without employees), while<br />
approximately 7,000 Mäori were employers. 11<br />
Industries* in the Bay of Plenty<br />
Mäori Self-<br />
Employed<br />
(N)<br />
Mäori Employers<br />
(N)<br />
Total NZ Mäori<br />
Self-Employed<br />
(N)<br />
Total NZ Mäori<br />
Employers<br />
(N)<br />
Agriculture, Forestry and Fishing 180 132 1,470 924<br />
Mining 0 0 12 3<br />
Manufacturing 87 54 816 456<br />
Electricity, Gas and Water Supply 3 0 21 3<br />
Construction 219 162 2,433 1,422<br />
Wholesale Trade 33 12 369 228<br />
Retail Trade 120 96 960 909<br />
Accommodation, Cafes and Restaurants 27 54 297 441<br />
Transport and Storage 69 45 654 357<br />
Communication Services 36 6 321 75<br />
Finance and Insurance 15 6 222 81<br />
Property and Business Services 249 93 2,403 969<br />
Government Administration and<br />
24 0 156 18<br />
Defence<br />
Education 39 21 423 144<br />
Health and Community Services 87 24 621 207<br />
Cultural and Recreational Services 57 30 768 180<br />
Personal and Other Services 96 33 846 312<br />
Not Elsewhere Included 123 36 1,212 324<br />
Total All Industries 1,467 804 14,007 7,062<br />
Source: Statistics New Zealand 2006 Census of Population and Dwellings<br />
*Industries=ANZSIC96 v1.0<br />
10 The total in this table may differ from the sum of the components due to random rounding. Statistics New Zealand randomly<br />
rounds to base three to protect confidentiality. Individual figures may therefore not add up to totals and values for the same data<br />
may differ between tables.<br />
11 Some of the zeros in this table may be c (confidential) rather than zero people employed in an industry.<br />
TE PUNI KÖKIRI<br />
REPORT ON THE MÄORI ASSET BASE IN THE WAIARIKI ECONOMY
4.1.1 Growth in Mäori businesses<br />
nationally 2001 to 2006<br />
The increase in the number of Mäori selfemployed<br />
(without employees) from 2001<br />
and 2006 was substantially greater than the<br />
number of self-employed in all ethnicities.<br />
The number of Mäori self-employed grew<br />
by 21 percent during this period, while the<br />
increase for all ethnicities was 10 percent.<br />
13<br />
TABLE 4.2: CHANGES IN NEW ZEALAND SELF-EMPLOYED (WITHOUT EMPLOYEES) BUSINESSES<br />
Industry (ANZSIC96)<br />
Total number of Mäori self-employed<br />
without employees<br />
Total number of All Ethnic self-employed<br />
without employees<br />
2001 2006 Change 01-06 2001 2006 Change 01-06<br />
(number) (%) (number) (%)<br />
All industries 11,565 14,007 2,442 21 213,117 234,954 21,837 10<br />
A Agriculture, Forestry & Fishing 1,500 1,470 -30 -2 37,632 32,700 -4,932 -13<br />
B Mining 12 12 0 0 171 207 36 21<br />
C Manufacturing 816 816 0 0 15,708 13,782 -1,926 -12<br />
D Electricity, Gas & Water Supply 24 21 -3 -13 318 765 447 141<br />
E Construction 1,887 2,433 546 29 26,370 31,848 5,478 21<br />
F Wholesale Trade 309 369 60 19 7,824 7,260 -564 -7<br />
G Retail Trade 822 960 138 17 18,951 14,007 -4,944 -26<br />
H Accommodation, Cafes & Restaurants 258 297 39 15 4,464 6,765 2,301 52<br />
IJ Transport, Storage & Communication 1,056 975 -81 -8 10,596 14,619 4,023 38<br />
K Finance & Insurance 171 222 51 30 4,131 4,980 849 21<br />
L Property & Business Services 1,608 2,403 795 49 36,933 53,769 16,836 46<br />
M Government Administration & Defence 156 156 2,556 2,556<br />
N Education 324 423 99 31 5,169 6,645 1,476 29<br />
O Health & Community Services 399 621 222 56 7,518 10,083 2,565 34<br />
P Cultural & Recreational Services 588 768 180 31 7,395 5,385 -2,010 -27<br />
Q Personal & Other Services 639 846 207 32 10,227 11,511 1,284 13<br />
R Not Elsewhere Included 1,155 1,212 57 5 19,701 18,078 -1,623 -8<br />
Total 11,568 14,007 2,439 21 213,117 234,954 21,837 10<br />
Source: Statistics New Zealand 2001 and 2006 Censuses of Population and Dwellings<br />
The increase in the number of Mäori employers<br />
between 2001 and 2006 was similarly larger<br />
than the increase in the number of employers<br />
in all ethnicities. In this case, the number of<br />
Mäori employers increased by 28 percent and<br />
the number of employers in all ethnicities<br />
increased by 10 percent.<br />
MÄORI BUSINESS ASSETS
14<br />
TABLE 4.3: CHANGES IN NEW ZEALAND EMPLOYERS’ BUSINESSES<br />
Industry (ANZSIC96) Total number of Mäori employers Total number of All Ethnic employers<br />
2001 2006 Change 01-06 2001 2006 Change 01-06<br />
(number) (%) (number) (%)<br />
All industries 5,526 7,062 1,536 28 129,633 142,884 13,251 10<br />
A Agriculture, Forestry & Fishing 876 924 48 5 22,521 21,426 -1,095 -5<br />
B Mining 6 3 -3 -50 117 123 6 5<br />
C Manufacturing 444 456 12 3 13,290 13,275 -15 0<br />
D Electricity, Gas & Water Supply 9 3 -6 -67 48 363 315 656<br />
E Construction 792 1,422 630 80 13,638 19,866 6,228 46<br />
F Wholesale Trade 192 228 36 19 7,158 7,206 48 1<br />
G Retail Trade 777 909 132 17 23,025 15,738 -7,287 -32<br />
H Accommodation, Cafes & Restaurants 363 441 78 21 7,524 10,818 3,294 44<br />
IJ Transport, Storage & Communication 396 432 36 9 4,872 5,358 486 10<br />
K Finance & Insurance 60 81 21 35 1,959 2,388 429 22<br />
L Property & Business Services 648 969 321 50 17,808 24,216 6,408 36<br />
M Government Administration & Defence 18 18 702 702<br />
N Education 123 144 21 17 1,320 1,689 369 28<br />
O Health & Community Services 174 207 33 19 5,991 5,541 -450 -8<br />
P Cultural & Recreational Services 117 180 63 54 1,764 1,500 -264 -15<br />
Q Personal & Other Services 258 312 54 21 4,143 8,775 4,632 112<br />
R Not Elsewhere Included 297 324 27 9 4,455 3,903 -552 -12<br />
Total 5,526 7,062 1,536 28 129,633 142,884 13,251 10<br />
Source: Statistics New Zealand 2001 and 2006 Censuses of Population and Dwellings<br />
From 2001 and 2006, the number of Mäori<br />
employers increased across all industries<br />
except mining, and electricity gas and water<br />
supply. It is positive to see Mäori employers<br />
increasing in business services and other<br />
high-skill industries. The large increase in<br />
construction was also good at the time, but<br />
unfortunately construction was somewhat<br />
overheated and is presently contracting.<br />
It would be useful to compare this to the<br />
effects in the Bay of Plenty region as a<br />
whole. Unfortunately the data for 2001 is<br />
not available by region, so we are unable to<br />
explore in detail the changes in the Bay of<br />
Plenty Region from 2001 and 2006.<br />
TE PUNI KÖKIRI<br />
REPORT ON THE MÄORI ASSET BASE IN THE WAIARIKI ECONOMY
We can however look at the industry profile<br />
of people who were self-employed (without<br />
employees) and employers in 2006 to see if<br />
the pattern in the Bay of Plenty region differs<br />
from that of all Mäori in New Zealand.<br />
Generally speaking the industry profile of Bay of<br />
Plenty Mäori and all New Zealand Mäori is quite<br />
similar to that for New Zealand as a whole.<br />
15<br />
TABLE 4.4: INDUSTRY PROFILE OF BUSINESSES, BAY OF PLENTY REGION AND NEW ZEALAND 12<br />
Industry (ANZSIC06 Vol 1) Industry profile for Self-employed and Employers Census 2006<br />
Bay of Plenty Mäori All New Zealand Mäori New Zealand all Ethnicities<br />
Self-employed Employers Self-employed Employers Self-employed Employers<br />
All industries total (N) 1,467 804 14,007 7,062 234,954 142,884<br />
A Agriculture, Forestry & Fishing (%) 12 16 10 13 14 15<br />
C Manufacturing (%) 6 7 6 6 6 9<br />
E Construction (%) 15 20 17 20 14 14<br />
F Wholesale Trade (%) 2 1 3 3 3 5<br />
G Retail Trade (%) 8 12 7 13 6 11<br />
H Accommodation, Cafes &<br />
2 7 2 6 3 8<br />
Restaurants (%)<br />
IJ Transport, Storage &<br />
7 6 7 6 6 4<br />
Communication (%)<br />
K Finance & Insurance (%) 1 1 2 1 2 2<br />
L Property & Business Services (%) 17 12 17 14 23 17<br />
M Government Administration &<br />
2 0 1 0 1 0<br />
Defence (%)<br />
N Education (%) 3 3 3 2 3 1<br />
O Health & Community Services (%) 6 3 4 3 4 4<br />
P Cultural & Recreational Services (%) 4 4 5 3 2 1<br />
Q Personal & Other Services (%) 7 4 6 4 5 6<br />
R Not Elsewhere Included (%) 8 4 9 5 8 3<br />
Total (%) 100 100 100 100 100 100<br />
Source: Statistics New Zealand 2006 Census of Population and Dwellings<br />
12 Some of the zeros in this table may be c (confidential) rather than zero people employed in an industry.<br />
MÄORI BUSINESS ASSETS
5. COLLECTIVELY OWNED ASSETS<br />
16<br />
Government policy and legislation has shaped<br />
the ownership and governance arrangements<br />
around the Mäori asset base in the Waiariki<br />
rohe. As such a substantial proportion of the<br />
asset base in this area is held in collective<br />
ownership through Mäori authorities such as<br />
trusts and incorporations, Rünanga, and Treaty<br />
settlement entities.<br />
Mäori authorities refer to ahu whenua trusts,<br />
pütea trusts, whänau trusts, whenua topu<br />
trusts, kai tiaki trusts, Mäori incorporations,<br />
and Mäori reservations. Of particular interest<br />
to this research are Mäori incorporations and<br />
ahu whenua trusts, which were established<br />
under <strong>Te</strong> Ture Whenua Maori Act 1993 (the<br />
Maori Land Act).<br />
Mäori land incorporations have a structure<br />
similar to a company, but their purpose is to<br />
manage Mäori freehold land on behalf of its<br />
owners. These incorporations can include one<br />
or more blocks of Mäori freehold land if at least<br />
one of the blocks has more than two owners. To<br />
establish Mäori land incorporation, landowners<br />
apply to the Maori Land Court (MLC). Once a<br />
Mäori land incorporation has been constituted,<br />
it can acquire any type of land. 13<br />
The purpose of ahu whenua trusts is to<br />
promote the use and administration of the<br />
land in the interest of their owners. 14 These<br />
trusts are managed by trustees, often a board,<br />
who manage the land on behalf of the owners.<br />
These land blocks have multiple owners,<br />
ranging from 20 to over 10,000, who are<br />
related by whakapapa. These owners have a<br />
cultural and shareholder interest in the land.<br />
Most Mäori land incorporations and ahu<br />
whenua trusts are administered by their<br />
owners as a group. However, Mäori land<br />
incorporations and ahu whenua trusts can<br />
also be administered by the Mäori Trustee, the<br />
Guardian Trust or accountants.<br />
There are also Mäori land blocks with no<br />
administration. These land blocks frequently<br />
have a lack of succession of owners, an<br />
inability to be administered or managed, and<br />
are often unproductive as a result.<br />
General land covers land that is not Mäori<br />
land that has been alienated from the Crown,<br />
and land that is no longer Crown or Mäori<br />
land and is owned by Mäori. General land is<br />
land that is owned by more than four people,<br />
of whom the majority are Mäori. 15<br />
Details on marae have not been included<br />
as part of the asset base. However, we are<br />
aware that <strong>Te</strong> <strong>Puni</strong> Kökiri is in the process<br />
of completing a marae development<br />
questionnaire. This can help marae to identify<br />
and plan for future developments; it will look<br />
at the value of the marae and taonga from a<br />
cultural point of view as well as for insurance<br />
purposes, and to generate a repairs and<br />
maintenance schedule. They will also provide<br />
further information on the asset base of Mäori<br />
in the Waiariki rohe. 16<br />
This research has focused on obtaining base<br />
13 Mäori Land Court definition. http://www.justice.govt.nz/maorilandcourt/incorpations, accessed March 2009.<br />
14 Mäori Land Court definition. http://www.justice.govt.nz/maorilandcourt/trusts, accessed March 2009.<br />
15 The legal definition of Mäori land is available on the LINZ website, http://www.linz.govt.nz/survey-titles/maori-records/what-ismaori-land/index.aspx.<br />
16 This marae information will not be shared with any third parties without the consent of marae representatives as part of<br />
privacy and data protection. Information from marae will be put together with information from other marae. The combined info<br />
will be used to produce regional and national reports. Information contained in these reports will not refer to individual mare or<br />
allow marae to be identified.<br />
TE PUNI KÖKIRI<br />
REPORT ON THE MÄORI ASSET BASE IN THE WAIARIKI ECONOMY
information on Mäori land incorporations<br />
and ahu whenua trusts. This information is<br />
available from the MLC for Waiariki. We have<br />
obtained information on individual trusts and<br />
incorporations, and have removed from our<br />
lists the main trusts and incorporations that<br />
are not located in the defined Waiariki area.<br />
The land administered by Mäori land incorporations<br />
and ahu whenua trusts in the Waiariki<br />
rohe totals more than 500,000 hectares and is<br />
administered by approximately 1,920 entities.<br />
5.1 MÄORI LAND INCORPORATIONS<br />
Summary information on Mäori land<br />
incorporations in the Waiariki rohe is available<br />
from the MLC database. This information,<br />
shown in Table 5.1 below, illustrates that<br />
land blocks administered by Mäori land<br />
incorporations in Waiariki are mostly<br />
large enough for economic farm, forest or<br />
horticultural production units.<br />
17<br />
TABLE 5.1: MÄORI LAND INCORPORATIONS IN WAIARIKI MÄORI LAND COURT DISTRICT<br />
Area range<br />
Total area<br />
Number of Incs<br />
Average area per Inc<br />
(ha)<br />
(ha)<br />
(ha)<br />
1,000+ 62,504.7 17 3,676.7<br />
100 to 999 5,418.8 16 338.7<br />
20 to 99 670.7 14 47.9<br />
1 to 19 78.3 8 9.8<br />
Under 1 0.0 0 na<br />
Total 68,672.5 55 1,248.6<br />
Source: Mäori Land Court<br />
Note: Incorporations have been deleted from the MLC list where:<br />
1) the names/number of the two entries are identical, one being "The Proprietors of.." and the other being the name/number; and<br />
2) the land areas of the two entries are identical to four decimal places.<br />
From this summary information we examined a<br />
total of 12 Mäori incorporations using a sample<br />
of annual reports and conducting interviews.<br />
This sample represents just under one quarter of<br />
the total number of Mäori land incorporations<br />
identified from the MLC database.<br />
These incorporations have equity assets that<br />
range from just over $1.5 million to $70 million.<br />
One incorporation has just under 100 hectares<br />
of vested land, eight have between 100 and 999<br />
hectares and three incorporations have land<br />
that is over 1,000 hectares in size. Collectively,<br />
the assets of these 12 incorporations amount to<br />
just under $251 million.<br />
5.1.1 Mäori land incorporation<br />
activities<br />
The majority of the incorporations examined<br />
have diversified operations; with most having<br />
forestry interests of some sort – either as<br />
forest owners/operators, contracting forest<br />
managers or stumpage rights from leased<br />
land. Several of the incorporations run sheep<br />
and beef or dairy farms, using either farm<br />
managers or in the case of dairy operations<br />
share-milking arrangements. There were also<br />
examples of horticultural operations, including<br />
green and gold kiwifruit and avocado orchards.<br />
Some incorporations were also diversifying<br />
COLLECTIVELY OWNED ASSETS
18<br />
into operations that require substantial capital<br />
investment such as geothermal electricity<br />
generation or retirement village complexes<br />
built on incorporation land.<br />
Another area that incorporations and trusts<br />
have moved into is eco-tourism involving<br />
guided tours and overnight stays in lodges in<br />
forested areas. These lodges can be rented out<br />
to corporate, tour and school groups as well<br />
as members of the incorporation or trust. One<br />
outcome of incorporations and trusts becoming<br />
involved in the restoration and protection of<br />
flora and fauna as well as wetland areas has<br />
been the expansion of tours that allow people<br />
to see the wetlands, flora and fauna, and<br />
witness the conservation of bird life.<br />
Some incorporations and trusts are also<br />
considering building walkways in reserve<br />
areas, and there is a proposal for a coastal trail<br />
around the Bay of Plenty region where people<br />
stay overnight at marae.<br />
Some trusts and incorporations have<br />
purchased blocks of land as investment<br />
properties that they have then sold and<br />
used this money to purchase shares in<br />
tourist ventures. One example of this is an<br />
incorporation purchasing shares in Kiwi360.<br />
Kiwi360 is a tourist venture in <strong>Te</strong> Puke that<br />
focuses on the kiwifruit industry.<br />
5.2 AHU WHENUA TRUSTS<br />
Summary information on ahu whenua land<br />
trusts in Waiariki, from the MLC database,<br />
shows that some trusts administering very<br />
large areas of land are presumably operating<br />
as forest and farm production units. There<br />
are also a large number of ahu whenua<br />
trusts administering very small areas of land.<br />
These small blocks of land may be residential<br />
sections in urban areas that are either vacant<br />
or have housing on them.<br />
TABLE 5.2: AHU WHENUA TRUSTS IN WAIARIKI MÄORI LAND COURT DISTRICT<br />
Area range<br />
Total area<br />
Number of Trusts<br />
Average area per Trust<br />
(ha)<br />
(ha)<br />
(ha)<br />
1,000 345,502.8 51 6,774.6<br />
100 to 999 67,415.0 232 290.6<br />
20 to 99 20,153.3 429 47.0<br />
1 to 19 6,697.7 824 8.1<br />
Under 1 94.9 337 0.3<br />
Total 439,863.8 1,873 234.8<br />
Source: Mäori Land Court<br />
Note: Duplicate entries for have been removed where:<br />
1) block names are identical;<br />
2) trust names include the same block description +/- 'Ahu Whenua' etc;<br />
3) land areas are identical to four decimal places.<br />
We examined a sample of 34 annual reports<br />
and drew on information from study interviews<br />
with a further 21 ahu whenua trusts in<br />
Waiariki. These 55 trusts have equity assets that<br />
range from just over $200,000 to $115 million.<br />
The land assets owned by these trusts range<br />
from 10 hectares to 29,000 hectares. The<br />
location and use of this land, however,<br />
substantially affects its monetary value. For<br />
example, Pukeroa Oruawhata Ahu Whenua<br />
TE PUNI KÖKIRI<br />
REPORT ON THE MÄORI ASSET BASE IN THE WAIARIKI ECONOMY
Trust holds approximately 20 hectares of land,<br />
predominantly in central Rotorua, and the<br />
Trust’s equity amounts to over $100 million.<br />
However, the average land value for trusts<br />
with farming operations on rural land is just<br />
over $71,000 per hectare. The collective equity<br />
value of these trusts was over $586 million.<br />
Examining the wider set of ahu whenua trusts<br />
that were not specifically identified through<br />
our annual report review and interviews is an<br />
area for further work.<br />
5.2.1 Ahu whenua trust activities<br />
The majority of trusts in this area have<br />
diversified operations. Almost half have farming<br />
and forestry interests, with two thirds having<br />
either farm or forestry operations. Other trusts<br />
are involved in horticulture, aquaculture,<br />
property or other financial investments, and a<br />
small number in geothermal power generation.<br />
Also, some trusts have used the revenue<br />
they have gained from woodlots to purchase<br />
commercial property.<br />
Table 5.3 indicates the type of commercial<br />
operations the trusts in the annual report<br />
sample are involved in. As some trusts are<br />
involved in several activities, a single trust<br />
may be counted more than once in different<br />
categories. For example, a trust with farm<br />
and forest operations will be counted twice,<br />
therefore the number of trusts does not sum<br />
to the annual report sample total of 34.<br />
19<br />
TABLE 5.3: AHU WHENUA TRUST OPERATIONAL ACTIVITIES IN WAIARIKI<br />
Commercial operations<br />
Number of Trusts<br />
Farming 14<br />
Forestry 14<br />
Horticulture 3<br />
Aquaculture 1<br />
Property 8<br />
Geothermal 6<br />
Investment 6<br />
Unknown 7<br />
Source: BERL interviews, annual reports 2006 to 2008.<br />
This sample of trusts is indicative of the<br />
range of activities and asset base of the total<br />
number of trusts. However, it is difficult to<br />
estimate the total value of all trusts’ assets<br />
based on this sample. This is because there<br />
are a large number of small trusts (almost one<br />
fifth have less than one hectare and over two<br />
fifths have between one and 19 hectare), so it<br />
is difficult to extrapolate from what we know<br />
to these other trusts.<br />
5.2.2 Urban land development<br />
Some of the larger ahu whenua trusts have<br />
embarked on substantial urban development.<br />
These include Pukeroa Oruawhata Ahu Whenua<br />
Trust in Rotorua and Poripori Trust in Tauranga.<br />
The latter is in the process of developing a<br />
substantial farmers market at <strong>Te</strong> Puna.<br />
However, the many smaller trusts and incorporations<br />
with urban land can have a major<br />
impact on the nature of the development<br />
COLLECTIVELY OWNED ASSETS
20<br />
of smaller settlements in the Waiariki rohe.<br />
The range of settlements with significant<br />
ownership by ahu whenua trusts in this<br />
rohe include Mourea, Otaramarae, Matatä,<br />
FIGURE 1: BAY OF PLENTY SETTLEMENT HIERARCHY<br />
Bay of Plenty Region: Settlement Hierarchy<br />
(for the Census Usually Resident Population Count ('000), 2001)<br />
Level 1a Level 1b Regional Centres Towns Rural Centres<br />
Katikati<br />
2.9<br />
Waihi Beach<br />
1.9<br />
<strong>Te</strong> Puke<br />
6.7<br />
Maketü<br />
1.0<br />
Tokoroa<br />
14.3<br />
Putaruru<br />
3.7<br />
Paengaroa<br />
0.8<br />
Murupara<br />
1.9<br />
Kaingaroa<br />
0.5<br />
Tauranga<br />
96.3<br />
Rotorua<br />
56.3<br />
Taupö<br />
22.6<br />
Türangi<br />
3.6<br />
Edgecumbe<br />
1.9<br />
Matatä<br />
0.7<br />
Kawerau<br />
6.9<br />
<strong>Te</strong> <strong>Te</strong>ko<br />
0.6<br />
Whakatäne<br />
18.0<br />
Täneatua<br />
0.8<br />
Waimana<br />
0.7<br />
Öpötiki<br />
3.9<br />
<strong>Te</strong> Kaha<br />
0.4<br />
Source: Population from Census 2001<br />
TE PUNI KÖKIRI<br />
REPORT ON THE MÄORI ASSET BASE IN THE WAIARIKI ECONOMY
Maketü, Rangitaiki, Waioeka, Opape, <strong>Te</strong> Kaha,<br />
Whakarewarewa and Owhata.<br />
Previous work completed by BERL in the Bay of<br />
Plenty region indicates the importance of settlements<br />
where Mäori entities have land. 17 As an<br />
example, we have attached a settlement hierarchy<br />
for the Bay of Plenty region from Chapter 5 of<br />
a BERL Report entitled Bay of Plenty Region<br />
Economic Transformation: Stage 1: Situation<br />
Analysis. This report was submitted to the<br />
Community Outcomes Bay of Plenty – Economic<br />
Transformation Sub-group in May 2007.<br />
This settlement hierarchy uses data from<br />
Statistics New Zealand’s 2001 Census of<br />
Population and Dwellings and could be<br />
updated. However, for now it illustrates the<br />
interrelationships between settlements in the<br />
region and the importance of these relationships.<br />
In particular it shows how smaller settlements<br />
rely on larger settlements for specialist trades<br />
and professional services. This in turn makes<br />
the smaller settlements and their hinterlands<br />
important in providing clients for the services<br />
available from the larger settlements.<br />
This settlement hierarchy also demonstrates<br />
the significant influence ahu whenua trusts<br />
could exert in these settlements and the<br />
positive role they could play in influencing<br />
economic change in the Waiariki rohe.<br />
As mentioned above, those settlements with<br />
significant ownership by ahu whenua trusts<br />
are in areas where the land value is high and<br />
there is the potential for this land value to<br />
grow in the future as the population grows,<br />
infrastructure such as roading improves, and<br />
services expand.<br />
While not an ahu whenua trust, work being<br />
completed by the Tauranga Moana Mäori<br />
Trust Board illustrates the positive role that<br />
trusts could play in influencing economic<br />
change in the Waiariki rohe. This trust<br />
board has recognised the urgent need to<br />
provide affordable housing for people in the<br />
Tauranga Moana area. To date their research<br />
indicates that there is a large mass of multiple<br />
owned Mäori freehold land in the Tauranga<br />
Moana area with the potential for housing<br />
development; there is a growing Mäori<br />
population with housing needs; and that loan<br />
funds to build housing on multiple owned<br />
Mäori land is very limited and does not include<br />
funding for infrastructure costs.<br />
As such, the trust board is now working with<br />
Housing Corporation New Zealand, owners of<br />
Mäori land and members of their trust board to<br />
provide a flexible home lending package that<br />
will allow Mäori to build and own homes on<br />
multiple owned Mäori land in Tauranga Moana.<br />
There is also the potential for ahu whenua<br />
trusts to get involved in urban development<br />
and planning, and decision-making regarding<br />
community services and facilities.<br />
Trusts in <strong>Te</strong> <strong>Te</strong>ko and Kawerau are already<br />
considering the provision of community<br />
services such as landfills, worm farms,<br />
composting and recycling to process a diverse<br />
range of local waste products such as paper<br />
fibre waste, human effluent, and animal<br />
effluent. These are all very viable options<br />
compared to the transporting of rubbish from<br />
the Bay of Plenty to the Waikato region.<br />
Another area of potential involvement by ahu<br />
whenua trusts is light industrial or commercial<br />
development in settlements such as Kawerau.<br />
These developments may involve collaboration<br />
with the district councils or others working<br />
with other trusts and incorporations in joint<br />
venture operations.<br />
21<br />
17 BERL. (2007). Bay of Plenty Region Economic Transformation: Stage 1: Situation Analysis.<br />
COLLECTIVELY OWNED ASSETS
22<br />
5.3 MÄORI LAND INCORPORATION<br />
AND AHU WHENUA TRUST ASSET<br />
ESTIMATES<br />
Table 5.4 summarises a range of research on<br />
Mäori land incorporations and ahu whenua<br />
trust asset values. The last two entries are based<br />
on BERL’s research for this report. Caveats<br />
around our review of the annual reports of the<br />
selected trusts and incorporations are discussed<br />
in more detail below. The final entry is based on<br />
MLC information and BERL estimates.<br />
TABLE 5.4: MÄORI LAND TRUSTS AND INCORPORATIONS - ASSET VALUE ESTIMATES<br />
Source Scope Land area<br />
(ha)<br />
Estimated value<br />
($m)<br />
Tahana Ltd (2006) 1 25 trusts and incorporations 350- 450<br />
<strong>Te</strong> <strong>Puni</strong> Kökiri (2007) 2 18 trusts and incorporations 25,000 400<br />
Annual report review land trusts 74,350 688.7<br />
and interviews 3 12 incorporations 10,230 250.9<br />
BERL estimate 4 1,873 land trusts 439,860 2,000 - 4,910<br />
55 incorporations 68,670 460 -790<br />
Note: The sources use information from different years between 2006 and 2008.<br />
Source:<br />
1 Tahana Ltd (2006) Tukua Mai Kia Piri <strong>Te</strong> Arawa E<br />
2 <strong>Te</strong> <strong>Puni</strong> Kökiri (2007) <strong>Te</strong> Arawa Land Trusts & Incorporations.<br />
3 BERL review of Ahu Whenua and Incorporation annual reports and study interviews<br />
4 BERL estimate of value of Mäori Land Court registered land<br />
The table above includes an order-ofmagnitude<br />
estimate of the total value of<br />
trust and incorporation assets. This estimate<br />
includes values derived from BERL’s annual<br />
report review and interviews, plus an estimate<br />
of the remaining trusts and incorporations in<br />
the MLC database. The MLC database covers<br />
both trusts and incorporations identified in<br />
our review plus those for which we do know<br />
the land area but not the usage or value of<br />
that land. Below we detail how we estimated<br />
the value for the trusts and incorporations for<br />
which we do not have valuation information –<br />
referred to below as the remaining blocks.<br />
The area for the remaining blocks was based<br />
on the total land area reported in Table 5.4<br />
above, less the land area for the identified<br />
trusts and incorporations with known values.<br />
The value of the remaining blocks is likely to<br />
depend on the size and productive use of the<br />
constituent blocks. Therefore, the blocks were<br />
grouped by land size and a range of values per<br />
hectare were applied to provide an indication<br />
of the likely valuation range.<br />
To provide a likely upper limit, we estimated<br />
the value of urban sections and smaller blocks<br />
of rural land using values from Quotable Value<br />
New Zealand for June 2008. Urban sections<br />
(blocks less than 1 hectare) were valued at<br />
$350,000 per hectare, blocks between 1 and<br />
19 hectare at $100,000 per hectare and blocks<br />
up to 100 hectare at $20,000 per hectare.<br />
Assuming all blocks greater than 100 hectare<br />
have productive uses, we applied the value<br />
of $9,000 per hectare. This process gives an<br />
estimate of $4.76 billion for the unvalued<br />
TE PUNI KÖKIRI<br />
REPORT ON THE MÄORI ASSET BASE IN THE WAIARIKI ECONOMY
trust and incorporation land. Combining this<br />
with the known value of the identified trusts<br />
and incorporations gives an upper limit of<br />
$5.7 billion. This estimate covers the known<br />
and remaining blocks, being 439,860 hectare<br />
of land held by 1,873 ahu whenua trusts and<br />
68,220 hectare of land held by Mäori land<br />
incorporations.<br />
To provide a likely lower limit estimate, we used<br />
an alternative value assuming the remaining<br />
land blocks had mixed usage, and included<br />
land with marginal use. An earlier BERL (1997)<br />
report on the Mäori Economic Base, provided<br />
a global estimate of Mäori authority land,<br />
excluding that administered by Federation<br />
of Mäori Authorities (FoMA), the Mäori Trust<br />
and land with no administration. 18 Updating<br />
this figure to 2008 dollar terms, we applied an<br />
average figure of $3,500 per hectare across<br />
all block sizes. This lower limit process values<br />
the remaining land blocks at $1.5 billion.<br />
Combining this with the known value of the<br />
identified trusts and incorporations gives a<br />
lower limit of $2.5 billion.<br />
We believe the middle of this range is likely<br />
to be conservative. Applying a mid-range<br />
figure of $6,250 per hectare to all blocks<br />
above 1,000 hectare and $3,500 per hectare<br />
to smaller blocks gives an estimate of $2.45<br />
billion for the remaining blocks. Combining<br />
this with the known value of the identified<br />
trusts and incorporations gives a mid-range<br />
estimate of $3.4 billion.<br />
5.3.1 Caveats to the assessment<br />
Our assessment of the identified blocks draws<br />
on a relatively small sample of 12 Mäori land<br />
incorporations and 55 ahu whenua trusts<br />
that are well known, prosperous businesses.<br />
Information on these incorporations and<br />
ahu whenua trusts is readily available, again<br />
indicating their business standing and success<br />
in operating in the area under study. Other<br />
incorporations and ahu whenua trusts that<br />
are operating in farm and forestry ventures<br />
are likely to be of a lower value as they are<br />
less well known and the information is not as<br />
readily available.<br />
However, we do not know how much of the<br />
total land in the Waiariki rohe is marginal land<br />
or the productive uses of the remaining blocks<br />
that were not identified in the annual report<br />
review and interviews. While we have been<br />
able to give an indication of the total amount<br />
of land held by Mäori land incorporations and<br />
ahu whenua trusts, the total number of Mäori<br />
land incorporations and ahu whenua trusts in<br />
the rohe, and the average number of hectare<br />
per incorporation or trust, we are unable to<br />
provide detailed information on whether this<br />
land is productive or marginal.<br />
We would like to extend the sample of the<br />
land asset base in Waiariki to look at land<br />
without administration. An earlier BERL (1997)<br />
report on the Mäori Economic Base, based on<br />
<strong>Te</strong> <strong>Puni</strong> Kökiri land area statistics, indicates<br />
that there is over 33,000 hectare of land<br />
without administration in the Waiariki rohe.<br />
Updating the estimated value of this land to<br />
2008 dollar terms suggests a figure of $68.4<br />
million. This figure, based on 1996 numbers,<br />
has not been included in the overall estimates,<br />
as we believe further work is required to<br />
determine the present extent, nature and uses<br />
of this land.<br />
23<br />
18 BERL. (1997). The nature and extent of the Mäori Economic Base.<br />
COLLECTIVELY OWNED ASSETS
24<br />
Inaccessible land, with no public right of way,<br />
and land without administration is an issue<br />
for Waiariki, as in a number of areas around<br />
the country.<br />
We would also like to extend the sample of<br />
the land asset base in Waiariki to look at land<br />
administered by the Mäori Trustee and to<br />
specifically include details of the activities on<br />
the land that they administer.<br />
5.4 LOOKING AHEAD<br />
The diverse activities of Mäori land<br />
incorporations and ahu whenua trusts in the<br />
Waiariki rohe illustrate the importance of<br />
capitalising on strengths and opportunities,<br />
but also the need for collaborating with public<br />
agencies on relevant sector projects, and skills<br />
and education initiatives. These activities also<br />
illustrate where Mäori land incorporations and<br />
ahu whenua trusts could come together to work<br />
on issues of common interest or as clusters.<br />
One example of an existing strategy and<br />
action plan that could be collaborated on is<br />
the Bay of Plenty Regional Strategy. A focus<br />
area of the Bay of Plenty Regional Strategy<br />
is the development of Mäori economic<br />
development and resource utilisation.<br />
This strategy encourages collaborative<br />
partnerships between public agencies and<br />
iwi to foster economic development, and the<br />
further development of Mäori commercial<br />
development and leadership.<br />
TE PUNI KÖKIRI<br />
REPORT ON THE MÄORI ASSET BASE IN THE WAIARIKI ECONOMY
6. TREATY OF WAITANGI SETTLEMENT ASSETS<br />
This section discusses the components of the<br />
Mäori asset base in Waiariki that are derived<br />
from Treaty of Waitangi settlements.<br />
The Treaty of Waitangi settlements included in<br />
this asset base are held and managed by the<br />
Central North Island Iwi Holdings Ltd, the <strong>Te</strong><br />
Arawa Lakes Trust, the Ngäti Tüwharetoa (Bay<br />
of Plenty) Settlement Trust, and <strong>Te</strong> Rünanga<br />
o Ngäti Awa. The value of settlement assets<br />
is easier to measure than the assets held by<br />
Mäori businesses or Mäori authorities.<br />
There are a number of pending Treaty of<br />
Waitangi settlements in the Waiariki rohe. <strong>Te</strong><br />
Whänau-a-Apanui, Whakatöhea and Tühoe<br />
to the east, and Ngäti Ranginui, Ngaiterangi,<br />
and Ngäti Pükenga in the west are either<br />
in pre-negotiations or negotiating towards<br />
agreement in principle with the Crown.<br />
Ngaitai are in the pre-negotiation stage with<br />
the Crown. The settlement of these claims<br />
could potentially add at least $100 million to<br />
the economy.<br />
However, Ngäti Ranginui, Ngaiterangi,<br />
Whakatöhea, Tühoe, and Ngaitai are<br />
recognised Mandated Iwi Organisations (MIO)<br />
and have received their allocated fisheries<br />
assets. <strong>Te</strong> Whänau-a-Apanui has to date not<br />
joined this framework and is not a MIO.<br />
Although, these iwi and their associated Mäori<br />
Trust Boards or Rünanga have not settled<br />
claims with the Crown they have embarked<br />
on economic development projects. Examples<br />
include Whakatöhea Mäori Trust Board<br />
operating a Primary Health Organisation (PHO)<br />
in Öpötiki that offers mental health services,<br />
drug and alcohol counselling, and general<br />
medical services. 19 Ngaiterangi Iwi Incorporated<br />
Society also provides health services in the<br />
Western Bay of Plenty area. These health<br />
services include care for the elderly and infirm,<br />
counselling services, and social work/caregiving<br />
services. These services may be marae based or<br />
provided in people’s homes.<br />
These economic development projects are<br />
expected to gain momentum when settlement<br />
assets become available.<br />
6.1 TREATY OF WAITANGI<br />
SETTLEMENT ASSETS<br />
The financial and commercial redress amount<br />
is the monetary value of the settlement. This<br />
is known as the quantum. 20 The quantum<br />
is received, held and managed by a postsettlement<br />
governance entity (PSGE). 21 The<br />
Crown will not complete a settlement until a<br />
suitable governance entity has been legally<br />
established and ratified by a claimant group.<br />
The Treaty of Waitangi settlements included in<br />
this asset base are held and managed by the<br />
Central North Island Iwi Holding Ltd, the <strong>Te</strong><br />
Arawa Lakes Trust, the Ngäti Tüwharetoa (Bay<br />
of Plenty) Settlement Trust, and <strong>Te</strong> Rünanga o<br />
Ngäti Awa. Table 6.1 overleaf shows the value<br />
of these settlements.<br />
25<br />
19 Public Health Organisations (PHOs) are funded by District Health Boards (DHBs) to provide primary health care services to<br />
people who are enrolled with the PHO. PHOs vary widely in size and structure, are not-for-profit, and provide services either<br />
directly by employing staff or through provider members.<br />
20 Crown Forestry Rental Trust. Aratohu Mö Ngä Röpü Kaitono: Guide for Claimants Negotiating Treaty Settlements. Wellington: 2008.<br />
21 In the case of Ngäti Awa the Crown accepted the statutory body <strong>Te</strong> Rünanga o Ngäti Awa as the post-settlement governance<br />
entity (PSGE). Post-settlement groups may establish more than one PSGE to manage their settlement quantum and assets.<br />
TREATY OF WAITANGI SETTLEMENT ASSETS
26<br />
TABLE 6.1: SETTLEMENT ENTITY ASSETS, VALUE AS AT 2009<br />
Settlement entity<br />
Asset value<br />
($m)<br />
Central North Island Iwi Holding Ltd 196.0<br />
<strong>Te</strong> Rünanga o Ngäti Awa 73.2<br />
Ngäti Tüwharetoa (Bay of Plenty) Settlement Trust 45.0<br />
<strong>Te</strong> Arawa Lakes Trust 35.0<br />
Total 349.2<br />
Source: BERL, annual reports<br />
The asset values in Table 6.1 above are the<br />
value of the settlement asset when this report<br />
was prepared. The asset values include the<br />
original settlement quantum plus the growth<br />
in the value of these settlements. For example,<br />
Ngäti Tüwharetoa (Bay of Plenty) received a<br />
quantum of $10.5 million in 2003, and this<br />
asset has now grown to $45 million. The<br />
Central North Island Iwi Collective received<br />
their settlement quantum on 1 July 2009<br />
therefore their asset value is the original<br />
settlement quantum.<br />
Excluding Crown Forest Licenses (CFLs), the<br />
quantum received by the four settlements<br />
examined in this research was approximately<br />
$250 million. 22 Prudent investment and<br />
re-investment has allowed the settlement<br />
entities to grow their assets to an estimated<br />
$349.2 million.<br />
6.1.1 Central North Island Forests Iwi<br />
Collective<br />
The Central North Island Forests Iwi Collective<br />
(the Collective) is made up of Ngai Tühoe,<br />
Ngäti Tüwharetoa, Ngäti Whakaue, Ngäti<br />
Whare, Ngäti Manawa, Ngäti Rangitihi,<br />
Raukawa, and the Affiliate <strong>Te</strong> Arawa Iwi and<br />
Hapü. The Affiliate <strong>Te</strong> Arawa Iwi and Hapü are<br />
represented by <strong>Te</strong> Pümautanga o <strong>Te</strong> Arawa.<br />
The Collective signed a deed of settlement with<br />
the Crown in June 2008. The redress package<br />
includes 176,000 hectares of the Central<br />
North Island licensed Crown forest land, their<br />
associated accumulated and on-going rentals,<br />
and other commercial redress such as an<br />
allocation of New Zealand Units (carbon credits).<br />
The Collective’s share of the Crown forest<br />
land is valued at $196 million. The Collective’s<br />
share of the accumulated rentals is estimated<br />
to be $223 million. Ongoing rental streams<br />
from the CFLs will also be received for the<br />
remaining period of the licences, which is<br />
about 35 years. Total annual rents from the<br />
CFLs is currently about $15 million a year. 23<br />
However, deeds of recognition, statutory<br />
acknowledgement and vesting of sites of<br />
cultural significance for each member of the<br />
collective may further increase the value and<br />
the impact this settlement has on the economy.<br />
22 Crown Forest Licences (CFLs) are licences on Crown forest land for which rental is paid by forest owners and held in trust by<br />
the Crown Forestry Rental Trust. For further information see Crown Forestry Rental Trust. Aratohu Mö Ngä Röpü Kaitono: Guide for<br />
Claimants Negotiating Treaty Settlements. Wellington: 2008.<br />
23 Deed of Settlement of the Historical Claims of Central North Island (CNI) Forest Iwi Collective to the Central North Island<br />
Forests Land. Copies available from the Office of Treaty Settlements website, www.ots.govt.nz.<br />
TE PUNI KÖKIRI<br />
REPORT ON THE MÄORI ASSET BASE IN THE WAIARIKI ECONOMY
The role of Mäori in influencing economic<br />
change in the Waiariki rohe will also grow due<br />
to the three commercial – forest, geothermal<br />
and carbon - strategies that the Collective is<br />
considering investing in. The forest strategy<br />
would have a 30 to 35 year timeframe and<br />
could include taking control of Kaingaroa forest<br />
operations and investing in wood processing.<br />
It could also involve forest management and<br />
selectively targeting overseas distribution<br />
channels. The geothermal strategy would have<br />
a five to 10 year timeframe and could see iwi<br />
in the Waiariki rohe taking a leading role in<br />
geothermal power generation. Over time this<br />
operation could further grow to see large scale<br />
investment in direct heat activities such as<br />
kiln drying for the wood processing industry or<br />
greenhouses. The carbon strategy would also<br />
have a long timeframe with 25 to 30 years of<br />
carbon farming.<br />
This large settlement will inform future Mäori<br />
economic development plans in the Waiariki<br />
rohe and nationally as the Collective moves<br />
from being rent takers to being actively<br />
involved in industries, and as other iwi from<br />
outside of the Collective take an interest in<br />
contributing their land asset or investing in a<br />
Collective commercial enterprise.<br />
6.1.2 Ngäti Awa<br />
The Crown and Ngäti Awa signed a Deed of<br />
Settlement in March 2003. Sites transferred to<br />
Ngäti Awa included a combination of Crownowned<br />
land selected by Ngäti Awa and cash<br />
up to a value of $42.39 million. Land selected<br />
by Ngäti Awa included portions of Kaingaroa<br />
Forest and 10,000 hectares of Rotoehu Forest.<br />
Ngäti Awa has, for a period of 50 years,<br />
a Right of First Refusal to buy, at full<br />
market value, Crown-owned properties in a<br />
specified area, should they be disposed of<br />
by the Crown. 24 The deed of settlement also<br />
included a provision that if the Minister of<br />
Conservation offers by public tender any part<br />
of the coastal marine area within a specified<br />
part of the Öhiwa Harbour, Ngäti Awa will<br />
have a preferential right to purchase up to<br />
five percent of the authorisations that are the<br />
subject of that tender.<br />
Statutory acknowledgements include part<br />
of the Whakatäne, Rangitaiki and Tarawera<br />
rivers, Moutohorä (Whale) Island Wildlife<br />
Management Reserve, Part of Öhiwa Harbour,<br />
<strong>Te</strong> Kaokaoroa Historic Reserve, Kohi Point<br />
Scenic Reserve, Öhope Scenic Reserve,<br />
Mokorua Scenic Reserve, Uretara Island Scenic<br />
Reserve, and the former Matahina A5 block.<br />
Also, seven areas of special significance to<br />
Ngäti Awa were returned to the iwi. These<br />
are: Kaputerangi Historic Reserve, <strong>Te</strong> Paripari<br />
Pa Historic Reserve, Otitapu Pa (within<br />
the Mangaone Scenic Reserve), Former<br />
Matahina A4 Block, <strong>Te</strong> Toangapoto (within the<br />
Western Whakatane Recreation Reserve), <strong>Te</strong><br />
Ihukatia (part of the Port Öhope Recreation<br />
Reserve), and Whakapaukörero (within the<br />
Matata Scenic Reserve). These sites total<br />
approximately 64 hectares.<br />
There were four deeds of recognition in the<br />
settlement covering the Crown-owned parts<br />
of the Whakatäne, Rangitaiki and Tarawera<br />
riverbeds and Uretara Island. Several place<br />
name changes were enacted including<br />
Volkner Rocks (owned by Ngäti Awa on<br />
27<br />
24 The Right of First Refusal is the right of a claimant group to have, for a specified period, the opportunity to purchase specified<br />
surplus Crown properties ahead of other potential buyers. For further information see Crown Forestry Rental Trust. Aratohu Mö Ngä<br />
Röpü Kaitono: Guide for Claimants Negotiating Treaty Settlements. Wellington: 2008.<br />
TREATY OF WAITANGI SETTLEMENT ASSETS
28<br />
behalf of Mataatua) will be known as <strong>Te</strong><br />
Paepae o Aotea. Awaateatua Beach will be<br />
known as <strong>Te</strong> Awa a <strong>Te</strong> Atua Beach. Braemar<br />
Springs will be known as to <strong>Te</strong> Waiü o<br />
Pukemarie/Braemar Springs. In addition,<br />
Thornton Wildlife Management Reserve<br />
will be known as Ökörero/Thornton Wildlife<br />
Management Reserve.<br />
The Crown also gifted Ngäti Awa $1 million to<br />
assist in the redevelopment of the Mataatua<br />
meeting house complex. The Mataatua meeting<br />
house was returned to Ngäti Awa in 1996 in<br />
partial settlement of Ngäti Awa's historical<br />
claims. The Crown will also gift the land under<br />
the Whakatäne Airport to Ngäti Awa, if it ever<br />
ceases to be reserved as an airport.<br />
6.1.3 Ngäti Tüwharetoa (Bay of Plenty)<br />
The Crown and Ngäti Tüwharetoa (Bay of<br />
Plenty) signed a Deed of Settlement in June<br />
2003. This settlement included a quantum of<br />
$10.5 million, and the right to purchase 884<br />
hectares of Crown Forest licensed land within<br />
the Rotoehu West forest. Accumulated rentals<br />
were included with this purchase.<br />
This asset base has now grown to $45 million<br />
as Ngäti Tüwharetoa (Bay of Plenty) purchased<br />
a Crown-owned geothermal bore and the<br />
associated land, and is now receiving an annual<br />
income of $6-6.5 million from this bore.<br />
Ngäti Tüwharetoa (Bay of Plenty) also has a<br />
right of refusal over Crown geothermal assets<br />
associated with the supply of steam to the<br />
Tasman Pulp and Paper Mill, should they be<br />
offered for sale and the owners of the mill do not<br />
exercise their pre-emptive rights to the assets.<br />
Ngäti Tüwharetoa (Bay of Plenty) statutory<br />
acknowledgements include Rotomä Forest<br />
Conservation Area, Lake Rotomä Scenic<br />
Reserve, Lake Tamurenui Wildlife Management<br />
Reserve, parts of the Tarawera and<br />
Rangitaiki Rivers. Sites transferred to the iwi<br />
include <strong>Te</strong> Atua Reretahi (in the Rotomä<br />
Forest Conservation Area); Otitapu Lookout<br />
(in the Lake Rotomä Scenic Reserve);<br />
<strong>Te</strong> Wahieroa (in the Western Whakatäne<br />
Coastal Recreation Reserve); <strong>Te</strong> Kaukahiwi o<br />
Tirotirowhetu (in the Parimahana Scenic<br />
Reserve); Whakapaukörero (in the Matatä<br />
Scenic Reserve). These sites total approximately<br />
66 hectares.<br />
6.1.4 <strong>Te</strong> Arawa Lakes<br />
The Crown and <strong>Te</strong> Arawa signed a deed of<br />
settlement in 2004 for <strong>Te</strong> Arawa Historical<br />
Claims and Remaining Annuity Issues over<br />
14 lakes. 25 These lakes are Rotoehu, Rotomä,<br />
Rotoiti/<strong>Te</strong> Roto-Whaiti-i-kite-ai-a-Ihengai-Ariki-ai-a-Kahumatamomoe,<br />
Rotorua/<br />
Rotorua-nui-a-Kahumatamomoe, Ökataina/<br />
<strong>Te</strong> Moana-i-kataina-a-<strong>Te</strong>-Rangitakaroro,<br />
Ökareka, Rerewhakaaitu, Tarawera,<br />
Rotomahana, Tikitapu, Ngähewa, Tutaeinanga,<br />
Ngäpouri/Öpouri and Ökaro/Ngakaro.<br />
The settlement includes acknowledgements<br />
and an apology given by the Crown to<br />
<strong>Te</strong> Arawa, and financial and annuity redress.<br />
<strong>Te</strong> Arawa received a quantum of $2.7 million,<br />
$7.3 million of annuity redress and $400,000<br />
to purchase fish licenses. While the cultural<br />
redress recognises <strong>Te</strong> Arawa traditional,<br />
historical, cultural and spiritual association<br />
with the lakes covered in the settlement,<br />
including the transfer of 13 lakebeds.<br />
25 This settlement was signed after the Crown agreed in 1997 to negotiate <strong>Te</strong> Arawa’s lakes claims separately from their other<br />
historical claims.<br />
TE PUNI KÖKIRI<br />
REPORT ON THE MÄORI ASSET BASE IN THE WAIARIKI ECONOMY
6.2 TREATY OF WAITANGI<br />
FORESTRY SETTLEMENT ASSETS<br />
Table 6.2 examines Mäori forestry settlement<br />
assets in Waiariki. It shows the amount and<br />
estimated value of the land, and accumulated<br />
rentals.<br />
This land area is based on information from<br />
the Crown Forestry Rental Trust (CFRT) on<br />
Crown forest licensed land. This land is<br />
currently managed by forest managers, and<br />
iwi receive annual rentals. We do not have<br />
comprehensive information on the value<br />
29<br />
TABLE 6.2: FORESTRY SETTLEMENT ASSETS, VALUE AS AT 2009<br />
Iwi<br />
CFL land<br />
(ha)<br />
Estimated land value<br />
($m)<br />
Accumulated rental<br />
($m)<br />
Central North Island Iwi Holding Ltd 176,000 300.0 223.0<br />
<strong>Te</strong> Rünanga o Ngäti Awa 9,400 18.8 16.7<br />
Ngäti Tüwharetoa (BoP) Settlement Trust 844 1.7 1.9<br />
Total 186,244 320.5 241.6<br />
Source: BERL, Crown Forestry Rental Trust<br />
of these annual rentals, and this is a gap.<br />
For example, Crown forest licenses for the<br />
Central North Island area currently generate<br />
approximately $15 million per annum.<br />
BERL estimated the land value of Crown forest<br />
land based on CFRT information that suggests<br />
a value of $2,000 per hectare. Our estimates<br />
include an allowance for unproductive or low<br />
productivity land.<br />
Ngäti Awa and Ngäti Tüwharetoa (Bay of<br />
Plenty) received accumulated rentals in 2005.<br />
A proportion of these cash distributions have<br />
subsequently been invested in other productive<br />
assets, such as geothermal bores, forestry,<br />
farming and commercial developments.<br />
As such, Table 6.2 is likely to underestimate<br />
the current value of the accumulated rentals.<br />
The Central North Island Forests Iwi Collective<br />
settlement and its subsequent forest strategy<br />
is likely to give further strength to other iwi<br />
and Mäori authorities such as trusts and<br />
incorporations who are involved in the forestry<br />
industry. There are successful examples of<br />
groups working together in forestry in the<br />
Waiariki rohe, similar to what is envisaged<br />
in the forest strategy. Ngatahi Corporation,<br />
for example, is a collective of 15 trusts and<br />
incorporations who work together primarily<br />
to leverage opportunities from buyers and<br />
suppliers, and to provide a consolidated<br />
voice in discussions with companies such as<br />
Carter Holt Harvey. Ngatahi Corporation is<br />
also involved in skills, training and workforce<br />
development across the forestry industry, and<br />
attempts to place local people in training and<br />
employment. This collective involves trusts and<br />
incorporations from around the Öpötiki and<br />
Pureora area.<br />
Working as a collective has and will give Mäori<br />
further strength in the forestry industry. It will<br />
grow the asset base of Mäori in the Waiariki<br />
rohe, and influence the forestry industry<br />
within New Zealand and internationally.<br />
TREATY OF WAITANGI SETTLEMENT ASSETS
30<br />
6.3 MAORI FISHERIES ACT 2004<br />
SETTLEMENT ASSETS<br />
The Maori Fisheries Act 2004 came into force<br />
in September 2004. The Act implements the<br />
agreements reached in the deed of settlement<br />
in September 1992 and provides for the<br />
development of the interests of iwi in fisheries,<br />
fishing and fisheries-related activities. The Act<br />
does this via a framework for the allocation<br />
and management of settlement assets. Some<br />
of the settlement assets are allocated and<br />
transferred to iwi while others are managed by<br />
<strong>Te</strong> Ohu Kaimoana.<br />
Each iwi receives a minimum asset package of<br />
$1 million. Iwi receive a mixture of quota;<br />
income shares in Aotearoa Fisheries Limited;<br />
and cash. This allocation is based on the length<br />
of their coastline, and the size of their population<br />
relative to the total Mäori population as per the<br />
Maori Fisheries Act 2004. 26<br />
The key, but not sole, requirement for receiving<br />
fisheries settlement assets is the recognition of<br />
a representative iwi organisation as a Mandated<br />
Iwi Organisation (MIO). Recognised iwi<br />
organisations are those organisations recognised<br />
by <strong>Te</strong> Ohu Kai Moana Trustee Limited (TOKMTL).<br />
The following are the recognised iwi organisations<br />
in the area under study: <strong>Te</strong> Rünanga<br />
o Ngäti Awa, Ngaiterangi Iwi Society<br />
Incorporated, Whakatöhea Mäori Trust Board,<br />
Ngäti Ranginui Iwi Society Incorporated,<br />
Ngaitai Iwi Authority, <strong>Te</strong> Kotahitanga o <strong>Te</strong><br />
Arawa Waka Fisheries Trust Board, and Tühoe<br />
Fisheries Charitable Trust. While <strong>Te</strong> Rünanga o<br />
<strong>Te</strong> Whänau has chosen not to establish a<br />
MIO at this point, the iwi has a substantial<br />
fisheries operation.<br />
6.3.1 Aquaculture developments<br />
The core business of the Whakatöhea Mäori<br />
Trust Board is dairy farming and the Trust has<br />
190 hectares of dairy farms on the Waiöweka<br />
Flats. However, the Trust also has joint<br />
ventures in other parts of the primary industry;<br />
it is a partner in Eastern Seafoods Limited;<br />
Öpötiki Packaging and Cool Storage (OPAC);<br />
and a forestry investment in Tolaga Bay.<br />
A proposed joint venture between the<br />
Whakatöhea Mäori Trust Board, Tasman<br />
TABLE 6.3: ALLOCATED FISHERY ASSETS, VALUE AS AT 2009<br />
Iwi Mandated iwi organisation Allocated assets<br />
($m)<br />
Whakatöhea 5.90<br />
Ngäitai 1.32<br />
Ngaiterangi 6.11<br />
Ngäti Awa 7.48<br />
Ngäti Ranginui 3.87<br />
<strong>Te</strong> Arawa 23.60<br />
Tühoe 17.31<br />
<strong>Te</strong> Whänau-a-Apanui X -<br />
Total 65.59<br />
Source: <strong>Te</strong> Ohu Kai Moana<br />
26 For further information see <strong>Te</strong> Ohu Kaimoana, http://teohu.maori.nz<br />
TE PUNI KÖKIRI<br />
REPORT ON THE MÄORI ASSET BASE IN THE WAIARIKI ECONOMY
Mussels Limited, and New Zealand Seafarms<br />
Limited could result in a mussel farm in<br />
the Öpötiki harbour area. This mussel farm,<br />
when fully operational, could consist of<br />
approximately 1,300 lines which should<br />
result in an annual haul of 25,000 tonnes<br />
of mussels. The mussels could be processed<br />
locally or barged to Tauranga where they can<br />
be exported via the Port or processed.<br />
Resource consent has been granted for this<br />
development and as part of this consent,<br />
physical structures will need to be in place<br />
in the water by the end of 2009. At the same<br />
time the Cawthron Institute is doing scientific<br />
research on other species that can be grown<br />
in the Öpötiki harbour area. The Cawthron<br />
Institute have done sample lines in this area<br />
checking the currents for mussel growth, and<br />
they will also monitor the water temperature<br />
and food quantity to ensure mussels can be<br />
grown in this area.<br />
This joint venture is supported by the Öpötiki<br />
District Council, who also considers the<br />
redevelopment of the harbour a priority. Further,<br />
the Bay of Plenty Regional Strategy produced<br />
by Environment Bay of Plenty in collaboration<br />
with other groups in the region supports the<br />
proposed Öpötiki Harbour development.<br />
A cost benefit analysis completed by URS<br />
Finance & Economics in 2001 indicates that<br />
the Öpötiki District Council should not proceed<br />
with the harbour development without the<br />
mussel farm development (and preferably with<br />
the processing plant as well). This analysis<br />
included an economic impact assessment<br />
that considered three scenarios: harbour<br />
development; harbour development and the<br />
attraction of commercial boating operations<br />
including a mussel farm development; and<br />
harbour development, mussel farm and the<br />
development of a processing plant.<br />
This assessment indicated that regional GDP<br />
and employment will increase substantial with<br />
the development of the harbour area and the<br />
mussel farm. In the case of scenario two this is<br />
estimated to be an increase in regional GDP of<br />
$10.8 million and the creation of employment<br />
for an additional 189 full-time equivalents<br />
(FTEs). This employment growth is over a 25<br />
year period. 27 Mussel processing alone is<br />
expected to see the creation of some 900 new<br />
jobs and a $34 million increase in the Eastern<br />
Bay of Plenty GDP. 28<br />
The harbour redevelopment could create<br />
other commercial opportunities in the Öpötiki<br />
District such as offshore farm fishing, the<br />
barging of forestry and other products, and<br />
commercial fishing operations. These are<br />
ventures that iwi, Mäori land incorporations<br />
and ahu whenua trusts could invest in. As<br />
such the proposed mussel farm and harbour<br />
redevelopment will allow Mäori in the Eastern<br />
Bay of Plenty, and wider rohe, to positively<br />
influence economic change.<br />
In the three year action plan in the Bay of<br />
Plenty Regional Strategy one key area of<br />
focus is innovative and productive industry<br />
sectors, including aquaculture. In particular,<br />
the establishment of a significant aquaculture<br />
industry in the Bay of Plenty and the need<br />
to work with all key stakeholders across the<br />
region to establish a Bay of Plenty aquaculture<br />
strategy. Iwi are a key stakeholder in this<br />
industry and will be a key partner in the further<br />
development of aquaculture in this region.<br />
31<br />
27 URS. Öpötiki Harbour Development Social and Economic Evaluation. June 2005. Accessed http://www.opotikiharbour.co.nz,<br />
March 2009.<br />
28 ibid<br />
TREATY OF WAITANGI SETTLEMENT ASSETS
7. NETWORKS AND COLLABORATION<br />
32<br />
This section identifies networks and<br />
collaborations that exist and operate in the<br />
Waiariki rohe. It does not go into any detail<br />
with regard to the relative importance or the<br />
performance of these organisations.<br />
7.1 NETWORKS<br />
Mäori networks in the Waiariki rohe have a<br />
social and economic focus. These networks<br />
are often provided by Rünanga, iwi authorities<br />
or a Mäori Trust Board, but they may also be<br />
professional organisations representing the<br />
interests of a group of employers. Networks<br />
in this area may also involve collaborations<br />
between iwi.<br />
While we have not been able to provide an<br />
estimated value for these organisations, it is<br />
important to note the contribution they make<br />
to the social and economic well-being of their<br />
iwi and hapü members. The following examples<br />
illustrate the wide range of networks that<br />
are currently operating in the Waiariki rohe.<br />
This list is by no means exhaustive, but rather<br />
illustrates the potential linkages that should be<br />
leveraged as part of future strategies.<br />
Organisations like these will play a key<br />
role in informing future Mäori economic<br />
development plans that will enable Mäori<br />
self-determination and influence within and<br />
beyond the Waiariki rohe.<br />
7.1.1 Social focus<br />
An area where Mäori have increased their<br />
capability and capacity is the provision of<br />
social services. This began with education,<br />
including köhanga reo and wänanga, and now<br />
includes a broad range of health services.<br />
There are a large number of köhanga reo<br />
operating in the Waiariki rohe as well as<br />
wänanga such as <strong>Te</strong> Whare Wänanga o<br />
Awanuiärangi and <strong>Te</strong> Wänanga o Aotearoa.<br />
Education grants and scholarships are provided<br />
by Mäori land incorporations and ahu whenua<br />
trusts as well as Rünanga, iwi authorities,<br />
Mäori Trust Boards and Post-Settlement<br />
Governance Entities (PSGEs). Some of the<br />
trusts or Rünanga, such as <strong>Te</strong> Arawa Lakes<br />
Trust, <strong>Te</strong> Rünanga o Ngäti Pikiao, and<br />
<strong>Te</strong> Rünanga o <strong>Te</strong> Whanau, also operate private<br />
training establishments (PTEs) that provide<br />
vocational and educational training.<br />
One example of the provision of health<br />
services in Waiariki is the services provided by<br />
Whakatöhea Mäori Trust Board. The Trust Board<br />
has a subsidiary company called <strong>Te</strong> Wheke<br />
Atawhai Ltd, which includes Whakatöhea<br />
Health Centre, Whakatöhea Iwi Social and<br />
Health Services, <strong>Te</strong> Aria Toka Family Service<br />
Centre, and an early childhood pre-school.<br />
The provision of social services postsettlement<br />
is well illustrated by <strong>Te</strong> Rünanga o<br />
Ngäti Awa. The Rünanga operates the Ngäti<br />
Awa Community Development Trust. This trust<br />
focuses on the cultural and social development<br />
of Ngäti Awa including education, housing,<br />
health care and aged care.<br />
7.1.2 Economic focus<br />
The importance of governing and administering<br />
assets means networks operate in the Waiariki<br />
rohe that focus on building capability in<br />
governance, business management and<br />
development, and economic development.<br />
There is also a focus on building commercial<br />
leadership now and for the future, and in<br />
succession planning.<br />
Filling a recognised need, some small Mäori<br />
businesses and self-employed contractors<br />
provide training in business development and<br />
strategic planning, governance, and being<br />
a trustee. This training is provided to Mäori<br />
land incorporations, ahu whenua trusts and<br />
businesses in the start-up phase.<br />
Tauranga Moana Mäori Trust Board also<br />
provides training in governance and business<br />
development to help organisations and trusts<br />
TE PUNI KÖKIRI<br />
REPORT ON THE MÄORI ASSET BASE IN THE WAIARIKI ECONOMY
set up effective business systems. This training<br />
can be in a variety of areas such as policy<br />
development, trustee or staff development, or<br />
strategic planning.<br />
The Futures Planning initiative was established<br />
to help young Mäori re-engage with their iwi.<br />
It encourages young professionals who have<br />
returned home to the Waiariki rohe to work<br />
as part of an emerging leaders programme.<br />
These people are aged 25 to 45 years old and<br />
have a variety of professional backgrounds and<br />
training. They are working on social, economic<br />
and cultural development projects. Most are<br />
at a senior, advisor, or managerial level in<br />
their professional careers. The initiative also<br />
encourages young Mäori to ‘come home’ and<br />
help in these projects. Some smaller iwi and<br />
hapü have been working with their neighbours<br />
to build up their capacity in this area and<br />
to encourage their young people to become<br />
future leaders.<br />
Tauranga Moana Mäori Tourism Inc and Mäori<br />
in Tourism Rotorua are non-profit, professional<br />
organisations that support Mäori tourism<br />
operators in the Tauranga Moana and Rotorua<br />
area. Tauranga Moana Mäori Tourism and<br />
Mäori in Tourism Rotorua are also the Mäori<br />
Regional Tourism Organisations (MRTO) for<br />
this area. These professional organisations<br />
can be drawn on to provide advice, guidance<br />
and expertise in new areas of interest in<br />
the tourism industry. And they provide a<br />
representative voice that can be a focal point<br />
for contact with government, other iwi and<br />
hapü, and future clients.<br />
For example, in the Tauranga Moana area<br />
a large number of cruise ships arrive at the<br />
Port of Tauranga each year. Currently, there<br />
are operations such as Kiwi360, Paparoa<br />
Marae, and Mauao Tours in the Tauranga<br />
Moana area. But there is the potential for<br />
further development of these and new tourism<br />
attractions, and for operators to bring their<br />
ventures up to a recognised standard through<br />
the use of recognised industry signs such as<br />
Qualmark 29 and Toi Iho. 30<br />
7.2 COLLABORATIONS<br />
Examples of successful collaborations in this<br />
rohe are those where Mäori entities have<br />
come together to work towards a specific goal<br />
or to voice concern on a particular issue.<br />
Integrated Mäori Land and Resource<br />
Development (Iwi Futures) is a collaborative<br />
project between Massey University, Landcare<br />
Research, AgResearch, Scion and <strong>Te</strong> Arawa<br />
Lakes Trust. The aim of this project is to<br />
develop a framework to help improve the<br />
utilisation and sustainable development of<br />
Mäori land with multiple owners. This is a<br />
three year project that began in 2008.<br />
Collaborative projects such as this are beneficial<br />
to <strong>Te</strong> Arawa Lakes Trust and other iwi in the<br />
Waiariki rohe; however, these projects need<br />
to deliver practical economic development<br />
solutions to Mäori landowners to successful<br />
unlock the full potential of their land.<br />
Further, for collaborative projects between<br />
Mäori landowners and groups such as<br />
councils or crown agencies to be successful,<br />
engagement and decision-making needs<br />
to happen at more than one level. External<br />
groups need to involve the people who own<br />
the resource in strategies and implementation.<br />
And they need to recognise that working with<br />
people who own multiply-owned assets means<br />
decisions are made by a board of trustees not<br />
just one person. As such, engagement and<br />
collaboration with Mäori landowners needs to<br />
be at various levels.<br />
33<br />
29 Qualmark New Zealand Limited is a government and private sector partnership between Tourism New Zealand and New<br />
Zealand Automobile Association. The aim of Qualmark is to help international and domestic travellers select places to stay, things<br />
to do and ways to get around New Zealand.<br />
30 Toi Iho is a registered trade mark used to promote and sell authentic, quality Mäori arts and crafts.<br />
NETWORKS AND COLLABORATION
8. OPPORTUNITIES FOR GROWTH<br />
34<br />
This section discusses the strategic intentions<br />
and constraints to economic and social<br />
transformation identified by Mäori in the<br />
Waiariki rohe. It also highlights the influence<br />
Mäori could have in directing future economic<br />
change in this rohe.<br />
Key driver industries in the Waiariki rohe<br />
are based around the primary industry and<br />
processing. These industries are based on<br />
competitive advantage in resources and are<br />
likely to continue to be key drivers into the<br />
foreseeable future.<br />
Mäori are therefore beginning to think<br />
strategically about growing their asset<br />
base. Questions are being posed as to how<br />
this asset base can provide long-term<br />
social and economic benefits, particularly<br />
employment. These questions have a longterm<br />
intergenerational viewpoint and the<br />
answers are being posed as frameworks and<br />
project plans that indicate the steps necessary<br />
to achieve self determination.<br />
8.1 CAPITAL FOR INVESTMENT<br />
A major constraint to asset base growth<br />
identified by the entities spoken to was capital<br />
for investment.<br />
A key feature of <strong>Te</strong> Ture Whenua Maori<br />
Act 1993 is the provisions that restrict the<br />
alienation of a certain class of Mäori owned<br />
land. This alienation includes sale, mortgaging<br />
and leasing. The Mäori Land Court can<br />
intervene in land use decisions, and it is harder<br />
for lenders to secure loans over Mäori land<br />
compared with land not subject to the Act. It<br />
is also harder for Mäori landowners to raise<br />
capital against their land.<br />
Banks in particular are cautious about investing<br />
in ventures that involve multiple-owned Mäori<br />
land or multiple-owned assets. However, this<br />
constraint can be turned into an opportunity<br />
through collaboration, partnerships and joint<br />
ventures with other Mäori entity partners.<br />
Examples of this include trusts working<br />
together to invest in kiwifruit orchards.<br />
Mäori land incorporations and ahu whenua<br />
trusts have predominantly been conservative<br />
in their business investments in the past.<br />
Now, several of these entities have money<br />
to invest and are considering a wide variety<br />
of options. Some are investing in stock and<br />
improvements; some are investing in other<br />
land-based businesses such as kiwifruit or<br />
avocado orchards; and some are moving from<br />
receiving rents and stumpage to managing the<br />
forest. As such, Mäori in the Waiariki rohe are<br />
moving from being passive rent receivers to<br />
active business operators and partners.<br />
This movement into business operations also<br />
means Mäori are getting involved in different<br />
parts of the value chain such as growing,<br />
marketing, processing, transport and logistics,<br />
and selling. And there is scope to become more<br />
involved in value-added activities. Mäori in the<br />
Waiariki rohe are also using their collective<br />
strength to work on specific projects that<br />
enhance their involvement in the distribution<br />
of goods and services. One example of this is<br />
<strong>Te</strong> Awanui Huka Pak, a pack house and cool<br />
storage facility for kiwifruit and avocados.<br />
8.2 HUMAN CAPITAL<br />
Another constraint to asset base growth<br />
identified was human capital. Many entities<br />
believe they lack the capacity and capability<br />
within their board or wider group to develop<br />
their asset base further. This held many back<br />
from investing in other ventures or portfolios,<br />
and some felt this made decision-making a<br />
TE PUNI KÖKIRI<br />
REPORT ON THE MÄORI ASSET BASE IN THE WAIARIKI ECONOMY
long and arduous process. Some argue their<br />
thinking within their trust or incorporation is<br />
not visionary enough and that people need to<br />
think and act outside of the square.<br />
As a result of thinking around this constraint<br />
a shift is slowly occurring within the current<br />
trustee governance model and a more diverse<br />
leadership that spans representation, skills,<br />
age and gender is being introduced. This<br />
shift is occurring due to recognition from the<br />
incumbents that the role and expectations<br />
of trustees is changing, particularly as<br />
trustees now need to take an active<br />
strategic leadership role. Further, there is the<br />
opportunity for the incumbents to work with<br />
others to pass on knowledge, build leadership<br />
and in turn further grow the asset base for<br />
future generations.<br />
This governance model and the issues trustees<br />
are grappling with in many ways contrast with<br />
the governance of settlement entities. These<br />
entities are not overcoming legacy issues; they<br />
offer Mäori the opportunity to inject a new set<br />
of skills and diversity into tribal groups; and<br />
build on initiatives such as Futures Planning<br />
and education scholarships.<br />
The challenge now is to find and attract<br />
people home and reverse the diaspora.<br />
Initiatives such as Futures Planning and<br />
education scholarships are attracting,<br />
retaining and training people with the skills.<br />
This could be further facilitated through<br />
the creation of employment opportunities<br />
and sustainable communities that are well<br />
resourced with infrastructure and facilities. In<br />
the meantime, these entities should continue<br />
to draw on the knowledge and expertise<br />
of existing board members, volunteers and<br />
consultants, and bridge the knowledge gap.<br />
They could also investigate further what skills<br />
are needed, when and where.<br />
Information on the land and its various uses<br />
was identified as a constraint. In order to<br />
gain the most benefit from their asset and<br />
make informed decisions as to its future<br />
use, some entities argued that they would<br />
like more information on their land. Land<br />
use information has the potential to unlock<br />
unproductive land and open up marginal land.<br />
Water and road access often restricts land use<br />
and land value. Land use information could<br />
allow ahu whenua trusts and Mäori land<br />
incorporations to work together to resolve<br />
these issues. It could also provide direction on<br />
how to utilise the land to its greatest potential<br />
and take advantage of future opportunities. It<br />
could also enable informed decision-making<br />
about partnerships and collaborations with<br />
other groups that are involved in strategies<br />
such as urban developments for residential<br />
and commercial use, carbon farming,<br />
geothermal, eco-tourism or horticulture.<br />
8.3 INFLUENCING FUTURE<br />
DIRECTIONS<br />
This report is a platform for further<br />
investigation. It demonstrates, at a broad level,<br />
the significance of Mäori in the economic<br />
development of Waiariki, and the role Mäori<br />
can play in influencing economic change and<br />
direction in this area. It also demonstrates<br />
the need to convert the constraints that have<br />
been identified into opportunities, and to<br />
establish a programme of work to determine<br />
the capability of land-based resources in the<br />
Waiariki rohe, particularly marginal land and<br />
land without administration.<br />
This report should also encourage further<br />
investigation and discussion between<br />
35<br />
NETWORKS AND COLLABORATION
36<br />
members of the Bay of Plenty Mäori Economic<br />
Development Reference Group and other<br />
groups in the rohe such as district and city<br />
councils, settlement entities, ahu whenua<br />
trusts, and incorporations. We would also<br />
encourage reference group members to draw<br />
on and work with professional organisations<br />
and networks, and engage with other<br />
stakeholders in the primary industry. This type<br />
of engagement and discussion will ensure the<br />
asset base achieves sustainable growth, that<br />
Mäori economic development plans influence<br />
economic change in the rohe, and that selfdetermination<br />
is enabled.<br />
Mäori are a sleeping giant in the Waiariki rohe<br />
but a paradigm shift is occurring. While the<br />
asset base is currently concentrated in the<br />
primary industry, there are clear indications<br />
of increasing diversification to high value<br />
investment decisions. This paradigm shift is<br />
being driven by land ownership, but ongoing<br />
settlements with the Crown are also changing<br />
the mix of assets. Further investigation of the<br />
productive use and value of these assets will<br />
see the giant awaken in this rohe and Mäori<br />
generate the skills and knowledge required for<br />
continuous social and economic evolution.<br />
TE PUNI KÖKIRI<br />
REPORT ON THE MÄORI ASSET BASE IN THE WAIARIKI ECONOMY
APPENDICES<br />
37
9. APPENDIX 1: METHODOLOGY<br />
38<br />
9.1 DATA<br />
Data for this project was gathered from<br />
official data sets:<br />
• Statistics New Zealand’s 2001 and 2006<br />
Censuses of Population and Dwelling<br />
• Mäori Land Court database<br />
Publicly available information was also used<br />
including:<br />
• The annual reports of Mäori land trusts, ahu<br />
whenua trusts, Mäori trust boards, Treaty of<br />
Waitangi settlement entities, and Rünanga<br />
• Quotable Value property values<br />
• Treaty of Waitangi Deed of Settlement<br />
information from the Office of Treaty<br />
Settlements<br />
• Maori Fisheries Act 2004 settlement<br />
information from <strong>Te</strong> Ohu Kai Moana<br />
• Crown Forestry Rental Trust. (2008).<br />
Aratohu Mö Ngä Röpü Kaitono: Guide for<br />
Claimants Negotiating Treaty Settlements.<br />
Wellington: Crown Forestry Rental Trust.<br />
• Environment Bay of Plenty. (2008). The Bay<br />
of Plenty Regional Strategy: An Economic<br />
Growth Strategy for a Sustainable Future –<br />
Long <strong>Te</strong>rm Plan and Action Plan.<br />
• Tahana Ltd. (2006). Tukua Mai Kia Piri <strong>Te</strong><br />
Arawa E.<br />
• Whenua Biz. (2007). <strong>Te</strong> Arawa Land Trusts<br />
and Incorporations.<br />
• URS. (2005). Öpötiki Harbour Development<br />
Social and Economic Evaluation. http://<br />
www.opotikiharbour.co.nz, accessed in<br />
March 2009.<br />
• BERL. (2007). Bay of Plenty Region<br />
Economic Transformation: Stage 1:<br />
Situation Analysis.<br />
• BERL. (1997). The Nature and Extent of the<br />
Mäori Economic Base.<br />
Interviews were completed by BERL with<br />
board members and staff of Mäori land<br />
incorporations, ahu whenua trusts, Rünanga,<br />
Treaty of Waitangi settlement entities, Mäori<br />
Trust Office, <strong>Te</strong> <strong>Puni</strong> Kökiri, the Department of<br />
Labour, the Ministry of Social Development,<br />
and custodian trustees. Members of the Bay of<br />
Plenty Mäori Economic Development Reference<br />
Group also provided their time and feedback,<br />
along with data, contacts, and information.<br />
9.2 DEFINITIONS<br />
The asset base of the Waiariki rohe includes<br />
the asset base of the following iwi:<br />
<strong>Te</strong> Whänau-a-Apanui, Ngaitai, Whakatöhea,<br />
Tühoe, Ngäti Awa, Ngäti Tüwharetoa (Bay of<br />
Plenty), Ngäti Pükenga, Ngaiterangi, Ngäti<br />
Ranginui, Ngäti Pikiao, Ngäti Rangiteaorere,<br />
Ngäti Rangitihi, Ngäti Rangiwewehi, Tapuika,<br />
Tühourangi, Waitaha, and Ngäti Whakaue. The<br />
asset base of Ngäti Tüwharetoa has not been<br />
included as part of the <strong>Te</strong> Arawa waka.<br />
For the purposes of the Statistics New Zealand<br />
Census of Population and Dwellings, Mäori is<br />
defined as people who identify with the Mäori<br />
ethnicity. Because ethnicity is self-perceived,<br />
people can identify with Mäori ethnicity even<br />
though they are not descended from a Mäori<br />
ancestor. Conversely, people choose to not<br />
identify with Mäori ethnicity even though they<br />
are descended from a Mäori ancestor. Ethnicity<br />
is not the same as birthplace.<br />
In this report, the numbers in the total<br />
employed columns in the industry and<br />
occupation tables do not add up because<br />
the "Not Elsewhere Included" category<br />
may include some Mäori as Statistics New<br />
Zealand makes adjustments to their ethnic<br />
breakdown calculations. In other words, the<br />
"Not Elsewhere Included" category is deducted<br />
TE PUNI KÖKIRI<br />
REPORT ON THE MÄORI ASSET BASE IN THE WAIARIKI ECONOMY
from the total. This procedure is adopted for<br />
calculating ethnic proportions since we don’t<br />
know how many Mäori or non-Mäori fall into<br />
the "Not Elsewhere Included" category. This<br />
method is used by Statistics New Zealand<br />
when providing ethnicity proportions.<br />
9.2.1 Waiariki rohe<br />
The Waiariki rohe encompasses the territorial<br />
authorities of the Western Bay of Plenty<br />
District, Tauranga City, Rotorua District,<br />
Whakatäne District, Kawerau District, and<br />
Öpötiki District.<br />
Regional data is provided for the Bay of<br />
Plenty region, while the territorial authority<br />
data includes information on the Western<br />
Bay of Plenty District, Tauranga City, Rotorua<br />
District, Whakatäne District, Kawerau District,<br />
and Öpötiki District. The Bay of Plenty region<br />
includes these districts as well as Taupö District<br />
and parts of the South Waikato District.<br />
There are no good estimates in New Zealand<br />
of total asset values by region let alone rohe.<br />
However, the share of land ownership by<br />
Mäori gives one indication of the importance<br />
of Mäori in the Waiariki economy.<br />
9.2.2 Industry classification<br />
The industry classifications used in this<br />
research are the Australian and New Zealand<br />
Standard Industrial Classification (ANZSIC)<br />
2006. This is a hierarchical classification with<br />
four levels: divisions (the broadest level),<br />
subdivisions, groups and classes. For the<br />
purposes of this research we have examined<br />
industries at the divisional level. This level<br />
provides a limited number of categories that<br />
show a broad picture of the economy and<br />
suitable for the publication of summary tables<br />
of official statistics.<br />
9.2.3 Employment<br />
In regards to employment, employed in the<br />
Statistics New Zealand Census of Population<br />
and Dwellings refers to people who are aged<br />
15 years and over and usually resident in New<br />
Zealand. They may be employed in either full<br />
or part-time labour.<br />
<strong>Full</strong>-time employment refers to a person who<br />
usually works 30 hours or more per week,<br />
while people who are employed part-time<br />
usually work fewer than 30 hours per week,<br />
but more than 1 hour per week.<br />
Self-employed includes people whose main<br />
earnings in the tax year came from selfemployment.<br />
Self-employment includes people<br />
who operate their own enterprise or engage<br />
independently in a profession or trade, and<br />
receive earnings from this. Self-employed<br />
and without employees refers to people<br />
who operate their own economic enterprise<br />
or engage independently in a profession or<br />
trade (including partnerships) and hire no<br />
employees. Employed is related to work in the<br />
seven days prior to the Census date in 2001<br />
and 2006. This table shows the job a person<br />
worked the most hours in.<br />
Working age population refers to the<br />
population aged 15 years and over who may<br />
be in the workforce.<br />
Unemployed refers to all people in the<br />
working-age population who during their<br />
reference week were without a paid job, were<br />
available for work and had actively sought<br />
work in the past four weeks ending with the<br />
reference week or had a new job to start<br />
within four weeks.<br />
Income is what a person aged 15 years<br />
and over receives before tax for a financial<br />
39<br />
APPENDICES
40<br />
year from all sources, e.g. wages, salary,<br />
social welfare payments, interest, dividends,<br />
commission, pre-tax business or farming<br />
income (less expenses).<br />
9.2.4 Households<br />
A household is defined by Statistics New<br />
Zealand as either one person usually living<br />
alone, or two or more people usually living<br />
together and sharing facilities (e.g. eating<br />
facilities, cooking facilities, bathroom and<br />
toilet facilities, a living area), in a private<br />
dwelling. A Mäori household is therefore a<br />
household where at least one occupant is of<br />
Mäori ethnicity.<br />
9.3 ROUNDING<br />
This data has been randomly rounded by<br />
Statistics New Zealand to protect confidentiality.<br />
Individual figures may not add up to totals,<br />
and values for the same data may vary in<br />
different tables.<br />
The numbers in the total employed columns<br />
in the industry and occupation tables do not<br />
add up because the "Not Elsewhere Included"<br />
category may include some Mäori as well as<br />
Non-Mäori.<br />
TE PUNI KÖKIRI<br />
REPORT ON THE MÄORI ASSET BASE IN THE WAIARIKI ECONOMY
10. APPENDIX 2: DEMOGRAPHIC PROFILE<br />
This demographic profile of the Mäori population<br />
is based on official data, mainly the Statistics<br />
New Zealand 2006 Census, which is available<br />
at a regional or territorial authority level.<br />
Regional data is provided for the Bay of<br />
Plenty region, while territorial authority data<br />
includes information on the Western Bay of<br />
Plenty District, Tauranga City, Rotorua District,<br />
Whakatäne District, Kawerau District, and<br />
Öpötiki District. The Bay of Plenty region<br />
includes these districts as well as Taupö District<br />
and parts of the South Waikato District.<br />
Mäori make up a relatively large proportion<br />
of the Bay of Plenty regional population. This is a<br />
relatively young population that is growing faster<br />
than the non-Mäori population in the region.<br />
10.1 POPULATION AT 2006<br />
In 2006, just over 26 percent of the resident<br />
population of the Bay of Plenty region were<br />
Mäori compared to 14.6 percent nationally.<br />
Table 10.1 shows the resident and Mäori<br />
resident population of the Bay of Plenty region<br />
compared to New Zealand in 2006.<br />
41<br />
TABLE 10.1: BAY OF PLENTY REGION AND NEW ZEALAND RESIDENT POPULATION<br />
Resident population<br />
Mäori population<br />
(N)<br />
Mäori population<br />
(%)<br />
Bay of Plenty Region 257,379 67,662 26<br />
New Zealand 4,027,947 565,329 14<br />
Source: Statistics New Zealand 2006 Census of Population and Dwellings<br />
Looking at a district level, Mäori make up a<br />
large proportion of the resident population of<br />
the Kawerau and Öpötiki Districts. There are<br />
also sizeable resident populations of Mäori<br />
living within the Rotorua and Whakatäne<br />
Districts. In all districts in this area, the<br />
proportion of the resident population that is<br />
Mäori is higher than national figures.<br />
Table 10.2 shows the resident and Mäori<br />
resident population of the territorial authorities<br />
examined compared to New Zealand in 2006.<br />
TABLE 10.2: TERRITORIAL AUTHORITIES' RESIDENT POPULATION<br />
Resident population<br />
Mäori population<br />
(N)<br />
Mäori population<br />
(%)<br />
Taupö District 32,421 8,643 27<br />
Western Bay of Plenty<br />
42,078 6,927 16<br />
District<br />
Tauranga City 103,635 16,569 16<br />
Rotorua District 65,901 22,734 34<br />
Whakatäne District 33,300 13,203 40<br />
Kawerau District 6,921 4,047 58<br />
Öpötiki District 8,976 4,884 54<br />
New Zealand 4,027,947 565,329 14<br />
Source: Statistics New Zealand 2006 Census of Population and Dwellings<br />
APPENDICES
42<br />
Mäori have a younger age profile than the<br />
region as a whole. Over 58 percent of the<br />
Mäori population in the Bay of Plenty region<br />
were 29 years or under in 2006. There were<br />
almost equal numbers of Mäori aged 14 years<br />
or younger and aged 30 to 64 years old.<br />
TABLE 10.3: BAY OF PLENTY REGION AGE PROFILE<br />
These two groups are important to strategic<br />
growth and development – one includes<br />
future leaders while the other includes current<br />
leaders who are participating in the economy<br />
and adding to the asset base.<br />
BoP Region Age as a % of total Mäori in BoP Region<br />
(N)<br />
Age as a % of total<br />
(Mäori )<br />
Mäori % of age group<br />
14 yrs and under 59,271 23 24,120 36 41<br />
15 to 29 yrs 43,740 17 15,387 23 35<br />
30 to 64 yrs 116,319 45 24,819 37 21<br />
65 yrs and over 38,052 15 3,330 5 9<br />
Total 257,379 100 67,662 100<br />
Source: Statistics New Zealand 2006 Census of Population and Dwellings<br />
Again, looking at this information at a<br />
territorial level the numbers are very similar<br />
with Mäori making up a significant proportion<br />
of the population 29 years old or under.<br />
TABLE 10.4: TERRITORIAL AUTHORITIES AGE PROFILE<br />
TLA Age as a % of total Mäori in TLAs<br />
(number)<br />
Age as a % of total<br />
(Mäori )<br />
Mäori % of age group<br />
14 yrs and under 68,247 23 27,333 35.49 40.1<br />
15 to 29 yrs 51,804 17 17,526 22.76 33.8<br />
30 to 64 yrs 138,516 46 28,353 36.82 20.5<br />
65 yrs and over 44,526 15 3,789 4.92 8.5<br />
Total 303,147 100 77,010 100.00<br />
Source: Statistics New Zealand 2006 Census of Population and Dwellings<br />
TE PUNI KÖKIRI<br />
REPORT ON THE MÄORI ASSET BASE IN THE WAIARIKI ECONOMY
10.2 IWI PROFILES<br />
Iwi profiles are produced by Statistics<br />
New Zealand based on census responses from<br />
people who stated that they were of Mäori<br />
descent and identified that they were affiliated<br />
with a particular iwi. It is at the discretion of<br />
an iwi to allow this information to be publicly<br />
available. The following iwi from the Waiariki<br />
area have publicly available profiles.<br />
These profiles provide an indication of iwi<br />
population numbers and whether people are<br />
living and working in the rohe. The figures<br />
in Table 10.5 indicate a sizeable number of<br />
people that affiliate to iwi in the Waiariki rohe<br />
live in the area. These profiles may be used as<br />
a platform for further investigation as they<br />
also provide useful information on age, gender,<br />
qualification and occupation.<br />
43<br />
TABLE 10.5: BAY OF PLENTY REGION IWI POPULATION PROFILES<br />
Nga Iwi ö Bay of Plenty<br />
Total BoP Iwi<br />
population<br />
BoP Iwi Living in<br />
BoP Region<br />
% Living in BoP<br />
Region<br />
Ngäti Pikiao (<strong>Te</strong> Arawa) 7,389 3,312 45<br />
Ngäti Rangiteaorere (<strong>Te</strong> Arawa) 456 246 54<br />
Ngäti Rangitihi (<strong>Te</strong> Arawa) 1,536 762 50<br />
Ngäti Rangiwewehi (<strong>Te</strong> Arawa) 2,346 1,164 50<br />
Tapuika (<strong>Te</strong> Arawa) 1,386 897 65<br />
Taräwhai (<strong>Te</strong> Arawa) 240 129 54<br />
Tühourangi (<strong>Te</strong> Arawa) 2,277 1,275 56<br />
Uenuku-Köpako (<strong>Te</strong> Arawa) 429 225 52<br />
Waitaha (<strong>Te</strong> Arawa) 735 450 61<br />
Ngäti Whakaue (<strong>Te</strong> Arawa) 7,311 3,795 52<br />
Ngäti Tüwharetoa 34,674 5,151 15<br />
Ngäti Tahu-Ngäti Whaoa (<strong>Te</strong> Arawa) 1,488 342 23<br />
Ngäti Pükenga 1,785 726 41<br />
Ngaiterangi 12,201 5,079 42<br />
Ngäti Ranginui 7,647 4,071 53<br />
Ngäti Awa 15,258 6,780 44<br />
Ngäti Manawa 1,938 963 50<br />
Tühoe 32,670 10,860 33<br />
Whakatöhea 12,072 5,049 42<br />
<strong>Te</strong> Whänau-a-Apanui 11,808 4,260 36<br />
Ngäti Whare 1,281 654 51<br />
Ngäi Tai (Tauranga Moana/Mätaatua) 2,313 900 39<br />
<strong>Te</strong> Arawa/Taupö (Rotorua/Taupö) Region, not further defined 2,145 909 42<br />
Tauranga Moana/Mätaatua (Bay of Plenty) Region, not further defined 162 45 28<br />
Total 161,547 58,044<br />
Source: Statistics New Zealand 2006 Census of Population and Dwellings<br />
APPENDICES
44<br />
10.3 INCOME STATISTICS<br />
Table 10.6 shows household incomes for Mäori<br />
and non-Mäori in the Bay of Plenty region on<br />
census night 2006.<br />
Large numbers of the population do not<br />
state their household income on their census<br />
form. However, what information is provided<br />
indicates that the largest percentage<br />
TABLE 10.6: HOUSEHOLD INCOMES, BAY OF PLENTY REGION 31<br />
(14 percent) of Mäori households had an<br />
income of between $50,001 and $70,000 in<br />
2006. The largest percentage of non-Mäori<br />
also had a household income in this income<br />
range, but this percentage was larger at<br />
17 percent.<br />
A larger percentage of non-Mäori households<br />
also earned more than $100,000 per annum.<br />
Household incomes (BoP) Mäori % Non-Mäori % Total %<br />
Less than $10,000 1,926 3 3,408 2 5,493 2<br />
$10,001 to $20,000 4,803 8 11,847 7 17,034 7<br />
$20,001 to $30,000 6,114 10 18,456 11 25,056 10<br />
$30,001 to $40,000 5,835 9 15,567 9 21,708 9<br />
$40,001 to $50,000 5,163 8 13,560 8 18,984 8<br />
$50,001 to $70,000 8,685 14 28,773 17 37,944 15<br />
$70,001 to $100,000 7,491 12 27,681 17 35,571 14<br />
More than $100,000 6,378 10 28,575 17 35,538 14<br />
Not Stated 17,166 27 19,569 12 54,972 22<br />
Total 63,567 100 167,442 100 252,312 100<br />
Source: Statistics New Zealand 2006 Census of Population and Dwellings<br />
31 A household is defined by Statistics New Zealand as either one person usually living alone, or two or more people usually living<br />
together and sharing facilities (e.g. eating facilities, cooking facilities, bathroom and toilet facilities, a living area), in a private dwelling.<br />
A Mäori household is therefore a household where at least one occupant is of Mäori ethnicity. Because ethnicity is self-perceived,<br />
people can identify with Mäori ethnicity even though they are not descended from a Mäori ancestor. Conversely, people choose to not<br />
identify with Mäori ethnicity even though they are descended from a Mäori ancestor. Ethnicity is not the same as birthplace.<br />
TE PUNI KÖKIRI<br />
REPORT ON THE MÄORI ASSET BASE IN THE WAIARIKI ECONOMY
Table 10.7 breaks down personal incomes for<br />
Mäori and non-Mäori in the Bay of Plenty<br />
region. In 2006, 22 percent of the resident<br />
population of the Bay of Plenty region had a<br />
personal income of $10,001 to $20,000.<br />
While personal incomes for Mäori and<br />
non-Mäori in the Bay of Plenty region are<br />
comparable in the $20,001 to $50,000 income<br />
range, 46 percent of Mäori had a personal<br />
income of $20,000 or less. This difference in<br />
income may be due to the large number of<br />
Mäori who were in unskilled and semi-skilled<br />
occupations in 2006. For example, 22 percent<br />
of Mäori in the Bay of Plenty region in 2006<br />
were employed as labourers, and labourers<br />
have a lower personal income than people<br />
employed as managers.<br />
45<br />
TABLE 10.7: PERSONAL INCOMES, BAY OF PLENTY REGION<br />
Personal incomes (BoP) Mäori % Non-Mäori % Total %<br />
Less than $10,000 10,095 23 24,579 17 35,223 17<br />
$10,001 to $20,000 9,843 23 35,073 24 45,675 22<br />
$20,001 to $30,000 7,044 16 22,497 15 29,928 14<br />
$30,001 to $40,000 5,088 12 19,542 13 24,909 12<br />
$40,001 to $50,000 2,607 6 12,243 8 15,048 7<br />
$50,001 to $70,000 2,295 5 13,638 9 16,077 8<br />
$70,001 to $100,000 759 2 5,496 4 6,315 3<br />
More than $100,000 330 1 4,404 3 4,818 2<br />
Not Stated 5,481 13 8,175 6 29,031 14<br />
Total 43,539 100 145,653 100 207,024 100<br />
Source: Statistics New Zealand 2006 Census of Population and Dwellings<br />
APPENDICES
46<br />
As illustrated in Table 10.8, 58 percent of<br />
Mäori received an income from wages and<br />
salaries in 2006, compared to 50 percent<br />
of non-Mäori in the Bay of Plenty region.<br />
A smaller proportion of Mäori received an<br />
income from self-employment (seven percent)<br />
compared to non-Mäori (19 percent).<br />
TABLE 10.8: SOURCE OF INCOME, BAY OF PLENTY REGION 32<br />
While a larger proportion of Mäori received<br />
an unemployment, sickness or invalids benefit<br />
compared to non-Mäori, a small proportion<br />
of Mäori received the NZ Superannuation or<br />
Veterans Pension (seven percent) compared to<br />
non-Mäori (20 percent).<br />
Bay of Plenty Mäori % of WAP Non-Mäori % of WAP Total % of WAP<br />
Wages, Salary, Commissions, Bonuses, etc 25,086 58 77,898 50 104,196 53<br />
Self-employment or Business 3,180 7 29,544 19 33,225 17<br />
Interest, Dividends, Rent, Other Invest. 2,961 7 43,512 28 47,046 24<br />
Payments from a Work Accident Insurer 810 2 2,448 2 3,297 2<br />
NZ Superannuation or Veterans Pension 3,039 7 31,377 20 35,154 18<br />
Other Super., Pensions, Annuities 459 1 5,364 3 5,922 3<br />
Unemployment Benefit 3,777 9 2,538 2 6,426 3<br />
Sickness Benefit 1,926 4 2,973 2 5,001 3<br />
Domestic Purposes Benefit 4,518 10 3,618 2 8,214 4<br />
Invalids Benefit 1,635 4 2,997 2 4,713 2<br />
Student Allowance 1,149 3 1,668 1 2,838 1<br />
Other Govt Benefits, Payments or Pension 1,920 4 4,665 3 6,627 3<br />
Other Sources of Income 846 2 2,556 2 3,444 2<br />
No Source of Income During That Time 2,967 7 5,958 4 9,090 5<br />
Income Source Not Specified 2,289 5 3,177 2 20,574 10<br />
Working Age Population (WAP) 43,536 154,575 198,111<br />
Source: Statistics New Zealand 2006 Census of Population and Dwellings<br />
32 Income is what a person aged 15 years and over receives before tax for a financial year from all sources, e.g. wages, salary,<br />
social welfare payments, interest, dividends, commission, pre-tax business or farming income (less expenses).<br />
TE PUNI KÖKIRI<br />
REPORT ON THE MÄORI ASSET BASE IN THE WAIARIKI ECONOMY
10.4 LABOUR FORCE AND<br />
EMPLOYMENT<br />
In 2006, 58.1 percent of Mäori in the Bay of<br />
Plenty Region were employed. This is illustrated in<br />
Table 10.9, which shows the labour force status of<br />
Mäori and non-Mäori in the Bay of Plenty region.<br />
Similar to non-Mäori, the majority of Mäori<br />
(44.2 percent) were employed full-time while<br />
almost 14 percent of Mäori were employed<br />
part-time. The Mäori working age population,<br />
people between the ages of 15 and 64 years<br />
old, was approximately 43,536 people in 2006.<br />
47<br />
TABLE 10.9: LABOUR FORCE STATUS, BAY OF PLENTY REGION 33<br />
Labour force status (BoP) Mäori % Non-Mäori % Total %<br />
Total Employed 25,302 58 92,163 60 118,470 60<br />
Employed <strong>Full</strong>-time 19,233 44 70,659 46 89,892 45<br />
Employed Part-time 6,069 14 22,509 15 28,578 14<br />
Unemployed 3,960 9 3,762 2 7,722 4<br />
Total Labour Force 29,262 67 95,925 62 126,192 64<br />
Not in the Labour Force 14,274 33 50,676 33 64,950 33<br />
Working Age Population 43,536 154,575 198,111<br />
Source: Statistics New Zealand 2006 Census of Population and Dwellings<br />
Table 10.10 shows the employment status of<br />
Mäori and non-Mäori in the Bay of Plenty region.<br />
A larger proportion of Mäori than non-Mäori<br />
were paid employees in the Bay of Plenty<br />
region in 2006. In contract only 5.8 percent of<br />
Mäori were self-employed compared to 13.2<br />
percent of the regional population.<br />
TABLE 10.10: EMPLOYMENT STATUS, BAY OF PLENTY REGION 34<br />
Employment status (BoP) Mäori % Non-Mäori % Total %<br />
Paid Employee 21,081 88 65,091 72 86,694 75<br />
Employer 807 3 9,246 10 10,125 9<br />
Self-Employed and Without Employees 1,467 6 13,563 15 15,162 13<br />
Unpaid Family Worker 564 2 2,289 3 2,883 3<br />
Not Elsewhere Included 1,383 5 1,971 2 3,606 3<br />
Total Employed 25,302 92,163 118,470<br />
Source: Statistics New Zealand 2006 Census of Population and Dwellings<br />
33 Employed refers to all people in the working-age population who worked for one hour or more during a reference week in the<br />
context of an employee/employer relationship or self-employment. <strong>Full</strong>-time employment refers to a person who usually works 30<br />
hours or more per week, while the part-time employed usually work fewer than 30 hours per week. Unemployed refers to all people<br />
in the working-age population who during their reference week were without a paid job, were available for work and had actively<br />
sought work in the past four weeks ending with the reference week or had a new job to start within four weeks. Working age<br />
population refers to the population aged 15 years and over who may be in the workforce.<br />
34 Employment status is the status that a respondent to the Census has indicated in regards to the labour force. This applies to people<br />
who are in full and part-time employment. Employment status categories are paid employee, self-employed and without employees,<br />
employer, and unpaid family worker. Self-employed refers to a person who operates their own economic enterprise or engages<br />
independently in a profession or trade (including partnerships). Self-employed and without employees refers to a person who operates<br />
their own economic enterprise or engages independently in a profession or trade (including partnerships) and hires no employees.<br />
APPENDICES
48<br />
10.5 INDUSTRY AND OCCUPATION<br />
There are important differences between Mäori<br />
and non-Mäori in terms of the industries and<br />
occupations they are employed in, which impacts<br />
on their economic performance.<br />
TABLE 10.11: EMPLOYMENT BY INDUSTRY, BAY OF PLENTY REGION<br />
Table 10.11 breaks down Mäori and non-Mäori<br />
employment in the Bay of Plenty region by<br />
industry at the ANZSIC 1-digit level on<br />
census night 2006. 35 This employment refers to<br />
people who are in the working age population,<br />
people between the aged 15 years old and older.<br />
Employment by industry (BoP) Mäori % Non-Mäori % Total %<br />
Agriculture, Forestry and Fishing 2,232 9 8,412 9.13 10,728 9<br />
Mining 39 0.2 114 0.1 153 0.1<br />
Manufacturing 3,291 13 9,930 11 13,308 0.1<br />
Electricity, Gas and Water Supply 75 0.3 255 0.3 333 0.3<br />
Construction 2,181 9 8,511 9 10,770 9<br />
Wholesale Trade 852 3 4,479 5 5,355 5<br />
Retail Trade 2,541 10 12,837 14 15,465 13<br />
Accommodation, Cafes and Restaurants 1,485 6 4,377 5 5,892 5<br />
Transport and Storage 1,158 5 3,225 3 4,410 4<br />
Communication Services 219 0.9 663 0.7 888 0.7<br />
Finance and Insurance 315 1 2,178 2 2,505 2<br />
Property and Business Services 1,854 7 10,572 11 12,492 11<br />
Government Administration and Defence 678 3 2,070 2 2,763 2<br />
Education 2,268 9 6,078 7 8,394 7<br />
Health and Community Services 2,046 8 8,613 9 10,731 9<br />
Cultural and Recreational Services 684 3 1,878 4 2,583 2<br />
Personal and Other Services 999 4 3,399 4 4,422 4<br />
Not Elsewhere Included 2,379 9 4,581 5 7,281 6<br />
Total Employed 25,302 92,163 118,470<br />
Source: Statistics New Zealand 2006 Census of Population and Dwellings<br />
The largest area of employment in the Bay of<br />
Plenty region in 2006 was retail trade followed<br />
by manufacturing, and property and business<br />
services. This is similar to national trends where<br />
retail trade and the business and property<br />
services industry dominate employment.<br />
In 2006, 13 percent of Mäori were employed<br />
in the manufacturing industry in the Bay of<br />
Plenty Region. This is higher than the regional<br />
average of 11.2 percent of employment.<br />
A large proportion of the resident population<br />
of the Kawerau District is Mäori, and there<br />
35 The industry classifications used in this research are the Australian and New Zealand Standard Industrial Classification<br />
(ANZSIC) 2006. This is a hierarchical classification with four levels: divisions (the broadest level), subdivisions, groups and classes.<br />
For the purposes of this research we have examined industries at the division level (1-digit). This level provides a limited number of<br />
categories that show a broad picture of the economy and suitable for the publication of summary tables of official statistics.<br />
TE PUNI KÖKIRI<br />
REPORT ON THE MÄORI ASSET BASE IN THE WAIARIKI ECONOMY
are major employers in the manufacturing<br />
industry based in this district. Other large<br />
areas of employment for Mäori in this<br />
region included the retail trade, education,<br />
agriculture, forestry and fishing, construction,<br />
and health and community services industries.<br />
Table 10.12 shows Mäori and non-Mäori<br />
employment in the Bay of Plenty region broken<br />
down into eight occupation groups on census<br />
night 2006.<br />
49<br />
TABLE 10.12: EMPLOYMENT BY OCCUPATION, BAY OF PLENTY REGION 36<br />
Employment by occupation (BoP) Mäori % Non-Mäori % Total %<br />
Managers 2,610 11 18,420 21 21,030 18<br />
Professionals 3,273 14 16,098 18 19,371 16<br />
<strong>Te</strong>chnicians and Trades Workers 2,757 12 12,636 14 15,393 13<br />
Community and Personal Service Workers 2,421 11 6,840 8 9,261 8<br />
Clerical and Administrative Workers 2,235 10 11,115 13 13,350 11<br />
Sales Workers 1,830 8 9,258 10 11,088 9<br />
Machinery Operators and Drivers 2,568 11 4,722 5 7,290 6<br />
Labourers 5,256 23 9,573 11 14,829 13<br />
Not Elsewhere Included 2,349 9 4,509 5 6,858 6<br />
Total Employed 25,302 93,171 118,470<br />
Source: Statistics New Zealand 2006 Census of Population and Dwellings<br />
Mäori in the Bay of Plenty region are underrepresented<br />
in the managers and professionals<br />
occupations and over-represented in the<br />
labourers, machinery operators and drivers,<br />
and community and personal service workers<br />
occupations.<br />
In 2006, 22.9 percent of Mäori in the Bay of<br />
Plenty region were employed as labourers. This<br />
is almost twice the regional average of 12.5<br />
percent. Managers were the largest occupation<br />
in the Bay of Plenty region, employing 17.8<br />
percent of the population, followed by<br />
professionals with 16.4 percent. The second<br />
largest area of employment for Mäori was<br />
professionals at 14.3 percent.<br />
36 Non-Mäori includes people who are in the Not Elsewhere Included category. The numbers in the total employed columns in the<br />
industry and occupation tables do not add up because the Not Elsewhere Included category may include some Mäori.<br />
APPENDICES
50<br />
All work is done, and services rendered at the request of, and for the purposes of the<br />
client only. Neither BERL nor any of its employees accepts any responsibility on any<br />
grounds whatsoever, including negligence, to any other person.<br />
While every effort is made by BERL to ensure that the information, opinions and<br />
forecasts provided to the client are accurate and reliable, BERL shall not be liable for any<br />
adverse consequences of the client’s decisions made in reliance of any report provided<br />
by BERL, nor shall BERL be held to have given or implied any warranty as to whether any<br />
report provided by BERL will assist in the performance of the client’s functions.<br />
TE PUNI KÖKIRI<br />
REPORT ON THE MÄORI ASSET BASE IN THE WAIARIKI ECONOMY
TE PUNI KÖKIRI REPORT ON THE MÄORI ASSET BASE IN THE WAIARIKI ECONOMY
<strong>Te</strong> <strong>Puni</strong> Kökiri, <strong>Te</strong> <strong>Puni</strong> Kökiri House<br />
143 Lambton Quay, PO Box 3943, Wellington, New Zealand<br />
PHN Waea + 64 4 819 6000 FAX Waea Whakaahua + 64 4 819 6299<br />
www.tpk.govt.nz