brand Barilla - The International EPD® System
brand Barilla - The International EPD® System
brand Barilla - The International EPD® System

Create successful ePaper yourself
Turn your PDF publications into a flip-book with our unique Google optimized e-Paper software.
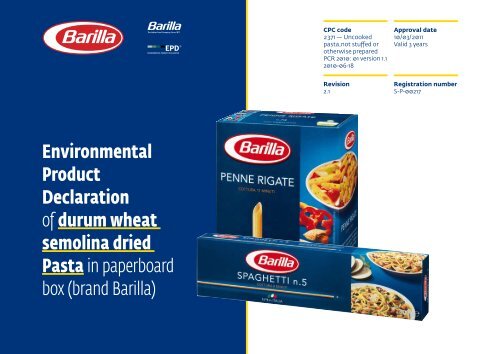
CPC code<br />
2371 — Uncooked<br />
pasta,not stuffed or<br />
otherwise prepared<br />
PCR 2010: 01 version 1.1<br />
2010-06-18<br />
Approval date<br />
10/03/2011<br />
Valid 3 years<br />
Revision<br />
2.1<br />
Registration number<br />
S-P-00217<br />
Environmental<br />
Product<br />
Declaration<br />
of durum wheat<br />
semolina dried<br />
Pasta in paperboard<br />
box (<strong>brand</strong> <strong>Barilla</strong>)
01.<br />
the <strong>brand</strong> barilla<br />
<strong>The</strong> Brand <strong>Barilla</strong>, born in the 1877 from a<br />
small pasta shop in Parma, represents now<br />
one of the most known pasta’s <strong>brand</strong> around<br />
the world.<br />
<strong>Barilla</strong> is a leading company in the Italian<br />
and <strong>International</strong> pasta market, where it operates<br />
with the <strong>Barilla</strong> <strong>brand</strong>, as a symbol of<br />
Italian cuisine, and three major local <strong>brand</strong>s<br />
(Misko in Greece, Filiz in Turkey and Yemina in<br />
Mexico).<br />
<strong>Barilla</strong> is also active in the segment of<br />
Ready-made sauces, with over 40 different<br />
recipes to meet everyone’s taste worldwide.<br />
Brand<br />
and Product<br />
Plant and process<br />
Dry semolina pasta from durum wheat is<br />
produced by wire drawing, lamination and<br />
drying of dough prepared with durum wheat<br />
semolina and water. <strong>The</strong> pasta production<br />
process avoid using additives and preservatives:<br />
it is drying process that guarantee the<br />
conservation.<br />
Every year, the <strong>Barilla</strong> Group produces<br />
about 1.000.000 tons of pasta in 5 countries<br />
(Italy, Greece, Turkey, United State and<br />
Mexico) and 8 plants: environmental impacts<br />
are presented for each country except<br />
for Mexico.<br />
the product<br />
Products included in the analysis are Classic<br />
semolina formats (penne, rigatoni, spaghetti,<br />
etc.); Piccolini (miniatures of clas-<br />
sic semolina formats); Specialità (barbine,<br />
castellane, farfalle, etc.); Regionali (gnocchetti,<br />
orecchiette, reginette, etc.).<br />
Shape is the only feature differentiating<br />
these products, since they are all produced<br />
using as only ingredients water and semolina.<br />
<strong>The</strong> following products are excluded from<br />
this declaration since, aside from the use of<br />
semolina and water, they are produced with<br />
other ingredients: egg pasta in any shape;<br />
filled pasta (tortellini, etc.); special varieties<br />
of pasta with ingredients different<br />
from durum wheat products, e.g. Orizzonti;<br />
whole meal semolina pasta.<br />
Furthermore durum wheat dry pasta not<br />
packed in paperboard boxes or sold with<br />
other label is excluded.<br />
product content and nutritional info<br />
<strong>The</strong> durum wheat semolina pasta concerned<br />
by this declaration is made only by durum<br />
semolina and water, with an humidity content<br />
of about 13%. From a nutritional point of<br />
view, its main characteristics are:<br />
proteins<br />
carbohydrates<br />
fats<br />
fiber<br />
sodium<br />
energy<br />
— Data per 100 g of Product<br />
12 g<br />
72,2 g<br />
1,5 g<br />
3,0 g<br />
0,002 g<br />
350 kcal<br />
EPD durum wheat semolina Pasta, 10/03/2011 | 2
02.<br />
<strong>Barilla</strong> Group<br />
<strong>The</strong> Group dates back to 1877, from the pasta<br />
and bread boutique in the centre of Parma<br />
(Italy), owned by Pietro <strong>Barilla</strong>. Since then,<br />
progress has always come under a guiding<br />
hand, with exception from the period between<br />
1971 and 1979, through a passing of<br />
generations from father to son.<br />
<strong>Barilla</strong> today stands as one of the top<br />
Italian food groups, leading company in<br />
the pasta market around the world, the processed<br />
sauce market of continental Europe,<br />
and the flatbread market in Scandinavia.<br />
<strong>The</strong> Group, that is now driven by the three<br />
brothers Guido, Luca and Paolo, employs a<br />
workforce of over 15.000 people and has an<br />
annual turnover of 4,1 billion euro in 47 production<br />
plants (14 in Italy and 33 abroad),<br />
including 9 mills that provide the majority<br />
of raw materials required for the Group’s<br />
production of pasta and oven-baked goods.<br />
Products are exported to over 150 countries:<br />
the plants provide an annual production<br />
of nearly 3 million tons of foodstuff<br />
that are consumed worldwide under the label<br />
of various <strong>brand</strong>s. www.barillagroup.com<br />
<strong>The</strong> Group’s <strong>brand</strong>s<br />
<strong>The</strong> Group’s <strong>brand</strong>s fall into two principle<br />
business areas: meal solution and bakery<br />
products. In the Meal Solution section, <strong>Barilla</strong><br />
leads the pasta market both in Italy and<br />
worldwide, in which it sells under the <strong>Barilla</strong><br />
<strong>brand</strong> name, symbol of Italian gastronomy,<br />
and with lead <strong>brand</strong>s at a local level (Misko in<br />
Greece, Filiz in Turkey and Yemina in Mexico).<br />
In addition, <strong>Barilla</strong> also claims leadership in<br />
the processed sauce segment, with over 40<br />
different recipes to guarantee the right solution<br />
tailored to the needs of a worldwide<br />
market. <strong>The</strong> area of baked goods includes<br />
products that cover the different moments<br />
of consumption, from breakfast meals to<br />
snacks such as: biscuits, toasted bread, cereals,<br />
snacks, confectionery, soft breads, pastries<br />
and snacks, cakes and crispbread for bid<br />
which includes almost 180 products, fruit of<br />
35 different production technologies.<br />
<strong>The</strong> product <strong>brand</strong>s are flanked by the<br />
<strong>brand</strong> Number 1, group company specialized<br />
in logistic services, and First for retail sales<br />
services.<br />
EPD durum wheat semolina Pasta, 10/03/2011 | 3
03.<br />
<strong>The</strong> Environmental performance of pasta — the delivery of products to distribution<br />
was calculated using the LCA (life cycle platforms.<br />
analysis) methodology, including the entire<br />
production chain, starting from the durum<br />
wheat cultivation until the delivery of formation for consumer on product use and<br />
Downstream processes that include, in-<br />
the finished product to main distribution waste disposal processes of primary packaging.<br />
platforms.<br />
<strong>The</strong> study was conducted following the<br />
specific product rules published for the EPD<br />
system: “CPC code 2371 – Uncooked pasta,<br />
not stuffed or otherwise prepared”.<br />
raw materials<br />
cultivation<br />
<strong>The</strong> generic data contributes to the calculation<br />
of environmental impacts is lower<br />
than the 10%.<br />
milling process<br />
declared unit<br />
Data are referred to 1 kg of product.<br />
upstream<br />
processes<br />
<strong>System</strong> boundaries<br />
<strong>The</strong> processes constituting the system analyzed<br />
were organized according to following<br />
three successive phases, in compliance with<br />
the requisites of the EPD system:<br />
core<br />
processes<br />
pasta production<br />
Packaging<br />
Environmental<br />
Performance<br />
Calculation<br />
Upstream processes that include:<br />
— the cultivation of durum wheat with<br />
relevant agricultural phases;<br />
— the production of fertilizers and other<br />
substances used to sustain agricultural<br />
production.<br />
Core process that includes:<br />
— the production and packaging of the<br />
products;<br />
— the production of packaging materials;<br />
downstream<br />
processes<br />
Distribution<br />
packaging<br />
end of life<br />
cooking phase<br />
EPD durum wheat semolina Pasta, 10/03/2011 | 4
General<br />
hypotheses<br />
adopted<br />
Here the main relevant hypotheses are<br />
presented. More details are available on<br />
the technical document mentioned in the<br />
references.<br />
1. durum wheat Cultivation<br />
Durum wheat cultivation considers the specific durum<br />
wheat origin; twelve different regions are analysed<br />
(North, Middle and South Italy; France, North and South<br />
- West U.S.A.; Canada; Mexico; Turkey; Spain; Greece;<br />
Australia).<br />
Primary data (from durum wheat suppliers) are<br />
used for fertilizers amount, crop yields and water use;<br />
secondary data (mainly from ecoinvent database, www.<br />
ecoinvent.ch) are used for fertilizers production and diesel<br />
production and use. Yields are referred to 2009 year.<br />
2. milling process<br />
Milling process environmental performances are<br />
calculated considering energy and water consumptions<br />
for each <strong>Barilla</strong> property mill: 4 in Italy (Pedrignano,<br />
Altamura, Castelplanio, Ferrara); 1 in U.S.A. (Ames), 1 in<br />
Turkey (Bolu) and 1 in Greece (Volos). <strong>Barilla</strong> purchases<br />
semolina from non property mill for Italian production<br />
(20% of the whole semolina used), the environmental<br />
impacts of them are considered equal to property<br />
mill and for american production (39% of the whole<br />
semolina used). Semolina used in non property mill has<br />
a different provenience that is considered in the model.<br />
Primary data (2009 year) are used for water and energy<br />
consumption and waste production, secondary data<br />
(ecoinvent database) are used for water management<br />
and energy consumption.<br />
3. pasta production<br />
Pasta production environmental performances are<br />
calculated considering energy and water consumption.<br />
7 plants are considered in the analysis: 3 in Italy, 2 in<br />
U.S.A., 1 in Greece and 1 in Turkey. For Italy and U.S.A.<br />
performances are calculated weighing each plant on the<br />
basis of its pasta production.<br />
Primary data (2009 year) are used for energy and<br />
water consumption and for waste production; secondary<br />
data (ecoinvent database) are used for energy and water<br />
production.<br />
Indication about the production plant where pasta<br />
is produced is given on product packaging near the<br />
expiration date.<br />
7. cooking phase<br />
<strong>The</strong> product need to be cooked before eat it.<br />
Environmental performances relative to cooking phase<br />
are out of the boundaries because they depend on the<br />
consumer habits. Environmental impacts estimation<br />
is given considering twice the environmental aspects<br />
related to the cooking 0f 500 grams of pasta. <strong>The</strong> main<br />
hypothesis used for the calculation are the following:<br />
– installed power for gas and electric cooker: 3 kW;<br />
– transmission efficiency: 40%;<br />
– cooking time: 35 minutes for cooking 500 grams of<br />
pasta (25 minutes to bring water to the boil and 10<br />
minutes for pasta);<br />
– necessary water: 1 litre of water each 100 grams<br />
of pasta.<br />
For each country an estimation is given using both 100%<br />
gas cooker (lower bound in figure with ecological, carbon<br />
and water footprint) and 100% electric cooker (upper<br />
bound in the same figure).<br />
6. packaging end of life<br />
Environmental performances relative to waste disposal<br />
of packaging are out of the boundaries because they<br />
depend on the consumer habits and organization of<br />
waste collection services.<br />
In order to help the consumer in the disposal phase,<br />
every <strong>Barilla</strong> primary packaging contains an icon that<br />
states the packaging material and suggestions for proper<br />
disposal.<br />
5. distribution<br />
Distribution environmental performances are calculated<br />
using specific hypotheses for each area.<br />
Primary data are used for kilometers covered by truck,<br />
train and ship; secondary data (ecoinvent database) for<br />
transport means.<br />
4. packaging<br />
Environmental performances are calculated taking into<br />
account the heaviest packaging used per kg of product,<br />
for all the other items of this product, the impacts<br />
related to this phase are lower.<br />
For Italy, Greece and Turkey the packaging considered<br />
is those of Fusilli (500 g format) and for U.S.A. Penne<br />
Rigate (16 oz format).<br />
Primary data are used for packaging amount and<br />
secondary data for packaging materials production.<br />
EPD durum wheat semolina Pasta, 10/03/2011 | 5
04.<br />
Plants<br />
Transports<br />
road ≈ 1.500 km<br />
55% Pedrignano<br />
durum wheat provenience<br />
34% Foggia<br />
4% canada<br />
7% france<br />
6% mexico<br />
11% Marcianise 60% italy<br />
2% greece<br />
12% U.S.A.<br />
8% australia<br />
1% turkey<br />
upstream processes<br />
core processes<br />
non renewable<br />
resources<br />
Raw materials<br />
cultivation<br />
Milling<br />
Packaging<br />
Pasta<br />
production<br />
Distribution<br />
Total<br />
Environmental<br />
Results<br />
Italy (for local<br />
consumption)<br />
Material<br />
resources<br />
— data in grams<br />
energy<br />
resources<br />
— data in grams<br />
Gravel<br />
Phoshorous<br />
Potassium chloride<br />
Limestone (CaCO₃)<br />
Aluminium slicates<br />
Others<br />
Coal<br />
Oil<br />
Natural gas<br />
Uranium<br />
Others<br />
<strong>The</strong> difference from these results and those of Italy (for exportation) is due only to the distribution phase<br />
0,6 0,0 11,1 2,7 0,0 14,4<br />
6,6 0,0 0,0 0,0 0,0 6,6<br />
5,8 0,0 0,1 0,0 0,0 5,9<br />
2,4 0,1 0,8 1,8 0,0 5,1<br />
0,0 0,0 0,2 1,6 0,0 1,8<br />
1,8 0,0 1,1 0,3 0,0 3,2<br />
14,6 4,3 12,5 16,1 0,6 48,1<br />
74,5 5,8 5,8 4,6 24,0 114,7<br />
32,7 8,5 26,5 71,1 1,2 140,0<br />
upstream processes<br />
core processes<br />
renewable resources<br />
— data per 1 kg of product<br />
Raw materials<br />
cultivation<br />
Milling<br />
Packaging<br />
Pasta<br />
production<br />
Distribution<br />
Total<br />
energy resources<br />
— data per in MJ<br />
Hydroelectric<br />
Wind<br />
Solar<br />
0,03 0,03 0,03 0,09 0,00 0,18<br />
0,00 0,00 0,00 0,01 0,00 0,01<br />
0,00<br />
0,00<br />
0,00<br />
0,01<br />
0,00<br />
0,01<br />
upstream processes<br />
core processes<br />
fresh water consumption<br />
— data in litres<br />
Raw materials<br />
cultivation<br />
Milling<br />
Packaging<br />
Pasta<br />
production<br />
Distribution<br />
Total<br />
63,7<br />
0,2<br />
1,9<br />
3,6<br />
0,1<br />
69,5<br />
impact indicators<br />
— for GWP values<br />
see Carbon Footprint<br />
per 1 kg of product<br />
Raw materials<br />
cultivation<br />
upstream processes<br />
Milling<br />
Packaging<br />
Pasta<br />
production<br />
core processes<br />
Distribution<br />
Total<br />
Ozone-depleting potential<br />
mg CFC11 equivalent<br />
0,048<br />
0,008<br />
0,020<br />
0,049<br />
0,011<br />
0,136<br />
Ozone-creating potential<br />
g C₂H₄ equivalent<br />
0,42<br />
0,03<br />
0,06<br />
0,10<br />
0,06<br />
0,67<br />
Acidification potential<br />
g SO₄ equivalent<br />
9,4<br />
0,2<br />
0,3<br />
0,5<br />
0,5<br />
10,9<br />
Eutrophication potential<br />
g PO₄ equivalent<br />
7,7<br />
0,0<br />
0,1<br />
0,1<br />
0,1<br />
8,0<br />
upstream processes<br />
core processes<br />
Waste per 1 kg of product*<br />
Raw materials<br />
cultivation<br />
Milling<br />
Packaging<br />
Pasta<br />
production<br />
Distribution<br />
Total<br />
Hazardous<br />
Italy<br />
(for local consumption)<br />
Raw materials<br />
cultivation<br />
Milling Packaging Pasta<br />
Distribution<br />
production<br />
From field<br />
to Distribution<br />
Cooking phase<br />
Ecological<br />
Footprint<br />
9,2<br />
0,1<br />
0,6<br />
0,8<br />
0,2<br />
10,9<br />
global m²/kg<br />
2<br />
6<br />
Carbon<br />
Footprint<br />
GWP<br />
795<br />
54<br />
128<br />
273<br />
82<br />
1.332<br />
g CO₂/kg<br />
800<br />
2.200<br />
Water<br />
Footprint<br />
1.586<br />
0<br />
2<br />
4<br />
0<br />
1.592<br />
liters/kg<br />
10<br />
EPD durum wheat semolina Pasta, 10/03/2011 | 8
05.<br />
Plants<br />
Transports<br />
road ≈ 2.000 km<br />
train ≈ 100 km<br />
ship ≈ 8.000 km<br />
55% Pedrignano<br />
durum wheat provenience<br />
34% Foggia<br />
11% Marcianise<br />
60% italy<br />
4% canada<br />
7% france<br />
6% mexico<br />
2% greece<br />
12% U.S.A.<br />
8% australia<br />
1% turkey<br />
upstream processes<br />
core processes<br />
non renewable<br />
resources<br />
Raw materials<br />
cultivation<br />
Milling<br />
Packaging<br />
Pasta<br />
production<br />
Distribution<br />
Total<br />
Environmental<br />
Results<br />
Italy<br />
(for export)<br />
Material<br />
resources<br />
— data in grams<br />
energy<br />
resources<br />
— data in grams<br />
Gravel<br />
Phoshorous<br />
Potassium chloride<br />
Limestone (CaCO₃)<br />
Aluminium slicates<br />
Others<br />
Coal<br />
Oil<br />
Natural gas<br />
Uranium<br />
Others<br />
<strong>The</strong> difference from these results and those of Italy (for exportation) is due only to the distribution phase<br />
0,6 0,0 11,1 2,7 0,0 14,4<br />
6,6 0,0 0,0 0,0 0,0 6,6<br />
5,8 0,0 0,1 0,0 0,0 5,9<br />
2,4 0,1 0,8 1,8 0,0 5,1<br />
0,0 0,0 0,2 1,6 0,0 1,8<br />
1,8 0,0 1,1 0,3 0,0 3,2<br />
14,6 4,3 12,5 16,1 1,4 48,9<br />
74,5 5,8 5,8 4,6 33,0 123,7<br />
32,7 8,5 26,5 71,1 1,7 140,5<br />
upstream processes<br />
core processes<br />
renewable resources<br />
— data per 1 kg of product<br />
Raw materials<br />
cultivation<br />
Milling<br />
Packaging<br />
Pasta<br />
production<br />
Distribution<br />
Total<br />
energy resources<br />
— data per in MJ<br />
Hydroelectric<br />
Wind<br />
Solar<br />
0,03 0,03 0,03 0,09 0,00 0,18<br />
0,00 0,00 0,00 0,01 0,00 0,01<br />
0,00<br />
0,00<br />
0,00<br />
0,01<br />
0,00<br />
0,01<br />
upstream processes<br />
core processes<br />
fresh water consumption<br />
— data in litres<br />
Raw materials<br />
cultivation<br />
Milling<br />
Packaging<br />
Pasta<br />
production<br />
Distribution<br />
Total<br />
63,7<br />
0,2<br />
1,9<br />
3,6<br />
0,1<br />
69,5<br />
impact indicators<br />
— for GWP values<br />
see Carbon Footprint<br />
per 1 kg of product<br />
Raw materials<br />
cultivation<br />
upstream processes<br />
Milling<br />
Packaging<br />
Pasta<br />
production<br />
core processes<br />
Distribution<br />
Total<br />
Ozone-depleting potential<br />
mg CFC11 equivalent<br />
0,048<br />
0,008<br />
0,020<br />
0,049<br />
0,015<br />
0,140<br />
Ozone-creating potential<br />
g C₂H₄ equivalent<br />
0,42<br />
0,03<br />
0,06<br />
0,10<br />
0,09<br />
0,70<br />
Acidification potential<br />
g SO₄ equivalent<br />
9,4<br />
0,2<br />
0,3<br />
0,5<br />
0,7<br />
11,1<br />
Eutrophication potential<br />
g PO₄ equivalent<br />
7,7<br />
0,0<br />
0,1<br />
0,1<br />
0,2<br />
8,1<br />
upstream processes<br />
core processes<br />
Waste per 1 kg of product*<br />
Raw materials<br />
cultivation<br />
Milling<br />
Packaging<br />
Pasta<br />
production<br />
Distribution<br />
Total<br />
Hazardous<br />
Italy<br />
(for exportation)<br />
Raw materials<br />
cultivation<br />
Milling Packaging Pasta<br />
Distribution<br />
production<br />
From field<br />
to Distribution<br />
Cooking phase<br />
Ecological<br />
Footprint<br />
9,2<br />
0,1<br />
0,6<br />
0,8<br />
0,3<br />
11<br />
global m²/kg<br />
2<br />
6<br />
Carbon<br />
Footprint<br />
GWP<br />
795<br />
54<br />
128<br />
273<br />
114<br />
1.364<br />
g CO₂/kg<br />
800<br />
2.200<br />
Water<br />
Footprint<br />
1.586<br />
0<br />
2<br />
4<br />
0<br />
1.592<br />
liters/kg<br />
10<br />
EPD durum wheat semolina Pasta, 10/03/2011 | 11
06.<br />
Plants<br />
Transports<br />
road ≈ 8.000 km<br />
49% Ames<br />
51% Avon<br />
train ≈ 5.300 km<br />
durum wheat provenience<br />
32% south u.s.a.<br />
47% canada<br />
21% north u.s.a.<br />
upstream processes<br />
core processes<br />
non renewable<br />
resources<br />
Raw materials<br />
cultivation<br />
Milling<br />
Packaging<br />
Pasta<br />
production<br />
Distribution<br />
Total<br />
Potassium chloride<br />
19,3 0,0 0,1 0,0 0,0 19,4<br />
Environmental<br />
Results<br />
U.S.A.<br />
Material<br />
resources<br />
— data in grams<br />
energy<br />
resources<br />
— data in grams<br />
Gravel<br />
Phoshorous<br />
Limestone (CaCO₃)<br />
Alogenate<br />
Others<br />
Coal<br />
Oil<br />
Natural gas<br />
Uranium<br />
Others<br />
0,7 0,0 8,8 0,1 0,0 9,6<br />
6,5 0,0 0,0 0,0 0,0 6,5<br />
2,8 0,3 0,6 1,1 0,2 5,0<br />
1,6 0,0 0,0 0,0 0,0 1,6<br />
0,2 0,0 1,0 0,1 0,0 1,3<br />
39,5 25,1 10,2 96,3 13,3 184,4<br />
70,3 40,4 4,8 2,8 45,1 163,4<br />
38,1 11,3 22,7 53,8 3,6 129,5<br />
upstream processes<br />
core processes<br />
renewable resources<br />
— data per 1 kg of product<br />
Raw materials<br />
cultivation<br />
Milling<br />
Packaging<br />
Pasta<br />
production<br />
Distribution<br />
Total<br />
energy resources<br />
— data per in MJ<br />
Hydroelectric<br />
Wind<br />
Solar<br />
0,07 0,02 0,03 0,08 0,02 0,22<br />
0,01 0,00 0,00 0,01 0,00 0,02<br />
0,00<br />
0,00<br />
0,00<br />
0,00<br />
0,00<br />
0,00<br />
upstream processes<br />
core processes<br />
fresh water consumption<br />
— data in litres<br />
Raw materials<br />
cultivation<br />
Milling<br />
Packaging<br />
Pasta<br />
production<br />
Distribution<br />
Total<br />
378,1 0,4 1,6 1,1 0,4 381,6<br />
impact indicators<br />
— for GWP values<br />
see Carbon Footprint<br />
per 1 kg of product<br />
Raw materials<br />
cultivation<br />
upstream processes<br />
Milling<br />
Packaging<br />
Pasta<br />
production<br />
core processes<br />
Distribution<br />
Total<br />
Ozone-depleting potential<br />
mg CFC11 equivalent<br />
0,050<br />
0,022<br />
0,017<br />
0,028<br />
0,021<br />
0,138<br />
Ozone-creating potential<br />
g C₂H₄ equivalent<br />
0,41<br />
0,13<br />
0,05<br />
0,13<br />
0,13<br />
0,85<br />
Acidification potential<br />
g SO₄ equivalent<br />
9,4<br />
1,1<br />
0,2<br />
1,5<br />
1,0<br />
13,2<br />
Eutrophication potential<br />
g PO₄ equivalent<br />
7,9<br />
0,2<br />
0,1<br />
0,1<br />
0,2<br />
8,5<br />
upstream processes<br />
core processes<br />
Waste per 1 kg of product*<br />
Raw materials<br />
cultivation<br />
Milling<br />
Packaging<br />
Pasta<br />
production<br />
Distribution<br />
Total<br />
Hazardous<br />
data per kg of product<br />
U.S.A.<br />
Raw materials<br />
cultivation<br />
Milling Packaging Pasta<br />
Distribution<br />
production<br />
From field<br />
to Distribution<br />
Cooking phase<br />
Ecological<br />
Footprint<br />
10<br />
0,6<br />
0,5<br />
0,9<br />
0,5<br />
12,5<br />
global m²/kg<br />
2<br />
8<br />
Carbon<br />
Footprint<br />
GWP<br />
864<br />
211<br />
109<br />
350<br />
174<br />
1.708<br />
g CO₂/kg<br />
800<br />
2.900<br />
Water<br />
Footprint<br />
2.199<br />
0<br />
2<br />
1<br />
0<br />
2.202<br />
liters/kg<br />
10<br />
EPD durum wheat semolina Pasta, 10/03/2011 | 14
data per pound of product<br />
U.S.A.<br />
Raw materials<br />
cultivation<br />
Milling Packaging Pasta<br />
Distribution<br />
production<br />
From field<br />
to Distribution<br />
Cooking phase<br />
Ecological<br />
Footprint<br />
4,5<br />
0,3<br />
0,2<br />
0,4<br />
0,2<br />
5,6<br />
global m²/lb<br />
0,9<br />
3,6<br />
Carbon<br />
Footprint<br />
GWP<br />
392<br />
96<br />
49<br />
159<br />
79<br />
775<br />
g CO₂/lb<br />
360<br />
1.350<br />
Water<br />
Footprint<br />
997<br />
07.<br />
Plants<br />
Transports<br />
road ≈ 2.700 km<br />
sea ≈ 300 km<br />
durum wheat provenience<br />
Thiva<br />
100% greece<br />
upstream processes<br />
core processes<br />
non renewable<br />
resources<br />
Raw materials<br />
cultivation<br />
Milling<br />
Packaging<br />
Pasta<br />
production<br />
Distribution<br />
Total<br />
Phoshorous<br />
14,1 0,0 0,0 0,0 0,0 14,1<br />
Environmental<br />
Results<br />
Greece<br />
Material<br />
resources<br />
— data in grams<br />
energy<br />
resources<br />
— data in grams<br />
Gravel<br />
Limestone (CaCO₃)<br />
Alogenate<br />
Sodium Chloride<br />
Others<br />
Coal<br />
Oil<br />
Natural gas<br />
Uranium<br />
Others<br />
0,6 0,0 11,1 0,0 0,0 11,7<br />
4,6 0,5 0,8 1,8 0,0 7,7<br />
3,6 0,0 0,0 0,0 0,0 3,6<br />
0,1 0,0 0,6 0,0 0,0 0,7<br />
0,7 0,0 0,7 0,0 0,0 1,4<br />
16,7 28,7 12,5 106,6 0,1 164,6<br />
82,1 10,3 5,8 12,5 6,0 116,7<br />
32,5 3,6 26,5 45,5 0,3 108,4<br />
upstream processes<br />
core processes<br />
renewable resources<br />
— data per 1 kg of product<br />
Raw materials<br />
cultivation<br />
Milling<br />
Packaging<br />
Pasta<br />
production<br />
Distribution<br />
Total<br />
energy resources<br />
— data per in MJ<br />
Hydroelectric<br />
Wind<br />
Solar<br />
0,03 0,02 0,03 0,06 0,00 0,14<br />
0,00 0,01 0,00 0,03 0,00 0,04<br />
0,00<br />
0,00<br />
0,00<br />
0,00<br />
0,00<br />
0,00<br />
upstream processes<br />
core processes<br />
fresh water consumption<br />
— data in litres<br />
Raw materials<br />
cultivation<br />
Milling<br />
Packaging<br />
Pasta<br />
production<br />
Distribution<br />
Total<br />
3,5<br />
0,3<br />
1,9<br />
0,8<br />
0,0<br />
6,5<br />
impact indicators<br />
— for GWP values<br />
see Carbon Footprint<br />
per 1 kg of product<br />
Raw materials<br />
cultivation<br />
upstream processes<br />
Milling<br />
Packaging<br />
Pasta<br />
production<br />
core processes<br />
Distribution<br />
Total<br />
Ozone-depleting potential<br />
mg CFC11 equivalent<br />
0,051<br />
0,006<br />
0,020<br />
0,035<br />
0,003<br />
0,115<br />
Ozone-creating potential<br />
g C₂H₄ equivalent<br />
0,47<br />
0,04<br />
0,06<br />
0,10<br />
0,02<br />
0,69<br />
Acidification potential<br />
g SO₄ equivalent<br />
8,7<br />
0,4<br />
0,3<br />
1,2<br />
0,1<br />
10,7<br />
Eutrophication potential<br />
g PO₄ equivalent<br />
10,9<br />
0,0<br />
0,1<br />
0,1<br />
0,0<br />
11,1<br />
upstream processes<br />
core processes<br />
Waste per 1 kg of product*<br />
Raw materials<br />
cultivation<br />
Milling<br />
Packaging<br />
Pasta<br />
production<br />
Distribution<br />
Total<br />
Hazardous<br />
Greece<br />
Raw materials<br />
cultivation<br />
Milling Packaging Pasta<br />
Distribution<br />
production<br />
From field<br />
to Distribution<br />
Cooking phase<br />
Ecological<br />
Footprint<br />
12<br />
0,2<br />
0,6<br />
0,9<br />
0,1<br />
13,8<br />
global m²/kg<br />
2<br />
10<br />
Carbon<br />
Footprint<br />
GWP<br />
784<br />
91<br />
128<br />
354<br />
20<br />
1.377<br />
g CO₂/kg<br />
800<br />
3.500<br />
Water<br />
Footprint<br />
2.229<br />
0<br />
2<br />
1<br />
0<br />
2.232<br />
liters/kg<br />
10<br />
EPD durum wheat semolina Pasta, 10/03/2011 | 18
08.<br />
Plants<br />
Bolu<br />
Transports<br />
road ≈ 2.300 km<br />
sea ≈ 1.200 km<br />
durum wheat provenience<br />
10% greece<br />
88% turkey<br />
2% spain<br />
upstream processes<br />
core processes<br />
non renewable<br />
resources<br />
Raw materials<br />
cultivation<br />
Milling<br />
Packaging<br />
Pasta<br />
production<br />
Distribution<br />
Total<br />
Phoshorous<br />
11,6 0,0 0,0 0,0 0,0 11,6<br />
Environmental<br />
Results<br />
Turkey<br />
Material<br />
resources<br />
— data in grams<br />
energy<br />
resources<br />
— data in grams<br />
Gravel<br />
Limestone (CaCO₃)<br />
Alogenate<br />
Potassium chloride<br />
Others<br />
Coal<br />
Oil<br />
Natural gas<br />
Uranium<br />
Others<br />
0,5 0,0 11,1 0,0 0,0 11,6<br />
3,8 0,2 0,8 0,5 0,0 5,3<br />
2,9 0,0 0,0 0,0 0,0 2,9<br />
0,7 0,0 0,1 0,0 0,0 0,8<br />
0,2 0,0 1,2 0,0 0,0 1,4<br />
13,9 11,9 12,5 32,5 0,5 71,3<br />
70,2 1,1 5,8 3,0 19,0 99,1<br />
27,0 7,0 26,5 51,7 0,9 113,1<br />
upstream processes<br />
core processes<br />
renewable resources<br />
— data per 1 kg of product<br />
Raw materials<br />
cultivation<br />
Milling<br />
Packaging<br />
Pasta<br />
production<br />
Distribution<br />
Total<br />
energy resources<br />
— data per in MJ<br />
Hydroelectric<br />
Wind<br />
Solar<br />
0,03 0,04 0,03 0,12 0,00 0,22<br />
0,00 0,00 0,00 0,00 0,00 0,00<br />
0,00<br />
0,00<br />
0,00<br />
0,00<br />
0,00<br />
0,00<br />
upstream processes<br />
core processes<br />
fresh water consumption<br />
— data in litres<br />
Raw materials<br />
cultivation<br />
Milling<br />
Packaging<br />
Pasta<br />
production<br />
Distribution<br />
Total<br />
2,9 0,2 1,9 0,4 0,1 5,5<br />
impact indicators<br />
— for GWP values<br />
see Carbon Footprint<br />
per 1 kg of product<br />
Raw materials<br />
cultivation<br />
upstream processes<br />
Milling<br />
Packaging<br />
Pasta<br />
production<br />
core processes<br />
Distribution<br />
Total<br />
Ozone-depleting potential<br />
mg CFC11 equivalent<br />
0,043<br />
0,005<br />
0,020<br />
0,036<br />
0,009<br />
0,113<br />
Ozone-creating potential<br />
g C₂H₄ equivalent<br />
0,39<br />
0,01<br />
0,06<br />
0,06<br />
0,05<br />
0,57<br />
Acidification potential<br />
g SO₄ equivalent<br />
7,3<br />
0,1<br />
0,3<br />
0,4<br />
0,4<br />
8,5<br />
Eutrophication potential<br />
g PO₄ equivalent<br />
9,0<br />
0,0<br />
0,1<br />
0,0<br />
0,1<br />
9,2<br />
upstream processes<br />
core processes<br />
Waste per 1 kg of product*<br />
Raw materials<br />
cultivation<br />
Milling<br />
Packaging<br />
Pasta<br />
production<br />
Distribution<br />
Total<br />
Hazardous<br />
Turkey<br />
Raw materials<br />
cultivation<br />
Milling Packaging Pasta<br />
Distribution<br />
production<br />
From field<br />
to Distribution<br />
Cooking phase<br />
Ecological<br />
Footprint<br />
9,9<br />
0,1<br />
0,6<br />
0,6<br />
0,2<br />
11,4<br />
global m²/kg<br />
2<br />
7<br />
Carbon<br />
Footprint<br />
GWP<br />
658<br />
46<br />
128<br />
224<br />
65<br />
1.121<br />
g CO₂/kg<br />
800<br />
2.800<br />
Water<br />
Footprint<br />
1.530<br />
0<br />
2<br />
0<br />
0<br />
1.532<br />
liters/kg<br />
10<br />
EPD durum wheat semolina Pasta, 10/03/2011 | 21
09.<br />
cardboard box pasta production<br />
25% u.s.a.<br />
72% italy<br />
2% greece<br />
1% turkey<br />
upstream processes<br />
core processes<br />
non renewable<br />
resources<br />
Raw materials<br />
cultivation<br />
Milling<br />
Packaging<br />
Pasta<br />
production<br />
Distribution<br />
Total<br />
Gravel<br />
0,6 0,0 10,5 2,0 0,0 13,1<br />
Environmental<br />
Results<br />
World<br />
Material<br />
resources<br />
— data in grams<br />
energy<br />
resources<br />
— data in grams<br />
Potassium chloride<br />
Phoshorous<br />
Limestone (CaCO₃)<br />
Alogenate<br />
Others<br />
Coal<br />
Oil<br />
Natural gas<br />
Uranium<br />
Others<br />
8,5 0,0 0,1 0,0 0,0 8,6<br />
6,6 0,0 0,0 0,0 0,0 6,6<br />
2,5 0,2 0,7 1,6 0,1 5,1<br />
1,7 0,0 0,0 0,0 0,0 1,7<br />
0,2 0,0 1,2 1,4 0,0 2,8<br />
20,0 10,7 11,9 39,0 4,8 86,4<br />
70,8 15,2 5,6 4,4 52,2 148,2<br />
32,7 9,4 25,5 65,8 3,0 136,4<br />
upstream processes<br />
core processes<br />
renewable resources<br />
— data per 1 kg of product<br />
Raw materials<br />
cultivation<br />
Milling<br />
Packaging<br />
Pasta<br />
production<br />
Distribution<br />
Total<br />
energy resources<br />
— data per in MJ<br />
Hydroelectric<br />
Wind<br />
Solar<br />
0,04 0,03 0,03 0,09 0,01 0,20<br />
0,01 0,00 0,00 0,01 0,00 0,02<br />
0,00<br />
0,00<br />
0,00<br />
0,01<br />
0,00<br />
0,01<br />
upstream processes<br />
core processes<br />
fresh water consumption<br />
— data in litres<br />
Raw materials<br />
cultivation<br />
Milling<br />
Packaging<br />
Pasta<br />
production<br />
Distribution<br />
Total<br />
133,4<br />
0,3<br />
1,8<br />
2,9<br />
0,3<br />
138,7<br />
impact indicators<br />
— for GWP values<br />
see Carbon Footprint<br />
per 1 kg of product<br />
Raw materials<br />
cultivation<br />
upstream processes<br />
Milling<br />
Packaging<br />
Pasta<br />
production<br />
core processes<br />
Distribution<br />
Total<br />
Ozone-depleting potential<br />
mg CFC11 equivalent<br />
0,047<br />
0,012<br />
0,020<br />
0,043<br />
0,024<br />
0,146<br />
Ozone-creating potential<br />
g C₂H₄ equivalent<br />
0,40<br />
0,06<br />
0,06<br />
0,11<br />
0,14<br />
0,77<br />
Acidification potential<br />
g SO₄ equivalent<br />
9,0<br />
0,5<br />
0,3<br />
0,8<br />
1,1<br />
11,7<br />
Eutrophication potential<br />
g PO₄ equivalent<br />
7,6<br />
0,1<br />
0,1<br />
0,1<br />
0,2<br />
8,1<br />
upstream processes<br />
core processes<br />
Waste per 1 kg of product*<br />
Raw materials<br />
cultivation<br />
Milling<br />
Packaging<br />
Pasta<br />
production<br />
Distribution<br />
Total<br />
Hazardous<br />
Not hazardous<br />
Waste products to animal feed industry<br />
World<br />
Raw materials<br />
cultivation<br />
Milling Packaging Pasta<br />
Distribution<br />
production<br />
From field<br />
to Distribution<br />
Ecological<br />
Footprint<br />
9,1<br />
11,3 global m²/kg<br />
0,3<br />
0,6<br />
0,8<br />
0,5<br />
Carbon<br />
Footprint<br />
GWP<br />
779<br />
98<br />
123<br />
294<br />
184<br />
1.478 g CO₂/kg<br />
Water<br />
Footprint<br />
1.688<br />
1.693 liters/kg<br />
0<br />
2<br />
3<br />
0<br />
EPD durum wheat semolina Pasta, 10/03/2011 | 24
10.<br />
Additional<br />
Information<br />
Environmental declarations published within<br />
the same product category, though originating<br />
from different programs, may not be<br />
comparable.<br />
This declaration and further information in<br />
regards are available at www.environdec.com<br />
References<br />
— <strong>International</strong> EPD Consortium; General<br />
Programme Instructions (EPD); ver.1 of<br />
29/02/2008<br />
— WWF, Global Footprint Network,<br />
Zoological Society of London; Living Planet<br />
Report 2008, WWF (2008)<br />
— ArjenY.Hoekstra, Ashok K. Chapagain,<br />
Maite M. Aldaya, Mesfin M. Mekonnen;<br />
Water Footprint Manual State of the Art 2009,<br />
Water Footprint Network<br />
— PCR 2010:01; CPC 2371 –PCR for uncooked<br />
pasta, not stuffed or otherwise prepared;<br />
version 1.0 of 18/01/2010<br />
TECHNICAL REPORT<br />
— <strong>Barilla</strong>, Life Cycle Assessment of durum<br />
wheat semolina pasta, detailed hypotheses;<br />
Rev.2.0 of 10/12/2010<br />
indipendent verification<br />
PCR review conducted by:<br />
Technical Committee<br />
of the <strong>International</strong> EPD® system<br />
External verifier:<br />
Maurizio Fieschi, Independent Verifier Accredited<br />
by the international EPD consortium<br />
Contacts<br />
For additional information relative to the activities<br />
of the <strong>Barilla</strong> Group or in regards to this environmental<br />
declaration, please contact:<br />
Luca Ruini — ✉ luca.ruini@barilla.com<br />
Technical support<br />
Life Cycle Engineering (Italy)<br />
— www.studiolce.it<br />
Graphic Design<br />
Fabio Gioia — www.fabiogioia.com<br />
EPD durum wheat semolina Pasta, 10/03/2011 | 25
11.<br />
Ecological Footprint<br />
www.globalfootprint.org<br />
<strong>The</strong> Ecological Footprint measures the area of biologically productive<br />
land and water required to provide the resources used and absorb<br />
the carbon dioxide waste generated by human activity, under<br />
current technology. It is measured in standard units called global<br />
hectares (GHA).<br />
One gha represents a hectare of forest, cropland, grazing land or<br />
fishing grounds with world average productivity. <strong>The</strong> calculation<br />
methodology was developed by the Global Footprint Network.<br />
Carbon Footprint<br />
<strong>The</strong> product carbon footprint is a measure of potential contribution<br />
to climate change due to the amount of greenhouse gases (GHG)<br />
released by production chain processes.<br />
This contribution, global warming potential (GWP), is measured in<br />
terms of mass of CO₂ equivalent and is calculated by multiplying the<br />
specific GHG emissions (mainly CO₂, N₂O, CH₄) by the specific conversion<br />
factors defined by the IPCC (www.ipcc.ch). Many protocols<br />
are available for its calculation.<br />
Glossary<br />
Water Footprint<br />
www.waterfootprint.org<br />
<strong>The</strong> water footprint of a product is the volume of freshwater used to<br />
produce the product, measured over the full supply chain.<br />
It is a multi-dimensional indicator, showing water consumption<br />
volumes by source and polluted volumes by type of pollution; all<br />
components of a total water footprint are specified geographically<br />
and temporally. <strong>The</strong> calculation methodology was developed by the<br />
Water Footprint Network.<br />
EPD durum wheat semolina Pasta, 10/03/2011 | 26
Acidification Potential<br />
(AP)<br />
Phenomenon by which atmospheric rainfall has a pH value below<br />
the normal average. It can provoke damage to forests and agriculture,<br />
as well as to aquatic ecosystems and manmade structures. It is<br />
the result of SO₂, of NOx, and NH₃, that are included in the Acidification<br />
Potential indicator (AP) expressed in moles of H+ produced.<br />
Eutrophication Potential<br />
(EP)<br />
Nutrient enrichment of flowing water bodies, which determines unbalance<br />
in aquatic ecosystems due to excessive flourishing caused<br />
by lack of nutrient limitation. <strong>The</strong> Eutrophication potential (EP) especially<br />
includes phosphate and nitrogen salts, and is expressed as<br />
grams of oxygen equivalent (g O₂).<br />
Ozone Depletion Potential<br />
(ODP)<br />
Degradation of the stratospheric layer of the ozone involved in<br />
blocking the UV component of sunrays. Depletion is due to particularly<br />
reactive components that originate from chlorofluorocarbon<br />
(CFC) or chlorofluoromethanes (CFM). <strong>The</strong> substance employed as<br />
benchmark measure for OPD is trichlorofluoromethane, or CFC-11.<br />
Photochemical Ozone Creation Potential<br />
(POCP)<br />
Production of compounds that foster oxidation due to interaction<br />
with light, resulting in ozone formation in the troposphere. <strong>The</strong><br />
POCP indicator mostly encompasses VOC (volatile organic compounds)<br />
and is expressed as grams of ethylene equivalent (g C₂H₄).<br />
EPD durum wheat semolina Pasta, 10/03/2011 | 27