corresponding pdf
corresponding pdf
corresponding pdf

Create successful ePaper yourself
Turn your PDF publications into a flip-book with our unique Google optimized e-Paper software.
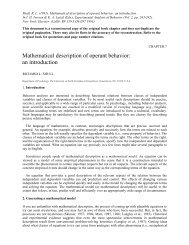
Normal Q-Q Plot<br />
Histogram of rs<br />
Sample Quantiles<br />
-2 -1 0 1 2<br />
Frequency<br />
0 5 10 15 20<br />
-2 -1 0 1 2<br />
Theoretical Quantiles<br />
-2 -1 0 1 2<br />
rs<br />
n = 100<br />
Normal Q-Q Plot<br />
Histogram of rs<br />
Sample Quantiles<br />
-2 -1 0 1 2 3<br />
Frequency<br />
0 5 10 15 20<br />
-2 -1 0 1 2<br />
Theoretical Quantiles<br />
-2 -1 0 1 2 3<br />
rs<br />
(c) What lesson do you draw about using graphs to asses whether or not a data set follows a normal<br />
distribution<br />
For small n, it is relatively difficult to assess normality. For moderate to large n, the data will<br />
generally follow a normal distribution and the points will follow a straight line in a Q-Q plot.<br />
20
![Graduate Bulletin [PDF] - MFC home page - Appalachian State ...](https://img.yumpu.com/50706615/1/190x245/graduate-bulletin-pdf-mfc-home-page-appalachian-state-.jpg?quality=85)