Automated Tissue Bath Analysis with BSL. - Biopac
Automated Tissue Bath Analysis with BSL. - Biopac
Automated Tissue Bath Analysis with BSL. - Biopac

Create successful ePaper yourself
Turn your PDF publications into a flip-book with our unique Google optimized e-Paper software.
PS161 - <strong>Automated</strong> <strong>Tissue</strong> <strong>Bath</strong> <strong>Analysis</strong><br />
BIOPAC Systems, Inc.<br />
42 Aero Camino<br />
Goleta, Ca 93117<br />
Ph (805)685-0066<br />
Fax (805)685-0067<br />
www.biopac.com<br />
info@biopac.com<br />
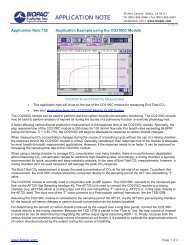
#PS161 - <strong>Automated</strong> <strong>Tissue</strong> <strong>Bath</strong> Data Analyses<br />
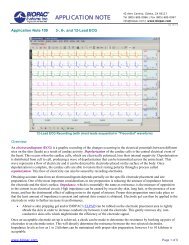
This application note will demonstrate how to do an automated analyses of<br />
your tissue bath data. This will yield the responses to the data you have<br />
collected. The <strong>Biopac</strong> Student Lab PRO can be used to record and analyze<br />
tissue bath and isolated organ experiments. A force transducer connected to the<br />
MP30 is easily calibrated by using two known weights (see Application Notes<br />
PH127 and PH132). Having calibrated the transducer, data can be recorded.<br />
Using the <strong>Biopac</strong> Student Lab PRO's Append mode you can save disk space by<br />
pausing the recording during wash cycles. While recording, you can review<br />
and analyze earlier responses by using the Autoplot feature in the MP30 menu.<br />
This procedure is made even easier by using the <strong>Biopac</strong> Student Lab PRO's<br />
marker system to jump directly to dosages or important events. It is also<br />
possible to mark events remotely by using our SS10L hand switch. The<br />
measurements of max, min and mean can be taken and automatically entered<br />
into the Journal. At the end of the experiment, the Journal file can be exported<br />
to a statistical package for presentation of your results.<br />
First, duplicate the waveform. This option is found under the Edit menu. Next,<br />
take the derivative of the duplicated waveform. To do this, select Derivative<br />
from the Transform menu and click OK. The derivative will give you a<br />
waveform <strong>with</strong> defined peaks. These peaks are used to find the response of<br />
your original data by using the Find peaks option. This will resemble the data<br />
below.<br />
file:////Ntserver4/doc%20pdf/AppNotes/app161protissue/tissuepro.htm (1 of 5)3/24/2006 1:59:26 PM
PS161 - <strong>Automated</strong> <strong>Tissue</strong> <strong>Bath</strong> <strong>Analysis</strong><br />
This next step is optional and it removes any baseline offset. This will save you<br />
time in the long run. Duplicate the original waveform and set a measurement<br />
box to mean on channel 0. This should be from the original waveform. Find the<br />
mean of the first section of the data, as shown below.<br />
The mean value will be used as the constant value in the waveform math<br />
calculation. First, select the duplicated waveform (CH 2 on the previous page),<br />
then select Waveform math from the Transform menu and set it up as shown<br />
below.<br />
file:////Ntserver4/doc%20pdf/AppNotes/app161protissue/tissuepro.htm (2 of 5)3/24/2006 1:59:26 PM
PS161 - <strong>Automated</strong> <strong>Tissue</strong> <strong>Bath</strong> <strong>Analysis</strong><br />
This will remove the baseline offset seen in the beginning section of the<br />
original data. The graph below shows the tissue bath data <strong>with</strong> the baseline<br />
offset (<strong>Bath</strong> 1) and <strong>with</strong> this baseline offset removed (<strong>Bath</strong> 2). The<br />
measurements should be taken from the data <strong>with</strong> the baseline offset removed.<br />
The original data can be removed by clicking on the correct channel and<br />
selecting Remove waveform from the Edit menu. This application note takes<br />
the measurements from both and this is done to show the difference between<br />
the two.<br />
We will now take the mean, maximum response from each of the doses. The<br />
mean value is taken from a user defined region of the maximum response. This<br />
will overcome the influence of sudden spikes in the response. Alternatively,<br />
you can select the maximum value. Select mean (or max) for two measurement<br />
boxes and put them on channel 0 and 2, respectively. To find the actual mean<br />
responses, highlight the first peak of the derivative waveform data.<br />
file:////Ntserver4/doc%20pdf/AppNotes/app161protissue/tissuepro.htm (3 of 5)3/24/2006 1:59:26 PM
PS161 - <strong>Automated</strong> <strong>Tissue</strong> <strong>Bath</strong> <strong>Analysis</strong><br />
Select Find peak from the Transform menu, set first cursor to peak + 1 min.<br />
and set second cursor to 4 min, as shown below.<br />
These numbers set the width of the mean response area on the original<br />
waveform (CH 0) and the baseline offset removed waveform (CH 2). These<br />
values can be altered in order to take the mean of a larger or smaller<br />
highlighted area. These measurements can be pasted into a journal (as shown<br />
file:////Ntserver4/doc%20pdf/AppNotes/app161protissue/tissuepro.htm (4 of 5)3/24/2006 1:59:26 PM
PS161 - <strong>Automated</strong> <strong>Tissue</strong> <strong>Bath</strong> <strong>Analysis</strong><br />
on the next page) by checking the box, as shown above. These measurements<br />
can be labeled <strong>with</strong> measurement name, measurement units and channel<br />
number, by selecting Preferences from the File menu and marking the<br />
appropriate boxes. The analysis can be automated by selecting Find all peaks<br />
from the Transform menu, or scrolled through, one at a time, by clicking on the<br />
peak to peak icon from the tool bar. These steps will yield the mean responses<br />
in an automated fashion.<br />
Return To Application Note Menu<br />
file:////Ntserver4/doc%20pdf/AppNotes/app161protissue/tissuepro.htm (5 of 5)3/24/2006 1:59:26 PM