Solubility of NH 4 Cl Lab
Solubility of NH 4 Cl Lab
Solubility of NH 4 Cl Lab
Create successful ePaper yourself
Turn your PDF publications into a flip-book with our unique Google optimized e-Paper software.
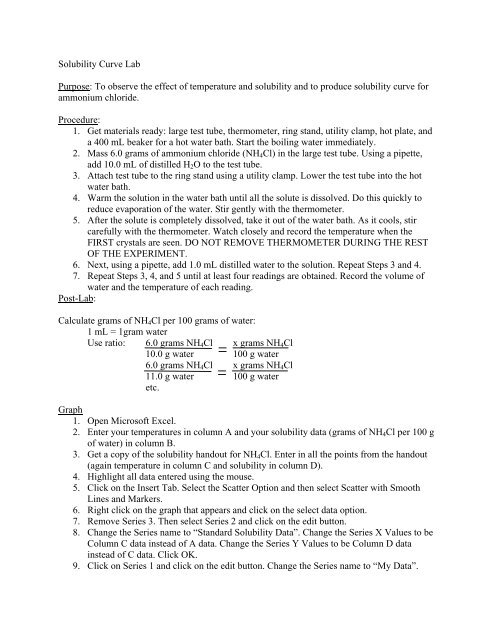
<strong>Solubility</strong> Curve <strong>Lab</strong><br />
Purpose: To observe the effect <strong>of</strong> temperature and solubility and to produce solubility curve for<br />
ammonium chloride.<br />
Procedure:<br />
1. Get materials ready: large test tube, thermometer, ring stand, utility clamp, hot plate, and<br />
a 400 mL beaker for a hot water bath. Start the boiling water immediately.<br />
2. Mass 6.0 grams <strong>of</strong> ammonium chloride (<strong>NH</strong> 4 <strong>Cl</strong>) in the large test tube. Using a pipette,<br />
add 10.0 mL <strong>of</strong> distilled H 2 O to the test tube.<br />
3. Attach test tube to the ring stand using a utility clamp. Lower the test tube into the hot<br />
water bath.<br />
4. Warm the solution in the water bath until all the solute is dissolved. Do this quickly to<br />
reduce evaporation <strong>of</strong> the water. Stir gently with the thermometer.<br />
5. After the solute is completely dissolved, take it out <strong>of</strong> the water bath. As it cools, stir<br />
carefully with the thermometer. Watch closely and record the temperature when the<br />
FIRST crystals are seen. DO NOT REMOVE THERMOMETER DURING THE REST<br />
OF THE EXPERIMENT.<br />
6. Next, using a pipette, add 1.0 mL distilled water to the solution. Repeat Steps 3 and 4.<br />
7. Repeat Steps 3, 4, and 5 until at least four readings are obtained. Record the volume <strong>of</strong><br />
water and the temperature <strong>of</strong> each reading.<br />
Post-<strong>Lab</strong>:<br />
Calculate grams <strong>of</strong> <strong>NH</strong> 4 <strong>Cl</strong> per 100 grams <strong>of</strong> water:<br />
1 mL = 1gram water<br />
Use ratio: 6.0 grams <strong>NH</strong> 4 <strong>Cl</strong> x grams <strong>NH</strong> 4 <strong>Cl</strong><br />
10.0 g water 100 g water<br />
6.0 grams <strong>NH</strong> 4 <strong>Cl</strong> x grams <strong>NH</strong> 4 <strong>Cl</strong><br />
11.0 g water 100 g water<br />
etc.<br />
Graph<br />
1. Open Micros<strong>of</strong>t Excel.<br />
2. Enter your temperatures in column A and your solubility data (grams <strong>of</strong> <strong>NH</strong> 4 <strong>Cl</strong> per 100 g<br />
<strong>of</strong> water) in column B.<br />
3. Get a copy <strong>of</strong> the solubility handout for <strong>NH</strong> 4 <strong>Cl</strong>. Enter in all the points from the handout<br />
(again temperature in column C and solubility in column D).<br />
4. Highlight all data entered using the mouse.<br />
5. <strong>Cl</strong>ick on the Insert Tab. Select the Scatter Option and then select Scatter with Smooth<br />
Lines and Markers.<br />
6. Right click on the graph that appears and click on the select data option.<br />
7. Remove Series 3. Then select Series 2 and click on the edit button.<br />
8. Change the Series name to “Standard <strong>Solubility</strong> Data”. Change the Series X Values to be<br />
Column C data instead <strong>of</strong> A data. Change the Series Y Values to be Column D data<br />
instead <strong>of</strong> C data. <strong>Cl</strong>ick OK.<br />
9. <strong>Cl</strong>ick on Series 1 and click on the edit button. Change the Series name to “My Data”.
10. Make sure the graph is still selected. Under the Chart Tools on the far right corner <strong>of</strong> the<br />
screen, click on layout.<br />
11. <strong>Cl</strong>ick on Chart Title. Add a title.<br />
12. <strong>Cl</strong>ick on Axis Title. Add both a x-axis and a y-axis title.<br />
13. Right click on the x-axis. Select Format axis. Under Axis options, change the major unit<br />
to “fixed” and the number to “25.0”. Change the minor unit to “fixed” and the number<br />
“5.0”. Change the minor tick mark type to “outside”. <strong>Cl</strong>ick close.<br />
14. With the graph still selected, select the windows icon in the upper left corner and then<br />
select the print option. This should print the graph as a full sheet.<br />
<strong>Cl</strong>osing Question<br />
1. How do your points compare with the standard data points<br />
Discussion <strong>of</strong> Error<br />
1. Calculate % error for two <strong>of</strong> your points.<br />
2. Discuss possible sources <strong>of</strong> error. Be specific.


