2011 Annual report - touax group
2011 Annual report - touax group
2011 Annual report - touax group

You also want an ePaper? Increase the reach of your titles
YUMPU automatically turns print PDFs into web optimized ePapers that Google loves.
<strong>Annual</strong> <strong>report</strong> <strong>2011</strong><br />
20. Financial information concerning the issuer’s<br />
assets, financial position and result<br />
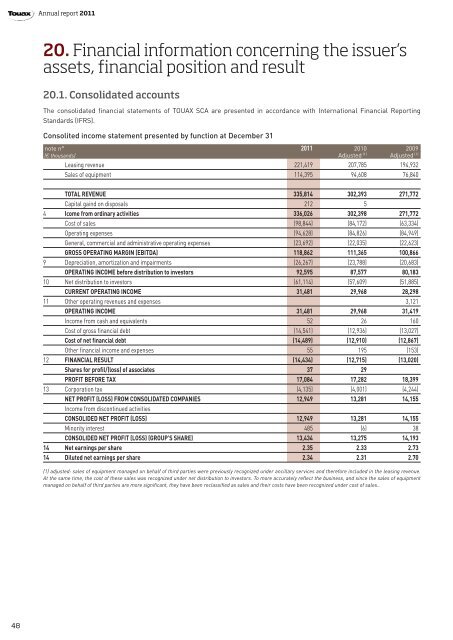
20.1. Consolidated accounts<br />
The consolidated financial statements of TOUAX SCA are presented in accordance with International Financial Reporting<br />
Standards (IFRS).<br />
Consolited income statement presented by function at December 31<br />
note n° <strong>2011</strong> 2010 2009<br />
(€ thousands) Adjusted (1) Adjusted (1)<br />
Leasing revenue 221,419 207,785 194,932<br />
Sales of equipment 114,395 94,608 76,840<br />
TOTAL REVENUE 335,814 302,393 271,772<br />
Capital gaind on disposals 212 5<br />
4 Icome from ordinary activities 336,026 302,398 271,772<br />
Cost of sales (98,844) (84,172) (63,334)<br />
Operating expenses (94,628) (84,826) (84,949)<br />
General, commercial and administrative operating expenses (23,692) (22,035) (22,623)<br />
GROSS OPERATING MARGIN (EBITDA) 118,862 111,365 100,866<br />
9 Depreciation, amortization and impairments (26,267) (23,788) (20,683)<br />
OPERATING INCOME before distribution to investors 92,595 87,577 80,183<br />
10 Net distribution to investors (61,114) (57,609) (51,885)<br />
CURRENT OPERATING INCOME 31,481 29,968 28,298<br />
11 Other operating revenues and expenses 3,121<br />
OPERATING INCOME 31,481 29,968 31,419<br />
Income from cash and equivalents 52 26 160<br />
Cost of gross financial debt (14,541) (12,936) (13,027)<br />
Cost of net financial debt (14,489) (12,910) (12,867)<br />
Other financial income and expenses 55 195 (153)<br />
12 FINANCIAL RESULT (14,434) (12,715) (13,020)<br />
Shares for profil/(loss) of associates 37 29<br />
PROFIT BEFORE TAX 17,084 17,282 18,399<br />
13 Corporation tax (4,135) (4,001) (4,244)<br />
NET PROFIT (LOSS) FROM CONSOLIDATED COMPANIES 12,949 13,281 14,155<br />
Income from discontinued activities<br />
CONSOLIDED NET PROFIT (LOSS) 12,949 13,281 14,155<br />
Minority interest 485 (6) 38<br />
CONSOLIDED NET PROFIT (LOSS) (GROUP’S SHARE) 13,434 13,275 14,193<br />
14 Net earnings per share 2.35 2.33 2.73<br />
14 Diluted net earnings per share 2.34 2.31 2.70<br />
(1) adjusted: sales of equipment managed on behalf of third parties were previously recognized under ancillary services and therefore included in the leasing revenue.<br />
At the same time, the cost of these sales was recognized under net distribution to investors. To more accurately reflect the business, and since the sales of equipment<br />
managed on behalf of third parties are more significant, they have been reclassified as sales and their costs have been recognized under cost of sales..<br />
48