2011 almond almanac - Almond Board of California
2011 almond almanac - Almond Board of California
2011 almond almanac - Almond Board of California

Create successful ePaper yourself
Turn your PDF publications into a flip-book with our unique Google optimized e-Paper software.
<strong>2011</strong><br />
<strong>almond</strong><br />
<strong>almanac</strong><br />
1150 ninth street, suite 1500<br />
Modesto, Ca 95354 usa<br />
<strong>almond</strong><strong>Board</strong>.com<br />
Document #<strong>2011</strong>ir0024<br />
© <strong>2011</strong> <strong>almond</strong> <strong>Board</strong> <strong>of</strong> <strong>California</strong><br />
printed in usa
the california<br />
<strong>almond</strong> industry<br />
at your fingertips<br />
<strong>almond</strong> <strong>Board</strong> <strong>of</strong> <strong>California</strong> (aBC) promotes <strong>almond</strong>s through its research-based approach to<br />
all aspects <strong>of</strong> farming, production and marketing on behalf <strong>of</strong> <strong>California</strong> <strong>almond</strong> growers and<br />
processors. the <strong>almond</strong> <strong>almanac</strong> is <strong>almond</strong> <strong>Board</strong>’s annual report, which outlines the programs<br />
and projects that power the industry toward meeting its vision, and it provides a comprehensive<br />
statistical analysis <strong>of</strong> the production and marketing <strong>of</strong> <strong>California</strong> <strong>almond</strong>s.<br />
the <strong>almond</strong> <strong>almanac</strong> is prepared by aBC on a crop-year basis, spanning august 1 through<br />
July 31, and includes comprehensive historical information about <strong>almond</strong> production, acreage<br />
and varieties, as well as shipment and market information. the statistical content is compiled<br />
using various handler forms required by the industry’s federal Marketing order. additional data,<br />
including crop estimates and farm price, are supplied by the usDa national agricultural statistics<br />
service, <strong>California</strong> field <strong>of</strong>fice (nass/Cfo). simply put, the <strong>almond</strong> <strong>almanac</strong> is the definitive<br />
source <strong>of</strong> information for <strong>California</strong> <strong>almond</strong>s.<br />
table <strong>of</strong> contents<br />
2 <strong>Board</strong> <strong>of</strong> Directors<br />
3 introduction from Ceo + <strong>Board</strong> Chair<br />
4 strategic priorities<br />
5 aBC programs + Budget allocation<br />
6 <strong>California</strong> <strong>almond</strong> industry overview<br />
7 Historical shipments<br />
8 position report <strong>of</strong> <strong>California</strong> <strong>almond</strong>s<br />
9 Destination overview <strong>of</strong> <strong>California</strong> <strong>almond</strong>s<br />
10 exports by Destination<br />
12 World <strong>almond</strong> production<br />
13 <strong>California</strong>’s Crop + <strong>almond</strong> acreage<br />
14 top ten exports by Value<br />
15 <strong>almond</strong> production by County<br />
16 receipts by County + Variety<br />
17 top ten <strong>almond</strong> Varieties + acreage<br />
18 <strong>almond</strong> Crop estimates vs. actual receipts<br />
20 <strong>California</strong> <strong>almond</strong> acreage + farm Value<br />
22 Crop-size History vs. inedible percentage<br />
23 Competing nuts<br />
24 Marketing program introduction<br />
25 Market access<br />
26 trade stewardship<br />
29 Marketing<br />
33 research program introduction<br />
34 production research<br />
35 environmental research<br />
36 <strong>almond</strong> Quality + food safety<br />
37 nutrition research<br />
38 sustainability program<br />
39 industry Conference<br />
40 industry relations<br />
41 uC farm advisors
<strong>Board</strong> <strong>of</strong> directors<br />
<strong>2011</strong><br />
introDuCtion froM Ceo + BoarD CHair<br />
Dear industry Members and allied stakeholders,<br />
Vision<br />
to bring great taste, health and<br />
vitality to people around the<br />
world through the enjoyment<br />
<strong>of</strong> <strong>California</strong> <strong>almond</strong>s.<br />
Mission<br />
to make <strong>California</strong> <strong>almond</strong>s<br />
essential to customers and<br />
consumers worldwide<br />
through innovative research,<br />
market development and<br />
industry support.<br />
Mike Mason<br />
Chair<br />
Dave Baker<br />
Vice Chair<br />
Bill Brush<br />
Bill Harp<br />
Scott Hunter<br />
<strong>2011</strong> was a year <strong>of</strong> significant change for the <strong>almond</strong> <strong>Board</strong> <strong>of</strong> <strong>California</strong> and the results <strong>of</strong> those<br />
changes are outlined in the pages <strong>of</strong> this year’s <strong>almond</strong> <strong>almanac</strong>. going forward in 2012, we will<br />
implement many <strong>of</strong> these changes and we’ll see the benefits coming to fruition.<br />
the year began with the <strong>Board</strong> <strong>of</strong> Directors’ strategic retreat where new strategic priorities with<br />
supporting objectives for the organization were discussed and decided (see page 4). During the<br />
retreat the <strong>Board</strong> also worked through recommendations for organizational restructuring and<br />
considered ways in which the Directors themselves could become a better governing unit.<br />
Later in the year, the <strong>Board</strong> <strong>of</strong> Directors commissioned an in-depth analysis <strong>of</strong> global markets and<br />
product categories in order to heighten its ability to have an objective vision <strong>of</strong> opportunities for<br />
growth, resulting in a road map for program prioritization and allocation <strong>of</strong> resources. in addition,<br />
the Directors authorized a fundamental change in the aBC’s committee structure, instituting the<br />
global Market Development Committee, which will allow for global strategic planning and program<br />
execution. these two achievements will play a significant role in driving demand development for<br />
<strong>California</strong> <strong>almond</strong>s in the years to come.<br />
Christine Long<br />
John O’Shaughnessy Dave Phippen Keith Rigg<br />
John Thoming<br />
Capping <strong>of</strong>f the year was the creation <strong>of</strong> the scientific advisory panel, a group <strong>of</strong> senior-level<br />
scientific and regulatory experts who will meet periodically to advise the Directors and<br />
aBC committees on the medium- and long-term threats and opportunities facing the industry.<br />
the panel’s advice and counsel will be incorporated into strategic planning and proactive<br />
industry initiatives.<br />
We wish you well in 2012 as we work together to market the largest crop in <strong>California</strong> <strong>almond</strong><br />
industry history.<br />
richard & Mike<br />
RiCHaRD WayCOTT, PReSiDenT anD CeO<br />
Mike Mason, CHair<br />
2<br />
3
strategiC priorities<br />
<strong>almond</strong> <strong>Board</strong> <strong>of</strong> california<br />
invest in programs and research that make <strong>almond</strong>s a crop <strong>of</strong> choice for california<br />
• Promote sustainability <strong>of</strong> <strong>almond</strong> supply<br />
• Enhance the industry-wide food safety system<br />
• Identify and support basic and applied research to enhance production efficiency<br />
invest in programs and research that build market demand for <strong>almond</strong>s, making<br />
them the nut <strong>of</strong> choice<br />
• Continue to expand the understanding <strong>of</strong> the health benefits and quality <strong>of</strong> <strong>almond</strong>s in<br />
support <strong>of</strong> market development strategies<br />
• Implement programs to develop new markets and maintain existing ones<br />
• Implement actions that mitigate trade barriers<br />
• Improve market development resource allocation mechanisms and processes<br />
Build an aBc organization that optimizes its effectiveness in establishing and<br />
executing goals<br />
• Ensure that ABC representatives understand and adhere to fiduciary responsibility<br />
standards<br />
• Implement <strong>Board</strong> <strong>of</strong> Director development initiatives, such as succession planning, formal<br />
orientation, board performance assessments and skills development and acquisition<br />
• Optimize staff and committee structures and processes<br />
• Articulate needs related to advocacy and seek out possible alternatives for meeting<br />
these needs<br />
aLMonD BoarD <strong>of</strong> CaLifornia<br />
prograMs + BuDget aLLoCation<br />
key program areas for aBC include global marketing, nutrition and<br />
production research, food safety, environmental stewardship and<br />
industry information and statistics. aBC programs are funded by an<br />
assessment placed on each pound <strong>of</strong> <strong>almond</strong>s produced. the <strong>Board</strong><br />
<strong>of</strong> Directors approves allocation to each <strong>of</strong> the program areas and<br />
aBC staff is responsible for implementing the programs detailed on the<br />
following pages.<br />
prograM BuDget aLLoCation fisCaL year 2010/11<br />
food Quality and safety 2%<br />
production research 2%<br />
environmental research 2%<br />
nutrition research 4%<br />
administration 17% —<br />
industry relations 2%<br />
gtra* 1%<br />
north american<br />
Marketing 39%<br />
international Marketing 31%<br />
4<br />
source: <strong>almond</strong> <strong>Board</strong> <strong>of</strong> <strong>California</strong>. *global technical and regulatory affairs.<br />
5
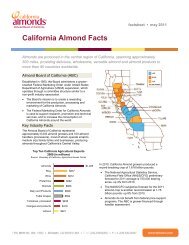
CaLifornia aLMonD inDustry oVerVieW<br />
<strong>California</strong>’s Central Valley has the ideal growing conditions for growing <strong>almond</strong>s, including mild climate, rich soil and abundant sunshine. <strong>California</strong><br />
<strong>almond</strong>s make up about 80% <strong>of</strong> global and virtually 100% <strong>of</strong> domestic supply. according to the 2007 usDa ag Census, there are around 6,500<br />
<strong>California</strong> <strong>almond</strong> farms and <strong>of</strong> those, 72% are family owned and 51% consist <strong>of</strong> 1–49 acres.<br />
During the 2010/11 crop year there were 1.628 billion pounds <strong>of</strong> <strong>almond</strong>s produced on 740,000 bearing acres. in the same year, 104 handlers shipped<br />
a record-breaking 1.668 billion pounds <strong>of</strong> <strong>almond</strong>s, a 13% increase over the prior year.<br />
aLMonD proDuCtion By County 2010/11<br />
COLUSA<br />
SOLANO<br />
SAN JOAQUIN<br />
.......................................<br />
MERCED<br />
.........................<br />
..................................<br />
FRESNO<br />
KINGS<br />
KERN<br />
..................................................<br />
..............................................................<br />
.................................<br />
...........................................<br />
..........................................<br />
.............................................<br />
.............................................<br />
....................................<br />
.......................................<br />
TEHAMA<br />
GLENN<br />
BUTTE<br />
YUBA<br />
SUTTER<br />
YOLO<br />
....................................................<br />
....................................................<br />
....................................<br />
STANISLAUS<br />
MADERA<br />
...........................................<br />
>100 million pounds<br />
50–100 million pounds<br />
1–50 million pounds<br />
acreage<br />
TULARE<br />
DistriBution <strong>of</strong> Crop By<br />
HanDLer siZe 2010<br />
104 Handlers<br />
number <strong>of</strong><br />
Handlers<br />
percentage <strong>of</strong><br />
Crop Handled<br />
50M pounds 8 48%<br />
HistoriCaL sHipMents<br />
although crop year 2010/11 production was<br />
a record breaker at 1.628 billion pounds,<br />
<strong>2011</strong>/12, forecasted at 1.95 billion pounds, is<br />
destined to be the largest crop to date.<br />
<strong>California</strong> <strong>almond</strong> shipments increased<br />
13% in 2010/11, reaching 1.668 billion pounds.<br />
u.s. remains the single largest market, up<br />
9% to a new record <strong>of</strong> 490 million pounds<br />
and accounting for 29% <strong>of</strong> total shipments.<br />
the remaining 71% was destined for export<br />
markets where shipments rose 15% over the<br />
prior year to reach 1.18 billion pounds, also<br />
a new all-time record.<br />
HistoriCaL Crop siZe + sHipMents Vs. farM priCe Crop year 2001/02–2010/11<br />
million pounds<br />
1,800<br />
1,600<br />
1,400<br />
1,200<br />
1,000<br />
800<br />
600<br />
400<br />
200<br />
Crop size shipments farm price<br />
$1.11<br />
$1.57<br />
$2.21<br />
$2.81<br />
Carry-in as a perCentage <strong>of</strong> prior year sHipMents<br />
Crop year 2001/02–<strong>2011</strong>/12<br />
percentage carry-in<br />
$2.06<br />
30%<br />
25%<br />
20%<br />
15%<br />
10%<br />
5%<br />
0%<br />
$1.75<br />
15%<br />
01/02<br />
$1.45<br />
10%<br />
16% 15% 14% 12% 13%<br />
$3.00<br />
$2.75<br />
$2.50<br />
$2.25<br />
$2.00<br />
$1.75<br />
$1.50<br />
$1.25<br />
farm price<br />
million pounds<br />
1,200<br />
1,000<br />
800<br />
600<br />
400<br />
200<br />
Domestic<br />
source: <strong>almond</strong> <strong>Board</strong> <strong>of</strong> <strong>California</strong>.<br />
DoMestiC + eXport sHipMents<br />
2006/07 –2010/11 (MiLLion pounDs)<br />
368<br />
18%<br />
698<br />
866<br />
30%<br />
395 411<br />
export<br />
978<br />
22%<br />
450<br />
1,022<br />
15%<br />
02/03 03/04 04/05 05/06 06/07 07/08 08/09 09/10 10/11 11/12<br />
estimated<br />
$1.65<br />
$1.75<br />
490<br />
1,178<br />
0 $1.00<br />
0<br />
01/02 02/03 03/04 04/05 05/06 06/07 07/08 08/09 09/10 10/11<br />
06/07 07/08 08/09 09/10 10/11<br />
6<br />
sources: <strong>almond</strong> <strong>Board</strong> <strong>of</strong> <strong>California</strong>, usDa, nass/Cfo.<br />
source: <strong>almond</strong> <strong>Board</strong> <strong>of</strong> <strong>California</strong>.<br />
7
position report <strong>of</strong> CaLifornia aLMonDs MiLLion pounDs<br />
Destination oVerVieW <strong>of</strong> CaLifornia aLMonDs<br />
Crop year<br />
redetermined<br />
total salable<br />
Domestic<br />
export<br />
total<br />
salable<br />
Carry-in<br />
reserve<br />
Marketable<br />
supply<br />
shipments<br />
shipments<br />
shipments<br />
Carry-over<br />
1992/93 516.0 148.1 n/a 664.1 186.0 349.9 535.9 128.2<br />
1993/94 470.0 133.6 n/a 603.6 162.0 336.5 498.5 102.6<br />
1994/95 713.3 102.6 0.0 815.9 160.6 448.1 608.7 204.8<br />
1995/96 352.3 204.8 n/a 557.1 132.8 335.1 467.9 92.8<br />
1996/97 489.3 92.8 n/a 582.1 137.5 395.8 533.3 48.3<br />
1997/98 736.8 48.3 n/a 785.1 159.6 452.4 612.1 172.0<br />
1998/99 492.4 172.0 n/a 664.4 167.0 405.5 572.5 91.8<br />
1999/00 795.5 91.8 0.0 887.3 209.6 503.0 712.6 174.7<br />
2000/01 672.4 174.7 0.0 847.1 211.2 528.7 739.8 107.3<br />
eXport sHipMents By proDuCt type<br />
Crop year 2006/07–2010/11<br />
million pounds<br />
1,200<br />
1,000<br />
800<br />
600<br />
400<br />
200<br />
0<br />
in-shell Manufactured shelled<br />
73<br />
116<br />
509<br />
2006/07<br />
97<br />
122<br />
647<br />
138 173<br />
105 127<br />
735<br />
723<br />
219<br />
124<br />
834<br />
2007/08 2008/09 2009/10 2010/11<br />
CaLifornia aLMonD eXports By region 2010/11<br />
Canada/Mexico 6%<br />
Middle east/africa 16%<br />
asia-pacific 34%<br />
Central/eastern europe 4%<br />
Western<br />
europe 40%<br />
2001/02 794.8 107.3 n/a 902.1 239.3 581.8 821.1 80.9<br />
2002/03 1,063.5 80.9 n/a 1,144.4 291.7 690.6 982.4 162.0<br />
2003/04 1,011.1 162.0 n/a 1,173.1 312.2 712.1 1,024.3 148.9<br />
top WorLD Destinations 2010/11<br />
source: <strong>almond</strong> <strong>Board</strong> <strong>of</strong> <strong>California</strong> July <strong>2011</strong> position report.<br />
source: <strong>almond</strong> <strong>Board</strong> <strong>of</strong> <strong>California</strong> July <strong>2011</strong> position report.<br />
8<br />
2004/05 972.8 148.9 n/a 1,121.7 331.6 652.5 984.1 137.7<br />
2005/06 888.7 137.7 n/a 1,026.4 303.9 610.4 914.2 112.2<br />
2006/07 1,087.8 112.2 n/a 1,200.0 368.3 697.8 1,066.1 133.9<br />
2007/08 1,358.3 133.9 n/a 1,492.2 394.8 866.4 1,261.2 231.2<br />
2008/09 1,571.9 231.2 n/a 1,803.1 411.0 978.4 1,389.4 413.7<br />
2009/10 1,379.0 413.7 n/a 1,792.7 449.5 1,022.0 1,471.5 321.3<br />
2010/11 1,600.5 1,600.3 321.3 n/a 1,921.8 1,921.6 489.7 487.5 1,137.5 1,177.9 1,625.0 1,667.6 296.8 254.0<br />
<strong>2011</strong>/12* 0,000.0 1,891.5 000.0 254.0 n/a 0,000.0 2,145.5 000.0 555.0 0,000.0 1,295.0 0,000.0 1,850.0 000.0 295.5<br />
source: <strong>almond</strong> <strong>Board</strong> <strong>of</strong> <strong>California</strong>. note: totals may not add precisely due to rounding. *forecast.<br />
million pounds<br />
500<br />
400<br />
300<br />
200<br />
100<br />
0<br />
490<br />
u.s.<br />
168 158<br />
China<br />
top ten eXport Destinations* 2010/11<br />
*top ten export markets represent 72% <strong>of</strong> total export shipments.<br />
113 106<br />
83<br />
56 45 43 41 38<br />
spain germany india u.a.e. Japan Canada italy netherlands turkey<br />
source: <strong>almond</strong> <strong>Board</strong> <strong>of</strong> <strong>California</strong> July <strong>2011</strong> position report.<br />
9
eXports By Destination MiLLion pounDs<br />
eXports By Destination ContinueD<br />
World region Destination 2010/<strong>2011</strong> 2009/2010 2008/2009 2007/2008 2006/2007<br />
World region Destination 2010/<strong>2011</strong> 2009/2010 2008/2009 2007/2008 2006/2007<br />
AmericAs<br />
north america Canada 45.04 39.42 40.60 39.05 32.32<br />
Mexico 11.24 7.82 6.50 9.10 8.62<br />
total north america 56.29 47.25 47.10 48.16 40.99<br />
Latin america/Caribbean argentina 0.80 0.50 0.02 0.39 0.54<br />
Brazil 0.72 0.60 0.54 0.48 0.82<br />
Chile 6.12 6.96 3.06 3.96 3.73<br />
Colombia 0.63 0.38 0.26 0.28 0.25<br />
Peru 0.52 0.40 0.14 0.00 0.00<br />
Trinidad 0.45 0.43 0.31 0.23 0.21<br />
Venezuela 0.58 0.49 0.56 0.50 0.54<br />
total latin america/caribbean 10.36 10.07 5.14 6.14 6.27<br />
ToTAl AmericAs 66.65 57.32 52.24 54.30 47.26<br />
AsiA-PAcific<br />
northeast asia China/Hong Kong 167.55 133.04 99.70 46.57 32.33<br />
Japan 55.82 52.93 48.99 47.08 48.72<br />
South Korea 32.07 25.69 21.21 16.77 11.56<br />
Taiwan 10.49 7.06 6.05 5.23 5.64<br />
total northeast asia 265.93 218.72 175.96 115.65 98.26<br />
Southeast asia indonesia 1.40 1.38 1.37 0.96 1.14<br />
Malaysia 5.27 4.18 2.62 3.35 2.56<br />
Singapore 3.33 2.06 2.06 2.38 2.14<br />
Thailand 4.08 3.90 2.11 2.04 2.33<br />
Vietnam 2.91 4.27 0.91 2.05 1.31<br />
total southeast asia 17.10 15.97 9.22 10.89 9.59<br />
South/Central asia india 106.03 83.93 86.85 72.79 58.47<br />
nepal 0.04 0.14 0.07 0.04 0.03<br />
Pakistan 6.43 4.86 4.29 1.80 1.17<br />
total south/central asia 113.35 89.02 91.67 74.81 59.67<br />
australasia/Oceania australia 2.13 2.47 2.23 2.21 4.06<br />
new Zealand 1.73 2.24 1.37 1.63 2.10<br />
total australasia/oceania 3.86 4.71 3.61 3.84 6.17<br />
ToTAl AsiA-PAcific 400.24 328.43 280.45 205.20 173.68<br />
eUroPe<br />
Western europe Belgium 17.78 17.37 14.29 24.03 15.01<br />
Denmark 9.47 7.28 7.88 9.57 7.73<br />
Finland 1.45 2.82 1.29 1.15 1.20<br />
France 30.32 30.12 30.83 37.83 31.30<br />
Germany 113.16 109.04 105.69 105.11 92.43<br />
Greece 8.71 12.01 15.56 21.05 16.63<br />
italy 43.07 34.64 37.33 43.40 33.17<br />
Luxemburg 0.00 0.00 0.00 0.00 0.22<br />
Malta & Gozo 0.03 0.06 0.07 0.07 0.00<br />
netherlands 41.09 35.70 32.26 29.19 35.79<br />
eUroPe continued<br />
Western europe norway 4.20 4.76 4.59 4.15 4.08<br />
Portugal 2.94 2.51 1.48 1.55 0.93<br />
Spain 158.34 143.36 158.62 157.04 101.33<br />
Sweden 7.47 6.35 7.17 5.56 5.68<br />
Switzerland 5.85 5.66 4.60 5.32 4.88<br />
United Kingdom 25.58 25.66 26.24 24.27 27.88<br />
total Western europe 470.33 438.23 448.50 469.97 379.00<br />
Central/eastern europe Bulgaria 1.17 0.67 1.12 1.05 0.80<br />
Croatia 1.90 2.69 1.16 1.06 0.38<br />
Czech Republic 4.25 4.78 3.68 2.41 2.10<br />
estonia 0.56 1.63 0.34 0.31 0.35<br />
Hungary 0.51 0.62 0.62 0.22 0.56<br />
Latvia 0.88 1.20 2.90 6.41 4.69<br />
Lithuania 1.80 1.54 1.27 1.26 0.51<br />
Poland 2.65 1.51 1.52 1.33 1.19<br />
Romania 0.83 0.38 0.46 0.54 0.18<br />
Russia 33.55 22.69 19.73 20.07 16.51<br />
Serbia 0.66 0.31 0.69 0.04 0.00<br />
Ukraine 1.80 1.09 1.22 1.66 0.41<br />
total central/eastern europe 51.87 39.90 35.16 36.71 27.90<br />
ToTAl eUroPe 522.20 478.13 483.66 506.68 406.90<br />
miDDle eAsT/AfricA<br />
Middle east Bahrain 0.84 0.74 0.88 0.59 0.38<br />
Cyprus 1.14 1.42 1.23 1.78 1.03<br />
israel 6.14 6.57 7.04 6.21 4.18<br />
Jordan 10.05 8.80 9.81 5.14 3.72<br />
Kuwait 2.76 2.37 2.15 2.08 1.84<br />
Lebanon 8.39 5.59 7.93 3.84 2.68<br />
Qatar 0.62 0.37 0.30 0.23 0.15<br />
Saudi arabia 10.84 7.52 6.02 6.18 5.39<br />
Turkey 38.09 36.60 28.69 16.16 8.60<br />
United arab emirates 82.58 67.20 68.22 44.95 30.45<br />
total middle east 161.67 137.27 132.33 87.79 58.54<br />
north africa algeria 11.25 6.88 14.26 3.84 3.58<br />
egypt 7.12 8.62 10.22 3.88 3.66<br />
Libya 1.04 0.13 1.08 0.78 0.24<br />
Morocco 0.59 0.95 0.91 0.88 0.93<br />
Tunisia 3.01 1.24 0.72 0.04 0.00<br />
total north africa 23.01 17.81 27.19 9.42 8.41<br />
Sub-Saharan africa South africa 3.80 2.79 2.32 2.69 2.96<br />
total sub-saharan africa 4.13 3.00 2.47 3.00 3.00<br />
ToTAl miDDle eAsT/AfricA 188.81 158.08 162.00 100.21 69.95<br />
GrAND ToTAl eXPorTs 1,177.89 1,021.96 978.36 866.39 697.79<br />
10<br />
source: <strong>almond</strong> <strong>Board</strong> <strong>of</strong> <strong>California</strong>. note: totals may not add precisely due to rounding.<br />
note: Destinations that shipped more than 500,000 pounds are listed.<br />
11
WorLD aLMonD proDuCtion<br />
WorLD aLMonD proDuCtion 2010/11 (MiLLion pounDs)<br />
World<br />
production<br />
<strong>California</strong><br />
australia<br />
spain<br />
all other<br />
Countries<br />
turkey<br />
iran<br />
tunisia<br />
Chile<br />
Morocco<br />
greece<br />
italy<br />
syria<br />
million pounds<br />
0 250 500 750 1,000 1,250 1,500<br />
85<br />
77<br />
69<br />
35<br />
27<br />
27<br />
22<br />
20<br />
18<br />
13<br />
11<br />
1,750<br />
1,628<br />
2,000<br />
2,031<br />
perCentage WorLD aLMonD proDuCtion 2010/11<br />
all other 11.8%<br />
u.s. 80.1%<br />
spain 3.8%<br />
australia 4.2%<br />
source: inC (international nut and Dried fruit), The Cracker <strong>2011</strong>.<br />
CaLifornia’s Crop + aLMonD aCreage<br />
CaLifornia top ten aCreage By Crop totaL pLanteD or Bearing Crop year 2010/11<br />
acres in thousands<br />
1,470 1,490<br />
all Hay<br />
Bearing and non-Bearing acres 1981–2010 non-Bearing acreage 2008–2010<br />
304,012<br />
300 280,600<br />
30<br />
28,002<br />
Bearing<br />
250<br />
non-bearing<br />
25<br />
20,603<br />
200 20<br />
100 73,785<br />
10<br />
44,957<br />
50 5<br />
1981/earlier<br />
775<br />
860<br />
all Wheat<br />
792<br />
1982–1990<br />
792<br />
all grapes,<br />
Bearing<br />
740<br />
<strong>almond</strong>s,<br />
Bearing<br />
1991–2000<br />
750<br />
CaLifornia aLMonD aCreage By year pLanteD<br />
total in thousands<br />
1,600<br />
1,400<br />
1,200<br />
1,000<br />
800<br />
600<br />
400<br />
200<br />
0<br />
610<br />
640<br />
all Corn<br />
2001–2010<br />
558<br />
553<br />
all rice<br />
150 15<br />
0 0<br />
306<br />
450<br />
all Cotton<br />
2008<br />
269<br />
258<br />
processing<br />
tomatoes<br />
2009<br />
2010 <strong>2011</strong> forecasted<br />
227<br />
227<br />
Walnuts,<br />
Bearing<br />
220<br />
13,362<br />
2010<br />
oats<br />
210<br />
source: usDa, nass/Cfo.<br />
12<br />
source: inC (international nut and Dried fruit), The Cracker <strong>2011</strong>.<br />
note: “all other Countries” includes eight countries.<br />
sources: usDa, nass/Cfo. acres standing 2010.<br />
note: Detailed data is voluntarily reported by growers to nass/Cfo; therefore, totals do not match annual usDa/nass forecast.<br />
13
top ten eXports By VaLue<br />
top ten u.s. speCiaLty Crop eXports By VaLue 2010* (in MiLLions)<br />
aLMonD proDuCtion By County MiLLion pounDs<br />
soutHern VaLLey Counties<br />
nortHern VaLLey Counties<br />
$2,500<br />
$2,000<br />
$1,500<br />
$1,000<br />
$500<br />
$0<br />
$2,393<br />
<strong>Almond</strong>s<br />
$1,029<br />
Wine and<br />
Wine<br />
products<br />
$827<br />
fresh<br />
apples<br />
$819<br />
Walnuts<br />
$720<br />
pistachios<br />
$692<br />
frozen<br />
potato<br />
fries<br />
$634<br />
fresh<br />
grapes<br />
$439<br />
Lettuce<br />
$401<br />
oranges<br />
and<br />
tangerines<br />
$341<br />
strawberries<br />
Crop year<br />
kern<br />
fresno<br />
stanislaus<br />
Merced<br />
Madera<br />
san Joaquin<br />
tulare<br />
kings<br />
Colusa<br />
glenn<br />
Butte<br />
yolo<br />
tehama<br />
sutter<br />
all others<br />
total<br />
2001/02 167.0 131.5 139.3 110.6 80.5 46.3 15.8 5.8 31.8 29.3 49.1 4.3 5.7 4.1 2.2 823.3<br />
2002/03 221.0 173.0 193.5 152.9 106.3 57.2 20.7 8.2 28.4 41.5 59.3 5.2 8.6 4.5 2.6 1,082.9<br />
2003/04 205.9 176.9 169.3 129.3 94.5 55.3 18.5 12.3 55.0 42.3 50.0 6.6 8.0 5.7 4.1 1,033.6<br />
2004/05 215.8 173.5 163.9 127.6 93.4 51.0 20.4 13.0 38.0 37.2 45.0 4.7 6.9 4.6 2.9 997.9<br />
2005/06 210.1 160.1 132.2 102.1 82.4 41.8 15.9 12.0 40.3 42.6 50.4 5.6 8.4 4.6 2.7 911.4<br />
source: Bureau <strong>of</strong> the Census, u.s. Department <strong>of</strong> Commerce, foreign trade statistics.<br />
*Calendar year January through December 2010.<br />
top ten CaLifornia agriCuLturaL eXports By VaLue 2009* (in MiLLions)<br />
2006/07 247.8 232.7 163.6 124.6 100.1 55.6 21.5 17.7 50.8 38.4 41.8 6.3 7.7 4.9 3.8 1,117.3<br />
2007/08 271.0 253.8 223.3 172.9 125.3 75.2 26.7 17.9 66.2 51.8 66.7 10.0 11.4 5.6 5.1 1,383.6<br />
2008/09 354.3 322.2 240.6 187.3 142.7 82.1 36.2 23.4 86.0 48.6 56.9 10.4 9.7 5.3 5.2 1,611.0<br />
$2,500<br />
$2,000<br />
$1,500<br />
$1,925<br />
2009/10 317.9 281.9 198.8 156.7 112.3 70.7 32.6 20.6 75.7 52.7 49.2 12.4 10.9 5.2 4.9 1,402.6<br />
2010/11 403.5 344.2 202.5 164.2 149.7 68.0 42.4 29.9 83.0 55.8 47.1 13.6 11.7 4.9 6.0 1,626.6<br />
source: usDa form fV193, report <strong>of</strong> inedible Content <strong>of</strong> <strong>almond</strong> receipts. note: totals may not add precisely due to rounding.<br />
$1,000<br />
$500<br />
$877<br />
$812<br />
$682<br />
$666<br />
$608<br />
$594<br />
$458<br />
$419<br />
$321<br />
$0<br />
<strong>Almond</strong>s<br />
rice<br />
Wine<br />
pistachios<br />
Walnuts<br />
Dairy and<br />
products<br />
table<br />
grapes<br />
tomatoes,<br />
processed<br />
oranges<br />
and<br />
products<br />
Lettuce<br />
14<br />
source: university <strong>of</strong> <strong>California</strong>, agricultural issues Center.<br />
*Calendar year January through December 2009.<br />
15
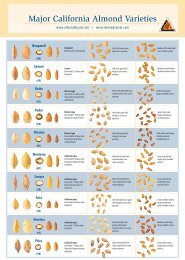
eCeipts By County + Variety Crop year 2010/11<br />
top ten aLMonD Varieties + aCreage<br />
Counties<br />
% Crop<br />
nonpareil<br />
Lbs.<br />
Monterey<br />
Lbs.<br />
Carmel<br />
Lbs.<br />
Butte/padre<br />
Lbs.<br />
Butte<br />
Lbs.<br />
fritz<br />
Lbs.<br />
all others<br />
Lbs.<br />
all Varieties<br />
Lbs.<br />
top ten aLMonD-proDuCing Varieties 2000/01 Vs. 2010/11 perCentage <strong>of</strong> tonnage<br />
coAsT coUNTies<br />
Del norte 0.02% 89,675 16,063 46,721 0 33,032 17,618 142,553 345,662<br />
Monterey 0.01% 55,399 5,985 41,046 29,544 0 7,785 44,342 184,101<br />
coAsT ToTAls 0.03% 145,074 22,048 87,767 29,544 33,032 25,403 186,895 529,763<br />
NorTH VAlleY<br />
Butte 2.90% 16,719,598 942,607 5,739,656 2,190,337 4,885,907 314,802 16,332,177 47,125,084<br />
Colusa 5.12% 30,060,306 5,688,152 11,376,191 1,097,616 14,249,209 5,462,343 15,268,419 83,202,236<br />
glenn 3.43% 23,726,558 1,898,587 7,034,024 1,348,503 7,699,374 760,315 13,332,642 55,800,003<br />
sacramento 0.00% 29,354 0 0 0 0 22,460 7,885 59,699<br />
solano 0.27% 1,948,536 122,393 344,887 265,132 891,112 10,059 793,185 4,375,304<br />
sutter 0.30% 1,103,275 92,321 505,070 781,792 551,028 59,605 1,836,753 4,929,844<br />
tehama 0.72% 4,967,202 239,021 1,612,833 527,689 1,788,772 55,778 2,469,624 11,660,919<br />
yolo 0.83% 4,795,667 657,100 1,596,599 596,957 2,354,340 362,263 3,202,135 13,565,061<br />
yuba 0.05% 302,146 60,694 70,375 35,655 38,492 32,536 293,501 833,399<br />
NorTH ToTAls 13.62% 83,652,642 9,700,875 28,279,635 6,843,681 32,458,234 7,080,161 53,536,321 221,551,549<br />
soUTH VAlleY<br />
percentage <strong>of</strong> tonnage<br />
50%<br />
40%<br />
30%<br />
20%<br />
10%<br />
0%<br />
39%<br />
34%<br />
nonpareil<br />
4%<br />
14%<br />
Monterey<br />
19%<br />
11%<br />
0%<br />
10%<br />
9%<br />
8%<br />
7%<br />
3% 3% 3%<br />
4%<br />
1% 2% 2% 2% 2%<br />
2000/01 2010/11<br />
Carmel Butte/padre Butte fritz padre aldrich sonora price other<br />
source: usDa incoming receipts from fV 193 certificates reported to <strong>almond</strong> <strong>Board</strong> <strong>of</strong> <strong>California</strong>.<br />
notes: Mission and peerless varieties dropped <strong>of</strong>f the top ten varieties during 2010/11. Butte/padre first reported as a variety in 2004.<br />
15%<br />
7%<br />
fresno 21.16% 115,757,954 60,767,648 24,578,932 40,034,101 31,611,141 17,920,391 53,574,779 344,244,946<br />
kern 24.81% 146,211,673 81,740,194 17,215,198 29,824,347 34,822,950 41,027,790 52,671,978 403,514,130<br />
kings 1.84% 11,082,825 4,379,727 1,277,070 6,294,106 781,454 2,816,781 3,235,703 29,867,666<br />
Madera 9.21% 43,850,310 23,704,920 19,201,821 23,430,875 9,786,296 7,738,633 22,029,722 149,742,577<br />
Merced 10.10% 50,650,473 18,447,877 26,108,235 17,278,007 11,276,285 8,770,106 31,716,141 164,247,124<br />
san Joaquin 4.18% 22,692,468 2,530,132 14,921,026 9,675,896 3,335,348 5,141,250 9,726,989 68,023,109<br />
stanislaus 12.45% 65,092,787 16,700,088 38,927,865 25,192,717 10,086,623 10,444,525 36,035,582 202,480,187<br />
tulare 2.60% 15,974,050 6,205,926 1,880,324 4,147,250 3,720,792 4,894,172 5,420,122 42,242,636<br />
soUTH ToTAls 86.34% 471,312,540 214,476,512 144,110,471 155,877,299 105,420,889 98,753,648 214,411,016 1,404,362,375<br />
All oTHers<br />
Mariposa 0.00% – – – – – – 67,963 67,963<br />
san Benito 0.00% – – – – – – 14,797 14,797<br />
tuolumne 0.00% 15,914 – – – – – 18,909 34,823<br />
All oTHers ToTAls 0.01% 15,914 0 0 0 0 0 101,669 117,583<br />
YTD ToTAls 100.00% 555,126,170 224,199,435 172,477,873 162,750,524 137,912,155 105,859,212 268,235,901 1,626,561,270<br />
aLMonD Bearing aCreage Crop year 2006/07–<strong>2011</strong>/12<br />
thousand acres<br />
Bearing acreage percentage change from previous year in bearing acres<br />
800,000<br />
720,000 740,000 750,000 20%<br />
680,000<br />
700,000<br />
640,000<br />
610,000<br />
600,000<br />
15%<br />
500,000<br />
400,000<br />
300,000<br />
200,000<br />
100,000<br />
0<br />
3.4%<br />
4.9%<br />
6.3% 5.9%<br />
2006/07 2007/08 2008/09 2009/10 2010/11 <strong>2011</strong>/12 forecast<br />
2.8%<br />
1.4%<br />
10%<br />
5%<br />
0%<br />
percentage change from previous year<br />
16<br />
source: usDa form fV 193, report <strong>of</strong> inedible Content <strong>of</strong> <strong>almond</strong> receipts.<br />
sources: usDa, nass/Cfo. 2010 acreage report.<br />
17
aLMonD Crop estiMates Vs. aCtuaL reCeipts MiLLion pounDs<br />
aLMonD Crop estiMates Vs. aCtuaL reCeipts Crop year 2001/02–2010/11<br />
Crop year<br />
objective<br />
forecast<br />
Handler<br />
receipts<br />
Loss and<br />
exempt<br />
redetermined<br />
Marketable<br />
Weight<br />
pounds<br />
rejects in<br />
receipts<br />
1992/93 550.0 545.9 29.9 516.0 15.5<br />
1993/94 470.0 488.2 18.2 470.0 9.8<br />
1994/95 640.0 732.9 19.6 713.3 12.8<br />
1995/96 310.0 366.7 14.4 352.3 10.4<br />
1996/97 530.0 507.5 18.2 489.3 13.0<br />
million pounds<br />
2,000<br />
1,600<br />
1,200<br />
800<br />
400<br />
0<br />
2001/02<br />
2002/03<br />
2003/04<br />
2004/05<br />
2005/06<br />
2006/07<br />
2007/08<br />
2008/09<br />
2009/10<br />
2010/11<br />
1997/98 680.0 756.5 19.7 736.8 14.3<br />
subjective forecast 875 940 920 1,100 850 1,020 1,310 1,460 1,450 1,530<br />
1998/99 540.0 517.0 24.6 492.4 14.9<br />
objective forecast 850 980 1,000 1,080 880 1,050 1,330 1,500 1,350 1,650<br />
1999/00 830.0 829.9 34.4 795.5 9.3<br />
actual production 824 1,084 1,033 998 912 1,117 1,383 1,615 1,406 1,628<br />
2000/01 640.0 698.4 26.0 672.4 15.7<br />
2001/02 850.0 824.1 29.3 794.8 16.7<br />
2002/03 980.0 1,083.7 20.2 1,063.5 8.2<br />
2003/04 1,000.0 1,032.9 21.8 1,011.1 19.8<br />
aLMonD reCeipts VarianCe froM foreCast Crop year 2001/02–2010/11<br />
2004/05 1,080.0 998.0 25.2 972.8 14.5<br />
2005/06 880.0 911.7 23.0 888.7 16.0<br />
2006/07 1,050.0 1,116.7 28.9 1,087.8 24.0<br />
2007/08 1,330.0 1,383.0 24.7 1,358.3 17.2<br />
2008/09 1,500.0 1,614.6 42.7 1,571.9 13.9<br />
2009/10 1,350.0 1,405.9 26.9 1,379.0 19.6<br />
2010/11 1,650.0 1,628.2 27.9 1,600.3 18.1<br />
<strong>2011</strong>/12* 1,950.0 * 58.5 1,891.5 † *<br />
percentage variance<br />
15%<br />
10%<br />
5%<br />
0%<br />
-5%<br />
-10%<br />
-15%<br />
-3%<br />
2001/02<br />
11%<br />
2002/03<br />
3% 4%<br />
-8%<br />
2003/04 2004/05 2005/06<br />
6%<br />
2006/07<br />
4%<br />
2007/08<br />
8%<br />
2008/09<br />
4%<br />
2009/10<br />
-1%<br />
2010/11<br />
source: <strong>almond</strong> <strong>Board</strong> <strong>of</strong> <strong>California</strong>. note: objective forecast provided by usDa, nass/Cfo.<br />
*not available at time <strong>of</strong> publication. †estimate.<br />
source: <strong>almond</strong> <strong>Board</strong> <strong>of</strong> <strong>California</strong>. note: objective forecast provided by usDa, nass/Cfo.<br />
18<br />
19
CaLifornia aLMonD aCreage + farM VaLue<br />
Crop VaLue anD yieLD per Bearing aCre Crop year 2001/02–2010/11<br />
Crop<br />
year<br />
aCreage yieLD VaLue in DoLLars<br />
Bearing non-Bearing total new plantings<br />
Bearing acre<br />
yield (lbs.)<br />
production*<br />
(million lbs.)<br />
farm<br />
price<br />
farm Value<br />
($1,000)<br />
Value per<br />
Bearing acre<br />
2001/02 530,000 75,000 605,000 19,348 1,570 824.1 $0.91 $740,012 $1,396<br />
2002/03 545,000 65,000 610,000 15,857 2,000 1,083.7 $1.11 $1,200,687 $2,203<br />
2003/04 550,000 60,000 610,000 17,639 1,890 1,032.9 $1.57 $1,600,144 $2,909<br />
2004/05 570,000 70,000 640,000 36,220 1,760 998.0 $2.21 $2,189,005 $3,840<br />
2005/06 590,000 110,000 700,000 49,281 1,550 911.7 $2.81 $2,525,909 $4,281<br />
2006/07 610,000 145,000 755,000 35,486 1,840 1,116.7 $2.06 $2,258,790 $3,703<br />
2007/08 640,000 125,000 765,000 14,381 2,170 1,383.0 $1.75 $2,401,875 $3,753<br />
2008/09 680,000 115,000 795,000 21,678 2,400 1,614.6 $1.45 $2,343,200 $3,446<br />
2009/10 720,000 90,000 810,000 18,264 1,960 1,405.9 $1.65 $2,293,500 $3,185<br />
2010/11 740,000 85,000 825,000 13,362 2,220 1,628.2 $1.75 $2,838,500 $3,836<br />
<strong>2011</strong>/12 † 750,000 ‡ ‡ ‡ 2,600 1,950.0 ‡ ‡ ‡<br />
source: usDa, nass/Cfo. note: <strong>almond</strong> <strong>Board</strong> <strong>of</strong> <strong>California</strong> does not track prices.<br />
*production numbers provided by <strong>almond</strong> <strong>Board</strong> <strong>of</strong> <strong>California</strong>. †estimated. ‡not available at time <strong>of</strong> publication.<br />
value per bearing acre<br />
$500<br />
$0<br />
2001/02 2002/03 2003/04 2004/05 2005/06 2006/07<br />
proDuCtion Vs. farM priCe* Crop year 2001/02–2010/11<br />
million pounds<br />
$4,500<br />
Value per acre<br />
$4,281<br />
$4,000 yield per acre (pounds)<br />
$3,840<br />
$3,703<br />
$3,500<br />
$3,000<br />
$2,909<br />
$2,500<br />
$2,203<br />
$2,000<br />
$1,396<br />
$1,500<br />
2,000 1,890<br />
$1,000<br />
1,570<br />
1,760<br />
1,550<br />
1,840<br />
2,000<br />
1,800<br />
production<br />
farm price<br />
$2.81<br />
1,600<br />
1,400<br />
$2.21<br />
$2.06<br />
1,200<br />
1,083.7 1,032.9<br />
1,000<br />
824.1<br />
998.0<br />
911.7 1,116.7<br />
800<br />
600<br />
$1.11 $1.57<br />
400 $0.91<br />
200<br />
$3,753<br />
2,170<br />
2007/08<br />
1,383.0<br />
$1.75<br />
$3,446<br />
2,400<br />
2008/09<br />
1,614.6<br />
$1.45<br />
$3,185<br />
1,960<br />
2009/10<br />
1,405.9<br />
$1.65<br />
$3,836<br />
2,220<br />
2010/11<br />
1,628.2<br />
$1.75<br />
4,500<br />
4,000<br />
3,500<br />
3,000<br />
2,500<br />
2,000<br />
1,500<br />
1,000<br />
500<br />
0<br />
$3.00<br />
$2.50<br />
$2.00<br />
$1.50<br />
$1.00<br />
yield per acre (pounds) farm price<br />
0<br />
2001/02<br />
2002/03<br />
2003/04<br />
2004/05<br />
2005/06<br />
2006/07<br />
2007/08<br />
2008/09<br />
2009/10<br />
2010/11<br />
$0.50<br />
source: usDa, nass/Cfo. note: <strong>almond</strong> <strong>Board</strong> <strong>of</strong> <strong>California</strong> does not track prices.<br />
*production numbers provided by <strong>almond</strong> <strong>Board</strong> <strong>of</strong> <strong>California</strong>.<br />
20<br />
<strong>almond</strong> <strong>almanac</strong> <strong>2011</strong><br />
21
Crop siZe History Vs. ineDiBLe perCentage Crop year 2001/02–2010/11<br />
crop size (millions pounds)<br />
Crop size inedible gross percentage<br />
2,000<br />
2.5%<br />
2.15%<br />
1,615<br />
1,628<br />
2.02%<br />
1.92%<br />
1,500 1,383<br />
1,406<br />
1.76%<br />
2.0%<br />
1,084 1,117<br />
1,033 998<br />
1,000 912<br />
1.39%<br />
1.5%<br />
824.1<br />
1.46%<br />
1.24%<br />
500 1.11% 1.0%<br />
0.87%<br />
0.76%<br />
0 0.5%<br />
2001/02 2002/03 2003/04 2004/05 2005/06 2006/07 2007/08 2008/09 2009/10 2010/11<br />
inedible gross percentage<br />
CoMpeting nuts<br />
u.s. MarketaBLe proDuCtion + iMports <strong>of</strong> CoMpeting nuts MiLLion pounDs (sHeLLeD Basis)<br />
Crop<br />
year<br />
aLMonDs WaLnuts HaZeLnuts peCans pistaCHios otHer nuts*<br />
Crop imports Crop imports Crop imports Crop imports Crop imports Crop imports<br />
2001/02 800.7 0.8 256.7 0.2 38.1 15.2 145.6 35.5 80.7 0.5 25.5 286.7<br />
2002/03 1,063.5 1.9 240.5 0.2 15.3 16.4 78.4 41.7 149.5 0.8 26.7 301.7<br />
2003/04 1,011.1 2.8 281.5 0.4 29.5 10.9 117.0 62.7 56.2 1.5 21.2 352.4<br />
2004/05 972.8 5.7 288.4 0.8 27.2 12.8 82.6 81.2 170.5 0.8 18.7 402.4<br />
2005/06 888.7 9.2 288.2 1.1 20.0 12.1 125.3 75.4 139.0 0.9 51.4 334.9<br />
2006/07 1,087.8 8.1 294.6 2.3 36.4 13.5 91.4 57.0 119.0 1.4 27.8 358.8<br />
2007/08 1,358.3 7.1 295.0 9.0 28.6 13.4 180.3 79.9 207.0 0.9 16.4 378.3<br />
2008/09 1,571.9 4.2 395.5 2.0 26.2 10.0 94.3 61.9 135.4 0.9 32.7 360.4<br />
2009/10 1,379.0 5.6 381.5 3.2 37.4 8.0 127.5 80.1 174.8 1.3 19.1 366.4<br />
2010/11 † 1,600.3 8.1 436.8 0.5 21.3 11.0 140.4 82.8 250.1 0.5 18.2 379.5<br />
source: <strong>almond</strong> <strong>Board</strong> <strong>of</strong> <strong>California</strong>.<br />
DoMestiC per Capita ConsuMption <strong>of</strong> CoMpeting nuts Crop year 2006/07–2010/11<br />
pounds per capita<br />
1.5<br />
1.2<br />
0.9<br />
0.6<br />
0.3<br />
<strong>almond</strong>s ‡ pecans Walnuts pistachios Hazelnuts<br />
1.27<br />
1.33 1.36<br />
1.45<br />
1.57<br />
0.0<br />
2006/07 2007/08 2008/09 2009/10 2010/11<br />
22<br />
sources: usDa, economic research service, Fruit & Tree Nut Situation and Outlook. note: Marketable production is utilized production minus inedible and noncommercial use.<br />
*other nuts include brazil nuts, macadamia nuts, pine nuts, chestnuts, cashews and mixed nuts. †preliminary. ‡<strong>almond</strong> <strong>Board</strong> <strong>of</strong> <strong>California</strong>.<br />
23
Marketing prograM introDuCtion<br />
2010 marked the final year <strong>of</strong> the <strong>Board</strong>’s previous marketing strategy, and so this year <strong>almond</strong><br />
<strong>Board</strong> <strong>of</strong> <strong>California</strong> undertook an initiative to develop a global market development analysis<br />
to help prioritize markets and resources for aBC programs in the next five to ten years. the<br />
analysis focused on identifying growth opportunities by market and category and classifying<br />
those opportunities as exploratory, emerging and established. Depending on a market’s level <strong>of</strong><br />
development, a combination <strong>of</strong> market access, trade stewardship and marketing programs will be<br />
utilized to further develop it.<br />
to support the new global strategic approach, the <strong>Board</strong> <strong>of</strong> Directors aligned the aBC committee<br />
structure to the new approach by creating the global Market Development Committee.<br />
this committee is charged with overseeing demand-building around the world, with two<br />
subcommittees that are focused on established markets with long-term, stable growth and<br />
emerging markets that are rapidly growing but have volatile trade conditions.<br />
one <strong>of</strong> the most significant changes to the programs will be a broadening <strong>of</strong> the marketing focus<br />
globally to a comprehensive approach that includes market access, trade stewardship and<br />
marketing. the new committees will use the phased approach below to develop markets at various<br />
stages <strong>of</strong> <strong>almond</strong> familiarity and use.<br />
Market aCCess<br />
gloBal technical and regulatory affairs (gtra)<br />
an essential element <strong>of</strong> the market development strategy, in the u.s. and abroad, is addressing<br />
those regulatory or import requirements that could disrupt the normal flow <strong>of</strong> <strong>almond</strong>s, impact<br />
customer perception or compromise positive promotional efforts. the objective is to provide<br />
support and synergy to the other <strong>almond</strong> <strong>Board</strong> <strong>of</strong> <strong>California</strong> committees, focusing on those issues<br />
that impact the production and worldwide marketing <strong>of</strong> <strong>California</strong> <strong>almond</strong>s.<br />
During <strong>2011</strong>, the <strong>Board</strong>’s efforts to address technical and trade-related issues continued to<br />
draw heavily on trade/governmental relationships, leveraging coalitions and building alliances<br />
to overcome technical or trade barriers. efforts focused on assessing the landscape for <strong>almond</strong><br />
tariffs in China, identifying where harmonized pesticide standards are needed, as well as working<br />
together with other industry alliances in monitoring the rollout <strong>of</strong> fDa’s regulations under the new<br />
food safety Modernization act. solutions are <strong>of</strong>ten time-consuming and complex, requiring good<br />
science as well as education <strong>of</strong> stakeholders about industry practices.<br />
gtra strategiC priorities 2010/11<br />
Market DeVeLopMent aCtiVity BaseD on Market CLassifiCation<br />
market access focus<br />
educate<br />
stakeholders<br />
harmonization<br />
<strong>of</strong> standards<br />
Build aWareness<br />
and confidence<br />
eXploratory<br />
market analysis and education<br />
continued market analysis, education and risk management and mitigation<br />
trade development<br />
relationship maintenance/management<br />
emerging<br />
trade development and marketing focus<br />
target definition strategy definition plan development<br />
market analysis and education<br />
continued market analysis, education and risk management and mitigation<br />
trade development<br />
relationship maintenance/management<br />
campaign execution<br />
measure/refinement<br />
ag policy/legislation<br />
webinar series<br />
initiated<br />
china tariff<br />
strategy initiated<br />
participation in<br />
alliances focused on<br />
rollout <strong>of</strong> fda food<br />
safety act<br />
estaBlished<br />
trade management and marketing focus<br />
target definition strategy definition plan development<br />
market analysis and education<br />
continued market analysis, education and risk management and mitigation<br />
trade development<br />
relationship maintenance/management<br />
campaign execution<br />
measure/refinement<br />
three additional eu<br />
port authority visits<br />
completed<br />
50% increase in<br />
comments and<br />
consultations related<br />
to key technical and<br />
regulatory issues<br />
hosting india food<br />
safety authorities<br />
target definition<br />
strategy definition<br />
plan development<br />
campaign execution<br />
measure/refinement<br />
24<br />
source: global Market Development analysis report, <strong>2011</strong>, Deloitte Consulting.<br />
25
+1.209.549.8262 • F: +1.209.549.8267<br />
odesto, CA 95354 USA • T: +1.209.549.8262 • F: +1.209.549.8267<br />
dcALM08088_TECHKIT_PFOLD.indd 1<br />
1150 Ninth St., Ste. 1500 • Modesto, CA 95354 USA • T: +1.209.549.8262 • F: +1.209.549.8267<br />
1150 Ninth St., Ste. 1500 Modesto, CA 95354 USA T: +1.209.549.8262 F: +1.209.549.8267<br />
<strong>Almond</strong><strong>Board</strong>.com<br />
<strong>Almond</strong><strong>Board</strong>.com<br />
10/5/09 12:20 PM<br />
10/5/09 12:20 PM<br />
traDe steWarDsHip<br />
oVerView<br />
<strong>almond</strong> <strong>Board</strong> <strong>of</strong> <strong>California</strong> recognizes that one key barrier to continued and expanded use <strong>of</strong><br />
<strong>almond</strong>s among food pr<strong>of</strong>essionals, whether they are a food importer or food manufacturer, is<br />
<strong>almond</strong> experience and knowledge. aBC programs fill the information gap with technical and<br />
functional research to educate buyers and users on the characteristics <strong>of</strong> <strong>almond</strong>s that make them<br />
work so well in many product applications, as well as building an arsenal <strong>of</strong> nutrition, market and<br />
consumer research to communicate the value-adding benefits <strong>of</strong> <strong>almond</strong>s. key markets <strong>of</strong> focus<br />
for these education efforts have been russia, poland and China—emerging economies that are<br />
quickly developing food-processing sectors to meet growing consumer demand for nutritious,<br />
delicious products. through seminars, trade missions, trade shows, materials such as the<br />
technical information kit and communications such as newsletters, aBC has been able to reach<br />
a growing number <strong>of</strong> importers, distributors, food manufacturers and retailers to convey the great<br />
opportunity <strong>of</strong> doing business with the <strong>California</strong> <strong>almond</strong> industry and affirming <strong>California</strong> <strong>almond</strong>s’<br />
position as the nut <strong>of</strong> Choice.<br />
<strong>Almond</strong> technical<br />
information kit.<br />
Russian<br />
chocolate<br />
information<br />
brochure.<br />
traDe steWarDsHip<br />
cHiNA TrADe ProGrAm<br />
<strong>almond</strong> <strong>Board</strong> <strong>of</strong> <strong>California</strong> has prioritized market development activities in China since this<br />
market shows enormous potential in market conditions and environment that are aligned with<br />
the benefits that <strong>almond</strong>s provide. to maintain<br />
<strong>California</strong> <strong>almond</strong>s’ place in the forefront <strong>of</strong> food<br />
pr<strong>of</strong>essionals’ minds, aBC carries out programs to<br />
educate importers, distributors, food manufacturers<br />
and retailers about the function, form and flavor;<br />
the value and versatility <strong>of</strong> <strong>almond</strong>s; and the quality,<br />
safety and stability <strong>of</strong> <strong>California</strong>’s <strong>almond</strong> supply.<br />
one cornerstone program that is unique to the aBC<br />
China trade stewardship program is the annual food<br />
science student <strong>almond</strong> innovation competition.<br />
Student competition product judging.<br />
this successful competition serves as a platform to<br />
communicate to food manufacturers about the multiple possibilities <strong>of</strong> innovating with <strong>almond</strong>s,<br />
and engages them in an activity that fosters dialogue about the positive development <strong>of</strong> the<br />
Chinese food industry with <strong>California</strong> <strong>almond</strong>s as a key partner. in addition, the <strong>California</strong> <strong>almond</strong><br />
industry benefits from the exposure to a large student base; many <strong>of</strong> these students will go on to<br />
be at the forefront <strong>of</strong> product development in the Chinese food industry.<br />
technical informAtion<br />
annuaL partiCipation in CHinese stuDent innoVation CoMpetition<br />
2004 –<strong>2011</strong><br />
2004 2005 2006 2007 2008 2009 2010 <strong>2011</strong><br />
proposals 17 32 12 64 91 209 401 809<br />
technical informAtion<br />
informacje technical informAtion<br />
techniczne<br />
<strong>Almond</strong>s and<br />
print materials<br />
displayed at<br />
Poland trade<br />
workshop.<br />
universities 1 1 1 5 8 36 29 56<br />
students 68 128 48 256 364 1,020 2,000 3,785<br />
source: <strong>almond</strong> <strong>Board</strong> <strong>of</strong> <strong>California</strong>.<br />
26<br />
27
traDe steWarDsHip<br />
fooD Pr<strong>of</strong>essioNAl<br />
for the third year in a row, <strong>almond</strong>s are the number one nut in global new product introductions, and from 2008 to 2010, products with <strong>almond</strong>s<br />
increased 69%. the <strong>almond</strong> <strong>Board</strong> <strong>of</strong> <strong>California</strong> food pr<strong>of</strong>essional program highlights <strong>almond</strong>s as an essential ingredient in products that drive<br />
the most <strong>almond</strong> volume (i.e., chocolate, cereal and snacking), reaching research and development, general management and marketing at global<br />
consumer packaged goods firms.<br />
introDuCtions By nut type 2008–2010 sHare <strong>of</strong> nut Mentions 2010<br />
nut 2008 2009 2010<br />
% Change<br />
(2008–2010)<br />
<strong>Almond</strong>s 2,818 3,663 4,757 69%<br />
peanuts 2,019 2,494 3,562 76%<br />
Hazelnuts 2,311 3,029 3,440 49%<br />
Cashews 805 1,072 1,502 87%<br />
Walnuts 566 705 977 73%<br />
pistachios 274 424 558 104%<br />
pecans 380 682 934 146%<br />
Macadamia nuts 153 315 417 174%<br />
Macadamia nuts 2%<br />
Walnuts 6%<br />
Cashews 9%<br />
pistachios 3%<br />
pecans 5%<br />
Hazelnuts 20%<br />
other nuts 6%<br />
<strong>Almond</strong>s 28%<br />
peanuts 21%<br />
Marketing<br />
oVerView<br />
in fy 2010/11, <strong>almond</strong> <strong>Board</strong> <strong>of</strong> <strong>California</strong> continued to focus its marketing efforts in the following<br />
core countries: u.s., uk, france, germany, China, india and Canada. Marketing programs in each<br />
<strong>of</strong> these countries focus on earning the advocacy <strong>of</strong> consumers, food pr<strong>of</strong>essionals and health<br />
pr<strong>of</strong>essionals. over the past year, marketing campaigns in each country focused on aBC’s strong<br />
nutrition research base; however, aBC began establishing a more emotional connection to <strong>almond</strong>s<br />
through comprehensive public relations and advertising campaigns.<br />
shipments to each <strong>of</strong> these countries continue to rise. north america remains the single largest<br />
market for <strong>California</strong> <strong>almond</strong>s, while shipments to asia-pacific continue to rise significantly due to the<br />
growth in the Chinese market, surpassing spain for the first time.<br />
HistoriC sHipMents By region 2006/07–2010/11 (MiLLion pounDs)<br />
million pounds<br />
1,000<br />
800<br />
600<br />
400<br />
200<br />
0<br />
uk/germany/france China/india/Japan/korea u.s./Canada<br />
152<br />
151<br />
401<br />
2006/07<br />
167<br />
183<br />
434<br />
2007/08<br />
163<br />
257<br />
452<br />
2008/09<br />
165<br />
296<br />
489<br />
2009/10<br />
169<br />
362<br />
535<br />
2010/11<br />
source: <strong>almond</strong> <strong>Board</strong> <strong>of</strong> <strong>California</strong>.<br />
source: innova new product Database and sterling-rice group,<br />
global new product introductions report, 2010.<br />
source: innova new product Database and sterling-rice group,<br />
global new product introductions report, 2010.<br />
gLoBaL Marketing BuDget 2010/11 (in MiLLions)<br />
usD<br />
$20,000,000<br />
$15,000,000<br />
$10,000,000<br />
$5,000,000<br />
0<br />
advertising public relations research<br />
u.s./Canada<br />
uk/germany/france<br />
China/india<br />
28<br />
source: <strong>almond</strong> <strong>Board</strong> <strong>of</strong> <strong>California</strong>.<br />
29
Marketing<br />
ADVerTisiNG<br />
to bring a more emotional connection to <strong>almond</strong>s to life, <strong>almond</strong> <strong>Board</strong> <strong>of</strong><br />
<strong>California</strong> launched several new advertising campaigns in india, the united<br />
kingdom and united states this past year.<br />
india<br />
aBC advertising to indian women started in september 2010, with a<br />
campaign featuring Bollywood actress karisma kapoor, right before the<br />
peak consumption period in north and West india, which includes the Diwali<br />
festival and winter months. television and print advertisements were used to<br />
remind women <strong>of</strong> the traditions <strong>of</strong> eating <strong>almond</strong>s and provide new ideas that<br />
make <strong>almond</strong>s relevant for today. the campaign continued in the fall <strong>of</strong> <strong>2011</strong><br />
to build momentum for the Diwali festival. Consumer research is underway to<br />
launch a new campaign in 2012.<br />
<strong>Almond</strong>s.<br />
If you carry them, they’ll carry you.<br />
No matter where your day takes you, a handy helping <strong>of</strong> <strong>almond</strong>s is the perfect portable<br />
snack that always takes you further. Exceptionally delicious and naturally nutritious,<br />
every tasty crunch packs higher levels <strong>of</strong> protein, fibre, calcium and vitamin E<br />
than any other nut*. So, they satisfy you best when you need it most.<br />
Learn more about <strong>almond</strong>s, the on-the-go essential, at <strong>Almond</strong><strong>Board</strong>.co.uk<br />
*Compared to other tree nuts, gram per gram, <strong>almond</strong>s are the nut highest in protein, fibre, vitamin E, calcium, rib<strong>of</strong>lavin and niacin. © <strong>2011</strong> <strong>Almond</strong> <strong>Board</strong> <strong>of</strong> <strong>California</strong>. All rights reserved.<br />
Marketing<br />
NorTH AmericA<br />
investment in the north american core consumer target audience, Jane, has been very strategic<br />
and has driven growth with the growing support <strong>of</strong> other target audiences, including Healthy Men.<br />
the decision in this investment can be attributed to the long history <strong>of</strong> market research in north<br />
america. the research continues to inform marketing campaigns with illuminating insight, both<br />
demographic and psychographic, into our consumer target audiences. this has enabled <strong>almond</strong><br />
<strong>Board</strong> <strong>of</strong> <strong>California</strong> to continue to take the <strong>California</strong> <strong>almond</strong> message to Jane and Healthy Men<br />
where and when it is relevant to them.<br />
according to the <strong>2011</strong> Consumer attitudes, awareness, and usage (aau) study, for the first year,<br />
<strong>almond</strong>s are tied with cashews for the number one nut associated with snacking. and, for the third<br />
year in a row, <strong>almond</strong>s were the top nut for self-reported ongoing usage.<br />
Jane: Women age 35+, the primary grocery shopper, actively tries to eat a healthy diet and enjoys trying new foods or new recipes.<br />
Healthy Men: Men age 18+, actively tries to eat a healthy diet and likes to engage in physical activities regularly.<br />
30<br />
united kingdom<br />
a new campaign was developed following extensive consumer market<br />
research that revealed a gap in nutritious, natural snacks in the european<br />
market. in January <strong>2011</strong>, the first-ever print and online advertising campaign<br />
launched in the united kingdom targeting food- and health-involved women.<br />
the ads, themed around the contents <strong>of</strong> women’s handbags, stand out and<br />
demonstrate how <strong>almond</strong>s are an essential, convenient and delicious snack.<br />
the campaign rolled out across 18 key consumer print titles and 10 websites,<br />
including Good Housekeeping, Tesco Magazine and iVillage.co.uk.<br />
united states<br />
aBC actively targets u.s. Healthy Men to communicate why they should<br />
choose a handful <strong>of</strong> <strong>almond</strong>s over other snack foods. Healthy Men are food<br />
and health involved and are looking for simple ways to improve heart health<br />
and maintain their weight. a new tV campaign, “Hearts Love <strong>almond</strong>s,”<br />
focuses on the heart-health benefits <strong>of</strong> <strong>almond</strong>s to demonstrate why they<br />
are a smart snack choice. to convey this message, the campaign introduces<br />
a symbolic heart to tell viewers why <strong>almond</strong>s are a smart choice. the tV<br />
campaign will run october <strong>2011</strong>–March 2012 with ads running on espn and<br />
Discovery Channel, allowing aBC to reach Healthy Men when they are highly<br />
engaged in sports and outdoor/active content.<br />
India print campaign leverages Diwali<br />
festivals and traditions to communicate<br />
health benefits <strong>of</strong> <strong>California</strong> <strong>Almond</strong>s.<br />
UK print handbag campaign focuses on the<br />
convenience <strong>of</strong> snacking on <strong>California</strong> <strong>Almond</strong>s.<br />
U.S. Healthy Men TV campaign focuses on heart-health benefits <strong>of</strong> <strong>almond</strong>s.<br />
ConneCt at a funCtionaL +<br />
eMotionaL LeVeL<br />
a product with <strong>almond</strong>s is... percentage agree<br />
2010 <strong>2011</strong> Change<br />
Contemporary 70% 72% +2% point<br />
Worth more money 57% 63% +6% point<br />
special to serve to<br />
family and friends<br />
77% 80% +3% point<br />
prefer to have<br />
<strong>almond</strong>s rather<br />
than other nuts<br />
57% 61% +4% point<br />
source: <strong>2011</strong> north american aau.<br />
oWn Heart HeaLtH<br />
aCross aLL targets<br />
strengtHen position as a tasty, nutritious fooD<br />
Heart Healthy* (percentage rating <strong>almond</strong>s<br />
excellent or good)<br />
2010 <strong>2011</strong> Change<br />
total 83% 83% –<br />
Jane 91% 91% –<br />
Healthy Men 86% 87% +1% point<br />
source: <strong>2011</strong> north american aau. *Consumer attitudes,<br />
awareness, and usage report, sterling-rice group, <strong>2011</strong>.<br />
<strong>almond</strong> taste scores (scale <strong>of</strong> 1–10) <strong>almond</strong> health scores (scale <strong>of</strong> 1–10)<br />
2010 <strong>2011</strong> Change 2010 <strong>2011</strong> Change<br />
total 8.0 8.1 +0.1 8.4 8.6 +.02<br />
Jane 8.7 8.8 +0.1 9.1 9.3 +.02<br />
Healthy Men 8.4 8.5 +0.1 8.7 8.9 +.02<br />
source: <strong>2011</strong> north american aau.<br />
31
puBLisHeD papers <strong>2011</strong><br />
32<br />
Marketing<br />
cHiNA<br />
in fy 2010/11, China became the top export destination for <strong>California</strong><br />
<strong>almond</strong>s, growing 26% from the previous year to a 168 million pound<br />
market. this emerging market continues to be a focal point for <strong>almond</strong><br />
<strong>Board</strong> <strong>of</strong> <strong>California</strong> investment across all three areas <strong>of</strong> market access,<br />
trade stewardship and marketing. aBC aims to increase awareness to<br />
this market by communicating key <strong>almond</strong> messages to consumers<br />
through advertising. aBC’s current consumer marketing efforts in China<br />
target women with increasing purchasing power and aspiration to be<br />
on trend in their product purchases. <strong>California</strong> <strong>almond</strong>s are a solution<br />
to these women who are time strapped and looking for nutritious food<br />
for themselves and their families as they balance their career-focused<br />
lifestyles. recent consumer research has shown that <strong>almond</strong>s are<br />
among the nuts Chinese consumers like most, however, there is<br />
opportunity for <strong>almond</strong>s to lead the pack and become the nut <strong>of</strong> choice<br />
in the hearts and minds <strong>of</strong> consumers. further research is currently<br />
being conducted to take an in-depth look at consumers’ behaviors and<br />
attitudes toward <strong>almond</strong>s, which will contribute to developing a new<br />
strategic approach to consumer marketing in China.<br />
Liking <strong>of</strong> nuts in CHina on a sCaLe <strong>of</strong> 1–10<br />
Walnuts Cashews pistachios <strong>almond</strong>s pine nuts Hazelnuts peanuts Macadamia<br />
nuts<br />
nut eaten Most <strong>of</strong>ten as a snaCk in CHina<br />
Cashews 3%<br />
1=don’t like them<br />
pecans 2%<br />
Brazil nuts 1%<br />
10=like extremely well<br />
aLMonD attriBute ratings in CHina*<br />
Macadamia nuts 4%<br />
Hazelnuts 5%<br />
peanuts 24%<br />
good for the brain 85% something that will fill me up 76%<br />
premium 83% Low in saturated fat 76% pine nuts 6%<br />
nutritious 82% easy to eat on the go 75%<br />
High in protein 81% High in magnesium 75%<br />
good for beauty/skin 81% High in vitamin e 75%<br />
a healthy snack 80% Low in calories 74%<br />
<strong>Almond</strong>s 16%<br />
great tasting 78% Versatile 73%<br />
natural 78% a source <strong>of</strong> fiber 73%<br />
a food i crave 78% Helps you manage your weight 68%<br />
rich in antioxidants 78% Lower priced 45%<br />
Heart healthy 76% Average<br />
76% pistachios 21%<br />
Walnuts 18%<br />
source: <strong>2011</strong> global perceptions study and sterling-rice group, <strong>2011</strong>.<br />
*percentage selecting excellent or good.<br />
source: <strong>2011</strong> global perceptions study and sterling-rice group, <strong>2011</strong>.<br />
10<br />
9<br />
8<br />
7<br />
6<br />
5<br />
4<br />
3<br />
2<br />
1<br />
8.3 8.2 8.2 8.1 8.0 7.9 7.8 7.7 7.5 7.4<br />
pecans<br />
Brazil<br />
nuts<br />
source: <strong>2011</strong> global perceptions study and sterling-rice group, <strong>2011</strong>.<br />
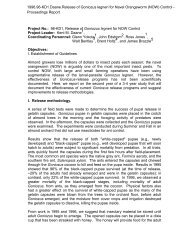
puBLisHeD papers <strong>2011</strong><br />
Hull Split Date and Shell Seal in Relation to navel Orangeworm<br />
(Lepidoptera: Pyralidae) infestation <strong>of</strong> <strong>almond</strong>s<br />
kelly Hamby, Ling Wang gao, Bruce Lampinen, thomas gradziel, frank Zalom<br />
Departments <strong>of</strong> entomology & plant sciences, uC Davis, Davis, Ca; China agricultural university, Beijing, China<br />
Journal <strong>of</strong> economic entomology (<strong>2011</strong>)104(3)<br />
Comparison <strong>of</strong> Trapping for eggs, Females, and Males <strong>of</strong> the<br />
navel Orangeworm (Lepidoptera: Pyralidae) in <strong>almond</strong>s<br />
Charles S. Burks, Bradley S. Higbee, Joel P. Siegel, David G. Brandl<br />
USDa, aRS, Parlier Ca<br />
environmental entomology (<strong>2011</strong>)40(3)<br />
Risk <strong>of</strong> Salmonellosis from Consumption <strong>of</strong> <strong>almond</strong>s in the north<br />
american Market<br />
elisabetta Lambertini, Michelle D. Danyluk, Donald W. schaffner, Carl k. Winter, Linda J. Harris<br />
Departments <strong>of</strong> food science and technology, university <strong>of</strong> <strong>California</strong>, one shields ave., Davis, Ca Department<br />
<strong>of</strong> food science and Human nutrition, Citrus research and education Center, university <strong>of</strong> florida, Lake alfred,<br />
fL, Department <strong>of</strong> food science, rutgers university, new Brunswick, nJ<br />
food research international (<strong>2011</strong>)<br />
Climate Change affects Winter Chill for Temperate Fruit and nut Trees<br />
eike Luedeling, evans H. Girvetz, Mikhail a. Semenov, Patrick H. Brown<br />
World agr<strong>of</strong>orestry Centre (iCRaF), nairobi, Kenya, The nature Conservancy, Seattle Washington, United<br />
States <strong>of</strong> america, Rothamsted Research, Harpenden, United Kingdom, Department <strong>of</strong> Plant Sciences,<br />
University <strong>of</strong> <strong>California</strong> Davis, Davis, Ca<br />
PloS One (<strong>2011</strong>)6(5)<br />
image analysis <strong>of</strong> Microstructural Changes in <strong>almond</strong><br />
Cotyledon as a Result <strong>of</strong> Processing<br />
aylin altan, kathryn L, McCarthy, rohan tikekar, Michael J. McCarthy, and n. nitin<br />
Department <strong>of</strong> food science & technology, uC Davis, Ca<br />
Journal <strong>of</strong> food science, (<strong>2011</strong>), 76<br />
a Review <strong>of</strong> Composition Studies <strong>of</strong> Cultivated<br />
<strong>almond</strong>s: Macronutrients and Micronutrients<br />
Sylvia yada, Karen Lapsley, Guangwei Huang<br />
Guelph, Ontario, Canada, <strong>almond</strong> <strong>Board</strong> <strong>of</strong> <strong>California</strong>, Modesto Ca<br />
Journal <strong>of</strong> Food Composition and analysis, (<strong>2011</strong>), 24<br />
researCH prograM introDuCtion<br />
leadership through research<br />
thanks to a comprehensive research program established in 1973,<br />
the <strong>California</strong> <strong>almond</strong> industry is a recognized leader in agricultural<br />
productivity, environmental stewardship, <strong>almond</strong> quality, food safety and<br />
<strong>almond</strong> health-benefits research. in <strong>2011</strong>, technology transfer to <strong>almond</strong><br />
growers and users ranged from grower meetings to the conference<br />
proceedings, <strong>almond</strong> <strong>Board</strong> <strong>of</strong> <strong>California</strong> website and over 20 published<br />
papers in high-impact scientific journals.<br />
one <strong>of</strong> the key outcomes <strong>of</strong> the <strong>2011</strong> aBC <strong>Board</strong> <strong>of</strong> Directors strategic<br />
retreat is the creation <strong>of</strong> an external scientific advisory panel to provide<br />
strategic mid/long-term research, based on changing market dynamics<br />
and emerging stakeholder priorities. their first priority is to give input on<br />
future <strong>almond</strong> production research and extension needs based on the<br />
current and projected federal and state budget cuts.<br />
aBC researCH inVestMent–$35 MiLLion 1973–<strong>2011</strong><br />
<strong>almond</strong> Quality & food safety<br />
(2000–<strong>2011</strong>) 7%<br />
nutrition (1995–<strong>2011</strong>) 33%<br />
environmental (2003–<strong>2011</strong>) 6%<br />
production (1973–<strong>2011</strong>) 54%<br />
source: <strong>almond</strong> <strong>Board</strong> <strong>of</strong> <strong>California</strong>.<br />
33
proDuCtion researCH<br />
for nearly 40 years, the <strong>California</strong> <strong>almond</strong> industry has invested<br />
in research that not only has increased yield, improved quality and<br />
production efficiency, but also contributed to environmental stewardship<br />
and food safety.<br />
one example is <strong>almond</strong> <strong>Board</strong> <strong>of</strong> <strong>California</strong>-funded horticultural and<br />
irrigation research, which has been the driver for substantial increases in<br />
average yield per acre. research has led to advances in micro-irrigation<br />
and irrigation scheduling, tree nutrition, variety selection, rootstocks,<br />
planting patterns and minimal pruning practices.<br />
aBC research programs have an eye on the future. numerous<br />
investigations currently underway in diverse disciplines are aimed at<br />
increasing production efficiency, maintaining quality and minimizing<br />
environmental impact. examples include developing bio-rational<br />
pesticides, targeted sprayer application, numerous efforts to reduce<br />
the need for replant fumigation, developing a nutrient budget approach<br />
to fertilization and even better irrigation monitoring and scheduling,<br />
fungicide resistance management and disease forecasting, and harvest<br />
and stockpile best practices.<br />
aVerage yieLD per aCre Crop year 1988/89–<strong>2011</strong>/12<br />
proDuCtion researCH key areas 2010/11<br />
entomology 18%<br />
pollination 10%<br />
pathology and<br />
nematology<br />
19%<br />
aflatoxin 4%<br />
Horticulture<br />
49%<br />
source: <strong>almond</strong> <strong>Board</strong> <strong>of</strong> <strong>California</strong>. note: percentages are reflective <strong>of</strong> fy 2010/11 budget.<br />
enVironMentaL researCH<br />
eNViroNmeNTAl eXcelleNce<br />
to address the complex environmental and regulatory concerns facing <strong>almond</strong> growers, the<br />
environmental Committee (eC) funds research and education projects. Last year, roughly 50%<br />
<strong>of</strong> budget was spent on research focusing on reducing the environmental impact <strong>of</strong> <strong>almond</strong><br />
growing. in some cases the research develops data needed to inform the regulatory process.<br />
in air quality, the research focuses on soil-fumigant-emission reductions and greenhouse-gas<br />
emissions and <strong>of</strong>fsets from the orchard; water quality research focuses on reducing run<strong>of</strong>f and drift<br />
in surface water as well as understanding nutrient management better for enhanced efficiency.<br />
the remainder <strong>of</strong> the funding goes to environmental stewardship outreach, including the<br />
<strong>California</strong> <strong>almond</strong> sustainability program (see page 38), which ensures <strong>almond</strong> growers are<br />
kept abreast <strong>of</strong> changing environmental regulations and hosts the annual environmental<br />
stewardship tour. this year’s tour in May brought out regulators in air, water and pesticides who<br />
saw how <strong>almond</strong>s are grown and the efforts growers make to be good stewards <strong>of</strong> the land.<br />
enVironMentaL researCH + outreaCH key areas for 2010/11<br />
Water Quality research 22%<br />
3,000<br />
2,600<br />
air Quality 49%<br />
pounds<br />
2,500<br />
2,000<br />
1,500<br />
1,000<br />
500<br />
1,610<br />
1,700<br />
1,410<br />
1,210 1,370<br />
1,190<br />
1,190<br />
885<br />
2,170 2,400 2,220<br />
2,000<br />
1,720 1,720<br />
1,760 1,840<br />
1,960<br />
1,890<br />
1,380 1,570 1,550<br />
1,190 1,130<br />
0<br />
88/89 89/90 90/91 91/92 92/93 93/94 94/95 95/96 96/97 97/98 98/99 99/00 00/01 01/02 02/03 03/04 04/05 05/06 06/07 07/08 08/09 09/10 10/11 11/12*<br />
stewardship and<br />
Crop protection 29%<br />
34<br />
source: usDa, nass/Cfo. *estimate.<br />
source: <strong>almond</strong> <strong>Board</strong> <strong>of</strong> <strong>California</strong>. note: percentages are reflective <strong>of</strong> fy 2010/11 budget.<br />
35
aLMonD QuaLity +<br />
fooD safety<br />
investment in research and monitoring programs<br />
to ensure the safety and quality <strong>of</strong> <strong>California</strong><br />
<strong>almond</strong>s continues to be a cornerstone <strong>of</strong> what<br />
our industry is about. in <strong>2011</strong> <strong>almond</strong> quality<br />
research focused on moisture management,<br />
including effects <strong>of</strong> environmental humidity and<br />
temperature; accuracy <strong>of</strong> moisture measurement;<br />
and effects <strong>of</strong> harvesting conditions on concealed<br />
damage. results to date confirm and clearly<br />
demonstrate the negative impact <strong>of</strong> high humidity<br />
and temperature on quality. an online modeling<br />
tool will be created to assist in estimating shelf-life<br />
based on factors such as product moisture and<br />
storage environment. food safety from farm<br />
to fork remains a priority, with <strong>almond</strong> growers<br />
and handlers committed to providing a safe and<br />
wholesome product.<br />
Moisture-ManageMent-foCuseD aLMonD QuaLity researCH 2010/11<br />
moisture (%)<br />
aLMonD QuaLity + fooD safety key areas 2010/11<br />
Monitoring 15%<br />
Compliance 21%<br />
education 3%<br />
Chemistry research 8%<br />
Microbiology research 13%<br />
Quality research 40%<br />
research 61%<br />
Compliance 21%<br />
Monitoring 15%<br />
education 3%<br />
source: 2010/11 food Quality and safety Committee actual spending. note: percentages are reflective <strong>of</strong> fy 2010/11 budget.<br />
11%<br />
10% Moisture >8% or relative humidity >75%:<br />
stimulate mold/bacteria growth and texture changes; accelerate lipid oxidation, enzymatic activities, non-enzymatic browning<br />
9%<br />
8%<br />
Moisture 6–8% or relative humidity 65–75%:<br />
7% High temperatures may promote lipid oxidation, enzymatic activities and non-enzymatic browning<br />
6%<br />
5% Moisture 3–6% or relative humidity 20–65%:<br />
optimal conditions for minimum reactions<br />
4%<br />
3%<br />
Different Varieties and sizes <strong>of</strong> <strong>almond</strong>s absorb Water from environment similarly<br />
2%<br />
Moisture
sustainaBiLity prograM<br />
Documenting the thoughtfulness and the continued effort to work toward<br />
being sustainable is critical to ensuring that <strong>almond</strong>s remain a crop <strong>of</strong><br />
choice to grow in <strong>California</strong>.<br />
to both document and encourage the cycle <strong>of</strong> continuous improvement,<br />
a sustainability program based on grower self-assessments <strong>of</strong> a<br />
range <strong>of</strong> practices was initiated in 2009 with two modules (irrigation<br />
management and tree nutrition). During 2010, three additional modules<br />
(pest management, air quality and energy) were added and the number<br />
<strong>of</strong> <strong>almond</strong> operations that have participated reached nearly 200. analysis<br />
to date indicates that <strong>almond</strong> growers are generally using more thoughtful<br />
practices, but there are also areas for improvement. the focus <strong>of</strong> the<br />
coming years will be expanding grower participation and the addition <strong>of</strong><br />
several more modules.<br />
18 groWer WorksHops to Date in 2009–<strong>2011</strong><br />
198 seLf-assesseD operations<br />
(aBout 2% <strong>of</strong> groWers)<br />
The <strong>Almond</strong> Conference<br />
saVe tHe Date:<br />
the <strong>almond</strong><br />
conference 2012<br />
December 11–13, 2012<br />
sacramento<br />
Convention Center<br />
inDustry ConferenCe<br />
2012 represents the 40th anniversary <strong>of</strong> The <strong>Almond</strong> conference and we want you to celebrate with us!<br />
the <strong>almond</strong> Conference is the premier event <strong>of</strong> the year and continues to serve as the single largest gathering <strong>of</strong><br />
growers and members <strong>of</strong> <strong>California</strong>’s <strong>almond</strong> industry. in 2012 we are going bigger and better by moving to a new<br />
location. as conference attendance continues to grow, we recognize the need to secure a convention site that<br />
allows the event to grow with the industry. Moving to the sacramento Convention Center will accommodate all<br />
our needs: more meeting rooms for special symposiums, convenient hotel locations and an expanded exhibit hall.<br />
this expanded three-day event will allow growers, handlers and allied industry members more time to attend<br />
<strong>almond</strong> <strong>Board</strong> <strong>of</strong> <strong>California</strong>-funded research program updates, poster sessions and customized workshops,<br />
and to network with other industry members. attendees from all backgrounds are presented the opportunity<br />
to participate in multiple presentation tracks that cover everything from production research to regulatory and<br />
marketing hot topics. these hot-topic sessions respond to broad-based industry interests, whether it is changes<br />
to import requirements, environmental regulations or promotional initiatives to grow consumer demand.<br />
to learn more about the <strong>almond</strong> Conference, visit <strong>Almond</strong><strong>Board</strong>.com/conference and be sure<br />
to save the date and join us for the big move to sacramento, scheduled December 11–13, 2012.<br />
The <strong>Almond</strong> Conference<br />
nuMBer <strong>of</strong> eXHiBitors The <strong>Almond</strong> Conference By Category <strong>2011</strong> ConferenCe topiC areas 2006–<strong>2011</strong><br />
alternate energy solutions 2 fuel services 1 <strong>almond</strong> nutrition 3<br />
Horticulture, tree nutrition<br />
financial services 5<br />
s<strong>of</strong>tware 6<br />
economics 5<br />
and Water 17<br />
nursery 6<br />
food Quality<br />
and safety 9<br />
industry<br />
services 10<br />
Crop production<br />
inputs 33<br />
generational<br />
insights and<br />
sustainability 11<br />
38<br />
<strong>California</strong> <strong>Almond</strong> Sustainability Program Workbooks.<br />
food Quality<br />
and safety 15<br />
irrigation 15<br />
processing<br />
equipment 22<br />
orchard equipment 19<br />
source: <strong>almond</strong> <strong>Board</strong> <strong>of</strong> <strong>California</strong> Conference registration.<br />
global, technical<br />
and regulatory<br />
affairs 11<br />
replant, Disease and<br />
pest Management 11<br />
Marketing 15<br />
pollination and Harvest 12<br />
source: <strong>almond</strong> <strong>Board</strong> <strong>of</strong> <strong>California</strong>.<br />
39
40<br />
inDustry reLations<br />
the <strong>California</strong> <strong>almond</strong> industry is diverse. growers and handlers range<br />
in acreage, size and use <strong>of</strong> technology. this diversity fuels the need<br />
for different forms <strong>of</strong> communication according to how growers and<br />
handlers prefer to receive information about the industry. the <strong>almond</strong><br />
<strong>Board</strong> <strong>of</strong> <strong>California</strong>’s industry relations (ir) program remains committed<br />
to providing growers, handlers and other industry stakeholders with the<br />
most recent tools, information, research and resources to assist them<br />
with the management <strong>of</strong> the many challenges the <strong>California</strong> <strong>almond</strong><br />
industry encounters, including those challenges <strong>of</strong> local and global<br />
communities. aBC resources include traditional printed publications, like<br />
the <strong>California</strong> <strong>Almond</strong> Outlook and articles in agricultural publications, as<br />
well as the use <strong>of</strong> electronic media, such as twitter, enewsletters and<br />
the aBC website. the ir program publishes various manuals and quickstart<br />
guides that assist growers and handlers with their daily operations.<br />
in addition, the program provides education, leadership and training<br />
opportunities through a variety <strong>of</strong> programs and internships.<br />
DiVersity <strong>of</strong> aCres farMeD 2010<br />
250+ acres 19%<br />
100–249 acres<br />
18%<br />
50–99 acres 18%<br />
1–24 acres 30%<br />
25–49 acres 15%<br />
source: published in grower survey results 2010.<br />
The Good Agricultural Practices<br />
Quick-Start Guide.<br />
<strong>California</strong> <strong>Almond</strong> Outlook.<br />
The <strong>Almond</strong> Industry Leadership Program trains future <strong>almond</strong> generations.<br />
“The ABC Leadership Program gave me a chance to step<br />
out <strong>of</strong> my sphere <strong>of</strong> influence and be exposed to new<br />
experiences and relationships in our industry. From local<br />
grower to international issues, the program has opened my<br />
eyes to how interconnected we are in the <strong>almond</strong> industry<br />
today. I highly recommend it for anyone with a taste for<br />
learning, a passion for <strong>California</strong> <strong>Almond</strong>s and a willingness<br />
to expand one’s horizons.”<br />
tera Mcgowan, Leadership program participant, <strong>2011</strong><br />
uC farM aDVisors<br />
BUTTe coUNTY<br />
Joe Connell, uCCe <strong>of</strong>fice<br />
2279 Del oro ave., suite B<br />
oroville, Ca 95965<br />
530.538.7201<br />
fax: 530.538.7140<br />
jhconnell@ucdavis.edu<br />
colUsA/sUTTer/YUBA<br />
coUNTies<br />
franz niederholzer,<br />
uCCe <strong>of</strong>fice<br />
142-a garden Hwy.<br />
yuba City, Ca 95991<br />
530.822.7515<br />
fax: 530.673.5368<br />
fjniederholzer@ucdavis.edu<br />
Colusa County<br />
p.o. Box 180<br />
100 sunrise Blvd., suite e<br />
Colusa, Ca 95932<br />
530.458.0570<br />
fax: 530.458.4625<br />
fresNo coUNTY<br />
Jeanette sutherlin, uCCe <strong>of</strong>fice<br />
1720 south Maple ave.<br />
fresno, Ca 93702<br />
559.456.7285<br />
fax: 559.456.7575<br />
jmsutherlin@ucdavis.edu<br />
GleNN coUNTY<br />
Bill krueger, uCCe <strong>of</strong>fice<br />
p.o. Box 697<br />
821 e. south st.<br />
orland, Ca 95963<br />
530.865.1107<br />
fax: 530.865.1109<br />
whkrueger@ucdavis.edu<br />
KerN coUNTY<br />
Darlene Liesch, uCCe <strong>of</strong>fice<br />
1031 s. Mt. Vernon ave.<br />
Bakersfield, Ca 93307<br />
661.868.6200<br />
fax: 661.868.6208<br />
dgliesch@ucdavis.edu<br />
KiNGs coUNTY<br />
Bob Beede, uCCe <strong>of</strong>fice<br />
680 n. Campus Dr., suite a<br />
Hanford, Ca 93230<br />
559.582.3211, ext. 2737<br />
fax: 559.582.5166<br />
bbeede@ucdavis.edu<br />
mADerA coUNTY<br />
Brent Holtz, uCCe <strong>of</strong>fice<br />
328 Madera ave.<br />
Madera, Ca 93637<br />
559.675.7879, ext. 209<br />
fax: 559.675.0639<br />
baholtz@ucdavis.edu<br />
merceD coUNTY<br />
David Doll, uCCe <strong>of</strong>fice<br />
2145 Wardrobe ave.<br />
Merced, Ca 95341<br />
209.385.7403<br />
fax: 209.722.8856<br />
dadoll@ucdavis.edu<br />
sAN JoAqUiN coUNTY<br />
paul Verdegaal, uCCe <strong>of</strong>fice<br />
2101 e. earhart ave., suite 200<br />
stockton, Ca 95206<br />
209.953.6100<br />
fax: 209.953.6128<br />
psverdegaal@ucdavis.edu<br />
solANo/Yolo coUNTies<br />
Carolyn DeBuse, uCCe <strong>of</strong>fice<br />
501 texas st.<br />
fairfield, Ca 94533<br />
707.784.1320<br />
fax: 707.429.5532<br />
cjdebuse@ucdavis.edu<br />
sTANislAUs coUNTY<br />
roger Duncan, uCCe <strong>of</strong>fice<br />
3800 Cornucopia Way, suite a<br />
Modesto, Ca 95358<br />
209.525.6800<br />
fax: 209.525.6840<br />
raduncan@ucdavis.edu<br />
TeHAmA/sHAsTA<br />
coUNTies<br />
rick Buchner, uCCe <strong>of</strong>fice<br />
1754 Walnut st.<br />
red Bluff, Ca 96080<br />
530.527.3101<br />
fax: 530.527.0917<br />
rpbuchner@ucdavis.edu<br />
TUlAre coUNTY<br />
elizabeth J. fichtner,<br />
uCCe <strong>of</strong>fice<br />
4437 s. Laspina st., suite B<br />
tulare, Ca 93274<br />
559.684.3310<br />
fax: 559.685.3319<br />
ejfichtner@ucdavis.edu<br />
41