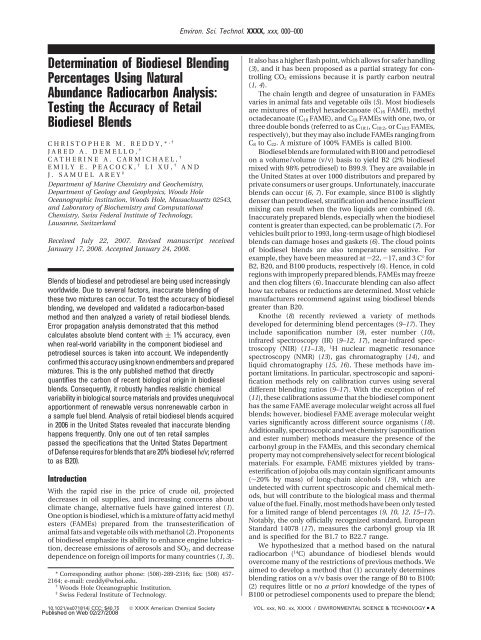
Determination of Biodiesel Blending Percentages Using Natural ...
Determination of Biodiesel Blending Percentages Using Natural ...
Determination of Biodiesel Blending Percentages Using Natural ...

You also want an ePaper? Increase the reach of your titles
YUMPU automatically turns print PDFs into web optimized ePapers that Google loves.
Environ. Sci. Technol. XXXX, xxx, 000–000<br />
<strong>Determination</strong> <strong>of</strong> <strong>Biodiesel</strong> <strong>Blending</strong><br />
<strong>Percentages</strong> <strong>Using</strong> <strong>Natural</strong><br />
Abundance Radiocarbon Analysis:<br />
Testing the Accuracy <strong>of</strong> Retail<br />
<strong>Biodiesel</strong> Blends<br />
CHRISTOPHER M. REDDY,* ,†<br />
JARED A. DEMELLO, †<br />
CATHERINE A. CARMICHAEL, †<br />
EMILY E. PEACOCK, † LI XU, † AND<br />
J. SAMUEL AREY ‡<br />
Department <strong>of</strong> Marine Chemistry and Geochemistry,<br />
Department <strong>of</strong> Geology and Geophysics, Woods Hole<br />
Oceanographic Institution, Woods Hole, Massachusetts 02543,<br />
and Laboratory <strong>of</strong> Biochemistry and Computational<br />
Chemistry, Swiss Federal Institute <strong>of</strong> Technology,<br />
Lausanne, Switzerland<br />
Received July 22, 2007. Revised manuscript received<br />
January 17, 2008. Accepted January 24, 2008.<br />
Blends <strong>of</strong> biodiesel and petrodiesel are being used increasingly<br />
worldwide. Due to several factors, inaccurate blending <strong>of</strong><br />
these two mixtures can occur. To test the accuracy <strong>of</strong> biodiesel<br />
blending, we developed and validated a radiocarbon-based<br />
method and then analyzed a variety <strong>of</strong> retail biodiesel blends.<br />
Error propagation analysis demonstrated that this method<br />
calculates absolute blend content with ( 1% accuracy, even<br />
when real-world variability in the component biodiesel and<br />
petrodiesel sources is taken into account. We independently<br />
confirmed this accuracy using known endmembers and prepared<br />
mixtures. This is the only published method that directly<br />
quantifies the carbon <strong>of</strong> recent biological origin in biodiesel<br />
blends. Consequently, it robustly handles realistic chemical<br />
variability in biological source materials and provides unequivocal<br />
apportionment <strong>of</strong> renewable versus nonrenewable carbon in<br />
a sample fuel blend. Analysis <strong>of</strong> retail biodiesel blends acquired<br />
in 2006 in the United States revealed that inaccurate blending<br />
happens frequently. Only one out <strong>of</strong> ten retail samples<br />
passed the specifications that the United States Department<br />
<strong>of</strong> Defense requires for blends that are 20% biodiesel (v/v; referred<br />
to as B20).<br />
Introduction<br />
With the rapid rise in the price <strong>of</strong> crude oil, projected<br />
decreases in oil supplies, and increasing concerns about<br />
climate change, alternative fuels have gained interest (1).<br />
One option is biodiesel, which is a mixture <strong>of</strong> fatty acid methyl<br />
esters (FAMEs) prepared from the transesterification <strong>of</strong><br />
animal fats and vegetable oils with methanol (2). Proponents<br />
<strong>of</strong> biodiesel emphasize its ability to enhance engine lubrication,<br />
decrease emissions <strong>of</strong> aerosols and SO 2, and decrease<br />
dependence on foreign oil imports for many countries (1, 3).<br />
* Corresponding author phone: (508)-289-2316; fax: (508) 457-<br />
2164; e-mail: creddy@whoi.edu.<br />
† Woods Hole Oceanographic Institution.<br />
‡ Swiss Federal Institute <strong>of</strong> Technology.<br />
It also has a higher flash point, which allows for safer handling<br />
(3), and it has been proposed as a partial strategy for controlling<br />
CO 2 emissions because it is partly carbon neutral<br />
(1, 4).<br />
The chain length and degree <strong>of</strong> unsaturation in FAMEs<br />
varies in animal fats and vegetable oils (5). Most biodiesels<br />
are mixtures <strong>of</strong> methyl hexadecanoate (C 16 FAME), methyl<br />
octadecanoate (C 18 FAME), and C 18 FAMEs with one, two, or<br />
three double bonds (referred to as C 18:1 ,C 18:2 ,orC 18:3 FAMEs,<br />
respectively), but they may also include FAMEs ranging from<br />
C 8 to C 22 . A mixture <strong>of</strong> 100% FAMEs is called B100.<br />
<strong>Biodiesel</strong> blends are formulated with B100 and petrodiesel<br />
on a volume/volume (v/v) basis to yield B2 (2% biodiesel<br />
mixed with 98% petrodiesel) to B99.9. They are available in<br />
the United States at over 1000 distributors and prepared by<br />
private consumers or user groups. Unfortunately, inaccurate<br />
blends can occur (6, 7). For example, since B100 is slightly<br />
denser than petrodiesel, stratification and hence insufficient<br />
mixing can result when the two liquids are combined (6).<br />
Inaccurately prepared blends, especially when the biodiesel<br />
content is greater than expected, can be problematic (7). For<br />
vehicles built prior to 1993, long-term usage <strong>of</strong> high biodiesel<br />
blends can damage hoses and gaskets (6). The cloud points<br />
<strong>of</strong> biodiesel blends are also temperature sensitive. For<br />
example, they have been measured at -22, -17, and 3 C° for<br />
B2, B20, and B100 products, respectively (6). Hence, in cold<br />
regions with improperly prepared blends, FAMEs may freeze<br />
and then clog filters (6). Inaccurate blending can also affect<br />
how tax rebates or reductions are determined. Most vehicle<br />
manufacturers recommend against using biodiesel blends<br />
greater than B20.<br />
Knothe (8) recently reviewed a variety <strong>of</strong> methods<br />
developed for determining blend percentages (9–17). They<br />
include saponification number (9), ester number (10),<br />
infrared spectroscopy (IR) (9–12, 17), near-infrared spectroscopy<br />
(NIR) (11–13), 1<br />
H nuclear magnetic resonance<br />
spectroscopy (NMR) (13), gas chromatography (14), and<br />
liquid chromatography (15, 16). These methods have important<br />
limitations. In particular, spectroscopic and saponification<br />
methods rely on calibration curves using several<br />
different blending ratios (9–17). With the exception <strong>of</strong> ref<br />
(11), these calibrations assume that the biodiesel component<br />
has the same FAME average molecular weight across all fuel<br />
blends; however, biodiesel FAME average molecular weight<br />
varies significantly across different source organisms (18).<br />
Additionally, spectroscopic and wet chemistry (saponification<br />
and ester number) methods measure the presence <strong>of</strong> the<br />
carbonyl group in the FAMEs, and this secondary chemical<br />
property may not comprehensively select for recent biological<br />
materials. For example, FAME mixtures yielded by transesterification<br />
<strong>of</strong> jojoba oils may contain significant amounts<br />
(∼20% by mass) <strong>of</strong> long-chain alcohols (19), which are<br />
undetected with current spectroscopic and chemical methods,<br />
but will contribute to the biological mass and thermal<br />
value <strong>of</strong> the fuel. Finally, most methods have been only tested<br />
for a limited range <strong>of</strong> blend percentages (9, 10, 12, 15–17).<br />
Notably, the only <strong>of</strong>ficially recognized standard, European<br />
Standard 14078 (17), measures the carbonyl group via IR<br />
and is specified for the B1.7 to B22.7 range.<br />
We hypothesized that a method based on the natural<br />
radiocarbon ( 14 C) abundance <strong>of</strong> biodiesel blends would<br />
overcome many <strong>of</strong> the restrictions <strong>of</strong> previous methods. We<br />
aimed to develop a method that (1) accurately determines<br />
blending ratios on a v/v basis over the range <strong>of</strong> B0 to B100;<br />
(2) requires little or no a priori knowledge <strong>of</strong> the types <strong>of</strong><br />
B100 or petrodiesel components used to prepare the blend;<br />
10.1021/es071814j CCC: $40.75 © XXXX American Chemical Society VOL. xxx, NO. xx, XXXX / ENVIRONMENTAL SCIENCE & TECHNOLOGY 9 A<br />
Published on Web 02/27/2008
and therefore (3) does not require mixture calibration curves.<br />
Radiocarbon is produced in the atmosphere by collisions<br />
between cosmic-ray neutrons and 14 N, after which it is quickly<br />
oxidized to CO 2 (20). Plants take up the 14 CO 2 for photosynthesis,<br />
and consequently they reflect “modern” levels <strong>of</strong><br />
14<br />
C(20, 21). Once assimilation <strong>of</strong> 14 C ceases, levels <strong>of</strong> 14 C<br />
decrease through radioactive decay with a half-life <strong>of</strong> 5730<br />
years. The remaining 14 C can be detected in materials as old<br />
as ∼50,000 years. Hence, petroleum, which forms over<br />
millions <strong>of</strong> years, contains no detectable 14 C. Therefore, 14 C<br />
is an ideal tracer for tracing the biological component <strong>of</strong><br />
biodiesel in blends because all recent natural products are<br />
effectively prelabeled with 14 C. Measurement <strong>of</strong> 14 C is available<br />
at numerous laboratories, and blend percentages can<br />
then be determined via mass balance calculations.<br />
Here, we describe a 14 C-based method to determine<br />
biodiesel blend percentages. To develop the method, we<br />
measured the 14 C content <strong>of</strong> several materials: fats and oils<br />
<strong>of</strong>ten used to produce B100, several different B100s, pure<br />
petrodiesels, and prepared biodiesel blends with known<br />
mixture ratios. After carefully validating the method, we<br />
evaluated more than 20 biodiesel blends purchased from<br />
retailers around the United States.<br />
Materials and Methods<br />
Obtaining and Preparing the Fuel Mixtures Used in This<br />
Experiment. We obtained biodiesel blends, as well as fats,<br />
oils, and other samples from around the United States mainly<br />
during the spring and summer <strong>of</strong> 2006. The locations and<br />
times <strong>of</strong> collection are listed in Table 1. From two biodiesel<br />
distributors, we collected numerous samples over several<br />
months in order to gauge the variability <strong>of</strong> their products.<br />
Based on discussions with the retailers, most were independent<br />
companies that prepared modest volumes <strong>of</strong><br />
biodiesel blends on-site.<br />
Stable Carbon and Radiocarbon Analysis. Stable carbon<br />
and 14 C analysis <strong>of</strong> organic carbon is described in detail in<br />
ref (22). Briefly, each sample was quantitatively converted<br />
from organic carbon into CO 2 and then graphite. On a small<br />
fraction <strong>of</strong> the CO 2 , the stable carbon isotope ratios (δ 13 C)<br />
were determined via isotope ratio mass spectrometry. The<br />
14<br />
C content <strong>of</strong> the graphite was measured by accelerator mass<br />
spectrometry (AMS) at the National Ocean Sciences Accelerator<br />
Mass Spectrometry (NOSAMS) facility in Woods<br />
Hole, MA (22). In this study, all 14 C measurements are<br />
normalized to δ 13 C values <strong>of</strong> -25‰ and expressed with the<br />
∆ 14 C nomenclature, which is the per mille (‰) deviation<br />
from the international 14 C standard, National Institute <strong>of</strong><br />
Technology (NIST) Standard Reference Material 4990B<br />
“Oxalic Acid I”. The latter was isolated from a crop <strong>of</strong> sugar<br />
beet grown in 1955 (23). (See also Supporting Information<br />
Figure S1).<br />
The uncertainty <strong>of</strong> the measured 14 C value <strong>of</strong> each sample<br />
was important for evaluating the precision <strong>of</strong> subsequent<br />
calculations. For example, one biodiesel blend was analyzed<br />
twice over a several month period and the values were within<br />
1‰ <strong>of</strong> each other (Table 1). In general, measurement<br />
precision varies with respect to 14 C content. To assign an<br />
uncertainty for any given 14 C value, we relied on the analysis<br />
<strong>of</strong> standards over the past two years at the NOSAMS facility.<br />
For example, standards that have values near -950 and 0‰<br />
have uncertainties that are approximately 1 and 4‰,<br />
respectively.<br />
<strong>Determination</strong> <strong>of</strong> v/v <strong>Biodiesel</strong> Blend <strong>Percentages</strong> Based<br />
on the Measured ∆ 14 C. We determined that the v/v blend<br />
percentage <strong>of</strong> biodiesel in a realistic fuel mixture could be<br />
estimated based on its 14 C content, as follows. First, we<br />
apportioned the carbon <strong>of</strong> the fuel blend with respect to the<br />
modern (biological) component and fossil (petrodiesel)<br />
component using ∆ 14 C mass balance:<br />
∆ 14 C mixture ) F C,bio ∆ 14 C bio + (1 - F C,bio )∆ 14 C petro (1)<br />
where ∆ 14 C mixture is the measured 14 C content <strong>of</strong> the biodiesel<br />
blend via AMS. We assigned ∆ 14 C bio as the average measured<br />
value <strong>of</strong> several retail fat and oil sources used in biodiesel<br />
preparations (62 ( 7‰; Table 1), and we confirmed that this<br />
was consistent with modern corn ∆ 14 C levels in North America<br />
(an average range <strong>of</strong> 55 to 66‰, collected in 2004) (24). The<br />
∆ 14 C petro was fixed at a value –1000‰, consistent with<br />
measurements <strong>of</strong> petroleum endmembers (Table 1). Finally,<br />
F C,bio is the mass fraction <strong>of</strong> the total mixture carbon that is<br />
derived from biological components.<br />
Rearranging eq 1, F C,bio can be expressed as<br />
F C,bio ) ∆14 C mixture - ∆ 14 C petro<br />
∆ 14 C bio - ∆ 14 C petro<br />
(2)<br />
Equation 2 shows that the proportion <strong>of</strong> biological carbon<br />
in the sample fuel blend (F C,bio ) can be easily determined<br />
based on the measured ∆ 14 C mixture <strong>of</strong> the sample and the a<br />
priori known ∆ 14 C bio and ∆ 14 C petro values <strong>of</strong> the endmember<br />
materials. We assumed that ∆ 14 C petro (-1000‰) and ∆ 14 C bio<br />
(62 ( 7‰) represent reasonably constant endmembers, such<br />
that variation in F C,bio is fully explained by the measured<br />
∆ 14 C mixture value. (As explained in the subsequent section, we<br />
also assessed the uncertainty propagating from this assumption.)<br />
Notably, in current B100 production practice in the<br />
United States and Europe, the transesterification step from<br />
fats to FAMEs utilizes fossil methanol. For example, for a C 18<br />
FAME, 18/19 <strong>of</strong> the carbon (fatty chain) is from fats and oils<br />
and the other 1/19 (methyl carbon) is petroleum-derived;<br />
this was corroborated by numerous 14 C analyses <strong>of</strong> industrial<br />
methanol (see Results and Discussion for more detail). In<br />
order to relate F C,bio more precisely to the B100 endmember,<br />
we defined<br />
F C,bio<br />
F C,B100 )<br />
(3)<br />
R C,bio/B100<br />
where F C,B100 is the mass fraction <strong>of</strong> B100 carbon in the<br />
biodiesel blend, and R C,bio/B100 is the ratio <strong>of</strong> biological carbon<br />
to total carbon in the pure component B100. We parameterized<br />
R C,bio/B100 based on the compositions <strong>of</strong> different FAMEs<br />
sources that were measured in our laboratory and found in<br />
the literature (Table 2).<br />
The blend percentage (v/v) <strong>of</strong> B100 (B*) in a fuel blend<br />
may be calculated as<br />
V B100<br />
B * ) 100<br />
(4)<br />
V B100 + V petro<br />
where V B100 and V petro are the extensive volumes <strong>of</strong> the<br />
biological and petroleum-based components, respectively,<br />
in a control volume <strong>of</strong> fuel blend. The individual component<br />
volumes can be expressed as<br />
V x ) m C,x + m H,x + m O,x<br />
F x<br />
) m C,x<br />
F x<br />
( 1 + m H,x<br />
+ m O,x<br />
m C,x m C,x)<br />
(5a)<br />
(5b)<br />
where m C,x, m H,x, and m O,x are the total masses <strong>of</strong> carbon,<br />
hydrogen, and oxygen, respectively, for component x in the<br />
blend control volume, and F x is the density <strong>of</strong> component x.<br />
For notation simplicity, we defined<br />
θ C,B100 )<br />
( 1 + m H,B100<br />
m C,B100<br />
+ m O,B100<br />
m C,B100)<br />
(6)<br />
B 9 ENVIRONMENTAL SCIENCE & TECHNOLOGY / VOL. xxx, NO. xx, XXXX
θ C,petro )<br />
( 1 + m H,petro<br />
m C,petro)<br />
(7)<br />
where θ C,B100 and θ C,petro characterize the mass abundances<br />
<strong>of</strong> hydrogen and oxygen relative to carbon in the biological<br />
and petroleum-based components, respectively. Combining<br />
eqs 4–7 and rearranging, the calculated v/v blend percentage<br />
<strong>of</strong> a biodiesel, B*, can be rewritten as<br />
B * )<br />
100<br />
1 + F (8)<br />
B100 θ C,petro m C,petro<br />
F petro θ C,B100 m C,B100<br />
Recognizing that m C,petro /m C,B100 ) (R C,bio/B100 /F C,bio - 1), eq<br />
8 can be expressed as<br />
B * )<br />
100<br />
1 + F B100<br />
F petro<br />
θ C,petro<br />
θ C,B100( R C,bio/B100<br />
F C,bio<br />
- 1)<br />
where F B100 , F petro , θ C,B100 , θ C,petro , and R C,bio/B100 are properties<br />
<strong>of</strong> the two pure component liquids (B100 and petrodiesel),<br />
and thus F C,bio controls the calculated blend content, B*. We<br />
parameterized F B100 , F petro , θ C,B100 , θ C,petro , and R C,bio/B100 using<br />
the averaged values that we calculated from a data compilation<br />
<strong>of</strong> retail B100 and petrodiesel products, based on<br />
literature surveys and our own laboratory measurements<br />
(Table 2). Hence eq 9 does not require calibration to a<br />
designated normative fuel blend; rather, it is parameterized<br />
with pure-component properties that are relatively stable<br />
for a wide range <strong>of</strong> source materials. We therefore hypothesized<br />
that eq 9 could accurately estimate the biodiesel<br />
content <strong>of</strong> any realistic fuel blend based simply on the<br />
measured F C,bio value (eq 2).<br />
Uncertainty Analyses <strong>of</strong> Estimated v/v <strong>Biodiesel</strong> Percentage<br />
<strong>of</strong> Retail Blends. We evaluated the accuracy <strong>of</strong> eq<br />
9 for realistic commercial blends using two types <strong>of</strong> tests,<br />
assuming that the only information available is a single<br />
∆ 14 C mixture measurement <strong>of</strong> an unknown fuel blend. First, we<br />
tested the predictive accuracy <strong>of</strong> eq 9 for several mixtures in<br />
each <strong>of</strong> the following categories: (1) pure retail petrodiesel;<br />
(2) retail B99.9s and B100s; and (3) biodiesel blends <strong>of</strong> B2.00,<br />
B4.97, B20.0, and B69.8, which we prepared ourselves by<br />
mixing B100 with petrodiesel (Table 1). Second, we conducted<br />
an error propagation analysis based on our data compilation<br />
<strong>of</strong> endmember properties and detailed knowledge <strong>of</strong> the ∆ 14 C<br />
measurement error. We characterized the real-world variabilities<br />
and uncertainties <strong>of</strong> all <strong>of</strong> the parameters used in<br />
eqs 2 and 9 (Table 2). For example, we assumed that the<br />
biodiesel source material may easily range from a low<br />
molecular weight mixture (coconut, average molecular weight<br />
corresponding to ∼C 13 FAME) to a high molecular weight<br />
mixture (industrial rapeseed, average molecular weight <strong>of</strong><br />
∼C 20 FAME). Then we calculated the first-order Taylor<br />
expansions <strong>of</strong> parameter perturbations for eqs 2 and 9, which<br />
allowed us to estimate the accumulated error <strong>of</strong> the calculated<br />
B* that propagates from the input parameter uncertainties<br />
and variabilities (35). Ideally, we expected to find consistency<br />
between the predictive capability trial results (test 1) and the<br />
error propagation analysis results (test 2) <strong>of</strong> eq 9.<br />
Results and Discussion<br />
The 5730-yr half-life <strong>of</strong> 14 C makes it ideal for identifying the<br />
biological carbon (modern levels <strong>of</strong> 14 C) in fats, biodiesel,<br />
and biodiesel blends relative to fossil carbon in petrodiesel.<br />
Shown in Table 1 are the results from the isotopic analyses<br />
<strong>of</strong> samples in this study. Briefly, we observed ∆ 14 C values<br />
that spanned from -1000 to +73‰, thereby encompassing<br />
a complete range in fossil and modern carbon end points,<br />
(9)<br />
respectively. Refer to the Supporting Information (Table S1<br />
and Figure S2) regarding the δ 13 C values <strong>of</strong> each sample.<br />
Conversion <strong>of</strong> Fats and Oils to FAMEs. Animal fats and<br />
vegetable oils, the main source <strong>of</strong> biodiesel, had ∆ 14 C values<br />
that were 62‰ ( 7‰ (Table 1). This is consistent with the<br />
average range (55-66‰) <strong>of</strong> ∆ 14 C values <strong>of</strong> CO 2 across the<br />
North American atmosphere in 2004 as recorded by corn<br />
(24) (see also Supporting Information Figure S1). Thus, the<br />
fats and oils analyzed in this study were derived from very<br />
recent biological materials.<br />
A dramatic shift in ∆ 14 C values was observed in the fats<br />
and oils to the FAMEs in B99.9 and B100—a result <strong>of</strong> the<br />
transesterification step with fossil methanol. This is consistent<br />
with studies in our laboratory, where we find that industrial<br />
methanol is consistently 14 C free. (Also refer to Supporting<br />
Information Figure S3.) Hence, most <strong>of</strong> the carbon in a typical<br />
biodiesel (e.g., 18/19 for C 18 FAME) is from fats and oils<br />
(+62‰), whereas a small fraction (1/19) is actually petroleumderived<br />
(-1000‰). Based on the relative abundances <strong>of</strong><br />
FAMEs in the analysis <strong>of</strong> fats from different oils that we have<br />
measured and found in the literature (Table 2), a typical<br />
B100 should have ∆ 14 C values ∼3‰. This estimate is<br />
consistent with observed values for four B100s (-3 ( 20‰;<br />
Table 1). Note that the observed variability in the retail B100<br />
∆ 14 C values ((20‰) is significantly higher than would be<br />
expected based simply on measurement errors ((4‰) or<br />
variability <strong>of</strong> either endmember ((7‰ for fats; ( 1‰ for<br />
petrodiesel). The observed ∆ 14 C variability in the B100<br />
samples may result from residual petrodiesel (or fossil<br />
components) in the tanks that were used to prepare the<br />
blends, the location <strong>of</strong> the FAMEs’ agricultural source, or the<br />
presence <strong>of</strong> excess methanol. The presence <strong>of</strong> residual<br />
petrodiesel or methanol would lower the ∆ 14 C value <strong>of</strong> the<br />
B100. Methanol content in B100 is indirectly measured in<br />
the United States with the American Society for Testing and<br />
Materials Standards (ASTM) D6751-07A biodiesel method<br />
via the sample’s flash point (36). ASTM specifications require<br />
a minimum value <strong>of</strong> 130.0 °C, which roughly corresponds to<br />
a maximum limit <strong>of</strong> 0.1% methanol. <strong>Using</strong> data from ref (24),<br />
and based on the 14 C analysis <strong>of</strong> corn in 2004, the geographic<br />
variability <strong>of</strong> ∆ 14 C is likely (10‰ in FAMEs from North<br />
America, although urban locations may be more depleted<br />
(∼20‰) due to local fossil emissions. However, urban regions<br />
host little farming, so they should rarely contribute bias to<br />
the ∆ 14 C value <strong>of</strong> FAMEs in biodiesels. With these available<br />
factors, consider the B100 from Indiana, which had the lowest<br />
∆ 14 C value, -31.2‰ (Table 1). If this sample was within the<br />
ASTM specifications, then the ∆ 14 C deviation from the B100<br />
average (+3‰) could not be explained by either excess<br />
methanol or agricultural location. It is more likely that this<br />
sample was contaminated by residual petroleum. Noting that<br />
other retailers may unintentionally combine their B100 with<br />
small amounts <strong>of</strong> residual petroleum, we chose to include<br />
the Indiana B100 sample when evaluating the realistic<br />
accuracy <strong>of</strong> our method.<br />
<strong>Using</strong> 14 C to Determine <strong>Biodiesel</strong> Blend Percentage. We<br />
found that eq 9 could appraise the v/v biodiesel percentage<br />
<strong>of</strong> fuel blends using only 14 C content as a measurement input<br />
and assuming no specific knowledge about the particular<br />
endmember liquids used to blend the sample (Table 1). We<br />
parameterized eq 9 using simple averages <strong>of</strong> F B100, F petro, θ C,B100,<br />
θ C,petro , and R C,bio/B100 property values from a broad range <strong>of</strong><br />
retail petrodiesels and B100s (Table 2). Employing these input<br />
parameters, eq 9 simplified to<br />
B * )<br />
100<br />
0.869<br />
F C,bio<br />
+ 0.0813<br />
(10)<br />
where the lumped parameters, 0.869 and 0.0813, are dimensionless.<br />
For clarity, we used the notation “B*” to indicate<br />
VOL. xxx, NO. xx, XXXX / ENVIRONMENTAL SCIENCE & TECHNOLOGY 9 C
TABLE 1. Radiocarbon (∆ 14 C) Content and B* (from 10) <strong>of</strong> Samples Analyzed in This Study (All Samples Acquired in<br />
2006 unless Noted Otherwise)<br />
sample source<br />
month<br />
acquired<br />
∆ 14 C (‰)<br />
biodiesel<br />
(v/v)<br />
calculated B*<br />
(v/v)<br />
Fat Source endmembers<br />
used vegetable oil (N. Carolina restaurant) April 59.1 NA a NA a<br />
new fry oil (Massachusetts restaurant A) May 54.6 NA NA<br />
used fry oil (Massachusetts restaurant A) May 73.5 NA NA<br />
bacon grease (Massachusetts restaurant B) June 58.8 NA NA<br />
new Crisco soybean (store bought) Sept 62.2 NA NA<br />
Petrodiesel endmembers<br />
Bouchard 65 barge b Oct 1974 b -999.9 0 c 0.01 ( 0.02<br />
Massachusetts distributor A Nov -1000 0 d 0.00 ( 0.02<br />
removed from truck driving petrodiesel only March 2007 -999.5 0 c 0.05 ( 0.02<br />
Commercial B99.9s and B100s<br />
California distributor A June -10.1 99.9 d 98.6 ( 0.9<br />
Massachusetts distributor A Nov -1.71 99.9 d 99.4 ( 0.9<br />
California distributor B July 8.29 99.9 d 100 ( 0.9<br />
California distributor B July 10.3 99.9 d 101 ( 0.9<br />
California distributor B August 11.6 99.9 d 101 ( 0.9<br />
Indiana distributor A April -31.2 100 d 96.7 ( 0.9<br />
Massachusetts distributor A June 9.88 100 d 100 ( 0.9<br />
Massachusetts distributor A Sept -4.92 100 d 99.1 ( 0.9<br />
California distributor C June 15.3 100 d 101 ( 0.9<br />
Blends we prepared by mixing Bouchard 65 with Massachusetts distributor A B100; June (see above)<br />
known laboratory mix NA -983 2.00 e 1.9 ( 0.2<br />
known laboratory mix NA -956 4.97 e 4.8 ( 0.2<br />
known laboratory mix NA -818 20.0 e 19.4 ( 0.6<br />
known laboratory mix NA -331 69.8 e 68.5 ( 1<br />
Commercial biodiesel blends ranging from B2 to B20<br />
Minnesota distributor A June -979 2 d 2.3 ( 0.2<br />
Minnesota distributor B June -980 2 d 2.2 ( 0.2<br />
Minnesota distributor C June -981 2 d 2.0 ( 0.2<br />
Minnesota distributor D June -976 2 d 2.6 ( 0.2<br />
Indiana distributor A April -954 5 d 4.9 ( 0.2<br />
North Carolina April -953 5 d 5.1 ( 0.2<br />
Massachusetts distributor B June -968 5 d 3.5 ( 0.2<br />
Indiana distributor B April -869 15 d 14.0 ( 0.5<br />
Massachusetts distributor A May -855 20 d 15.5 ( 0.6<br />
Massachusetts distributor A June -901 20 d 10.7 ( 0.4<br />
Massachusetts distributor A Sept -269 20 d 74.4 ( 1<br />
Massachusetts distributor A Nov -904 20 d 10.4 ( 0.4<br />
Massachusetts distributor B June -840 20 d 17.2 ( 0.6<br />
Massachusetts distributor C April -843 20 d 16.8 ( 0.6<br />
Massachusetts distributor C June -795 20 d 21.8 ( 0.7<br />
Massachusetts distributor C Sept -796 20 d 21.8 ( 0.7<br />
Massachusetts distributor C Nov -810 20 d 20.3 ( 0.7<br />
Tennessee (replicate i) May -852 20 d 15.8 ( 0.6<br />
Tennessee (replicate ii) May -851 20 d 15.9 ( 0.6<br />
Postretail “Personal user” blends<br />
Massachusetts personal A self-mixed from retail<br />
endmembers <strong>of</strong> petrodiesel and B100<br />
May -900 20 c 10.7 ( 0.4<br />
Massachusetts personal B self-mixed from retail<br />
endmembers <strong>of</strong> petrodiesel and B100<br />
May -424 70 c 59.5 ( 1<br />
Massachusetts personal A supply (stored in owners<br />
supply jug and purchased from a retailer)<br />
May -3.43 100 c 99.3 ( 0.9<br />
Massachusetts personal B (collected from tank <strong>of</strong><br />
vehicle and purchased from a retailer)<br />
March 2007 -862 20 c 14.8 ( 0.5<br />
a Not applicable. b This oil was collected from a hold in the barge Bouchard 65 after it spilled product in Buzzards Bay,<br />
MA in October 1974. c Expected biodiesel content. d Advertised biodiesel content. e Known biodiesel percentage based on<br />
laboratory preparations.<br />
calculated blend content, whereas the prefix “B” indicates<br />
expected or advertised blend content from retailers or<br />
personal stocks. We tested the predictive capability <strong>of</strong> eq 10<br />
against 3 petrodiesel products, 4 retail B100s, 5 retail B99.9s,<br />
and our own preparations <strong>of</strong> B2.00, B4.97, B20.0, and B69.8.<br />
For these 16 samples, eq 10 exhibited a root-mean-squarederror<br />
(rmse) <strong>of</strong> 1.05% in the calculated blend percentage <strong>of</strong><br />
the biodiesel (Figure 1a; Table 1). We chose these 16 samples<br />
because they represented the full range <strong>of</strong> endmembers and<br />
known prepared mixtures. Again, no prepared mixtures were<br />
used to calibrate the method; rather, they were used to<br />
validate it. Hence, the method parameterization and method<br />
validation were completely independent. This differs from<br />
current spectroscopic and chromatographic methods, which<br />
calibrate with prepared blends and then validate against<br />
prepared blends that are similar to the calibration set<br />
(see the Advantages and Disadvantages section for more<br />
details).<br />
D 9 ENVIRONMENTAL SCIENCE & TECHNOLOGY / VOL. xxx, NO. xx, XXXX
TABLE 2.<br />
A Survey <strong>of</strong> Petrodiesel and B100 Properties a<br />
property symbol mean standard deviation n<br />
petrodiesel density F petro 0.843 0.023 21<br />
B100 density F B100 0.877 0.007 7<br />
petrodiesel C/H ratio m C,petro /m H,petro 6.60 0.60 7<br />
B100 C/H ratio m C,B100 /m H,B100 6.38 0.16 5<br />
B100 C/O ratio b m C,B100 /m O,B100 6.79 0.96 5<br />
B100 ratio <strong>of</strong> bio/total carbon b R C,bio/B100 0.946 0.006 11<br />
a These values were obtained from measurements performed in our laboratory, reports (6, 18), published manuscripts<br />
(25–29), Certificates <strong>of</strong> Authorization (30–34), and the gray literature. Our goal was to ensure that input parameters reflected<br />
a broad range <strong>of</strong> sources such that the resulting variability in the parameter values would represent realistic field<br />
variability, including one residual fuel oil included in the petrodiesel density and C/H ratios (32). The densities listed were<br />
measured at temperatures from 15 to 20 °C or not stated in the source. b The biodiesel endmembers represented the full<br />
range <strong>of</strong> values found for different sources, ranging from coconut (average molecular weight corresponding to C 13 FAME)<br />
to industrial rapeseed (average molecular weight corresponding to C 20 FAME).<br />
FIGURE 1. Reliability <strong>of</strong> the 14 C-based method for calculating<br />
biodiesel content. (a) Comparison <strong>of</strong> calculated (B*) versus<br />
known biodiesel blend percentage (B value) for prepared<br />
blends. This reflects a validation <strong>of</strong> eq 10, which was<br />
independently parameterized from pure component properties,<br />
not fitted to measurements <strong>of</strong> prepared mixtures. (b) Total<br />
propagated error in B* as a function <strong>of</strong> B*, accounting for 14 C<br />
measurement error and assuming wide variability in the<br />
properties <strong>of</strong> the component petrodiesel and biodiesel sources.<br />
Uncertainty Analysis <strong>of</strong> Calculated <strong>Biodiesel</strong> Blend<br />
Percentage. To interrogate further the expected accuracy <strong>of</strong><br />
eq 10 in the face <strong>of</strong> real world variability, we conducted a<br />
thorough error-propagation analysis. We estimated the<br />
compounded uncertainty resulting from the following: the<br />
analytical error <strong>of</strong> the ∆ 14 C mixture measurement; the observed<br />
∆ 14 C bio variability (i.e., for the fat and oil sources in Table 1);<br />
and the realistic variabilities <strong>of</strong> F B100 , F petro , θ C,B100 , θ C,petro , and<br />
R C,bio/B100 (Table 2). This resulted in an expected cumulative<br />
error that was ( 1% or less in the absolute B* blend value<br />
(Figure 2).<br />
FIGURE 2. Advertised biodiesel percentage versus calculated<br />
B*. Only B2 to B20 samples are presented, but data for all<br />
samples are provided in Table 1. Error bars for B* are the total<br />
propagated error as shown in Figure 1b.<br />
The expected error based on the propagation analysis<br />
was consistent with the observed error trends that we found<br />
for the 16 test samples, and these are listed together in Table<br />
1. The origin <strong>of</strong> the error in B* depended on the blend content.<br />
For B0 (pure petrodiesel) to B3 mixtures, the uncertainty in<br />
B* primarily arises from the uncertainty in the measured<br />
∆ 14 C mixture value; for mixtures ranging from B3 to B75 mixtures,<br />
the B* error is dominated by variability in F petro ; finally, for<br />
the B75 to B100 range, the B* error is driven by uncertainty<br />
in the endmember ∆ 14 C bio value. Although the C/O ratio <strong>of</strong><br />
biodiesel exhibited the largest absolute variability <strong>of</strong> the input<br />
parameters (Table 2), the calculated B* was not very sensitive<br />
to this term.<br />
Notably, real-world variability in F petro affects the accuracy<br />
<strong>of</strong> any mass fraction-based method for determining biodiesel<br />
content. Hence this error affects several currently published<br />
methods (9–11, 14). Although F petro was the largest driver <strong>of</strong><br />
uncertainty for our radiocarbon-based blend determinations<br />
in the B20 to B70 range, we found that these previous methods<br />
did not account for F petro variability in their accuracy<br />
assessments.<br />
Analysis <strong>of</strong> Advertised <strong>Biodiesel</strong> Blends. We calculated<br />
B* from the ∆ 14 C values along with eqs 2 and 10 (Table 1;<br />
Figure 2). Briefly, a comparison <strong>of</strong> advertised and calculated<br />
blend content (B vs B* values) revealed discrepancies ranging<br />
from 0 to 54% in the absolute blend level. Since the expected<br />
standard error <strong>of</strong> the analysis method is ( 1% in absolute<br />
blend content (or less), we concluded that most <strong>of</strong> these<br />
differences likely result from erroneous preparations <strong>of</strong> the<br />
advertised blends.<br />
The four B2 samples from Minnesota ranged from B*2.0<br />
to B*2.6, indicating that these blends had been reasonably<br />
prepared. Similarly, the advertised B99.9s and B100s were<br />
consistent with the B* value, except for the previously<br />
VOL. xxx, NO. xx, XXXX / ENVIRONMENTAL SCIENCE & TECHNOLOGY 9 E
discussed B100 sample from Indiana (B*96.7). The largest<br />
discrepancies were found for the B20s. Six <strong>of</strong> these samples<br />
were lower than expected and ranged from B*10.4 to B*17.2.<br />
Hence, we found that B20 blends could be inadequately<br />
prepared at levels 50% below advertised. The four samples<br />
that were above the expected B20 content were more<br />
interesting. Three <strong>of</strong> them were sold by Massachusetts<br />
Distributor C and close to advertised values (B*20.3, B*21.8,<br />
and B*21.8). The fourth was a significant outlier at B*74.4.<br />
It is important to note that for the ten B20 samples that we<br />
analyzed, only one <strong>of</strong> them, Massachusetts Distributor C<br />
collected in June (B*20), would pass the B20 ( 1 requirement<br />
for B20s sold to the United States Department <strong>of</strong> Defense<br />
(37).<br />
Massachusetts Distributor A had the most erratic B* values<br />
for advertised B20 samples—three were 25-50% below<br />
expected and one was 270% greater (B*74; Table 1). Although<br />
gas chromatography may be used for accurate blend<br />
measurements (14), we analyzed the entire set <strong>of</strong> Massachusetts<br />
Distributor A and C B20 samples by GC-FID as<br />
well as standard solutions for qualitative comparisons only.<br />
These analyses were able to confirm, based on visual<br />
inspection <strong>of</strong> the chromatograms, that the advertised Massachusetts<br />
Distributor A Sept. B20 sample was mostly<br />
constituted <strong>of</strong> FAMEs and was therefore improperly prepared;<br />
hence the GC-FID results were consistent with the 14 C-<br />
calculated B*74.4 (See Supporting Information Figure S4).<br />
When we first received this unusual data point, we contacted<br />
Distributor A and told them <strong>of</strong> this problem. Two months<br />
later, we collected one more sample from this distributor<br />
and it had a value <strong>of</strong> B*10.4. This indicates that even after<br />
informing the retailer <strong>of</strong> mixing problems, it continued to<br />
occur.<br />
To test the biodiesel and biodiesel blends <strong>of</strong> postretail<br />
preparations, we acquired four different samples from<br />
individuals (Table 1). Two were blends believed to be a B20<br />
and a B70 that were mixed by the users after they had<br />
purchased retail petrodiesel and B100. The other two were<br />
retail B20 and B100 that the owners had. The two userblended<br />
samples prepared by two different individuals<br />
(Personal A and B; Table 1) exhibited as poor accuracy as the<br />
retail blends. While these individuals thought they were<br />
making a B20 and B70, they actually made a B*10.7 and B*59.5,<br />
respectively, indicating that the inaccuracies observed in the<br />
retail blends can also occur when individuals prepared<br />
biodiesel blends with their own endmembers. The retail<br />
sample B20 that the individual (Personal B taken from fuel<br />
tank) purchased was also much lower than expected with<br />
B*14.8. However, the B100 (Personal A supply jug) was<br />
determined to be B*99.3.<br />
As biodiesel blend consumption increases, it is essential<br />
that the advertised blend be accurate, for fairness to the<br />
consumer, performance <strong>of</strong> the vehicle, tax regulations, and<br />
emissions (See Supporting Information Figure S5) and<br />
carbon-cycling studies. Currently, preparations <strong>of</strong> biodiesel<br />
blends can occur at numerous levels <strong>of</strong> distribution. Based<br />
on discussions with the retailers (when possible), most <strong>of</strong><br />
the samples that we collected in 2006 were prepared by the<br />
actual retailer with splash blending <strong>of</strong> the two endmembers.<br />
Notably, a 2004 federal survey <strong>of</strong> 50 fleets using B20 across<br />
the United States observed inaccuracies in blends that were<br />
comparable to the discrepancies reported here (7). The<br />
samples from the Federal survey were collected from<br />
producers who sold more than one million gallons per year.<br />
Approximately two-thirds <strong>of</strong> the samples were 18-20%<br />
biodiesel. However, the remaining samples ranged from 7 to<br />
98%, indicating severe blending inaccuracies. We were<br />
motivated to complement the federal study by considering<br />
small-scale retailers in 2006. Our results indicate that the<br />
conclusions and recommendations from the 2004 study<br />
(published in October 2005) were not available to or<br />
considered by small-scale retailers.<br />
Advantages and Disadvantages <strong>of</strong> Radiocarbon-Based<br />
Blend <strong>Determination</strong>s. Radiocarbon-based biodiesel blend<br />
determination poses some important advantages over existing<br />
methods, including the European Standard method EN<br />
14078 (IR-based; (17)). First, the present method is the only<br />
approach that has demonstrated ( 1% accuracy over the<br />
entire v/v blending range (0–100%) while also accounting<br />
for real world variability in all <strong>of</strong> the input parameters. For<br />
example, we found that variability in the petrodiesel endmember<br />
density (F petro ) was an important contributor to the<br />
error <strong>of</strong> the method, and although many existing methods<br />
are vulnerable to this source <strong>of</strong> error, no previous study has<br />
characterized it. Second, with the exception <strong>of</strong> Oliveira et al.<br />
(11), IR, NMR, and saponification-based methods assume<br />
that the biodiesel component is constituted <strong>of</strong> 100% FAMEs<br />
having a designated average molecular weight. However,<br />
different biodiesel sources may have very different FAME<br />
average molecular weights; a typical value is ∼290 g mol -1<br />
(canola biodiesel), but it may range from 228 g mol -1 (coconut<br />
biodiesel) to 326 g mol -1 (industrial rapeseed) (18). Oliveira<br />
et al. (11) intentionally did consider a broad molecular weight<br />
range <strong>of</strong> biodiesel sources, but their calibration procedure<br />
is labor intensive, complicated, and requires many fitted<br />
parameters. EN 14078 measures the abundance <strong>of</strong> FAME<br />
ester groups, thereby assuming that the calibration mixture<br />
and test mixture have the same FAME average molecular<br />
weight. The calibration standard for EN 14078 must only<br />
pass the requirements <strong>of</strong> EN 14214, which is the automotive<br />
fuel standard for B100 (38). Hence, if an analyst calibrated<br />
EN 14078 using canola biodiesel, we estimate that this method<br />
would incorrectly diagnose B20 samples <strong>of</strong> coconut biodiesel<br />
and industrial rapeseed biodiesel as B26 and B18, respectively.<br />
By comparison we calculated estimate that the 14 C approach<br />
would exhibit (1 error in the B* values for these samples.<br />
Moreover, some biodiesel preparations may contain significant<br />
quantities <strong>of</strong> non-FAME components (e.g., jojoba<br />
B100 may contain ∼20% long-chain alcohols (19)), and EN<br />
14078 would fail to account for these entirely. The present<br />
method is much less sensitive to variability in the chemical<br />
composition <strong>of</strong> the source materials, because it directly<br />
measures the most abundant ingredient: carbon. Third, the<br />
present method requires no calibration, which again reflects<br />
the robustness and broad applicability <strong>of</strong> the approach.<br />
Consequently, no standard preparations are necessary. Only<br />
a fuel blend sample must be sent to a commercial or university<br />
laboratory equipped to perform 14 C analysis by either AMS<br />
or radiogenic counting. The resulting ∆ 14 C value can be<br />
plugged into eq 2 and then eq 10.<br />
Radiocarbon-based measurement <strong>of</strong> recent (bio) versus<br />
fossil (petro) carbon is the only method that directly<br />
apportions the renewable versus nonrenewable carbon in<br />
fuels, represented by the fraction F C,bio . This enables us to<br />
connect the renewable carbon composition <strong>of</strong> fuels with the<br />
renewable carbon composition <strong>of</strong> CO 2 emissions and other<br />
carbonaceous species. See Supporting Information Figure<br />
S5.<br />
The cost and turn-around-time <strong>of</strong> 14 C analysis are the<br />
main disadvantages <strong>of</strong> the present method. Such measurements<br />
can take weeks and cost several hundred dollars.<br />
However, new developments in continuous-flow AMS may<br />
shorten analysis times to days and reduce costs to less than<br />
a hundred dollars (39). Additionally, we assumed that all <strong>of</strong><br />
the B100 was a product <strong>of</strong> the transesterification <strong>of</strong> fats and<br />
oil with fossil methanol. It is possible that other alcohols,<br />
including modern sources <strong>of</strong> alcohols, could be used.<br />
However, fossil methanol is almost exclusively used in the<br />
United States and Europe. This assumption is consistent with<br />
our mass balance calculations and data shown in Supporting<br />
F 9 ENVIRONMENTAL SCIENCE & TECHNOLOGY / VOL. xxx, NO. xx, XXXX
Information Figure S3. If B100 practices do change to other<br />
alcohols or sources <strong>of</strong> methanol, our approach would require<br />
only slight adjustments to the input θ C,B100 , and R C,bio/B100<br />
values.<br />
Acknowledgments<br />
We thank Gary Knothe (USDA), Jim Randerson (UCI), Ann<br />
McNichol (NOSAMS), and Alex Sessions (Cal Tech) for helpful<br />
discussions and Bill Jenkins (NOSAMS) for providing initial<br />
support <strong>of</strong> this effort. George Wardlaw, Peter Sauer, Leah<br />
Houghton, Bob Nelson, Wallace Stark, Garry Lysiak, Dave<br />
Bank, and Amy Vince provided samples.<br />
Supporting Information Available<br />
Table listing the δ 13 C <strong>of</strong> the samples; five figures containing<br />
information pertaining to (1) the 14 C content <strong>of</strong> CO 2 in the<br />
Northern Hemisphere, (2) a comparison between δ 13 C and<br />
14<br />
C values <strong>of</strong> the fat and oils in this study, (3) the transition<br />
in 14 C content from the fat and oils in this study to B99s and<br />
B100s, (4) the gas chromatograms <strong>of</strong> select B20 samples, and<br />
(5) a comparison between the biodiesel content <strong>of</strong> fuels and<br />
the fraction <strong>of</strong> biomass carbon in the CO 2 emitted from the<br />
same vehicles. This information is available free <strong>of</strong> charge<br />
via the Internet at http://pubs.acs.org.<br />
Literature Cited<br />
(1) Hill, J.; Nelson, E.; Tilman, D.; Polasky, S.; Tiffany, D. Environmental,<br />
economic, and energetic costs and benefits <strong>of</strong> biodiesel<br />
and ethanol bi<strong>of</strong>uels. Proc. Natl. Acad. Sci. U.S.A. 2006, 103,<br />
11206–11210.<br />
(2) Knothe, G. Introduction: What is <strong>Biodiesel</strong> In The <strong>Biodiesel</strong><br />
Handbook; Knothe, G., Van Gerpen, J., Krahl, J., Eds; AOCS Press:<br />
Urbana, IL, 2005; pp 1–3.<br />
(3) VanGerpen, J. The Basics <strong>of</strong> Diesel Engines and Diesel Fuels. In<br />
The <strong>Biodiesel</strong> Handbook; Knothe, G., Van Gerpen, J., Krahl, J.,<br />
Eds; AOCS Press: Urbana, IL, 2005; pp 17–25.<br />
(4) Peterson, C. L.; Hustrulid, T. Carbon cycle for rapeseed oil<br />
biodiesel fuels. Biomass Bioenergy 1998, 14, 91–101.<br />
(5) Gurr, G. I.; Harwood, J. L.; Frayn, K. N. Lipid Biochemistry: An<br />
Introduction, 5th ed.; Blackwell Science Ltd.: Oxford, United<br />
Kingdom, 2002.<br />
(6) <strong>Biodiesel</strong> Handling and Use Guidelines, 3rd ed.; DOE/GO-<br />
102006-2358; Department <strong>of</strong> Energy: Oak Ridge, TN, 2006.<br />
(7) Survey <strong>of</strong> the Quality and Stability <strong>of</strong> <strong>Biodiesel</strong> and <strong>Biodiesel</strong><br />
Blends in the United States in 2004; Technical report NREL/<br />
TP-540-38836; National Renewable Energy Laboratory: Washington,<br />
DC, 2005.<br />
(8) Knothe, G. Analyzing biodiesel: Standards and other methods.<br />
J. Am. Oil Chem. Soc. 2006, 83, 823–833.<br />
(9) Sastry, G. S. R.; Krishna Murthy, A. S. R.; Prasad, P. R.;<br />
Bhuvaneswari, K.; Ravi, P. V. Identification and determination<br />
<strong>of</strong> bio-diesel in diesel. Energy Source, Part A 2006, 28, 1337–<br />
1342.<br />
(10) Birova, A.; Svajdlenka, E.; Cvengros, J. Dostalikova, V. <strong>Determination</strong><br />
<strong>of</strong> the mass fraction <strong>of</strong> methyl esters in mixed fuels.<br />
Eur. J. Lipid Sci. Technol. 2002, 104, 271–277.<br />
(11) Oliveira, J. S.; Montalvao, R.; Daher, L.; Suarez, P. A. Z.; Rubim,<br />
J. C. <strong>Determination</strong> <strong>of</strong> methyl ester contents in biodiesel blends<br />
by FTIR-ATR and FTNIR. Talanta 2006, 69, 1278–1284.<br />
(12) Pimentel, M. F.; Ribeiro, G. M. G. S.; da Cruz, R. S.; Stragevitch,<br />
L.; Filho, J. G. A. P.; Teixeira, L. S. G. <strong>Determination</strong> <strong>of</strong> biodiesel<br />
content when blended with mineral diesel fuel using infrared<br />
spectroscopy and multivariate calibration. Microchem. J. 2006,<br />
82, 201–206.<br />
(13) Knothe, G. Determining the blend level <strong>of</strong> mixtures <strong>of</strong> biodiesel<br />
with conventional diesel fuel by fiber-optic near-infrared<br />
spectroscopy and 1 H nuclear magnetic spectroscopy. J. Am. Oil<br />
Chem. Soc. 2001, 78, 1025–1028.<br />
(14) Bondioli, P.; Della Bella, L. The evaluation <strong>of</strong> biodiesel quality<br />
in commercial blends with diesel fuel. Riv. Ital. Sostanze Grasse<br />
2003, 80, 173–176.<br />
(15) Foglia, T. A.; Jones, K. C.; Phillips, J. G. <strong>Determination</strong> <strong>of</strong> biodiesel<br />
and triacylglycerols in diesel fuels by LC. Chromatographia 2005,<br />
62, 115–119.<br />
(16) Kamiński, M.; Gilgenast, E.; Przyjazny, A.; Romanik, G. Procedure<br />
for and results <strong>of</strong> simultaneous determination <strong>of</strong> aromatic<br />
hydrocarbons and fatty acid methyl esters in diesel fuels by<br />
high performance liquid chromatography. J. Chromatogr., A<br />
2006, 1122, 153–160.<br />
(17) Liquid Petroleum Products-<strong>Determination</strong> <strong>of</strong> Fatty Acid Methyl<br />
Esters (FAME) in middle distillates-Infrared spectroscopy method;<br />
EN 14078; European Committee for Standardization: Brussels,<br />
Belgium, 2003.<br />
(18) <strong>Biodiesel</strong> Handling and Use Guidelines; Technical report NREL/<br />
TP-580-30004; National Renewable Energy Laboratory: Washington,<br />
DC, 2001.<br />
(19) Canoira, L.; Alcantara, R.; Garcia-Martinez, J.; Carrasco, J.<br />
<strong>Biodiesel</strong> from Jojoba oil-wax: Transesterification with methanol<br />
and properties as a fuel. Biomass Bioenergy 2006, 30, 76–81.<br />
(20) Bowman, S. Radiocarbon Dating; University <strong>of</strong> California Press:<br />
Berkeley, CA, 1990.<br />
(21) Levin, I.; Kromer, B. The tropospheric 14 CO 2 level in mid-latitudes<br />
<strong>of</strong> the Northern Hemisphere (1959–2003). Radiocarbon 2004,<br />
46, 1261–1272.<br />
(22) McNichol, A. P.; Osbourne, E. A.; Gagnon, A. R.; Fry, B.; Jones,<br />
G. A. TIC, TOC, DIC, DOC, PIC, POC—Unique aspects in the<br />
preparation <strong>of</strong> oceanographic samples for 14 C-AMS. Nucl. Instrum.<br />
Meth., B 1994, 92, 162–165.<br />
(23) Stuiver, M.; Polach, H. A. Reporting <strong>of</strong> 14 C data. Radiocarbon<br />
1977, 19, 355–363.<br />
(24) Hsueh, D. Y.; Krakauer, N. Y.; Randerson, J. T.; Xu, X.; Trumbore,<br />
S. E.; Southon, J. R. Regional patterns <strong>of</strong> radiocarbon and fossilfuel<br />
derived CO 2 in surface air across North America. Geophys.<br />
Res. Lett. 2007, 34, L02816 doi:10.1029/2006GL027032.<br />
(25) de Menezes, E. W.; da Silva, R.; Cataluna, R.; Ortega, R. J. C.<br />
Effect <strong>of</strong> ethers and ether/ethanol additives on the physicochemical<br />
properties <strong>of</strong> diesel fuel and on engine tests. Fuel 2006,<br />
85, 815–822.<br />
(26) Jones, C. C.; Chughtai, A. R.; Murugaverl, B.; Smith, D. M. Effects<br />
<strong>of</strong> air/fuel combustion ratio on the polycyclic aromatic hydrocarbon<br />
content <strong>of</strong> carbonaceous soots from selected fuels.<br />
Carbon 2004, 42, 2471–2484.<br />
(27) Joshi, R. M.; Pegg, M. J. Flow properties <strong>of</strong> biodiesel fuel blends<br />
at low temperatures. Fuel 2007, 86, 143–151.<br />
(28) Ramadhas, A. S.; Jayaraj, S.; Muraleedharan, C. Use <strong>of</strong> vegetable<br />
oils as IC engine fuels - A review. Renew. Energy 2004, 29, 727–<br />
742.<br />
(29) Tat, M. E.; Van Gerpen, J. H. The specific gravity <strong>of</strong> biodiesel<br />
and its blends with diesel fuel. J. Am. Oil. Chem. Soc. 2000, 77,<br />
115–119.<br />
(30) Certificate <strong>of</strong> Analysis for SRM 1624d, Sulfur in Diesel Fuel Oil,<br />
0.4%; NIST: Gaithersburg, MD, 2006.<br />
(31) Certificate <strong>of</strong> Analysis for SRM 2724b, Sulfur in Diesel Fuel Oil,<br />
0.04%; NIST: Gaithersburg, MD, 2006.<br />
(32) Certificate <strong>of</strong> Analysis for SRM 1623c, Sulfur in Residual Fuel<br />
Oil, 0.3%; NIST: Gaithersburg, MD, 2006.<br />
(33) Certificate <strong>of</strong> Analysis for SRM 2770, Sulfur in Diesel Fuel Oil (40<br />
mg/kg); NIST: Gaithersburg, MD, 2006.<br />
(34) Certificate <strong>of</strong> Analysis for SRM 2723a, Sulfur in Diesel Fuel Oil;<br />
NIST: Gaithersburg, MD, 2006.<br />
(35) Harris, D. C. A Detailed Look at Propagation <strong>of</strong> Uncertainty. In<br />
Quantitative Chemical Analysis, 2nd Ed.; W.H. Freeman: New<br />
York, 1987; Appendix C.<br />
(36) Standard Specifications for <strong>Biodiesel</strong> Fuel (B100) Blend Stock for<br />
Distillate Fuels; D6751-07A; American Society for Testing and<br />
Materials, ASTM International: West Conshohocken, PA, 2007.<br />
(37) Commercial Item Description: Diesel Fuel, <strong>Biodiesel</strong> Blend (B20);<br />
CID-A-A-59693A; U.S. Army Tank-Automotive and Armaments<br />
Command: Warren, MI, 2004.<br />
(38) Automotive Fuels-Fatty Acid Methyl Esters (FAME)-Requirements<br />
and test methods; EN 14214; European Committee for Standardization:<br />
Brussels, Belgium, 2003.<br />
(39) Schneider, R. J.; Kim, S. W.; von Reden, K. F.; Hayes, J. M.; Wills,<br />
J. S. C.; Griffin, V. S.; Sessions, A. L.; Sylva, S. A gas ion source<br />
for continuous-flow AMS. Nucl. Instrum. Meth., B 2004, 223,<br />
149–154.<br />
ES071814J<br />
VOL. xxx, NO. xx, XXXX / ENVIRONMENTAL SCIENCE & TECHNOLOGY 9 G