The achievement of Australia's Indigenous students in PISA ... - ACER
The achievement of Australia's Indigenous students in PISA ... - ACER
The achievement of Australia's Indigenous students in PISA ... - ACER

You also want an ePaper? Increase the reach of your titles
YUMPU automatically turns print PDFs into web optimized ePapers that Google loves.
<strong>The</strong> <strong>achievement</strong> <strong>of</strong><br />
Australia’s <strong>Indigenous</strong><br />
<strong>students</strong> <strong>in</strong><br />
<strong>PISA</strong> 2000 – 2006<br />
Lisa De Bortoli<br />
Sue Thomson<br />
Programme for International Student Assessment
First published 2009<br />
by <strong>ACER</strong> Press, an impr<strong>in</strong>t <strong>of</strong><br />
Australian Council for Educational Research Ltd<br />
19 Prospect Hill Road, Camberwell<br />
Victoria, 3124, Australia<br />
www.acerpress.com.au<br />
sales@acer.edu.au<br />
Text © Lisa De Bortoli and Sue Thomson, 2009<br />
Design and typography © <strong>ACER</strong> Press 2009<br />
This book is copyright. All rights reserved. Except under the conditions described <strong>in</strong> the Copyright<br />
Act 1968 <strong>of</strong> Australia and subsequent amendments, and any exceptions permitted under the current<br />
statutory licence scheme adm<strong>in</strong>istered by Copyright Agency Limited (www.copyright.com.au), no<br />
part <strong>of</strong> this publication may be reproduced, stored <strong>in</strong> a retrieval system, transmitted, broadcast or<br />
communicated <strong>in</strong> any form or by any means, optical, digital, electronic, mechanical, photocopy<strong>in</strong>g,<br />
record<strong>in</strong>g or otherwise, without the written permission <strong>of</strong> the publisher.<br />
Cover and text design by <strong>ACER</strong>, Project Publish<strong>in</strong>g Department<br />
Pr<strong>in</strong>ted <strong>in</strong> Australia by BPA Pr<strong>in</strong>t Group Pty Ltd<br />
National Library <strong>of</strong> Australia Catalogu<strong>in</strong>g-<strong>in</strong>-Publication data:<br />
Author: De Bortoli, Lisa Jean, 1968-<br />
Title: <strong>The</strong> <strong>achievement</strong> <strong>of</strong> Australia’s <strong>Indigenous</strong> Students <strong>in</strong> <strong>PISA</strong> 2000 - 2006 /<br />
Lisa De Bortoli, Sue Thomson.<br />
ISBN:<br />
Subjects:<br />
9780864319012 (pbk.)<br />
Programme for International Student Assessment.<br />
Educational evaluation--Australia.<br />
Aborig<strong>in</strong>al Australians--Education.<br />
Other Authors: Thomson, S. (Susan), 1958-<br />
Australian Council for Educational Research.<br />
Dewey Number: 371.26<br />
This publication is the result <strong>of</strong> research that formed part <strong>of</strong> a program supported by a grant to the<br />
Australian Council for Educational Research by Commonwealth, State and Territory governments. <strong>The</strong><br />
support provided by these governments is gratefully acknowledged.<br />
<strong>The</strong> views expressed <strong>in</strong> this report are those <strong>of</strong> the authors and not necessarily those <strong>of</strong> the<br />
Commonwealth, State and Territory governments.
Contents<br />
Executive Summary......................................................................................................................... i<br />
List <strong>of</strong> Tables................................................................................................................................... ii<br />
List <strong>of</strong> Figures................................................................................................................................ iii<br />
Reader’s Guide................................................................................................................................v<br />
Chapter 1: Introduction.................................................................................................. 1<br />
Why <strong>PISA</strong>..................................................................................................................................... 2<br />
<strong>PISA</strong> <strong>in</strong> Australia............................................................................................................................. 2<br />
<strong>The</strong> ma<strong>in</strong> goals <strong>of</strong> <strong>PISA</strong>.................................................................................................................. 2<br />
What skills does <strong>PISA</strong> assess......................................................................................................... 3<br />
Major and m<strong>in</strong>or doma<strong>in</strong>s.............................................................................................................. 3<br />
Skills for life................................................................................................................................... 4<br />
How results are reported................................................................................................................ 4<br />
Conduct<strong>in</strong>g <strong>PISA</strong>............................................................................................................................ 4<br />
What do <strong>PISA</strong> participants do ................................................................................................ 4<br />
Who participates <strong>in</strong> <strong>PISA</strong>.............................................................................................................. 5<br />
Countries.................................................................................................................................. 5<br />
Schools..................................................................................................................................... 5<br />
Students................................................................................................................................... 6<br />
<strong>PISA</strong> so far...................................................................................................................................... 8<br />
Organisation <strong>of</strong> the report.............................................................................................................. 8<br />
Chapter 2: Read<strong>in</strong>g literacy............................................................................................ 9<br />
Def<strong>in</strong>ition <strong>of</strong> Read<strong>in</strong>g Literacy ....................................................................................................... 9<br />
How read<strong>in</strong>g literacy is measured.................................................................................................. 9<br />
Text format............................................................................................................................. 10<br />
Processes................................................................................................................................ 10<br />
Situations............................................................................................................................... 10<br />
Read<strong>in</strong>g literacy performance: scale scores ................................................................................. 10<br />
Read<strong>in</strong>g literacy performance: pr<strong>of</strong>iciency levels ......................................................................... 12<br />
Read<strong>in</strong>g pr<strong>of</strong>iciency Level 5................................................................................................... 12<br />
Read<strong>in</strong>g pr<strong>of</strong>iciency Level 4................................................................................................... 12<br />
Read<strong>in</strong>g pr<strong>of</strong>iciency Level 3................................................................................................... 12<br />
Read<strong>in</strong>g pr<strong>of</strong>iciency Level 2................................................................................................... 12<br />
Read<strong>in</strong>g pr<strong>of</strong>iciency Level 1................................................................................................... 13<br />
Not yet reached read<strong>in</strong>g pr<strong>of</strong>iciency Level 1........................................................................... 13<br />
<strong>Indigenous</strong> <strong>students</strong>’ performance from an <strong>in</strong>ternational perspective............................................ 14<br />
Read<strong>in</strong>g literacy performance by gender...................................................................................... 16<br />
Performance on the read<strong>in</strong>g literacy subscales ............................................................................ 18<br />
<strong>Indigenous</strong> <strong>students</strong>’ performance <strong>in</strong> retriev<strong>in</strong>g <strong>in</strong>formation.................................................... 18<br />
<strong>Indigenous</strong> <strong>students</strong>’ performance <strong>in</strong> <strong>in</strong>terpret<strong>in</strong>g texts........................................................... 20<br />
<strong>Indigenous</strong> <strong>students</strong>’ performance <strong>in</strong> reflection and evaluation............................................... 21<br />
Performance <strong>in</strong> read<strong>in</strong>g literacy over time.................................................................................... 22<br />
Summary...................................................................................................................................... 22<br />
<strong>The</strong> <strong>achievement</strong> <strong>of</strong> Australia’s <strong>Indigenous</strong> <strong>students</strong> <strong>in</strong> <strong>PISA</strong> 2000 – 2006
Chapter 3: Mathematical literacy................................................................................. 23<br />
Def<strong>in</strong>ition <strong>of</strong> mathematical literacy.............................................................................................. 23<br />
How mathematical literacy is measured....................................................................................... 24<br />
Situations and Context............................................................................................................ 24<br />
Mathematical Content............................................................................................................ 24<br />
Competencies........................................................................................................................ 25<br />
Mathematical literacy performance: scale scores.......................................................................... 25<br />
Mathematical literacy performance: pr<strong>of</strong>iciency levels ................................................................ 26<br />
Mathematical pr<strong>of</strong>iciency Level 6........................................................................................... 26<br />
Mathematical pr<strong>of</strong>iciency Level 5........................................................................................... 26<br />
Mathematical pr<strong>of</strong>iciency Level 4........................................................................................... 27<br />
Mathematical pr<strong>of</strong>iciency Level 3........................................................................................... 27<br />
Mathematical pr<strong>of</strong>iciency Level 2........................................................................................... 27<br />
Mathematical pr<strong>of</strong>iciency Level 1........................................................................................... 27<br />
Not yet reached mathematical pr<strong>of</strong>iciency Level 1................................................................. 28<br />
<strong>Indigenous</strong> <strong>students</strong>’ performance from an <strong>in</strong>ternational perspective............................................ 29<br />
Mathematical literacy performance by gender.............................................................................. 31<br />
Performance on the mathematical literacy subscales.................................................................... 32<br />
<strong>Indigenous</strong> <strong>students</strong>’ performance <strong>in</strong> quantity......................................................................... 32<br />
<strong>Indigenous</strong> <strong>students</strong>’ performance <strong>in</strong> space and shape............................................................ 34<br />
<strong>Indigenous</strong> <strong>students</strong>’ performance <strong>in</strong> change and relationships............................................... 35<br />
<strong>Indigenous</strong> <strong>students</strong>’ performance <strong>in</strong> uncerta<strong>in</strong>ty.................................................................... 36<br />
Performance <strong>in</strong> mathematical literacy over time........................................................................... 37<br />
Summary...................................................................................................................................... 38<br />
Chapter 4: Scientific literacy........................................................................................ 39<br />
Def<strong>in</strong>ition <strong>of</strong> scientific literacy..................................................................................................... 39<br />
How scientific literacy is measured ............................................................................................. 40<br />
Context.................................................................................................................................. 40<br />
Competencies........................................................................................................................ 40<br />
Scientific knowledge.............................................................................................................. 40<br />
Attitudes................................................................................................................................. 40<br />
Scientific literacy performance: scale scores................................................................................. 41<br />
Scientific literacy performance: pr<strong>of</strong>iciency levels........................................................................ 42<br />
Science pr<strong>of</strong>iciency Level 6.................................................................................................... 42<br />
Science pr<strong>of</strong>iciency Level 5.................................................................................................... 42<br />
Science pr<strong>of</strong>iciency Level 4.................................................................................................... 42<br />
Science pr<strong>of</strong>iciency Level 3.................................................................................................... 43<br />
Science pr<strong>of</strong>iciency Level 2.................................................................................................... 43<br />
Science pr<strong>of</strong>iciency Level 1.................................................................................................... 43<br />
Not yet reached science pr<strong>of</strong>iciency Level 1........................................................................... 43<br />
<strong>Indigenous</strong> <strong>students</strong>’ performance from an <strong>in</strong>ternational perspective............................................ 44<br />
Scientific literacy performance by gender..................................................................................... 46<br />
Performance on the scientific literacy subscales .......................................................................... 47<br />
<strong>Indigenous</strong> <strong>students</strong>’ performance <strong>in</strong> identify<strong>in</strong>g scientific issues............................................ 47<br />
<strong>Indigenous</strong> <strong>students</strong>’ performance <strong>in</strong> expla<strong>in</strong><strong>in</strong>g phenomena scientifically............................. 48<br />
<strong>Indigenous</strong> <strong>students</strong>’ performance <strong>in</strong> us<strong>in</strong>g scientific evidence............................................... 49<br />
Summary...................................................................................................................................... 50<br />
Summary and conclusions............................................................................................ 51<br />
References.................................................................................................................... 53<br />
<strong>The</strong> <strong>achievement</strong> <strong>of</strong> Australia’s <strong>Indigenous</strong> <strong>students</strong> <strong>in</strong> <strong>PISA</strong> 2000 – 2006
Executive Summary<br />
<strong>The</strong> three-yearly <strong>PISA</strong> assessments provide an opportunity to monitor the performance <strong>of</strong> Australian<br />
<strong>students</strong> <strong>in</strong> read<strong>in</strong>g, mathematical and scientific literacy. In particular, the assessments allow us<br />
to exam<strong>in</strong>e the performance <strong>of</strong> particular equity groups; to look at how well particular groups <strong>of</strong><br />
15-year-old <strong>students</strong>, approach<strong>in</strong>g the end <strong>of</strong> their compulsory school<strong>in</strong>g are prepared for meet<strong>in</strong>g<br />
the challenges they will face <strong>in</strong> their lives beyond school.<br />
A special focus for Australia has been to ensure that there is a sufficiently large sample <strong>of</strong><br />
Australia’s <strong>Indigenous</strong> <strong>students</strong> so that valid and reliable analysis can be conducted. This has been<br />
achieved <strong>in</strong> each cycle <strong>of</strong> <strong>PISA</strong> and this report presents analyses <strong>of</strong> the <strong>achievement</strong> <strong>of</strong> <strong>Indigenous</strong><br />
<strong>students</strong> <strong>in</strong> read<strong>in</strong>g, mathematical and scientific literacy <strong>in</strong> each <strong>of</strong> the cycles.<br />
Achievement is presented <strong>in</strong> two ways <strong>in</strong> this report: <strong>in</strong> terms <strong>of</strong> mean scores and <strong>in</strong> terms <strong>of</strong><br />
pr<strong>of</strong>iciency levels. Mean scores allow comparisons with other <strong>students</strong> and with other countries,<br />
and while pr<strong>of</strong>iciency levels also allow comparisons, additionally they provide <strong>in</strong>formation about<br />
what <strong>students</strong> can and cannot do.<br />
Across the three <strong>PISA</strong> cycles, <strong>Indigenous</strong> <strong>students</strong> have performed at a substantially and statistically<br />
lower average level <strong>in</strong> read<strong>in</strong>g, mathematical and scientific literacy than their non-<strong>Indigenous</strong><br />
peers. In each doma<strong>in</strong>, <strong>Indigenous</strong> <strong>students</strong> performed more than 80 score po<strong>in</strong>ts (or more than<br />
one pr<strong>of</strong>iciency level) lower than non-<strong>Indigenous</strong> <strong>students</strong> and more than 50 score po<strong>in</strong>ts lower<br />
than the OECD average. In terms <strong>of</strong> pr<strong>of</strong>iciency levels, <strong>Indigenous</strong> <strong>students</strong> are overrepresented at<br />
the lower levels and underrepresented at the upper levels <strong>in</strong> read<strong>in</strong>g, mathematical and scientific<br />
literacy.<br />
<strong>The</strong> OECD has determ<strong>in</strong>ed that for mathematical and scientific literacy Pr<strong>of</strong>iciency Level 2 is the<br />
base level at which <strong>students</strong> are considered able to demonstrate competencies that will enable<br />
them to actively participate <strong>in</strong> life situations. For the purposes <strong>of</strong> this report, Level 2 will be treated<br />
<strong>in</strong> a similar manner for read<strong>in</strong>g literacy.<br />
More than one third <strong>of</strong> <strong>Indigenous</strong> <strong>students</strong> did not achieve Level 2 <strong>in</strong> read<strong>in</strong>g, mathematical or<br />
scientific literacy. Only 12 per cent <strong>of</strong> <strong>Indigenous</strong> <strong>students</strong> were able to achieve the highest levels<br />
<strong>of</strong> read<strong>in</strong>g literacy, and no more than five per cent achieved the highest level <strong>in</strong> mathematical and<br />
scientific literacy.<br />
Significant gender differences were found between <strong>Indigenous</strong> males and females <strong>in</strong> read<strong>in</strong>g<br />
literacy, favour<strong>in</strong>g <strong>Indigenous</strong> females by 34 score po<strong>in</strong>ts. No significant gender differences <strong>in</strong><br />
mathematical and scientific literacy were found for <strong>Indigenous</strong> <strong>students</strong>.<br />
<strong>The</strong> performance <strong>of</strong> Australian <strong>Indigenous</strong> <strong>students</strong> <strong>in</strong> <strong>PISA</strong> cont<strong>in</strong>ues to raise concerns about the<br />
educational disadvantage faced by these <strong>students</strong>. From an <strong>in</strong>ternational perspective, they are<br />
perform<strong>in</strong>g well below the OECD average and from a national perspective, they are achiev<strong>in</strong>g well<br />
below the performance <strong>of</strong> non-<strong>Indigenous</strong> <strong>students</strong>.<br />
<strong>The</strong> results from the three <strong>PISA</strong> assessments have shown that the performance <strong>of</strong> <strong>Indigenous</strong><br />
<strong>students</strong> has not improved over time. <strong>The</strong>se results suggest that <strong>in</strong>itiatives to improve the<br />
education <strong>of</strong> <strong>Indigenous</strong> <strong>students</strong> through educational policy have to date had little effect. In<br />
terms <strong>of</strong> real-life function<strong>in</strong>g and future opportunities, <strong>Indigenous</strong> <strong>students</strong> rema<strong>in</strong> at a substantial<br />
disadvantage.<br />
<strong>The</strong> <strong>achievement</strong> <strong>of</strong> Australia’s <strong>Indigenous</strong> <strong>students</strong> <strong>in</strong> <strong>PISA</strong> 2000 – 2006<br />
i
List <strong>of</strong> Tables<br />
Table 1.1: Number <strong>of</strong> Australian <strong>PISA</strong> Students............................................................................ 6<br />
Table 1.2: Number <strong>of</strong> <strong>Indigenous</strong> and non-<strong>Indigenous</strong> <strong>students</strong> <strong>in</strong> <strong>PISA</strong> 2000,<br />
<strong>PISA</strong> 2003 and <strong>PISA</strong> 2006........................................................................................... 6<br />
Table 1.3: Number <strong>of</strong> <strong>Indigenous</strong> and non-<strong>Indigenous</strong> <strong>students</strong> by gender <strong>in</strong> <strong>PISA</strong> 2000,<br />
<strong>PISA</strong> 2003 and <strong>PISA</strong> 2006........................................................................................... 7<br />
Table 1.4: Distribution <strong>of</strong> <strong>Indigenous</strong> and non-<strong>Indigenous</strong> <strong>students</strong> by year level <strong>in</strong><br />
<strong>PISA</strong> 2000, <strong>PISA</strong> 2003 and <strong>PISA</strong> 2006........................................................................ 7<br />
Table 1.5: Distribution <strong>of</strong> <strong>Indigenous</strong> <strong>students</strong> by geographic location <strong>in</strong> <strong>PISA</strong> 2000,<br />
<strong>PISA</strong> 2003 and <strong>PISA</strong> 2006........................................................................................... 7<br />
Table 1.6: Distribution <strong>of</strong> <strong>Indigenous</strong> <strong>students</strong> by socioeconomic background <strong>in</strong><br />
<strong>PISA</strong> 2000, <strong>PISA</strong> 2003 and <strong>PISA</strong> 2006........................................................................ 8<br />
Table 1.7: A summary <strong>of</strong> results from <strong>PISA</strong>.................................................................................. 8<br />
Table 2.1: Means and standard errors for <strong>Indigenous</strong> and non-<strong>Indigenous</strong> <strong>students</strong><br />
on the overall read<strong>in</strong>g literacy scale ......................................................................... 11<br />
Table 2.2: Read<strong>in</strong>g literacy pr<strong>of</strong>iciency levels for <strong>Indigenous</strong> and non-<strong>Indigenous</strong><br />
<strong>students</strong> for <strong>PISA</strong> 2003 and <strong>PISA</strong> 2006 ..................................................................... 14<br />
Table 2.3: Means and standard errors for <strong>Indigenous</strong> and non-<strong>Indigenous</strong> <strong>students</strong><br />
by gender on the overall read<strong>in</strong>g literacy scale ......................................................... 16<br />
Table 2.4: Spread <strong>of</strong> scores over all <strong>PISA</strong> cycles, by gender....................................................... 17<br />
Table 2.5: Means and standard errors for <strong>Indigenous</strong> and non-<strong>Indigenous</strong> <strong>students</strong><br />
on the retriev<strong>in</strong>g <strong>in</strong>formation subscale for <strong>PISA</strong> 2000 ............................................. 19<br />
Table 2.6: Means and standard errors for <strong>Indigenous</strong> and non-<strong>Indigenous</strong> <strong>students</strong><br />
on the <strong>in</strong>terpret<strong>in</strong>g texts subscale for <strong>PISA</strong> 2000........................................................ 20<br />
Table 2.7: Means and standard errors for <strong>Indigenous</strong> and non-<strong>Indigenous</strong> <strong>students</strong><br />
on the reflection and evaluation subscale for <strong>PISA</strong> 2000 ........................................ 21<br />
Table 2.8: Mean read<strong>in</strong>g literacy scores and standard errors for <strong>PISA</strong> 2000,<br />
<strong>PISA</strong> 2003 and <strong>PISA</strong> 2006, and differences between performance<br />
<strong>in</strong> cycles for <strong>Indigenous</strong> <strong>students</strong>............................................................................... 22<br />
Table 3.1:<br />
Table 3.2:<br />
Table 3.3:<br />
Table 3.4:<br />
Table 3.5:<br />
Table 3.6:<br />
Table 3.7:<br />
Table 3.8:<br />
Table 4.1:<br />
Table 4.2:<br />
Table 5.1:<br />
Means and standard errors for <strong>Indigenous</strong> and non-<strong>Indigenous</strong> <strong>students</strong><br />
on the overall mathematical literacy scale................................................................. 25<br />
Mathematical literacy performance for <strong>Indigenous</strong> and non-<strong>Indigenous</strong><br />
<strong>students</strong> for <strong>PISA</strong> 2006.............................................................................................. 29<br />
Means and standard errors for <strong>Indigenous</strong> and non-<strong>Indigenous</strong> <strong>students</strong><br />
by gender on the overall mathematical literacy scale................................................ 31<br />
Means and standard errors for <strong>Indigenous</strong> and non-<strong>Indigenous</strong> <strong>students</strong><br />
on the quantity subscale for <strong>PISA</strong> 2003..................................................................... 33<br />
Means and standard errors for <strong>Indigenous</strong> and non-<strong>Indigenous</strong> <strong>students</strong><br />
on the space and shape subscale for <strong>PISA</strong> 2003........................................................ 34<br />
Means and standard errors for <strong>Indigenous</strong> and non-<strong>Indigenous</strong> <strong>students</strong><br />
on the change and relationships subscale for <strong>PISA</strong> 2003........................................... 35<br />
Means and standard errors for <strong>Indigenous</strong> and non-<strong>Indigenous</strong> <strong>students</strong><br />
on the uncerta<strong>in</strong>ty subscale for <strong>PISA</strong> 2003................................................................ 36<br />
Mean mathematical literacy scores and standard errors for <strong>PISA</strong> 2003 and<br />
<strong>PISA</strong> 2006, and differences between performance <strong>in</strong> cycles for<br />
<strong>Indigenous</strong> <strong>students</strong>.................................................................................................. 37<br />
Means and standard errors for <strong>Indigenous</strong> and non-<strong>Indigenous</strong> <strong>students</strong><br />
on the overall scientific literacy scale........................................................................ 41<br />
Means and standard errors for <strong>Indigenous</strong> and non-<strong>Indigenous</strong> <strong>students</strong><br />
by gender on the overall scientific literacy scale ...................................................... 46<br />
A summary <strong>of</strong> <strong>Indigenous</strong> and non-<strong>Indigenous</strong> performance from<br />
<strong>PISA</strong> 2000, 2003 and 2006 ..................................................................................... 52<br />
ii <strong>The</strong> <strong>achievement</strong> <strong>of</strong> Australia’s <strong>Indigenous</strong> <strong>students</strong> <strong>in</strong> <strong>PISA</strong> 2000 – 2006
List <strong>of</strong> Figures<br />
Figure 2.1: Distribution <strong>of</strong> <strong>Indigenous</strong> and non-<strong>Indigenous</strong> <strong>students</strong> on the read<strong>in</strong>g<br />
literacy scale for <strong>PISA</strong> 2000...................................................................................... 11<br />
Figure 2.2: Read<strong>in</strong>g literacy pr<strong>of</strong>iciency levels for <strong>Indigenous</strong> and non-<strong>Indigenous</strong><br />
<strong>students</strong>, the OECD average and F<strong>in</strong>land for <strong>PISA</strong> 2000............................................ 13<br />
Figure 2.3: International student performance <strong>in</strong> read<strong>in</strong>g literacy for <strong>PISA</strong> 2000 <strong>in</strong>clud<strong>in</strong>g<br />
<strong>Indigenous</strong> and non-<strong>Indigenous</strong> performance........................................................... 15<br />
Figure 2.4: Distribution <strong>of</strong> <strong>Indigenous</strong> and non-<strong>Indigenous</strong> <strong>students</strong> on the read<strong>in</strong>g<br />
literacy scale for <strong>PISA</strong> 2000...................................................................................... 16<br />
Figure 2.5: Read<strong>in</strong>g literacy pr<strong>of</strong>iciency levels for <strong>Indigenous</strong> and non-<strong>Indigenous</strong><br />
<strong>students</strong> by gender for <strong>PISA</strong> 2000.............................................................................. 17<br />
Figure 2.6: Description <strong>of</strong> pr<strong>of</strong>iciency levels for the read<strong>in</strong>g literacy subscales........................... 18<br />
Figure 2.7: Distribution <strong>of</strong> <strong>Indigenous</strong> and non-<strong>Indigenous</strong> <strong>students</strong> on the retriev<strong>in</strong>g<br />
<strong>in</strong>formation subscale by gender for <strong>PISA</strong> 2000.......................................................... 19<br />
Figure 2.8: Pr<strong>of</strong>iciency levels on the retriev<strong>in</strong>g <strong>in</strong>formation subscale for <strong>Indigenous</strong> and<br />
non-<strong>Indigenous</strong> <strong>students</strong>, F<strong>in</strong>nish <strong>students</strong> and the OECD average for <strong>PISA</strong> 2000...... 19<br />
Figure 2.9: Distribution <strong>of</strong> <strong>Indigenous</strong> and non-<strong>Indigenous</strong> <strong>students</strong> on the <strong>in</strong>terpret<strong>in</strong>g<br />
text subscale by gender for <strong>PISA</strong> 2000...................................................................... 20<br />
Figure 2.10: Pr<strong>of</strong>iciency levels on the <strong>in</strong>terpret<strong>in</strong>g text subscale for <strong>Indigenous</strong> and<br />
non-<strong>Indigenous</strong> <strong>students</strong>, F<strong>in</strong>nish <strong>students</strong> and the OECD average for <strong>PISA</strong> 2000...... 20<br />
Figure 2.11: Distribution <strong>of</strong> <strong>Indigenous</strong> and non-<strong>Indigenous</strong> <strong>students</strong> on the reflection and<br />
evaluation subscale by gender for <strong>PISA</strong> 2000............................................................ 21<br />
Figure 2.12: Pr<strong>of</strong>iciency levels on the reflection and evaluation subscale for <strong>Indigenous</strong> and<br />
non‐<strong>Indigenous</strong> <strong>students</strong>, F<strong>in</strong>nish <strong>students</strong> and the OECD average for <strong>PISA</strong> 2000...... 21<br />
Figure 3.1: Distribution <strong>of</strong> <strong>Indigenous</strong> and non-<strong>Indigenous</strong> <strong>students</strong> on the mathematical<br />
literacy scale for <strong>PISA</strong> 2003...................................................................................... 26<br />
Figure 3.2: Mathematical literacy pr<strong>of</strong>iciency levels for <strong>Indigenous</strong> and non-<strong>Indigenous</strong><br />
<strong>students</strong>, the OECD average and Hong Kong-Ch<strong>in</strong>a for <strong>PISA</strong> 2003............................ 28<br />
Figure 3.3: International student performance <strong>in</strong> mathematical literacy for <strong>PISA</strong> 2003<br />
<strong>in</strong>clud<strong>in</strong>g <strong>Indigenous</strong> and non-<strong>Indigenous</strong> performance............................................ 30<br />
Figure 3.4: Distribution <strong>of</strong> <strong>Indigenous</strong> and non-<strong>Indigenous</strong> <strong>students</strong> on the mathematical<br />
literacy scale for <strong>PISA</strong> 2003...................................................................................... 32<br />
Figure 3.5: Mathematical literacy pr<strong>of</strong>iciency levels for <strong>Indigenous</strong> and non-<strong>Indigenous</strong><br />
<strong>students</strong> by gender for <strong>PISA</strong> 2003.............................................................................. 32<br />
Figure 3.6: Distribution <strong>of</strong> <strong>Indigenous</strong> and on-<strong>Indigenous</strong> <strong>students</strong> on the quantity subscale<br />
by gender for <strong>PISA</strong> 2003........................................................................................... 33<br />
Figure 3.7: Pr<strong>of</strong>iciency levels on the quantity subscale for <strong>Indigenous</strong> and non-<strong>Indigenous</strong><br />
<strong>students</strong>, Hong Kong-Ch<strong>in</strong>ese <strong>students</strong> and OECD average for <strong>PISA</strong> 2003................. 33<br />
Figure 3.8: Distribution <strong>of</strong> <strong>Indigenous</strong> and on-<strong>Indigenous</strong> <strong>students</strong> on the space and shape<br />
subscale by gender for <strong>PISA</strong> 2003............................................................................. 34<br />
Figure 3.9: Pr<strong>of</strong>iciency levels on the space and shape subscale for <strong>Indigenous</strong> and<br />
non-<strong>Indigenous</strong> <strong>students</strong>, Hong Kong - Ch<strong>in</strong>ese <strong>students</strong> and OECD average<br />
for <strong>PISA</strong> 2003........................................................................................................... 35<br />
Figure 3.10: Distribution <strong>of</strong> <strong>Indigenous</strong> and on-<strong>Indigenous</strong> <strong>students</strong> on the change and<br />
relationships subscale by gender for <strong>PISA</strong> 2003........................................................ 35<br />
Figure 3.11: Pr<strong>of</strong>iciency levels on the change and relationship subscale for <strong>Indigenous</strong><br />
and non-<strong>Indigenous</strong> <strong>students</strong>, Hong Kong-Ch<strong>in</strong>ese <strong>students</strong> and OECD average<br />
for <strong>PISA</strong> 2003 ........................................................................................................ 36<br />
Figure 3.12: Distribution <strong>of</strong> <strong>Indigenous</strong> and on-<strong>Indigenous</strong> <strong>students</strong> on the uncerta<strong>in</strong>ty<br />
subscale by gender for <strong>PISA</strong> 2003............................................................................. 37<br />
Figure 3.13: Pr<strong>of</strong>iciency levels on the uncerta<strong>in</strong>ty subscale for <strong>Indigenous</strong> and non-<strong>Indigenous</strong><br />
<strong>students</strong>, Hong Kong - Ch<strong>in</strong>ese <strong>students</strong> and OECD average for <strong>PISA</strong> 2003............... 37<br />
Figure 4.1: Distribution <strong>of</strong> <strong>Indigenous</strong> and non-<strong>Indigenous</strong> <strong>students</strong> on the scientific<br />
literacy scale for <strong>PISA</strong> 2006...................................................................................... 41<br />
Figure 4.2: Scientific literacy pr<strong>of</strong>iciency levels for <strong>Indigenous</strong> and non-<strong>Indigenous</strong> <strong>students</strong>,<br />
the OECD average and F<strong>in</strong>land for <strong>PISA</strong> 2006........................................................... 44<br />
<strong>The</strong> <strong>achievement</strong> <strong>of</strong> Australia’s <strong>Indigenous</strong> <strong>students</strong> <strong>in</strong> <strong>PISA</strong> 2000 – 2006<br />
iii
Figure 4.3: International student performance <strong>in</strong> scientific literacy for <strong>PISA</strong> 2006 <strong>in</strong>clud<strong>in</strong>g<br />
<strong>Indigenous</strong> and non-<strong>Indigenous</strong> performance........................................................... 45<br />
Figure 4.4: Distribution <strong>of</strong> <strong>Indigenous</strong> and non-<strong>Indigenous</strong> <strong>students</strong> on the scientific<br />
literacy scale for <strong>PISA</strong> 2006...................................................................................... 46<br />
Figure 4.5: Scientific literacy pr<strong>of</strong>iciency levels for <strong>Indigenous</strong> and non-<strong>Indigenous</strong> <strong>students</strong><br />
by gender for <strong>PISA</strong> 2006........................................................................................... 47<br />
Figure 4.6: Pr<strong>of</strong>iciency levels on the identify<strong>in</strong>g scientific issues subscale for <strong>Indigenous</strong><br />
and non-<strong>Indigenous</strong> <strong>students</strong> by gender for <strong>PISA</strong> 2006.............................................. 48<br />
Figure 4.7: Pr<strong>of</strong>iciency levels on the identify<strong>in</strong>g scientific issues subscale for <strong>Indigenous</strong><br />
and non-<strong>Indigenous</strong> <strong>students</strong>, F<strong>in</strong>nish <strong>students</strong> and the OECD average for<br />
<strong>PISA</strong> 2006................................................................................................................. 48<br />
Figure 4.8: Pr<strong>of</strong>iciency levels on the expla<strong>in</strong><strong>in</strong>g phenomena scientifically subscale for<br />
<strong>Indigenous</strong> and non-<strong>Indigenous</strong> <strong>students</strong> by gender for <strong>PISA</strong> 2006............................ 49<br />
Figure 4.9: Pr<strong>of</strong>iciency levels on the expla<strong>in</strong><strong>in</strong>g phenomena scientifically subscale for<br />
<strong>Indigenous</strong> and non-<strong>Indigenous</strong> <strong>students</strong>, F<strong>in</strong>nish <strong>students</strong> and the OECD<br />
average for <strong>PISA</strong> 2006............................................................................................... 49<br />
Figure 4.10: Pr<strong>of</strong>iciency levels on the us<strong>in</strong>g scientific evidence subscale for <strong>Indigenous</strong><br />
and non-<strong>Indigenous</strong> <strong>students</strong> by gender for <strong>PISA</strong> 2006.............................................. 50<br />
Figure 4.11: Pr<strong>of</strong>iciency levels on the us<strong>in</strong>g scientific evidence for <strong>Indigenous</strong> and<br />
non-<strong>Indigenous</strong> <strong>students</strong>, F<strong>in</strong>nish <strong>students</strong> and the OECD average for <strong>PISA</strong> 2006...... 50<br />
iv <strong>The</strong> <strong>achievement</strong> <strong>of</strong> Australia’s <strong>Indigenous</strong> <strong>students</strong> <strong>in</strong> <strong>PISA</strong> 2000 – 2006
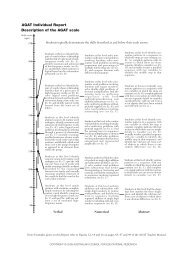
Reader’s Guide<br />
How to read the mean and distribution graphs<br />
Each country’s or student group’s results are represented <strong>in</strong> horizontal bars with various colours.<br />
On the left end <strong>of</strong> the bar is the 5th percentile – this is the score below which 5 per cent <strong>of</strong> the<br />
<strong>students</strong> have scored. <strong>The</strong> next two l<strong>in</strong>es <strong>in</strong>dicate the 10th percentile and the 25th percentile.<br />
<strong>The</strong> next l<strong>in</strong>e at the left <strong>of</strong> the white band is the lower limit <strong>of</strong> the confidence <strong>in</strong>terval for the<br />
mean – i.e. we are confident that the mean will lie <strong>in</strong> this white band. <strong>The</strong> l<strong>in</strong>e <strong>in</strong> the centre <strong>of</strong> the<br />
white band is the mean. <strong>The</strong> l<strong>in</strong>es to the right <strong>of</strong> the white band <strong>in</strong>dicate the 75th, 90th and 95th<br />
percentile.<br />
10th<br />
percentile<br />
Confidence<br />
<strong>in</strong>terval<br />
90th<br />
percentile<br />
5th<br />
percentile<br />
25th<br />
percentile<br />
Mean<br />
75th<br />
percentile<br />
95th<br />
percentile<br />
Def<strong>in</strong>itions <strong>of</strong> background characteristics<br />
A number <strong>of</strong> different background characteristics are referred to <strong>in</strong> this report. <strong>The</strong> def<strong>in</strong>itions <strong>of</strong><br />
some <strong>of</strong> these are particular to the Australian context, while others are standard across different<br />
countries or with<strong>in</strong> an <strong>in</strong>ternational context. This section provides an explanation for those that are<br />
not self-evident.<br />
<strong>Indigenous</strong> status:<br />
Socioeconomic<br />
background:<br />
<strong>Indigenous</strong> status is based on <strong>students</strong>’ self-identification as be<strong>in</strong>g <strong>of</strong><br />
Australian Aborig<strong>in</strong>al or Torres Strait Islander descent. For the purposes<br />
<strong>of</strong> this report, data for the two groups are presented together with the<br />
descriptor, <strong>Indigenous</strong> Australian <strong>students</strong>.<br />
Two measures are used by the OECD to represent elements <strong>of</strong><br />
socioeconomic background. One is the highest level <strong>of</strong> the father’s and<br />
mother’s occupation (known as HISEI), which is coded <strong>in</strong> accordance<br />
with the International Standard Classification <strong>of</strong> Occupations. <strong>The</strong> other<br />
measure is the <strong>in</strong>dex <strong>of</strong> economic, social and cultural status (ESCS),<br />
which was created to capture the wider aspects <strong>of</strong> a student’s family and<br />
home background. <strong>The</strong> ESCS <strong>in</strong>dex is based on <strong>students</strong>’ reports <strong>of</strong> their<br />
parents’ occupations; the highest level <strong>of</strong> education <strong>of</strong> the father and<br />
mother converted <strong>in</strong>to years <strong>of</strong> school<strong>in</strong>g; the number <strong>of</strong> books <strong>in</strong> the<br />
home; and access to home educational and cultural resources.<br />
<strong>The</strong> <strong>achievement</strong> <strong>of</strong> Australia’s <strong>Indigenous</strong> <strong>students</strong> <strong>in</strong> <strong>PISA</strong> 2000 – 2006<br />
v
Geographic location:<br />
In Australia, the participat<strong>in</strong>g schools were coded accord<strong>in</strong>g to the<br />
M<strong>in</strong>isterial Council on Education, Employment, Tra<strong>in</strong><strong>in</strong>g and Youth<br />
Affairs (MCEETYA) Schools Geographic Location Classification. For the<br />
analysis <strong>in</strong> this report, only the broadest categories are used:<br />
◗◗<br />
◗◗<br />
◗◗<br />
Metropolitan – <strong>in</strong>clud<strong>in</strong>g ma<strong>in</strong>land state capital cities or major urban<br />
districts with a population <strong>of</strong> 100,000 or more (e.g. Queanbeyan,<br />
Cairns, Geelong, Hobart)<br />
Prov<strong>in</strong>cial – <strong>in</strong>clud<strong>in</strong>g prov<strong>in</strong>cial cities and other non-remote<br />
prov<strong>in</strong>cial areas (e.g. Darw<strong>in</strong>, Ballarat, Bundaberg, Geraldton,<br />
Tamworth)<br />
Remote – Remote areas and Very remote areas. Remote: very<br />
restricted accessibility <strong>of</strong> goods, services and opportunities for<br />
social <strong>in</strong>teraction (e.g. Coolabah, Mallacoota, Capella, Mt Isa, Port<br />
L<strong>in</strong>coln, Port Hedland, Swansea and Alice Spr<strong>in</strong>gs). Very remote:<br />
very little accessibility <strong>of</strong> goods, services and opportunities for<br />
social <strong>in</strong>teraction (e.g. Bourke, Thursday Island, Yalata, Cond<strong>in</strong>gup,<br />
Nhulunbuy).<br />
Report<strong>in</strong>g <strong>of</strong> student data<br />
Age <strong>of</strong> <strong>students</strong><br />
<strong>The</strong> report uses “15-year-olds” as shorthand for the <strong>PISA</strong> target population. In practice, the target<br />
population is <strong>students</strong> who were aged between 15 years and 3 (complete) months and 16 years<br />
and 2 (complete) months at the beg<strong>in</strong>n<strong>in</strong>g <strong>of</strong> the assessment period and who were enrolled <strong>in</strong> an<br />
educational <strong>in</strong>stitution that they were attend<strong>in</strong>g full-time or part-time.<br />
<strong>PISA</strong> scores<br />
To facilitate the <strong>in</strong>terpretation <strong>of</strong> the scores assigned to <strong>students</strong>, scales were constructed to have<br />
an average score among the OECD countries <strong>of</strong> 500 po<strong>in</strong>ts, with about two-thirds <strong>of</strong> <strong>students</strong><br />
across OECD countries scor<strong>in</strong>g between 400 and 600 po<strong>in</strong>ts (i.e. the scale has a mean <strong>of</strong> 500 and<br />
a standard deviation <strong>of</strong> 100).<br />
OECD average<br />
An OECD average was calculated for most <strong>in</strong>dicators <strong>in</strong> this report and is presented for<br />
comparative purposes. <strong>The</strong> OECD average takes the OECD countries as a s<strong>in</strong>gle entity, to which<br />
each country contributes with equal weight. <strong>The</strong> OECD average is equivalent to the arithmetic<br />
mean <strong>of</strong> the respective country means<br />
Confidence <strong>in</strong>tervals and standard errors<br />
In this and other reports, student <strong>achievement</strong> is <strong>of</strong>ten summarised by a mean score. For <strong>PISA</strong>,<br />
each mean score is calculated from the sample <strong>of</strong> <strong>students</strong> who undertook the <strong>PISA</strong> assessment,<br />
and is referred to as the sample mean. <strong>The</strong>se sample means are an approximation <strong>of</strong> the actual<br />
mean score, known as the population mean, which would have been derived had all <strong>students</strong><br />
<strong>in</strong> Australia actually taken part <strong>in</strong> the <strong>PISA</strong> assessment. S<strong>in</strong>ce the sample mean is just one po<strong>in</strong>t<br />
along the range <strong>of</strong> student <strong>achievement</strong> scores, more <strong>in</strong>formation is needed to gauge whether the<br />
sample mean is an underestimation or overestimation <strong>of</strong> the population mean. <strong>The</strong> calculation<br />
<strong>of</strong> confidence <strong>in</strong>tervals can assist our assessment <strong>of</strong> a sample mean’s precision as an estimation<br />
<strong>of</strong> the population mean. Confidence <strong>in</strong>tervals provide a range <strong>of</strong> scores with<strong>in</strong> which we are<br />
vi <strong>The</strong> <strong>achievement</strong> <strong>of</strong> Australia’s <strong>Indigenous</strong> <strong>students</strong> <strong>in</strong> <strong>PISA</strong> 2000 – 2006
‘confident’ that the population mean actually lies. In this report, sample means are presented with<br />
an associated standard error. <strong>The</strong> confidence <strong>in</strong>terval, which can be calculated us<strong>in</strong>g the standard<br />
error, <strong>in</strong>dicates that there is a 95 per cent chance that the actual population mean lies with<strong>in</strong> plus<br />
or m<strong>in</strong>us 1.96 standard errors <strong>of</strong> the sample mean.<br />
Spread <strong>of</strong> scores<br />
<strong>The</strong> spread <strong>of</strong> scores between the 5th and 95th percentile summarises the range <strong>of</strong> student<br />
performance. <strong>The</strong> goal for education systems is to have a narrow spread (that is, where <strong>students</strong><br />
are achiev<strong>in</strong>g at similar levels, rather than achiev<strong>in</strong>g wide-rang<strong>in</strong>g mean scores and for those mean<br />
scores to be high).<br />
Pr<strong>of</strong>iciency levels<br />
Responses to the <strong>PISA</strong> tests can be summarised numerically, as a scale score on each <strong>of</strong> the<br />
assessment doma<strong>in</strong>s, or as a pr<strong>of</strong>iciency level, which provides a description <strong>of</strong> the types <strong>of</strong> tasks<br />
that <strong>students</strong> should be able to perform. For each assessment doma<strong>in</strong>, a number <strong>of</strong> pr<strong>of</strong>iciency<br />
levels are described and aligned with a range <strong>of</strong> scale scores. Students who score with a range<br />
for a particular pr<strong>of</strong>iciency level are then expected to be able to complete those sorts <strong>of</strong> tasks.<br />
For example, <strong>in</strong> scientific literacy, at the lowest pr<strong>of</strong>iciency level <strong>in</strong> science, <strong>students</strong> are able to<br />
recall simple factual scientific knowledge (e.g. names, facts, term<strong>in</strong>ology, simple rules); and to use<br />
common scientific knowledge <strong>in</strong> draw<strong>in</strong>g or evaluat<strong>in</strong>g conclusions.<br />
Around the OECD average score (500 po<strong>in</strong>ts) <strong>students</strong> are typically able to use scientific<br />
knowledge to make predictions or provide explanations; to recognise questions that can be<br />
answered by scientific <strong>in</strong>vestigation and/or identify details <strong>of</strong> what is <strong>in</strong>volved <strong>in</strong> a scientific<br />
<strong>in</strong>vestigation; and to select relevant <strong>in</strong>formation from compet<strong>in</strong>g data or cha<strong>in</strong>s <strong>of</strong> reason<strong>in</strong>g <strong>in</strong><br />
draw<strong>in</strong>g or evaluat<strong>in</strong>g conclusions.<br />
Towards the high end <strong>of</strong> the science pr<strong>of</strong>iciency levels, <strong>students</strong> are generally able to create or use<br />
conceptual models to make predictions or give explanations; to analyse scientific <strong>in</strong>vestigations<br />
<strong>in</strong> order to grasp, for example, the design <strong>of</strong> an experiment or to identify an idea be<strong>in</strong>g tested;<br />
to compare data <strong>in</strong> order to evaluate alternative viewpo<strong>in</strong>ts or differ<strong>in</strong>g perspectives; and to<br />
communicate scientific arguments and/or descriptions <strong>in</strong> detail and with precision.<br />
Round<strong>in</strong>g <strong>of</strong> figures<br />
Some figures <strong>in</strong> tables may not exactly add to the totals due to the practice <strong>of</strong> round<strong>in</strong>g. Totals,<br />
differences and averages are always calculated on the basis <strong>of</strong> exact numbers and are rounded<br />
only after calculation. When standard errors have been rounded to one or two decimal places<br />
and the value 0.0 or 0.00 is shown, this does not imply that the standard error is zero, but that it is<br />
smaller than 0.05 or 0.005, respectively. In general, <strong>achievement</strong> scores are rounded to a whole<br />
number, and standard errors to one decimal place.<br />
<strong>The</strong> <strong>achievement</strong> <strong>of</strong> Australia’s <strong>Indigenous</strong> <strong>students</strong> <strong>in</strong> <strong>PISA</strong> 2000 – 2006<br />
vii
viii <strong>The</strong> <strong>achievement</strong> <strong>of</strong> Australia’s <strong>Indigenous</strong> <strong>students</strong> <strong>in</strong> <strong>PISA</strong> 2000 – 2006
Chapter<br />
1<br />
Introduction<br />
In 1997, the Organisation for Economic, Cooperation and Development (OECD) launched<br />
the Programme for International Student Assessment (<strong>PISA</strong>). <strong>The</strong> aim <strong>of</strong> <strong>PISA</strong> is to monitor the<br />
outcomes <strong>of</strong> education systems by measur<strong>in</strong>g how well <strong>students</strong> who are approach<strong>in</strong>g the end <strong>of</strong><br />
their compulsory school<strong>in</strong>g are prepared for meet<strong>in</strong>g the challenges they will face <strong>in</strong> their lives<br />
beyond school. <strong>The</strong> first <strong>PISA</strong> assessment was carried out <strong>in</strong> 2000, and has been conducted every<br />
three years s<strong>in</strong>ce then.<br />
<strong>The</strong> educational <strong>in</strong>dicators that are obta<strong>in</strong>ed from each <strong>PISA</strong> cycle are used to assess differences<br />
and similarities both at a po<strong>in</strong>t <strong>in</strong> time and over a period <strong>of</strong> time. Comparisons can be made<br />
between countries or <strong>in</strong> Australia between states. Key demographic, social and educational<br />
<strong>in</strong>fluences on student and school performance are also measured <strong>in</strong> <strong>PISA</strong>. Due to the collection<br />
<strong>of</strong> this background <strong>in</strong>formation, the data also allow detailed analysis and comparison <strong>of</strong> the<br />
performance <strong>of</strong> Australian <strong>Indigenous</strong> 1 and non-<strong>Indigenous</strong> <strong>students</strong>.<br />
In Australia, the disparity between the educational outcomes <strong>of</strong> <strong>Indigenous</strong> and non-<strong>Indigenous</strong><br />
<strong>students</strong> are well documented and <strong>of</strong> great concern. <strong>The</strong> National Declaration on Educational<br />
Goals for Young Australians reports that the educational outcomes for <strong>Indigenous</strong> <strong>students</strong> are<br />
substantially lower than compared to other <strong>students</strong> and advised:<br />
Meet<strong>in</strong>g the needs <strong>of</strong> young <strong>Indigenous</strong> Australians and promot<strong>in</strong>g high expectations<br />
for their educational performance requires strategic <strong>in</strong>vestment. Australian school<strong>in</strong>g<br />
needs to engage <strong>Indigenous</strong> <strong>students</strong>, their families and communities <strong>in</strong> all aspects <strong>of</strong><br />
school<strong>in</strong>g; <strong>in</strong>crease <strong>Indigenous</strong> participation <strong>in</strong> the education workforce at all levels; and<br />
support coord<strong>in</strong>ated community services for <strong>students</strong> and their families that can <strong>in</strong>crease<br />
productive participation <strong>in</strong> school<strong>in</strong>g.<br />
(MCEETYA, 2008, p. 15)<br />
Hunter and Schwab (2003) <strong>in</strong>vestigated the educational disadvantage faced by older <strong>Indigenous</strong><br />
<strong>students</strong>. <strong>The</strong>ir research found that the gap <strong>in</strong> higher education participation rates between<br />
<strong>Indigenous</strong> and non-<strong>Indigenous</strong> <strong>students</strong> had widened over time, while the degree <strong>of</strong> <strong>in</strong>equality <strong>in</strong><br />
educational atta<strong>in</strong>ment between these two groups <strong>in</strong>creased with the level <strong>of</strong> qualification. <strong>The</strong><br />
higher the level <strong>of</strong> qualification, the fewer <strong>Indigenous</strong> graduates compared to non-<strong>Indigenous</strong><br />
graduates.<br />
<strong>The</strong> National Report on <strong>Indigenous</strong> Education and Tra<strong>in</strong><strong>in</strong>g detailed the serious gaps between<br />
<strong>Indigenous</strong> and non-<strong>Indigenous</strong> outcomes <strong>in</strong> education (Commonwealth <strong>of</strong> Australia, 2002).<br />
Results from the Information and Communications Technology (ICT) Literacy and Civics and<br />
Citizenship sample assessments, other national assessments which test the same age group <strong>of</strong><br />
1 <strong>The</strong> term ‘<strong>Indigenous</strong>’ refers to <strong>students</strong> who identify as either Australian Aborig<strong>in</strong>al or Torres Strait<br />
Islanders. Please refer to the Reader’s Guide.<br />
<strong>The</strong> <strong>achievement</strong> <strong>of</strong> Australia’s <strong>Indigenous</strong> <strong>students</strong> <strong>in</strong> <strong>PISA</strong> 2000 – 2006 1
<strong>students</strong>, have cont<strong>in</strong>ued to show <strong>Indigenous</strong> <strong>students</strong> do not perform as well as non-<strong>Indigenous</strong><br />
<strong>students</strong>, with differences be<strong>in</strong>g both statistically significant and <strong>of</strong> a substantial nature (MCEETYA,<br />
2006; 2007).<br />
<strong>The</strong> educational disadvantage faced by <strong>Indigenous</strong> <strong>students</strong> has also been illustrated <strong>in</strong> <strong>PISA</strong>.<br />
Some <strong>of</strong> these results were <strong>in</strong>cluded <strong>in</strong> the Australian <strong>PISA</strong> reports. This report, the first <strong>of</strong> two<br />
volumes, presents a summary <strong>of</strong> results from <strong>PISA</strong> 2000, <strong>PISA</strong> 2003 and <strong>PISA</strong> 2006, as well<br />
as provid<strong>in</strong>g additional details and analysis on the performance <strong>of</strong> <strong>Indigenous</strong> <strong>students</strong>. <strong>The</strong><br />
second volume will focus on family background and contextual factors, such as socioeconomic<br />
background, and psychological factors, <strong>in</strong>clud<strong>in</strong>g beliefs and attitudes, learn<strong>in</strong>g strategies and<br />
<strong>in</strong>terests.<br />
Why <strong>PISA</strong><br />
<strong>PISA</strong> was designed to help governments not only understand but also to enhance the effectiveness<br />
<strong>of</strong> their educational systems. <strong>PISA</strong> f<strong>in</strong>d<strong>in</strong>gs are be<strong>in</strong>g used <strong>in</strong>ternationally to:<br />
◗◗<br />
◗◗<br />
◗◗<br />
compare literacy skills <strong>of</strong> <strong>students</strong> <strong>in</strong> one country to those <strong>of</strong> <strong>students</strong> <strong>in</strong> other participat<strong>in</strong>g<br />
countries;<br />
establish benchmarks for educational improvement, <strong>in</strong> terms <strong>of</strong> the mean scores achieved<br />
by other countries or <strong>in</strong> terms <strong>of</strong> a country’s capacity to provide high levels <strong>of</strong> equity <strong>in</strong><br />
educational outcomes and opportunities; and<br />
understand the relative strengths and weaknesses <strong>of</strong> <strong>in</strong>dividual education systems.<br />
<strong>PISA</strong>’s orientation towards the future <strong>of</strong> these <strong>students</strong> is reflected <strong>in</strong> its literacy approach, which is<br />
concerned with the capacity <strong>of</strong> <strong>students</strong> to apply their skills and knowledge <strong>in</strong> a particular subject<br />
area, and to analyse, reason and communicate effectively as they do so.<br />
<strong>PISA</strong> <strong>in</strong> Australia<br />
<strong>PISA</strong> is an element <strong>of</strong> the National Assessment Program <strong>in</strong> Australia. Together with the<br />
International Association for the Evaluation <strong>of</strong> Educational Achievement (IEA)’s Trends <strong>in</strong><br />
International Mathematics and Science Study (TIMSS), <strong>PISA</strong> provides data from <strong>in</strong>ternationally<br />
standardised tests that enables Australia to compare its performance to that <strong>of</strong> other countries. <strong>The</strong><br />
<strong>in</strong>ternational measures complement national literacy and numeracy assessments for <strong>students</strong> <strong>in</strong><br />
Years 3, 5, 7 and 9 and national sample assessments <strong>of</strong> Science at Year 6, Civics and Citizenship at<br />
Years 6 and 10, and Information and Communications Technology at Years 6 and 10.<br />
Report<strong>in</strong>g on the assessments is undertaken through the annual National Reports on School<strong>in</strong>g as<br />
well as through monographs and reports on particular assessments.<br />
An <strong>in</strong>dicative progress measure based on <strong>PISA</strong> results has been agreed by the Council <strong>of</strong><br />
Australian Governments (COAG) and is <strong>in</strong>cluded <strong>in</strong> the new National Education Agreement<br />
as one mechanism to measure progress towards the <strong>achievement</strong> <strong>of</strong> outcomes and aspirations<br />
for school<strong>in</strong>g. This elevates the relevance and importance <strong>of</strong> <strong>PISA</strong> as a measure <strong>of</strong> educational<br />
atta<strong>in</strong>ment <strong>in</strong> Australia.<br />
<strong>The</strong> ma<strong>in</strong> goals <strong>of</strong> <strong>PISA</strong><br />
Overall, <strong>PISA</strong> seeks to measure how well young adults, at age 15 and therefore near the end<br />
<strong>of</strong> compulsory school<strong>in</strong>g, are prepared to use knowledge and skills <strong>in</strong> particular areas to meet<br />
real-life challenges. This is <strong>in</strong> contrast to assessments that seek to measure the extent to which<br />
<strong>students</strong> have mastered a specific curriculum. <strong>PISA</strong>’s orientation reflects a change <strong>in</strong> the goals and<br />
objectives <strong>of</strong> curricula themselves, which <strong>in</strong>creas<strong>in</strong>gly address how well <strong>students</strong> are able to apply<br />
what they learn at school.<br />
2 Introduction
As part <strong>of</strong> the <strong>PISA</strong> process, <strong>students</strong> complete an extensive background questionnaire and school<br />
pr<strong>in</strong>cipals complete a survey describ<strong>in</strong>g the context <strong>of</strong> education at their school, <strong>in</strong>clud<strong>in</strong>g the<br />
level <strong>of</strong> resources <strong>in</strong> the school, qualifications <strong>of</strong> staff and teacher morale. <strong>The</strong> report<strong>in</strong>g <strong>of</strong> the<br />
f<strong>in</strong>d<strong>in</strong>gs from <strong>PISA</strong> is then able to focus on issues such as:<br />
◗◗<br />
◗◗<br />
◗◗<br />
◗◗<br />
How well are young adults prepared to meet the challenges <strong>of</strong> the future What skills do they<br />
possess that will facilitate their capacity to adapt to rapid societal change<br />
Are some ways <strong>of</strong> organis<strong>in</strong>g schools or school learn<strong>in</strong>g more effective than others<br />
What <strong>in</strong>fluence does the quality <strong>of</strong> school resources have on student outcomes<br />
What educational structures and practices maximise the opportunities <strong>of</strong> <strong>students</strong> from<br />
disadvantaged backgrounds How equitable is the provision <strong>of</strong> education with<strong>in</strong> a country or<br />
across countries<br />
What skills does <strong>PISA</strong> assess<br />
As <strong>PISA</strong>’s goal is measur<strong>in</strong>g competencies that will equip <strong>students</strong> to participate productively and<br />
adaptively <strong>in</strong> their life beyond school education, the <strong>PISA</strong> assessment focuses on young people’s<br />
ability to apply their knowledge and skills to real-life problems and situations. Are <strong>students</strong> able to<br />
analyse, reason and communicate their ideas effectively <strong>in</strong> a range <strong>of</strong> situations How well do they<br />
make use <strong>of</strong> technological advances Do they have the capacity to cont<strong>in</strong>ue learn<strong>in</strong>g throughout<br />
their lives and are they equipped with strategies to do so<br />
<strong>PISA</strong> uses the term ‘literacy’ to encompass this broad range <strong>of</strong> competencies relevant<br />
to cop<strong>in</strong>g with adult life <strong>in</strong> today’s rapidly chang<strong>in</strong>g societies. In such a context, adults<br />
need to be literate <strong>in</strong> many doma<strong>in</strong>s, as well as <strong>in</strong> the traditional literacy areas <strong>of</strong> be<strong>in</strong>g<br />
able to read and write. <strong>The</strong> OECD considers that mathematics, science and technology<br />
are sufficiently pervasive <strong>in</strong> modern life that personal fulfilment, employment, and full<br />
participation <strong>in</strong> society <strong>in</strong>creas<strong>in</strong>gly require an adult population which is not only able<br />
to read and write, but is also mathematically, scientifically and technologically literate.<br />
(OECD, 2000, p. 9)<br />
Major and m<strong>in</strong>or doma<strong>in</strong>s<br />
<strong>PISA</strong> assesses competencies <strong>in</strong> each <strong>of</strong> three core doma<strong>in</strong>s – read<strong>in</strong>g literacy, mathematical literacy<br />
and scientific literacy. Dur<strong>in</strong>g each <strong>PISA</strong> cycle one doma<strong>in</strong> is tested <strong>in</strong> detail and is referred to<br />
as the ‘major’ doma<strong>in</strong>. <strong>The</strong> rema<strong>in</strong><strong>in</strong>g time is allocated to assess<strong>in</strong>g the other (m<strong>in</strong>or) doma<strong>in</strong>s.<br />
In 2000, the major doma<strong>in</strong> was read<strong>in</strong>g literacy, with mathematical literacy and scientific<br />
literacy mak<strong>in</strong>g up the m<strong>in</strong>or doma<strong>in</strong>s. In 2003, the emphasis moved from read<strong>in</strong>g literacy to<br />
mathematical literacy as the major doma<strong>in</strong>. In 2006, the major focus <strong>of</strong> the assessment was<br />
scientific literacy, with read<strong>in</strong>g literacy and mathematical literacy form<strong>in</strong>g the m<strong>in</strong>or doma<strong>in</strong>s.<br />
<strong>The</strong> doma<strong>in</strong>s covered by <strong>PISA</strong> are def<strong>in</strong>ed <strong>in</strong> terms <strong>of</strong> the content that <strong>students</strong> need to acquire,<br />
the processes that need to be performed, and the contexts <strong>in</strong> which knowledge and skills are<br />
applied. <strong>The</strong> assessments are based on frameworks that provide a common language and a vehicle<br />
for discuss<strong>in</strong>g the purpose <strong>of</strong> the assessment and what it is try<strong>in</strong>g to measure. Work<strong>in</strong>g groups<br />
consist<strong>in</strong>g <strong>of</strong> subject matter experts were formed to develop the assessment frameworks, which<br />
are subsequently considered and approved by the <strong>PISA</strong> Govern<strong>in</strong>g Board (PGB) established by<br />
the OECD. <strong>The</strong>se frameworks are revised for the major doma<strong>in</strong> <strong>in</strong> each cycle. Each <strong>of</strong> the three<br />
doma<strong>in</strong>s is described briefly <strong>in</strong> the relevant chapter <strong>of</strong> this report.<br />
<strong>The</strong> <strong>achievement</strong> <strong>of</strong> Australia’s <strong>Indigenous</strong> <strong>students</strong> <strong>in</strong> <strong>PISA</strong> 2000 – 2006 3
Skills for life<br />
Without further follow-up <strong>of</strong> future educational and occupational outcomes <strong>of</strong> the <strong>students</strong><br />
assessed <strong>in</strong> <strong>PISA</strong>, it is not possible to say how relevant their skills at age 15 will be <strong>in</strong> later life.<br />
However, there is evidence from both the International Adult Literacy Survey (IALS) and the<br />
Longitud<strong>in</strong>al Surveys <strong>of</strong> Australian Youth (LSAY) <strong>of</strong> differential future educational success and<br />
labour market experiences <strong>of</strong> people with higher and lower <strong>achievement</strong> <strong>in</strong> literacy.<br />
More specifically, there is evidence from LSAY that school completion is strongly correlated with<br />
<strong>PISA</strong> <strong>achievement</strong> outcomes (Hillman & Thomson, 2006). Further evidence from the longitud<strong>in</strong>al<br />
follow-up <strong>of</strong> <strong>students</strong> <strong>in</strong> Canada who had participated <strong>in</strong> the <strong>PISA</strong> 2000 read<strong>in</strong>g assessment<br />
also showed that the <strong>PISA</strong> performance <strong>of</strong> <strong>students</strong> at age 15 was a very strong predictor for a<br />
successful transition to higher education at age 19.<br />
How results are reported<br />
International comparative studies have provided an arena to observe the similarities and<br />
differences that stem from different educational polices and practices, and have enabled<br />
researchers and others to observe what is possible for <strong>students</strong> to achieve, and which<br />
environments are most likely to facilitate their learn<strong>in</strong>g. <strong>PISA</strong> provides regular <strong>in</strong>formation on<br />
educational outcomes with<strong>in</strong> and across countries by provid<strong>in</strong>g <strong>in</strong>sight about the range <strong>of</strong> skills<br />
and competencies, <strong>in</strong> different assessment doma<strong>in</strong>s, that are considered to be essential to an<br />
<strong>in</strong>dividual’s ability to participate and contribute to society.<br />
As is the practice <strong>in</strong> other <strong>in</strong>ternational studies, <strong>PISA</strong> results are reported as means, which <strong>in</strong>dicate<br />
average performance, and various statistics that reflect the distribution <strong>of</strong> performance. <strong>PISA</strong> also<br />
attaches mean<strong>in</strong>g to the performance scale by provid<strong>in</strong>g a pr<strong>of</strong>ile <strong>of</strong> what <strong>students</strong> have achieved<br />
<strong>in</strong> terms <strong>of</strong> skills and knowledge. <strong>The</strong> performance scale is divided <strong>in</strong>to levels <strong>of</strong> difficulty, referred<br />
to as ‘described pr<strong>of</strong>iciency levels’. Students at a particular level not only typically demonstrate<br />
the knowledge and skills associated with that level but also the pr<strong>of</strong>iciencies required at lower<br />
levels.<br />
In <strong>PISA</strong> 2000, five pr<strong>of</strong>iciency levels were def<strong>in</strong>ed for the major doma<strong>in</strong> <strong>of</strong> read<strong>in</strong>g literacy. In<br />
2003 and 2006, six levels <strong>of</strong> pr<strong>of</strong>iciency were def<strong>in</strong>ed for the respective major doma<strong>in</strong>s <strong>of</strong><br />
mathematical literacy and scientific literacy.<br />
Conduct<strong>in</strong>g <strong>PISA</strong><br />
What do <strong>PISA</strong> participants do<br />
Students who participate <strong>in</strong> <strong>PISA</strong> complete an assessment booklet that conta<strong>in</strong>s questions about<br />
one or more <strong>of</strong> the literacy doma<strong>in</strong>s be<strong>in</strong>g tested and a Student Questionnaire.<br />
Test<strong>in</strong>g occurs dur<strong>in</strong>g the morn<strong>in</strong>g and <strong>students</strong> are given two hours to complete the assessment<br />
booklet and 30 to 40 m<strong>in</strong>utes to complete the Student Questionnaire. In <strong>PISA</strong> 2000, there were<br />
10 assessment booklets, and <strong>in</strong> <strong>PISA</strong> 2003 and <strong>PISA</strong> 2006 there were 13 assessment booklets.<br />
<strong>The</strong> booklets are assembled accord<strong>in</strong>g to a complex design so that each booklet is l<strong>in</strong>ked through<br />
common items to other booklets <strong>in</strong> a balanced way.<br />
In each <strong>PISA</strong> cycle, all booklets conta<strong>in</strong> items from the major doma<strong>in</strong>, and a rotation system is<br />
used to distribute items from the m<strong>in</strong>or doma<strong>in</strong>s evenly across the booklets. This distribution <strong>of</strong> the<br />
different items across the booklets means that a broader range <strong>of</strong> tasks can be assessed <strong>in</strong> the same<br />
amount <strong>of</strong> time, as well as enhanc<strong>in</strong>g the validity <strong>of</strong> the adm<strong>in</strong>istration as <strong>students</strong> are unlikely<br />
to be do<strong>in</strong>g the same booklet as <strong>students</strong> around them. Item Response <strong>The</strong>ory is used to l<strong>in</strong>k<br />
common items from the different booklets.<br />
4 Introduction
<strong>The</strong> Student Questionnaire, which is the same across all participat<strong>in</strong>g countries, collects<br />
<strong>in</strong>formation on <strong>students</strong> and their family background, aspects <strong>of</strong> learn<strong>in</strong>g and <strong>in</strong>struction <strong>in</strong> the<br />
major doma<strong>in</strong> <strong>of</strong> assessment for that cycle, and the context <strong>of</strong> <strong>in</strong>struction, <strong>in</strong>clud<strong>in</strong>g <strong>in</strong>structional<br />
time and class size.<br />
<strong>The</strong> School Questionnaire, answered by the pr<strong>in</strong>cipal (or the pr<strong>in</strong>cipal’s designate), collects<br />
descriptive <strong>in</strong>formation about the school and <strong>in</strong>formation about <strong>in</strong>structional practices. For<br />
example, questions are asked about qualifications <strong>of</strong> teachers and numbers <strong>of</strong> staff, teacher<br />
morale, school and teacher autonomy, school resources, and school policies and practices, such as<br />
use <strong>of</strong> student assessments.<br />
In Australia, a National Advisory Committee guides all aspects <strong>of</strong> the project. <strong>The</strong> National<br />
Project Manager is responsible for the implementation <strong>of</strong> <strong>PISA</strong> at the national level. Prior to the<br />
beg<strong>in</strong>n<strong>in</strong>g <strong>of</strong> the first round <strong>of</strong> <strong>PISA</strong>, the National Advisory Committee recommended a process<br />
<strong>of</strong> oversampl<strong>in</strong>g <strong>Indigenous</strong> <strong>students</strong> to reliably report results for this m<strong>in</strong>ority group. <strong>ACER</strong> (the<br />
National Project Manager <strong>in</strong> Australia) liaises with schools to ga<strong>in</strong> their participation and help with<br />
the logistics <strong>of</strong> arrang<strong>in</strong>g assessment sessions.<br />
Who participates <strong>in</strong> <strong>PISA</strong><br />
Countries<br />
<strong>PISA</strong> was orig<strong>in</strong>ally an OECD assessment, created by the governments <strong>of</strong> OECD countries. <strong>The</strong><br />
first <strong>PISA</strong> assessment <strong>of</strong> 15-year-old <strong>students</strong> <strong>in</strong> 2000 took place <strong>in</strong> 28 OECD countries (<strong>in</strong>clud<strong>in</strong>g<br />
Australia) and four non-OECD (or partner) countries. S<strong>in</strong>ce then, it has become a major<br />
assessment tool <strong>in</strong> many regions and countries around the world. In 2001, 11 partner countries<br />
repeated <strong>PISA</strong> 2000. In 2003, more than one-quarter <strong>of</strong> a million <strong>students</strong> from 41 countries (all<br />
30 OECD member countries and 11 non-OECD countries) participated <strong>in</strong> <strong>PISA</strong>, and <strong>in</strong> 2006,<br />
almost 400,000 <strong>students</strong> from 57 countries (all OECD countries and 27 partner countries) took part<br />
<strong>in</strong> the assessment.<br />
Schools<br />
In most countries 150 schools and 35 <strong>students</strong> <strong>in</strong> each school are randomly selected to participate<br />
<strong>in</strong> <strong>PISA</strong>. In some countries, <strong>in</strong>clud<strong>in</strong>g Australia, a larger sample <strong>of</strong> schools and <strong>students</strong><br />
participate. This allows countries to carry out specific national options at the same time as the<br />
<strong>PISA</strong> assessment, or for mean<strong>in</strong>gful comparisons to be made between different sectors <strong>of</strong> the<br />
population.<br />
In Australia, a larger sample <strong>of</strong> schools and <strong>students</strong> are gathered for three ma<strong>in</strong> reasons:<br />
◗◗<br />
◗◗<br />
◗◗<br />
To allow comparison between the States and Territories. It is necessary to ‘oversample’ the<br />
smaller states because a random sample proportionate to state populations would not yield<br />
sufficient <strong>students</strong> <strong>in</strong> the smaller states to give a result that would be sufficiently precise;<br />
To allow exam<strong>in</strong>ation <strong>of</strong> <strong>Indigenous</strong> student performance. A special focus <strong>in</strong> <strong>PISA</strong> <strong>in</strong> Australia<br />
has been to ensure that there is a sufficiently large sample <strong>of</strong> Australia’s <strong>Indigenous</strong> <strong>students</strong>, so<br />
that valid and reliable separate analysis can be conducted; and<br />
To allow for longitud<strong>in</strong>al follow-up <strong>of</strong> participat<strong>in</strong>g <strong>students</strong>. <strong>The</strong> <strong>PISA</strong> 2003 and 2006 samples<br />
became a cohort <strong>of</strong> the Longitud<strong>in</strong>al Surveys <strong>of</strong> Australian Youth (LSAY). <strong>The</strong>se <strong>students</strong> are<br />
tracked, and contacted <strong>in</strong> future years to trace their progress through school and entry <strong>in</strong>to<br />
further education and the work force. A large sample is needed to allow for attrition: over time<br />
a proportion <strong>of</strong> the orig<strong>in</strong>al sample is not able to be traced or chooses to leave the study.<br />
In <strong>PISA</strong> 2000 there were 231 schools <strong>in</strong> the achieved Australian sample. In <strong>PISA</strong> 2003 and<br />
<strong>PISA</strong> 2006 the sample <strong>of</strong> schools <strong>in</strong>creased to 321 and 356, respectively. <strong>The</strong> Australian school<br />
sample is designed so that schools are selected with a probability proportional to the enrolment <strong>of</strong><br />
<strong>The</strong> <strong>achievement</strong> <strong>of</strong> Australia’s <strong>Indigenous</strong> <strong>students</strong> <strong>in</strong> <strong>PISA</strong> 2000 – 2006 5
15-year-olds <strong>in</strong> each school. Stratification ensures the correct ratios <strong>of</strong> government, Catholic and<br />
<strong>in</strong>dependent sectors.<br />
<strong>The</strong> <strong>PISA</strong> participat<strong>in</strong>g schools were also stratified with respect to the MCEEETYA Schools<br />
Geographic Location Classification 2 . In <strong>PISA</strong> 2000, 69 per cent <strong>of</strong> the schools were located <strong>in</strong><br />
the metropolitan zone, 30 per cent were from prov<strong>in</strong>cial zones and one per cent <strong>of</strong> schools were<br />
<strong>in</strong> remote areas. Similar proportions <strong>of</strong> schools were selected for <strong>PISA</strong> 2003, with 72 per cent<br />
<strong>of</strong> schools located <strong>in</strong> metropolitan zones, 27 per cent from prov<strong>in</strong>cial zones and one per cent <strong>in</strong><br />
remote locations. In <strong>PISA</strong> 2006, 65 per cent <strong>of</strong> schools were located <strong>in</strong> the metropolitan zone, 30<br />
per cent from prov<strong>in</strong>cial zones and around five per cent <strong>of</strong> schools were <strong>in</strong> remote areas.<br />
Students<br />
<strong>The</strong> target population for <strong>PISA</strong> is <strong>students</strong> who are 15-years-old and enrolled at an educational<br />
<strong>in</strong>stitution, either full- or part-time, at the time <strong>of</strong> test<strong>in</strong>g 3 .<br />
From each country, a random sample <strong>of</strong> 35 <strong>students</strong> is selected with equal probability from<br />
each school us<strong>in</strong>g a list <strong>of</strong> all 15-year-old <strong>students</strong> that is submitted by the school. Schools were<br />
requested to provide <strong>in</strong>formation such as date <strong>of</strong> birth, sex and year level as well as <strong>Indigenous</strong><br />
status for their 15-year-old <strong>students</strong>.<br />
In <strong>PISA</strong> 2000, 35 <strong>students</strong> were randomly selected from each Australian school and <strong>in</strong> <strong>PISA</strong><br />
2003 and <strong>PISA</strong> 2006 the Australian student sample was <strong>in</strong>creased to 50 <strong>students</strong> per school<br />
(for the reasons described earlier). In addition to the general <strong>in</strong>crease <strong>in</strong> sample size, to ensure<br />
the <strong>Indigenous</strong> sample was as large as possible, all age eligible <strong>Indigenous</strong> <strong>students</strong> from all<br />
participat<strong>in</strong>g schools were sampled and asked to participate <strong>in</strong> <strong>PISA</strong>.<br />
<strong>The</strong> Australian student sample was drawn from all states and sectors and Table 1.1 shows the<br />
number <strong>of</strong> participat<strong>in</strong>g <strong>students</strong> <strong>in</strong> <strong>PISA</strong> 2000, <strong>PISA</strong> 2003 and <strong>PISA</strong> 2006, along with the size <strong>of</strong><br />
the underly<strong>in</strong>g population.<br />
Table 1.1: Number <strong>of</strong> Australian <strong>PISA</strong> Students 4<br />
<strong>PISA</strong> Sample N Population N 4<br />
2000 5 477 228 331<br />
2003 12 551 235 593<br />
2006 14 170 234 938<br />
Table 1.2 shows the number <strong>of</strong> <strong>Indigenous</strong> and non-<strong>Indigenous</strong> <strong>students</strong> who participated <strong>in</strong> <strong>PISA</strong>.<br />
<strong>The</strong> Australian Bureau <strong>of</strong> Statistics (2007) reported the estimated resident <strong>Indigenous</strong> population <strong>of</strong><br />
Australia for 2006 at 2.5 per cent <strong>of</strong> the total population.<br />
Table 1.2: Number <strong>of</strong> <strong>Indigenous</strong> and non-<strong>Indigenous</strong> <strong>students</strong> <strong>in</strong> <strong>PISA</strong> 2000, <strong>PISA</strong> 2003 and <strong>PISA</strong> 2006<br />
<strong>Indigenous</strong> <strong>students</strong><br />
Non-<strong>Indigenous</strong> <strong>students</strong><br />
<strong>PISA</strong><br />
Sample N Population N Weighted % Sample N Population N<br />
2000 493 5 440 2.4 4 984 222 892<br />
2003 815 5 193 2.2 11 736 230 398<br />
2006 1080 6 891 2.9 13 090 228 049<br />
2 Refer to the Reader’s Guide for a def<strong>in</strong>ition <strong>of</strong> geographic location.<br />
3 Refer to the Reader’s Guide.<br />
4 This is the weighted number <strong>of</strong> <strong>students</strong>.<br />
6 Introduction
In <strong>PISA</strong> 2000, there was a slight gender imbalance across the entire sample <strong>of</strong> <strong>students</strong>, with 53<br />
per cent <strong>of</strong> the sample be<strong>in</strong>g male. In <strong>PISA</strong> 2003 and aga<strong>in</strong> <strong>in</strong> <strong>PISA</strong> 2006, the magnitude <strong>of</strong> the<br />
gender imbalance was almost negligible, with 51 per cent <strong>of</strong> the sample male <strong>students</strong>.<br />
Among participat<strong>in</strong>g <strong>Indigenous</strong> <strong>students</strong>, there were similar numbers <strong>of</strong> male and female <strong>students</strong><br />
<strong>in</strong> each cycle. Table 1.3 provides a breakdown <strong>of</strong> <strong>Indigenous</strong> and non-<strong>Indigenous</strong> <strong>students</strong> by<br />
gender for each <strong>PISA</strong> cycle.<br />
<strong>PISA</strong><br />
Indig.<br />
Females<br />
%<br />
Sample<br />
N<br />
Table 1.3: Number <strong>of</strong> <strong>Indigenous</strong> and non-<strong>Indigenous</strong> <strong>students</strong> by gender <strong>in</strong> <strong>PISA</strong> 2000, <strong>PISA</strong> 2003 and<br />
<strong>PISA</strong> 2006<br />
<strong>Indigenous</strong> <strong>students</strong><br />
Non-<strong>Indigenous</strong> <strong>students</strong><br />
Females Males<br />
Non-<br />
Indig<br />
Females Males<br />
Population<br />
N<br />
Sample<br />
N<br />
Population<br />
N<br />
Females<br />
%<br />
Sample<br />
N<br />
Population<br />
N<br />
Sample<br />
N<br />
Population<br />
N<br />
2000 51 256 2 772 237 2 667 47 2 393 105 462 2 591 117 430<br />
2003 47 400 2 462 415 2 730 49 5 816 113 366 5 920 117 032<br />
2006 49 537 3 405 543 3 486 49 6 441 111 387 6 649 116 662<br />
As the sample is age-based, the <strong>students</strong> may be enrolled <strong>in</strong> different year levels, although the<br />
majority are from Year 9, 10 and 11. <strong>The</strong>re are some variations to the year-level composition <strong>of</strong><br />
the sample because <strong>of</strong> differ<strong>in</strong>g school start<strong>in</strong>g ages <strong>in</strong> the different states. Table 1.4 shows the<br />
percentage <strong>of</strong> <strong>Indigenous</strong> and non-<strong>Indigenous</strong> <strong>students</strong> at each year level.<br />
Table 1.4: Distribution <strong>of</strong> <strong>Indigenous</strong> and non-<strong>Indigenous</strong> <strong>students</strong> by year level <strong>in</strong> <strong>PISA</strong> 2000, <strong>PISA</strong> 2003<br />
and <strong>PISA</strong> 2006<br />
<strong>Indigenous</strong> <strong>students</strong><br />
non-<strong>Indigenous</strong> <strong>students</strong><br />
<strong>PISA</strong><br />
Year level #, ∈<br />
(%)<br />
Year level #, ∈<br />
(%)<br />
8 9 10 11 12 8 9 10 11 12<br />
2000 ∈ 7 74 19 0 ∈ 7 76 17 0<br />
2003 ∈ 10 74 16 ∈ ∈ 8 72 19 ∈<br />
2006 ∈ 9 59 32 0 ∈ 9 71 20 ∈<br />
# Totals may not add up to 100 because <strong>of</strong> round<strong>in</strong>g.<br />
∈ Percentage 0.2<br />
In <strong>PISA</strong> 2006, there were a higher percentage <strong>of</strong> <strong>Indigenous</strong> <strong>students</strong> who were <strong>in</strong> Year 11 and<br />
fewer <strong>Indigenous</strong> <strong>students</strong> <strong>in</strong> Year 10 than compared to <strong>PISA</strong> 2000 and <strong>PISA</strong> 2003. Further<br />
<strong>in</strong>vestigation showed that there were 23 per cent <strong>of</strong> <strong>Indigenous</strong> <strong>students</strong> aged between 15 years<br />
and 9 months and 16 years and 2 months who were <strong>in</strong> Year 11 <strong>in</strong> <strong>PISA</strong> 2006 compared to 12 per<br />
cent <strong>in</strong> <strong>PISA</strong> 2003.<br />
In <strong>PISA</strong> 2000 and <strong>PISA</strong> 2003, almost all <strong>of</strong> the <strong>Indigenous</strong> <strong>students</strong> sampled were from schools <strong>in</strong><br />
metropolitan and prov<strong>in</strong>cial locations with very few from schools <strong>in</strong> remote areas. In <strong>PISA</strong> 2006,<br />
however, a higher proportion <strong>of</strong> <strong>Indigenous</strong> <strong>students</strong> <strong>in</strong> the sample were from schools <strong>in</strong> remote<br />
areas (Table 1.5).<br />
Table 1.5: Distribution <strong>of</strong> <strong>Indigenous</strong> <strong>students</strong> by geographic location <strong>in</strong> <strong>PISA</strong> 2000, <strong>PISA</strong> 2003 and<br />
<strong>PISA</strong> 2006<br />
<strong>PISA</strong><br />
Geographic location (%)<br />
Metropolitan Prov<strong>in</strong>cial Remote<br />
2000 44 54 2<br />
2003 50 49 2<br />
2006 37 44 19<br />
<strong>The</strong> <strong>achievement</strong> <strong>of</strong> Australia’s <strong>Indigenous</strong> <strong>students</strong> <strong>in</strong> <strong>PISA</strong> 2000 – 2006 7
Table 1.6 shows the distribution <strong>of</strong> <strong>Indigenous</strong> <strong>students</strong> by socioeconomic background 5 <strong>in</strong> <strong>PISA</strong>.<br />
Socioeconomic quartiles are def<strong>in</strong>ed on the whole population, so the distribution <strong>of</strong> <strong>Indigenous</strong><br />
<strong>students</strong>’ scores should be approximately the same across quartiles; however the table shows that<br />
<strong>Indigenous</strong> <strong>students</strong> are overrepresented <strong>in</strong> the lowest quartile <strong>of</strong> socioeconomic background and<br />
underrepresented <strong>in</strong> the highest quartile.<br />
Table 1.6: Distribution <strong>of</strong> <strong>Indigenous</strong> <strong>students</strong> by socioeconomic background <strong>in</strong> <strong>PISA</strong> 2000, <strong>PISA</strong> 2003<br />
and <strong>PISA</strong> 2006<br />
<strong>PISA</strong><br />
Lowest<br />
quartile<br />
Socioeconomic status<br />
Second<br />
quartile<br />
Third<br />
quartile<br />
Highest<br />
quartile<br />
2000 37 29 20 13<br />
2003 41 22 22 14<br />
2006 44 24 23 10<br />
<strong>PISA</strong> so far<br />
Table 1.7 provides a summary <strong>of</strong> Australian results from <strong>PISA</strong> 2000, 2003 and 2006. Results<br />
are reported for Australia and for the highest and lowest perform<strong>in</strong>g countries <strong>in</strong> each doma<strong>in</strong> <strong>of</strong><br />
assessment. Figures refer to mean scores po<strong>in</strong>ts on the relevant <strong>PISA</strong> literacy scales and the figures<br />
with<strong>in</strong> the brackets refer to standard errors for the associated mean scores.<br />
Table 1.7: A summary <strong>of</strong> results from <strong>PISA</strong><br />
<strong>PISA</strong><br />
2000 2003 2006<br />
MAJOR DOMAIN Read<strong>in</strong>g literacy Mathematical literacy Scientific literacy<br />
MINOR DOMAINS<br />
Mathematical literacy Read<strong>in</strong>g literacy Mathematical literacy<br />
Scientific literacy Scientific literacy Read<strong>in</strong>g literacy<br />
AUSTRALIA’S PERFORMANCE<br />
Read<strong>in</strong>g Literacy 528 (3.5) 525 (2.1) 513 (2.1)<br />
Mathematical Literacy 533 (3.5) 524 (2.1) 520 (2.2)<br />
Scientific Literacy 528 (3.5) 525 (2.1) 527 (2.3)<br />
HIGHEST PERFORMING COUNTRY<br />
Read<strong>in</strong>g Literacy F<strong>in</strong>land 546 (2.6) F<strong>in</strong>land 543 (1.6) Korea 556 (3.8)<br />
Mathematical Literacy Japan 557 (5.5) Hong Kong-Ch<strong>in</strong>a 550 (4.5) Ch<strong>in</strong>ese Taipei 549 (4.1)<br />
Scientific Literacy Korea 552 (2.7) F<strong>in</strong>land 548 (1.9) F<strong>in</strong>land 563 (2.0)<br />
LOWEST PERFORMING COUNTRY<br />
Read<strong>in</strong>g Literacy Brazil 396 (3.1) Tunisia 375 (2.8) Kyrgyzstan 285 (3.5)<br />
Mathematical Literacy Brazil 334 (3.7) Tunisia 385 (2.6) Kyrgyzstan 311 (3.4)<br />
Scientific Literacy Brazil 375 (3.3) Brazil 356 (4.8) Kyrgyzstan 332 (2.9)<br />
Organisation <strong>of</strong> the report<br />
This report focuses on <strong>Indigenous</strong> and non-<strong>Indigenous</strong> <strong>students</strong>’ results from <strong>PISA</strong> 2000, <strong>PISA</strong><br />
2003 and <strong>PISA</strong> 2006 <strong>in</strong> the areas <strong>of</strong> read<strong>in</strong>g literacy, mathematical literacy and scientific literacy.<br />
Chapters 2, 3 and 4 focus on each <strong>of</strong> these assessment doma<strong>in</strong>s <strong>in</strong> turn. Chapter 5 presents a<br />
summary <strong>of</strong> the f<strong>in</strong>d<strong>in</strong>gs and policy implications.<br />
5 Socioeconomic measure is HISEI. See Reader’s Guide for a further description <strong>of</strong> the socioeconomic<br />
variable.<br />
8 Introduction
Chapter<br />
2<br />
Read<strong>in</strong>g<br />
literacy<br />
<strong>The</strong> assessments conducted as part <strong>of</strong> <strong>PISA</strong> provide <strong>in</strong>formation about how well young adults<br />
use their knowledge and skills to participate <strong>in</strong> today’s chang<strong>in</strong>g world. <strong>The</strong> first <strong>PISA</strong> assessment<br />
<strong>in</strong> 2000 provided a detailed <strong>in</strong>sight <strong>in</strong>to read<strong>in</strong>g literacy performance and skills <strong>of</strong> 15-year-old<br />
<strong>students</strong>.<br />
In 2000, when read<strong>in</strong>g literacy was the major doma<strong>in</strong> <strong>of</strong> assessment <strong>in</strong> <strong>PISA</strong>, three read<strong>in</strong>g<br />
literacy subscales were created and used for report<strong>in</strong>g read<strong>in</strong>g pr<strong>of</strong>iciency: retriev<strong>in</strong>g <strong>in</strong>formation;<br />
<strong>in</strong>terpret<strong>in</strong>g texts; and reflection and evaluation. In <strong>PISA</strong> 2003 and <strong>PISA</strong> 2006 read<strong>in</strong>g literacy was<br />
a m<strong>in</strong>or doma<strong>in</strong> and so only the results <strong>of</strong> the overall read<strong>in</strong>g literacy scale were reported.<br />
<strong>The</strong> first part <strong>of</strong> this chapter provides a summary <strong>of</strong> read<strong>in</strong>g literacy and how it is measured 6 . <strong>The</strong><br />
rema<strong>in</strong><strong>in</strong>g parts <strong>of</strong> the chapter exam<strong>in</strong>e <strong>Indigenous</strong> <strong>students</strong>’ performance <strong>in</strong> read<strong>in</strong>g literacy.<br />
Def<strong>in</strong>ition <strong>of</strong> Read<strong>in</strong>g Literacy<br />
<strong>The</strong> <strong>PISA</strong> concept <strong>of</strong> read<strong>in</strong>g literacy emphasises skills <strong>in</strong> us<strong>in</strong>g written <strong>in</strong>formation <strong>in</strong> situations<br />
that <strong>students</strong> may encounter <strong>in</strong> their life both at and beyond school. <strong>The</strong> <strong>PISA</strong> framework (OECD,<br />
2006) def<strong>in</strong>es read<strong>in</strong>g literacy as:<br />
… understand<strong>in</strong>g, us<strong>in</strong>g and reflect<strong>in</strong>g on written texts, <strong>in</strong> order to achieve one’s goals,<br />
to develop one’s knowledge and potential and to participate <strong>in</strong> society.<br />
(p. 46)<br />
This def<strong>in</strong>ition goes beyond the traditional notion <strong>of</strong> read<strong>in</strong>g literacy as decod<strong>in</strong>g <strong>in</strong>formation<br />
and literal comprehension. It <strong>in</strong>cludes understand<strong>in</strong>g texts at a general level, <strong>in</strong>terpret<strong>in</strong>g them,<br />
reflect<strong>in</strong>g on their content and form <strong>in</strong> relation to the reader’s own knowledge <strong>of</strong> the world, and<br />
argu<strong>in</strong>g a po<strong>in</strong>t <strong>of</strong> view <strong>in</strong> relation to what has been read. <strong>The</strong> def<strong>in</strong>ition <strong>in</strong>corporates the <strong>PISA</strong><br />
emphasis on acquir<strong>in</strong>g skills that will be relevant throughout life.<br />
How read<strong>in</strong>g literacy is measured<br />
<strong>The</strong> concept <strong>of</strong> read<strong>in</strong>g literacy <strong>in</strong> <strong>PISA</strong> is def<strong>in</strong>ed by three dimensions: the format <strong>of</strong> the read<strong>in</strong>g<br />
material, the type <strong>of</strong> read<strong>in</strong>g task or read<strong>in</strong>g processes, and the situation or the use for which the<br />
text was constructed.<br />
As read<strong>in</strong>g literacy was the major doma<strong>in</strong> <strong>of</strong> assessment <strong>in</strong> <strong>PISA</strong> 2000, most <strong>of</strong> the test<strong>in</strong>g time<br />
was devoted to this doma<strong>in</strong>. In 2003 and 2006, with read<strong>in</strong>g literacy be<strong>in</strong>g a m<strong>in</strong>or doma<strong>in</strong>,<br />
6 Information about the read<strong>in</strong>g literacy assessment framework has been taken from the <strong>PISA</strong> 2006 National<br />
Report, Explor<strong>in</strong>g Scientific Literacy: How Australia measures up.<br />
<strong>The</strong> <strong>achievement</strong> <strong>of</strong> Australia’s <strong>Indigenous</strong> <strong>students</strong> <strong>in</strong> <strong>PISA</strong> 2000 – 2006 9
less overall test<strong>in</strong>g time was devoted to read<strong>in</strong>g literacy. However, <strong>in</strong> each <strong>of</strong> the <strong>PISA</strong> cycles<br />
the distribution <strong>of</strong> read<strong>in</strong>g literacy items across the processes has rema<strong>in</strong>ed the same. Half <strong>of</strong><br />
the assessed read<strong>in</strong>g literacy items measure <strong>students</strong>’ read<strong>in</strong>g skills <strong>in</strong> retriev<strong>in</strong>g <strong>in</strong>formation, 20<br />
per cent measure <strong>in</strong>terpret<strong>in</strong>g texts, and the rema<strong>in</strong><strong>in</strong>g 30 per cent <strong>of</strong> items assess reflection and<br />
evaluation.<br />
Text format<br />
<strong>The</strong> text format or the structure <strong>of</strong> the read<strong>in</strong>g material makes a dist<strong>in</strong>ction between cont<strong>in</strong>uous<br />
and non-cont<strong>in</strong>uous texts. Cont<strong>in</strong>uous texts are typically composed <strong>of</strong> sentences that are, <strong>in</strong> turn,<br />
organised <strong>in</strong>to paragraphs. <strong>The</strong>se may fit <strong>in</strong>to even larger structures such as sections, chapters and<br />
books. Examples <strong>of</strong> cont<strong>in</strong>uous texts are narration, exposition, argumentation, <strong>in</strong>struction and<br />
hypertext. Non-cont<strong>in</strong>uous texts are organised differently from cont<strong>in</strong>uous texts and so require<br />
different k<strong>in</strong>ds <strong>of</strong> read<strong>in</strong>g approaches. Non-cont<strong>in</strong>uous texts are classified by their formats; for<br />
example, charts and graphs, diagrams, maps, and <strong>in</strong>formation sheets.<br />
Processes<br />
<strong>The</strong> <strong>PISA</strong> read<strong>in</strong>g assessment measures the follow<strong>in</strong>g five processes associated with achiev<strong>in</strong>g a full<br />
understand<strong>in</strong>g <strong>of</strong> a text: retriev<strong>in</strong>g <strong>in</strong>formation; form<strong>in</strong>g a broad general understand<strong>in</strong>g; develop<strong>in</strong>g<br />
an <strong>in</strong>terpretation; reflect<strong>in</strong>g on and evaluat<strong>in</strong>g the context <strong>of</strong> a text; and reflect<strong>in</strong>g on and<br />
evaluat<strong>in</strong>g the form <strong>of</strong> a text. It is expected that all readers, irrespective <strong>of</strong> their overall pr<strong>of</strong>iciency,<br />
will be able to demonstrate some level <strong>of</strong> competency <strong>in</strong> each <strong>of</strong> these areas.<br />
For report<strong>in</strong>g purposes <strong>in</strong> <strong>PISA</strong> 2000, the five processes were collapsed <strong>in</strong>to three larger categories<br />
(form<strong>in</strong>g the read<strong>in</strong>g literacy subscales): retriev<strong>in</strong>g <strong>in</strong>formation, <strong>in</strong>terpret<strong>in</strong>g texts (comb<strong>in</strong><strong>in</strong>g the<br />
two processes that require <strong>students</strong> to focus on relationships with<strong>in</strong> a text), and reflect<strong>in</strong>g and<br />
evaluat<strong>in</strong>g (comb<strong>in</strong><strong>in</strong>g the two processes that require <strong>students</strong> to reflect on and evaluate content<br />
or form <strong>of</strong> text - form<strong>in</strong>g a broad understand<strong>in</strong>g and develop<strong>in</strong>g an <strong>in</strong>terpretation). In 2003 and<br />
2006, results for read<strong>in</strong>g are reported on a s<strong>in</strong>gle read<strong>in</strong>g literacy scale that comb<strong>in</strong>es elements <strong>of</strong><br />
the three different categories <strong>of</strong> processes.<br />
Situations<br />
<strong>The</strong> read<strong>in</strong>g situation refers to the use for which the text was constructed and can be understood as<br />
a general categorisation <strong>of</strong> texts based on the author’s <strong>in</strong>tended use, on the relationship with other<br />
persons implicitly or explicitly associated with the text, and on the general content <strong>of</strong> the text.<br />
<strong>The</strong> texts used <strong>in</strong> the assessment were drawn from a variety <strong>of</strong> situations to maximise the diversity<br />
<strong>of</strong> content <strong>in</strong>cluded <strong>in</strong> <strong>PISA</strong>. Four different situations were <strong>in</strong>cluded <strong>in</strong> the assessments: read<strong>in</strong>g<br />
for private use (personal), read<strong>in</strong>g for public use, read<strong>in</strong>g for work (occupational) and read<strong>in</strong>g for<br />
education.<br />
A more detailed description <strong>of</strong> the conceptual framework underly<strong>in</strong>g the <strong>PISA</strong> read<strong>in</strong>g literacy<br />
assessment is provided <strong>in</strong> the publication, Assess<strong>in</strong>g Scientific, Read<strong>in</strong>g and Mathematical Literacy:<br />
A Framework for <strong>PISA</strong> 2006 (OECD, 2006).<br />
Read<strong>in</strong>g literacy performance: scale scores<br />
On average, <strong>Indigenous</strong> <strong>students</strong> performed at a significantly lower level <strong>in</strong> read<strong>in</strong>g literacy<br />
compared to non-<strong>Indigenous</strong> <strong>students</strong> <strong>in</strong> each <strong>of</strong> the three <strong>PISA</strong> cycles conducted thus far. In<br />
<strong>PISA</strong> 2000, <strong>Indigenous</strong> <strong>students</strong> achieved a mean score <strong>of</strong> 448 po<strong>in</strong>ts for read<strong>in</strong>g literacy, while<br />
non-<strong>Indigenous</strong> <strong>students</strong> achieved a mean score <strong>of</strong> 531 po<strong>in</strong>ts. Similar levels <strong>in</strong> read<strong>in</strong>g literacy<br />
performance were also found <strong>in</strong> <strong>PISA</strong> 2003 and <strong>PISA</strong> 2006. <strong>Indigenous</strong> and non-<strong>Indigenous</strong><br />
<strong>students</strong>’ <strong>PISA</strong> results for read<strong>in</strong>g literacy are shown <strong>in</strong> Table 2.1, along with the results for<br />
Australia and the OECD average for comparison.<br />
10 Read<strong>in</strong>g literacy
Table 2.1: Means and standard errors for <strong>Indigenous</strong> and non-<strong>Indigenous</strong> <strong>students</strong> on the overall read<strong>in</strong>g<br />
literacy scale<br />
<strong>PISA</strong> 2000 <strong>PISA</strong> 2003 <strong>PISA</strong> 2006<br />
Student group Mean SE Mean SE Mean SE<br />
<strong>Indigenous</strong> 448 5.8 444 8.6 434 6.9<br />
Non-<strong>Indigenous</strong> 531 3.4 527 2.0 515 2.1<br />
Australia 528 3.5 525 2.1 513 2.1<br />
OECD average 500 0.6 494 0.6 492 0.6<br />
Relatively large differences between the mean performance <strong>of</strong> the <strong>Indigenous</strong> and non-<strong>Indigenous</strong><br />
<strong>students</strong> are evident across the <strong>PISA</strong> cycles, with an average difference <strong>of</strong> 82 score po<strong>in</strong>ts,<br />
equivalent to about 0.8 <strong>of</strong> a standard deviation.<br />
Across the three <strong>PISA</strong> cycles, <strong>Indigenous</strong> <strong>students</strong> also performed significantly below the OECD<br />
average, by 53 score po<strong>in</strong>ts on average. In read<strong>in</strong>g literacy, one pr<strong>of</strong>iciency level equates to 73<br />
score po<strong>in</strong>ts. Thus, the average read<strong>in</strong>g literacy performance <strong>of</strong> <strong>Indigenous</strong> <strong>students</strong> was almost<br />
three-quarters <strong>of</strong> a pr<strong>of</strong>iciency level lower than the average performance <strong>of</strong> all <strong>students</strong> across<br />
OECD countries <strong>in</strong> <strong>PISA</strong> 2000 and <strong>PISA</strong> 2003, and more than three-quarters <strong>of</strong> a pr<strong>of</strong>iciency level<br />
lower <strong>in</strong> <strong>PISA</strong> 2006. Non-<strong>Indigenous</strong> <strong>students</strong>, <strong>in</strong> comparison, performed more than one-third <strong>of</strong> a<br />
pr<strong>of</strong>iciency level higher than the OECD average across the three <strong>PISA</strong> cycles.<br />
Figure 2.1 7 shows the distribution <strong>of</strong> performance scores for <strong>PISA</strong> 2000 on the read<strong>in</strong>g literacy<br />
scale, <strong>in</strong>clud<strong>in</strong>g the range <strong>of</strong> performance for <strong>students</strong> between the 5 th percentile (the po<strong>in</strong>t<br />
below which the lowest perform<strong>in</strong>g 5 per cent <strong>of</strong> the <strong>students</strong> score) and the 95 th percentile (the<br />
po<strong>in</strong>t above which the highest perform<strong>in</strong>g 5 per cent <strong>of</strong> <strong>students</strong> score). <strong>The</strong> spread <strong>of</strong> the scores<br />
<strong>in</strong>dicates that while there are some <strong>Indigenous</strong> <strong>students</strong> perform<strong>in</strong>g at lower levels, there are also<br />
some <strong>Indigenous</strong> <strong>students</strong> perform<strong>in</strong>g at higher levels. However, the figure also shows that the top<br />
five per cent <strong>of</strong> <strong>Indigenous</strong> <strong>students</strong> are perform<strong>in</strong>g at a level similar to that <strong>of</strong> the top 25 per <strong>of</strong><br />
non-<strong>Indigenous</strong> <strong>students</strong>.<br />
<strong>Indigenous</strong><br />
<strong>students</strong><br />
Non-<strong>Indigenous</strong><br />
<strong>students</strong><br />
150 250 350 450 550 650 750<br />
Performance scores<br />
Figure 2.1: Distribution <strong>of</strong> <strong>Indigenous</strong> and non-<strong>Indigenous</strong> <strong>students</strong> on the read<strong>in</strong>g literacy scale for<br />
<strong>PISA</strong> 2000<br />
In <strong>PISA</strong> 2000, the spread <strong>of</strong> scores for <strong>Indigenous</strong> <strong>students</strong> between the 5 th and 95 th percentile was<br />
335 score po<strong>in</strong>ts, which was similar to the spread <strong>of</strong> scores for the non-<strong>Indigenous</strong> <strong>students</strong>, which<br />
was 326 score po<strong>in</strong>ts. In <strong>PISA</strong> 2003, the spread <strong>of</strong> scores for <strong>Indigenous</strong> <strong>students</strong> rema<strong>in</strong>ed similar<br />
to the previous cycle, at 327 score po<strong>in</strong>ts, as did the spread for non-<strong>Indigenous</strong> <strong>students</strong> (318<br />
score po<strong>in</strong>ts). In <strong>PISA</strong> 2006, however, the range <strong>of</strong> scores for <strong>Indigenous</strong> <strong>students</strong> had <strong>in</strong>creased to<br />
347 po<strong>in</strong>ts (from 255 po<strong>in</strong>ts at the 5 th percentile to 602 score po<strong>in</strong>ts at the 95 th percentile), while<br />
the score range for non-<strong>Indigenous</strong> <strong>students</strong> had narrowed to 303 score po<strong>in</strong>ts. <strong>The</strong> mean score<br />
for <strong>Indigenous</strong> <strong>students</strong> at the 5 th percentile <strong>in</strong> 2006 was slightly lower (by 20 score po<strong>in</strong>ts) than<br />
the mean score at the 5 th percentile for 2000. This was not the case for non-<strong>Indigenous</strong> <strong>students</strong>,<br />
where the mean score at the 5 th percentile between 2000 and 2006 rema<strong>in</strong>ed almost the same.<br />
7 Refer to the Reader’s Guide for <strong>in</strong>structions on how to read the figures on means and distribution <strong>of</strong> scores.<br />
<strong>The</strong> <strong>achievement</strong> <strong>of</strong> Australia’s <strong>Indigenous</strong> <strong>students</strong> <strong>in</strong> <strong>PISA</strong> 2000 – 2006 11
Read<strong>in</strong>g literacy performance: pr<strong>of</strong>iciency levels<br />
Five levels <strong>of</strong> pr<strong>of</strong>iciency were developed and def<strong>in</strong>ed <strong>in</strong> <strong>PISA</strong> 2000 for the overall read<strong>in</strong>g literacy<br />
scale, and for the three subscales <strong>of</strong> retriev<strong>in</strong>g <strong>in</strong>formation, <strong>in</strong>terpret<strong>in</strong>g texts, and reflection and<br />
evaluation. Describ<strong>in</strong>g performance <strong>in</strong> terms <strong>of</strong> pr<strong>of</strong>iciency levels adds further <strong>in</strong>formation about<br />
student competencies to the means and standard errors reported <strong>in</strong> the previous section.<br />
Read<strong>in</strong>g pr<strong>of</strong>iciency Level 5<br />
Students at this level are able to deal with difficult texts and complete sophisticated read<strong>in</strong>g<br />
tasks. <strong>The</strong>y can deal with <strong>in</strong>formation that is difficult to f<strong>in</strong>d <strong>in</strong> unfamiliar texts, especially <strong>in</strong><br />
the presence <strong>of</strong> closely compet<strong>in</strong>g <strong>in</strong>formation, show detailed understand<strong>in</strong>g <strong>of</strong> these texts and<br />
identify which <strong>in</strong>formation is relevant to the task. <strong>The</strong>y are able to evaluate texts critically, draw<br />
on specialised knowledge to build hypotheses, and cope with concepts that may be contrary to<br />
expectations.<br />
Although the average score for <strong>Indigenous</strong> <strong>students</strong> was significantly lower than that <strong>of</strong> non-<br />
<strong>Indigenous</strong> <strong>students</strong>, represent<strong>in</strong>g both a statistical and educational disparity, there were some<br />
<strong>Indigenous</strong> <strong>students</strong> who performed exceptionally well <strong>in</strong> read<strong>in</strong>g literacy. In <strong>PISA</strong> 2000, four<br />
per cent <strong>of</strong> <strong>Indigenous</strong> <strong>students</strong> achieved the highest pr<strong>of</strong>iciency level. Eighteen per cent <strong>of</strong> non-<br />
<strong>Indigenous</strong> <strong>students</strong> achieved at Level 5, while 19 per cent <strong>of</strong> <strong>students</strong> <strong>in</strong> F<strong>in</strong>land, the highest<br />
perform<strong>in</strong>g country <strong>in</strong> read<strong>in</strong>g literacy <strong>in</strong> 2000, achieved at this level. On average across the<br />
OECD countries, about 10 per cent <strong>of</strong> <strong>students</strong> assessed <strong>in</strong> <strong>PISA</strong> were at Level 5 on the overall<br />
read<strong>in</strong>g literacy scale.<br />
Read<strong>in</strong>g pr<strong>of</strong>iciency Level 4<br />
Students at Level 4 are able to cope with difficult tasks, such as locat<strong>in</strong>g embedded <strong>in</strong>formation,<br />
constru<strong>in</strong>g mean<strong>in</strong>g <strong>of</strong> parts <strong>of</strong> a text through consider<strong>in</strong>g the texts as a whole, and deal<strong>in</strong>g with<br />
ambiguities and negatively worded ideas. <strong>The</strong>y show accurate understand<strong>in</strong>g <strong>of</strong> complex texts and<br />
are able to evaluate texts critically.<br />
Eight per cent <strong>of</strong> <strong>Indigenous</strong> <strong>students</strong> were placed at Level 4, compared to 26 per cent <strong>of</strong> non-<br />
<strong>Indigenous</strong> <strong>students</strong> and 32 per cent <strong>of</strong> F<strong>in</strong>nish <strong>students</strong>. On average, 22 per cent <strong>of</strong> <strong>students</strong><br />
across OECD countries were at Level 4.<br />
Read<strong>in</strong>g pr<strong>of</strong>iciency Level 3<br />
Students classified at Level 3 can deal with moderately complex read<strong>in</strong>g tasks, such as f<strong>in</strong>d<strong>in</strong>g<br />
several pieces <strong>of</strong> relevant <strong>in</strong>formation and sort<strong>in</strong>g out detailed compet<strong>in</strong>g <strong>in</strong>formation requir<strong>in</strong>g<br />
consideration <strong>of</strong> many criteria to compare, contrast or categorise. <strong>The</strong>y are able to make l<strong>in</strong>ks<br />
between different parts <strong>of</strong> a text and to understand text <strong>in</strong> a detailed way <strong>in</strong> relation to everyday<br />
knowledge. Equivalent proportions <strong>of</strong> <strong>Indigenous</strong> and non-<strong>Indigenous</strong> <strong>students</strong> performed<br />
at read<strong>in</strong>g pr<strong>of</strong>iciency Level 3, with just over one quarter <strong>of</strong> <strong>students</strong> from both groups at this<br />
level. In F<strong>in</strong>land, and across the OECD as a whole, slightly less than one third (29%) <strong>of</strong> <strong>students</strong><br />
achieved at read<strong>in</strong>g pr<strong>of</strong>iciency Level 3.<br />
Read<strong>in</strong>g pr<strong>of</strong>iciency Level 2<br />
At Level 2 <strong>students</strong> can cope with basic read<strong>in</strong>g tasks, such as locat<strong>in</strong>g straightforward <strong>in</strong>formation,<br />
mak<strong>in</strong>g low-level <strong>in</strong>ferences, us<strong>in</strong>g some outside knowledge to help understand a well-def<strong>in</strong>ed<br />
part <strong>of</strong> a text, and apply<strong>in</strong>g their own experience and attitudes to help expla<strong>in</strong> a feature <strong>of</strong> a text.<br />
Twenty-n<strong>in</strong>e per cent <strong>of</strong> <strong>Indigenous</strong> <strong>students</strong> achieved this level <strong>in</strong> <strong>PISA</strong> 2000, compared to 19<br />
per cent <strong>of</strong> non-<strong>Indigenous</strong> <strong>students</strong>, 14 per cent <strong>of</strong> F<strong>in</strong>nish <strong>students</strong> and 22 percent <strong>of</strong> <strong>students</strong> <strong>in</strong><br />
participat<strong>in</strong>g OECD countries.<br />
12 Read<strong>in</strong>g literacy
Read<strong>in</strong>g pr<strong>of</strong>iciency Level 1<br />
At read<strong>in</strong>g pr<strong>of</strong>iciency Level 1, <strong>students</strong> are able to deal with only the least complex read<strong>in</strong>g<br />
tasks developed for <strong>PISA</strong>, such as f<strong>in</strong>d<strong>in</strong>g explicitly stated pieces <strong>of</strong> <strong>in</strong>formation and recognis<strong>in</strong>g<br />
the ma<strong>in</strong> theme or author’s purpose <strong>in</strong> a text <strong>in</strong> a familiar topic when the required <strong>in</strong>formation<br />
is readily accessible <strong>in</strong> the text. <strong>The</strong>y are also able to make a connection between common,<br />
everyday knowledge and <strong>in</strong>formation <strong>in</strong> the text.<br />
Twenty per cent <strong>of</strong> <strong>Indigenous</strong> <strong>students</strong>, or one <strong>in</strong> every five <strong>students</strong>, were placed at this level.<br />
N<strong>in</strong>e per cent <strong>of</strong> non-<strong>Indigenous</strong> <strong>students</strong> and five per cent <strong>of</strong> <strong>students</strong> from F<strong>in</strong>land performed at<br />
Level 1, while across the OECD countries, 12 per cent <strong>of</strong> <strong>students</strong> on average performed at this<br />
level.<br />
Not yet reached read<strong>in</strong>g pr<strong>of</strong>iciency Level 1<br />
Read<strong>in</strong>g tasks easier than the Level 1 tasks <strong>in</strong> <strong>PISA</strong> no longer fit <strong>PISA</strong>’s concept <strong>of</strong> read<strong>in</strong>g literacy.<br />
Students who scored below this level have not demonstrated understand<strong>in</strong>g <strong>of</strong> even the most basic<br />
type <strong>of</strong> <strong>in</strong>formation and the OECD have argued that this po<strong>in</strong>ts to serious deficiencies <strong>in</strong> their<br />
ability to meet the challenges <strong>of</strong> the future and adapt to societal change.<br />
Thirteen per cent <strong>of</strong> <strong>Indigenous</strong> <strong>students</strong> were unable to demonstrate Level 1 read<strong>in</strong>g skills <strong>in</strong> <strong>PISA</strong><br />
2000, compared to three per cent <strong>of</strong> non-<strong>Indigenous</strong> <strong>students</strong>, two per cent <strong>of</strong> F<strong>in</strong>nish <strong>students</strong> and<br />
six per cent <strong>of</strong> <strong>students</strong> across participat<strong>in</strong>g OECD countries.<br />
<strong>The</strong> percentages <strong>of</strong> <strong>Indigenous</strong> and non-<strong>Indigenous</strong> <strong>students</strong> at each read<strong>in</strong>g literacy pr<strong>of</strong>iciency<br />
level, from below Level 1 to Level 5, are summarised <strong>in</strong> Figure 2.2. <strong>The</strong> pr<strong>of</strong>iciency levels for the<br />
OECD on average and for F<strong>in</strong>land, the highest perform<strong>in</strong>g country <strong>in</strong> read<strong>in</strong>g literacy <strong>in</strong> <strong>PISA</strong> 2000,<br />
have been <strong>in</strong>cluded for comparison.<br />
<strong>Indigenous</strong><br />
Non-<strong>Indigenous</strong><br />
OECD average<br />
F<strong>in</strong>land<br />
13 20<br />
3 9<br />
6 12<br />
2 5<br />
29 26 8 4<br />
19 26 26 18<br />
22 29 22 10<br />
14 29 32 19<br />
-100 -80 -60 -40 -20 0<br />
20 40 60 80 100<br />
Percentage <strong>of</strong> <strong>students</strong><br />
Below Level 1 Level 1 Level 2 Level 3 Level 4 Level 5 Level 6<br />
Figure 2.2: Read<strong>in</strong>g literacy pr<strong>of</strong>iciency levels for <strong>Indigenous</strong> and non-<strong>Indigenous</strong> <strong>students</strong>, the OECD<br />
average and F<strong>in</strong>land for <strong>PISA</strong> 2000<br />
At the higher end <strong>of</strong> the read<strong>in</strong>g literacy pr<strong>of</strong>iciency scale, the proportion <strong>of</strong> non-<strong>Indigenous</strong><br />
<strong>students</strong> achiev<strong>in</strong>g at Level 5 is more than four times the proportion <strong>of</strong> <strong>Indigenous</strong> <strong>students</strong><br />
achiev<strong>in</strong>g at a similar level. At the lower end <strong>of</strong> the pr<strong>of</strong>iciency scale, almost three times as<br />
many <strong>Indigenous</strong> as non-<strong>Indigenous</strong> <strong>students</strong> were not able to achieve pr<strong>of</strong>iciency level 2. While<br />
not <strong>of</strong>ficially def<strong>in</strong>ed as such for read<strong>in</strong>g, Level 2 is the base level or m<strong>in</strong>imum standard for<br />
mathematics and science at which the OECD has argued that <strong>students</strong> are able to demonstrate<br />
read<strong>in</strong>g competencies that will enable them to actively participate <strong>in</strong> life situations. For this report,<br />
Level 2 will be considered as a basel<strong>in</strong>e for read<strong>in</strong>g as well.<br />
Table 2.2 shows the percentage <strong>of</strong> <strong>Indigenous</strong> and non-<strong>Indigenous</strong> <strong>students</strong> who performed at<br />
each level on the read<strong>in</strong>g literacy pr<strong>of</strong>iciency scale <strong>in</strong> <strong>PISA</strong> 2003 and <strong>PISA</strong> 2006. A pattern <strong>of</strong><br />
<strong>Indigenous</strong> <strong>students</strong> be<strong>in</strong>g over-represented <strong>in</strong> the lower pr<strong>of</strong>iciency levels and under-represented<br />
<strong>The</strong> <strong>achievement</strong> <strong>of</strong> Australia’s <strong>Indigenous</strong> <strong>students</strong> <strong>in</strong> <strong>PISA</strong> 2000 – 2006 13
<strong>in</strong> the high pr<strong>of</strong>iciency levels was apparent across all three <strong>PISA</strong> cycles. More than one third <strong>of</strong><br />
<strong>Indigenous</strong> <strong>students</strong> failed to atta<strong>in</strong> pr<strong>of</strong>iciency Level 2 <strong>in</strong> either <strong>PISA</strong> 2003 or 2006. At the higher<br />
levels, up to 15 per cent <strong>of</strong> <strong>Indigenous</strong> <strong>students</strong> atta<strong>in</strong>ed pr<strong>of</strong>iciency Level 4 or 5 <strong>in</strong> <strong>PISA</strong> 2003<br />
and 2006, compared to 42 per cent and 36 per cent <strong>of</strong> non-<strong>Indigenous</strong> <strong>students</strong> <strong>in</strong> those years,<br />
respectively.<br />
Table 2.2: Read<strong>in</strong>g literacy pr<strong>of</strong>iciency levels for <strong>Indigenous</strong> and non-<strong>Indigenous</strong> <strong>students</strong> for <strong>PISA</strong> 2003<br />
and <strong>PISA</strong> 2006<br />
Below Level<br />
1 Level 1 Level 2 Level 3 Level 4 Level 5<br />
<strong>PISA</strong> 2003<br />
<strong>Indigenous</strong> 15 23 24 23 11 4<br />
Non-<strong>Indigenous</strong> 3 8 18 28 27 15<br />
<strong>PISA</strong> 2006<br />
<strong>Indigenous</strong> 16 22 28 21 9 3<br />
Non-<strong>Indigenous</strong> 3 9 21 30 25 11<br />
<strong>Indigenous</strong> <strong>students</strong>’ performance from an <strong>in</strong>ternational<br />
perspective<br />
One <strong>of</strong> the benefits <strong>of</strong> participat<strong>in</strong>g <strong>in</strong> an <strong>in</strong>ternational assessment such as <strong>PISA</strong> is that it allows<br />
policymakers, researchers, teachers and other <strong>in</strong>terested people to compare <strong>students</strong>’ relative<br />
stand<strong>in</strong>g to that <strong>of</strong> <strong>students</strong> <strong>in</strong> other participat<strong>in</strong>g countries. As previously reported, Australia’s<br />
<strong>students</strong> have performed very well overall <strong>in</strong> the read<strong>in</strong>g literacy assessments <strong>of</strong> <strong>PISA</strong>.<br />
Figure 2.3 shows the <strong>in</strong>ternational student performance <strong>in</strong> read<strong>in</strong>g literacy for <strong>PISA</strong> 2000 as<br />
well as the mean scores and distribution <strong>of</strong> performance for <strong>Indigenous</strong> and non-<strong>Indigenous</strong><br />
Australian <strong>students</strong>. Results on the read<strong>in</strong>g literacy scale showed F<strong>in</strong>land scored significantly<br />
higher than any other country (547 score po<strong>in</strong>ts). This level <strong>of</strong> performance was around one and<br />
one third pr<strong>of</strong>iciency levels higher than the average performance <strong>of</strong> <strong>Indigenous</strong> <strong>students</strong>. <strong>The</strong><br />
majority <strong>of</strong> countries, from F<strong>in</strong>land to Portugal <strong>in</strong> Figure 2.3 achieved significantly higher results<br />
than Australian <strong>Indigenous</strong> <strong>students</strong>. <strong>Indigenous</strong> <strong>students</strong>’ performance was equivalent to that <strong>of</strong><br />
<strong>students</strong> <strong>in</strong> the Russian Federation, Latvia, Israel and Luxembourg. <strong>Indigenous</strong> <strong>students</strong> scored<br />
significantly higher than <strong>students</strong> <strong>in</strong> Thailand, Bulgaria, Romania, Mexico, Argent<strong>in</strong>a, Chile, Brazil<br />
and Indonesia.<br />
As mentioned <strong>in</strong> Chapter 1, lower average performance and atta<strong>in</strong>ment among <strong>Indigenous</strong> <strong>students</strong><br />
<strong>in</strong> Australia <strong>in</strong> comparison to their non-<strong>Indigenous</strong> peers is not a new f<strong>in</strong>d<strong>in</strong>g. View<strong>in</strong>g the average<br />
performance <strong>of</strong> our <strong>Indigenous</strong> <strong>students</strong> <strong>in</strong> an <strong>in</strong>ternational context, however, highlights this issue<br />
and underscores the need for this disparity to be addressed.<br />
14 Read<strong>in</strong>g literacy
F<strong>in</strong>land<br />
Canada<br />
Netherlands<br />
NON-INDIGENOUS STUDENTS<br />
New Zealand<br />
Australia<br />
Ireland<br />
Hong Kong-Ch<strong>in</strong>a*<br />
Korea<br />
United K<strong>in</strong>gdom<br />
Japan<br />
Sweden<br />
Belgium<br />
Iceland<br />
Norway<br />
France<br />
United States<br />
OECD Average<br />
Denmark<br />
Switzerland<br />
Spa<strong>in</strong><br />
Austria<br />
Czech Republic<br />
Italy<br />
Germany<br />
Liechtenste<strong>in</strong>*<br />
Poland<br />
Hungary<br />
Greece<br />
Portugal<br />
Russian Federation*<br />
Latvia*<br />
Israel*<br />
INDIGENOUS STUDENTS<br />
Luxembourg<br />
Thailand*<br />
Bulgaria*<br />
Romania*<br />
Mexico<br />
Argent<strong>in</strong>a*<br />
Chile*<br />
Brazil*<br />
Indonesia*<br />
* Partner country<br />
Significantly higher<br />
than the performance<br />
<strong>of</strong> <strong>Indigenous</strong><br />
<strong>students</strong><br />
Not significantly<br />
different from the<br />
performance <strong>of</strong><br />
<strong>Indigenous</strong><br />
<strong>students</strong><br />
Significantly lower<br />
than the performance<br />
<strong>of</strong> <strong>Indigenous</strong><br />
<strong>students</strong><br />
150 250 350 450 550 650 750<br />
Figure 2.3: International student performance <strong>in</strong> read<strong>in</strong>g literacy for <strong>PISA</strong> 2000 <strong>in</strong>clud<strong>in</strong>g <strong>Indigenous</strong> and<br />
non-<strong>Indigenous</strong> performance<br />
<strong>The</strong> <strong>achievement</strong> <strong>of</strong> Australia’s <strong>Indigenous</strong> <strong>students</strong> <strong>in</strong> <strong>PISA</strong> 2000 – 2006 15
Read<strong>in</strong>g literacy performance by gender<br />
Female <strong>students</strong> outperformed male <strong>students</strong> <strong>in</strong> read<strong>in</strong>g literacy <strong>in</strong> almost all countries across<br />
the three <strong>PISA</strong> cycles to date (the sole exception be<strong>in</strong>g Liechtenste<strong>in</strong> <strong>in</strong> <strong>PISA</strong> 2003 <strong>in</strong> which the<br />
difference did not reach statistical significance). This pattern is also evident among <strong>Indigenous</strong><br />
<strong>students</strong>, with <strong>Indigenous</strong> female <strong>students</strong> scor<strong>in</strong>g 46 po<strong>in</strong>ts higher on average than <strong>Indigenous</strong><br />
male <strong>students</strong>, a difference significant and equivalent to more than half <strong>of</strong> a pr<strong>of</strong>iciency level. Both<br />
<strong>Indigenous</strong> females and males performed significantly lower than their OECD average counterparts<br />
(Table 2.3).<br />
Table 2.3: Means and standard errors for <strong>Indigenous</strong> and non-<strong>Indigenous</strong> <strong>students</strong> by gender on the<br />
overall read<strong>in</strong>g literacy scale<br />
<strong>PISA</strong> 2000 <strong>PISA</strong> 2003 <strong>PISA</strong> 2006<br />
Student group<br />
Mean SE Mean SE Mean SE<br />
<strong>Indigenous</strong> Females 467 8.7 478 6.4 451 11.6<br />
Males 429 9.5 413 10.9 417 9.4<br />
Non-<strong>Indigenous</strong> Females 549 4.5 547 2.6 534 2.1<br />
Males 515 4.0 508 2.7 497 3.1<br />
OECD average Females 517 0.7 511 0.7 511 0.7<br />
Males 485 0.8 477 0.7 473 0.7<br />
Figure 2.4 shows the mean and distribution <strong>of</strong> scores for <strong>Indigenous</strong> and non-<strong>Indigenous</strong> females<br />
and males on the read<strong>in</strong>g literacy scale for <strong>PISA</strong> 2000. <strong>The</strong> spread <strong>of</strong> scores between the 5 th and<br />
95 th percentiles was similar for <strong>Indigenous</strong> and non-<strong>Indigenous</strong> females, at 303 and 307 score<br />
po<strong>in</strong>ts, respectively. Although not shown <strong>in</strong> the figure, the distribution <strong>of</strong> scores for <strong>Indigenous</strong><br />
females <strong>in</strong>creased <strong>in</strong> subsequent <strong>PISA</strong> cycles with a difference <strong>of</strong> 316 score po<strong>in</strong>ts between the 5 th<br />
and 95 th percentiles <strong>in</strong> <strong>PISA</strong> 2003 and 332 score po<strong>in</strong>ts <strong>in</strong> <strong>PISA</strong> 2006. This was not the case for<br />
non-<strong>Indigenous</strong> females, for whom the difference between the 5 th and 95 th percentile decreased to<br />
292 score po<strong>in</strong>ts <strong>in</strong> <strong>PISA</strong> 2003 and 277 score po<strong>in</strong>ts <strong>in</strong> <strong>PISA</strong> 2006.<br />
<strong>Indigenous</strong><br />
females<br />
Non-<strong>Indigenous</strong><br />
females<br />
<strong>Indigenous</strong><br />
males<br />
Non-<strong>Indigenous</strong><br />
males<br />
150 250 350 450 550 650 750<br />
Figure 2.4: Distribution <strong>of</strong> <strong>Indigenous</strong> and non-<strong>Indigenous</strong> <strong>students</strong> on the read<strong>in</strong>g literacy scale for<br />
<strong>PISA</strong> 2000<br />
16 Read<strong>in</strong>g literacy
<strong>The</strong> distribution <strong>of</strong> results on read<strong>in</strong>g literacy was wider for <strong>Indigenous</strong> males than <strong>Indigenous</strong><br />
females. <strong>The</strong> spread <strong>of</strong> read<strong>in</strong>g literacy scores for <strong>Indigenous</strong> males was similar across the <strong>PISA</strong><br />
cycles, with a difference <strong>of</strong> 350 score po<strong>in</strong>ts between the 5 th and 95 th percentile <strong>in</strong> <strong>PISA</strong> 2000, 344<br />
score po<strong>in</strong>ts <strong>in</strong> <strong>PISA</strong> 2003 and 344 score po<strong>in</strong>ts <strong>in</strong> <strong>PISA</strong> 2006. <strong>The</strong> distribution <strong>of</strong> read<strong>in</strong>g literacy<br />
scores for non-<strong>Indigenous</strong> males <strong>in</strong> 2000 was narrower than that for <strong>Indigenous</strong> males at 333 score<br />
po<strong>in</strong>ts. <strong>The</strong> difference between the 5 th and 95th percentile <strong>in</strong> <strong>PISA</strong> 2003 and <strong>PISA</strong> 2006 decreased<br />
from 327 score po<strong>in</strong>ts to 313 score po<strong>in</strong>ts.<br />
Table 2.4: Spread <strong>of</strong> scores over all <strong>PISA</strong> cycles, by gender<br />
Difference between 5th and 95th percentiles<br />
<strong>Indigenous</strong><br />
non-<strong>Indigenous</strong><br />
Females Males Females Males<br />
2000 303 350 307 333<br />
2003 316 344 292 327<br />
2006 332 345 277 313<br />
Figure 2.5 shows the percentage <strong>of</strong> <strong>Indigenous</strong> and non-<strong>Indigenous</strong> female and male <strong>students</strong> at<br />
each pr<strong>of</strong>iciency level on the read<strong>in</strong>g literacy scale. At the higher end <strong>of</strong> the pr<strong>of</strong>iciency scale<br />
similar percentages <strong>of</strong> <strong>Indigenous</strong> female and male <strong>students</strong> achieved Level 5, five and four per<br />
cent respectively. Almost twice the proportion <strong>of</strong> <strong>Indigenous</strong> females as males achieved Level 4.<br />
At the lower end <strong>of</strong> the pr<strong>of</strong>iciency scale there were substantial proportions <strong>of</strong> both <strong>Indigenous</strong><br />
male (38%) and <strong>Indigenous</strong> female (29%) <strong>students</strong> who did not achieve pr<strong>of</strong>iciency Level 2. In<br />
both cases these proportions were much higher than the proportion <strong>of</strong> non-<strong>Indigenous</strong> <strong>students</strong> at<br />
the same level.<br />
<strong>Indigenous</strong><br />
females<br />
<strong>Indigenous</strong><br />
males<br />
Non-<strong>Indigenous</strong><br />
females<br />
Non-<strong>Indigenous</strong><br />
males<br />
8<br />
18 20<br />
4<br />
21<br />
1 6<br />
11<br />
-100 -80 -60 -40 -20 0<br />
20 40 60 80 100<br />
Percentage <strong>of</strong> <strong>students</strong><br />
26 31 11 5<br />
33 20 6 4<br />
16 26 30 21<br />
21 27 23 14<br />
Below Level 1 Level 1 Level 2 Level 3 Level 4 Level 5 Level 6<br />
Figure 2.5: Read<strong>in</strong>g literacy pr<strong>of</strong>iciency levels for <strong>Indigenous</strong> and non-<strong>Indigenous</strong> <strong>students</strong> by gender for<br />
<strong>PISA</strong> 2000<br />
<strong>The</strong> <strong>achievement</strong> <strong>of</strong> Australia’s <strong>Indigenous</strong> <strong>students</strong> <strong>in</strong> <strong>PISA</strong> 2000 – 2006 17
Performance on the read<strong>in</strong>g literacy subscales<br />
As discussed at the beg<strong>in</strong>n<strong>in</strong>g <strong>of</strong> this chapter, read<strong>in</strong>g literacy was the major doma<strong>in</strong> <strong>of</strong> assessment<br />
for <strong>PISA</strong> 2000. As such, three read<strong>in</strong>g literacy subscales were def<strong>in</strong>ed – retriev<strong>in</strong>g <strong>in</strong>formation;<br />
<strong>in</strong>terpret<strong>in</strong>g texts and reflection and evaluation —and can be used to explore the performance <strong>of</strong><br />
<strong>Indigenous</strong> <strong>students</strong> <strong>in</strong> read<strong>in</strong>g literacy <strong>in</strong> further detail than possible us<strong>in</strong>g the overall scale score.<br />
Figure 2.6 shows the pr<strong>of</strong>iciency descriptions for each <strong>of</strong> the levels for the three read<strong>in</strong>g literacy<br />
subscales. <strong>The</strong> follow<strong>in</strong>g subsections describe performance <strong>in</strong> each <strong>of</strong> these areas.<br />
Pr<strong>of</strong>iciency level Retriev<strong>in</strong>g <strong>in</strong>formation Interpret<strong>in</strong>g texts Reflection and evaluation<br />
Locate and possibly sequence<br />
or comb<strong>in</strong>e multiple pieces <strong>of</strong><br />
deeply embedded <strong>in</strong>formation,<br />
some <strong>of</strong> which may be outside<br />
5 the ma<strong>in</strong> body <strong>of</strong> the text. Infer<br />
which <strong>in</strong>formation <strong>in</strong> the text<br />
is relevant. Deal with highly<br />
plausible and/or extensive<br />
compet<strong>in</strong>g <strong>in</strong>formation.<br />
625.6 score po<strong>in</strong>ts<br />
4<br />
Locate and possibly sequence<br />
or comb<strong>in</strong>e multiple pieces <strong>of</strong><br />
embedded <strong>in</strong>formation, each<br />
<strong>of</strong> which may need to meet<br />
multiple criteria, <strong>in</strong> a text with<br />
unfamiliar context or form. Infer<br />
which <strong>in</strong>formation <strong>in</strong> the text is<br />
relevant to the task.<br />
552.9 score po<strong>in</strong>ts<br />
Locate, and <strong>in</strong> some cases<br />
recognise, the relationship<br />
between, pieces <strong>of</strong> <strong>in</strong>formation,<br />
each <strong>of</strong> which may need to<br />
3<br />
meet multiple criteria. Deal<br />
with prom<strong>in</strong>ent compet<strong>in</strong>g<br />
<strong>in</strong>formation.<br />
480.2 score po<strong>in</strong>ts<br />
Locate one or more pieces <strong>of</strong><br />
<strong>in</strong>formation, each <strong>of</strong> which may<br />
be required to meet multiple<br />
criteria. Deal with compet<strong>in</strong>g<br />
2<br />
<strong>in</strong>formation.<br />
407.5 score po<strong>in</strong>ts<br />
Take account <strong>of</strong> a s<strong>in</strong>gle<br />
criterion to locate one or<br />
1 more <strong>in</strong>dependent pieces <strong>of</strong><br />
explicitly stated <strong>in</strong>formation.<br />
334.8 score po<strong>in</strong>ts<br />
Either construe the mean<strong>in</strong>g<br />
<strong>of</strong> nuanced language or<br />
demonstrate a full and detailed<br />
understand<strong>in</strong>g <strong>of</strong> text.<br />
Use a high level <strong>of</strong> text-based<br />
<strong>in</strong>ference to understand<br />
and apply categories <strong>in</strong> an<br />
unfamiliar context, and to<br />
construe the mean<strong>in</strong>g <strong>of</strong> a<br />
section <strong>of</strong> text by tak<strong>in</strong>g <strong>in</strong>to<br />
account the text as a whole.<br />
Deal with ambiguities, ideas<br />
that are contrary to expectation<br />
and ideas that are negatively<br />
worded.<br />
Integrate several parts <strong>of</strong> a text<br />
<strong>in</strong> order to identify a ma<strong>in</strong> idea,<br />
understand a relationship or<br />
construe the mean<strong>in</strong>g <strong>of</strong> a word<br />
or phrase. Compare, contrast<br />
or categorise tak<strong>in</strong>g many<br />
criteria <strong>in</strong>to account. Deal with<br />
compet<strong>in</strong>g <strong>in</strong>formation.<br />
Identify the ma<strong>in</strong> idea <strong>in</strong> a text,<br />
understand relationships, form<br />
or apply simple categories,<br />
or construe mean<strong>in</strong>g with<strong>in</strong> a<br />
limited part <strong>of</strong> the text when the<br />
<strong>in</strong>formation is not prom<strong>in</strong>ent<br />
and low-level <strong>in</strong>ferences are<br />
required.<br />
Recognise the ma<strong>in</strong> theme<br />
or author’s purpose <strong>in</strong> a text<br />
about a familiar topic, when the<br />
required <strong>in</strong>formation <strong>in</strong> the text<br />
is prom<strong>in</strong>ent.<br />
Figure 2.6: Description <strong>of</strong> pr<strong>of</strong>iciency levels for the read<strong>in</strong>g literacy subscales<br />
Critically evaluate or<br />
hypothesise, draw<strong>in</strong>g on<br />
specialised knowledge. Deal<br />
with concepts that are contrary<br />
to expectations and draw on a<br />
deep understand<strong>in</strong>g <strong>of</strong> long or<br />
complex texts.<br />
Use formal or public knowledge<br />
to hypothesise about or<br />
critically evaluate a text. Show<br />
accurate understand<strong>in</strong>g <strong>of</strong> long<br />
or complex texts.<br />
Make connections or<br />
comparisons, give<br />
explanations, or evaluate a<br />
feature <strong>of</strong> text. Demonstrate<br />
a detailed understand<strong>in</strong>g <strong>of</strong><br />
the text <strong>in</strong> relation to familiar,<br />
everyday knowledge, or draw<br />
on less common knowledge.<br />
Make a comparison or<br />
connections between the<br />
text and outside knowledge,<br />
or expla<strong>in</strong> a feature <strong>of</strong> the<br />
text by draw<strong>in</strong>g on personal<br />
experience and attitudes.<br />
Make a simple connection<br />
between <strong>in</strong>formation <strong>in</strong> a<br />
text and common, everyday<br />
knowledge.<br />
<strong>Indigenous</strong> <strong>students</strong>’ performance <strong>in</strong> retriev<strong>in</strong>g <strong>in</strong>formation<br />
Retriev<strong>in</strong>g <strong>in</strong>formation refers to locat<strong>in</strong>g one or more pieces <strong>of</strong> <strong>in</strong>formation <strong>in</strong> a text that are<br />
needed to form the correct response to a question. <strong>Indigenous</strong> <strong>students</strong> achieved a mean score <strong>of</strong><br />
451 po<strong>in</strong>ts on the retriev<strong>in</strong>g <strong>in</strong>formation subscale, which was significantly lower than the mean<br />
score for non-<strong>Indigenous</strong> <strong>students</strong> (by 86 po<strong>in</strong>ts), 47 po<strong>in</strong>ts lower than the score for <strong>students</strong> across<br />
OECD countries, and one hundred and five score po<strong>in</strong>ts lower than the mean score for <strong>students</strong><br />
<strong>in</strong> F<strong>in</strong>land (Table 2.5). <strong>The</strong>se scores represent differences <strong>of</strong> around half a pr<strong>of</strong>iciency level lower<br />
18 Read<strong>in</strong>g literacy
than the OECD average, one pr<strong>of</strong>iciency level lower than that <strong>of</strong> non-<strong>Indigenous</strong> Australian<br />
<strong>students</strong> and almost one and a half pr<strong>of</strong>iciency levels lower than that <strong>of</strong> F<strong>in</strong>nish <strong>students</strong>.<br />
Table 2.5: Means and standard errors for <strong>Indigenous</strong> and non-<strong>Indigenous</strong> <strong>students</strong> on the retriev<strong>in</strong>g<br />
<strong>in</strong>formation subscale for <strong>PISA</strong> 2000<br />
Mean<br />
SE<br />
<strong>Indigenous</strong> <strong>students</strong> 451 7.6<br />
Non-<strong>Indigenous</strong> <strong>students</strong> 537 3.5<br />
OECD average 498 0.7<br />
F<strong>in</strong>land 556 2.8<br />
Figure 2.7 shows the distribution <strong>of</strong> scores on the retriev<strong>in</strong>g <strong>in</strong>formation subscale for <strong>Indigenous</strong><br />
and non-<strong>Indigenous</strong> <strong>students</strong> by gender. <strong>Indigenous</strong> females scored higher than <strong>Indigenous</strong><br />
males on retriev<strong>in</strong>g <strong>in</strong>formation – 467 score po<strong>in</strong>t compared to 434 score po<strong>in</strong>ts. This difference<br />
<strong>of</strong> 33 score po<strong>in</strong>ts equates to almost half <strong>of</strong> one pr<strong>of</strong>iciency level. However, <strong>Indigenous</strong> females’<br />
performance was 85 score po<strong>in</strong>ts lower than that <strong>of</strong> non-<strong>Indigenous</strong> females, while <strong>Indigenous</strong><br />
males’ performance was 90 score po<strong>in</strong>ts lower than that <strong>of</strong> non-<strong>Indigenous</strong> males.<br />
<strong>Indigenous</strong><br />
females<br />
Non-<strong>Indigenous</strong><br />
females<br />
<strong>Indigenous</strong><br />
males<br />
Non-<strong>Indigenous</strong><br />
males<br />
150 250 350 450 550 650 750<br />
Figure 2.7: Distribution <strong>of</strong> <strong>Indigenous</strong> and non-<strong>Indigenous</strong> <strong>students</strong> on the retriev<strong>in</strong>g <strong>in</strong>formation subscale<br />
by gender for <strong>PISA</strong> 2000<br />
Only 16 per cent <strong>of</strong> <strong>Indigenous</strong> <strong>students</strong> performed at the upper end <strong>of</strong> the retriev<strong>in</strong>g <strong>in</strong>formation<br />
subscale (Level 4 or 5), compared to 47 per cent <strong>of</strong> non-<strong>Indigenous</strong> <strong>students</strong> who performed at the<br />
same levels. Across the OECD, around one third <strong>of</strong> <strong>students</strong> performed at these higher levels. At<br />
the lower end <strong>of</strong> the pr<strong>of</strong>iciency scale, 33 per cent <strong>of</strong> <strong>Indigenous</strong> <strong>students</strong> were not able to achieve<br />
Level 2, compared to 11 per cent <strong>of</strong> non-<strong>Indigenous</strong> <strong>students</strong> and 20 per cent <strong>of</strong> <strong>students</strong> across<br />
all OECD countries. Figure 2.8 shows the proportion <strong>of</strong> <strong>Indigenous</strong> and non-<strong>Indigenous</strong> <strong>students</strong><br />
at each pr<strong>of</strong>iciency level for the retriev<strong>in</strong>g <strong>in</strong>formation subscale, along with results for the OECD<br />
average and F<strong>in</strong>land.<br />
<strong>Indigenous</strong><br />
14<br />
19<br />
27 24 11 5<br />
Non-<strong>Indigenous</strong><br />
3 8<br />
17 24 26 21<br />
OECD average<br />
8<br />
12<br />
21 26 21 12<br />
F<strong>in</strong>land<br />
2<br />
6<br />
14 24 28 26<br />
-100 -80 -60 -40 -20 0 20 40 60 80 100<br />
Percentage <strong>of</strong> <strong>students</strong><br />
Below Level 1 Level 1 Level 2 Level 3 Level 4 Level 5 Level 6<br />
Figure 2.8: Pr<strong>of</strong>iciency levels on the retriev<strong>in</strong>g <strong>in</strong>formation subscale for <strong>Indigenous</strong> and non-<strong>Indigenous</strong><br />
<strong>students</strong>, F<strong>in</strong>nish <strong>students</strong> and the OECD average for <strong>PISA</strong> 2000<br />
<strong>The</strong> <strong>achievement</strong> <strong>of</strong> Australia’s <strong>Indigenous</strong> <strong>students</strong> <strong>in</strong> <strong>PISA</strong> 2000 – 2006 19
<strong>Indigenous</strong> <strong>students</strong>’ performance <strong>in</strong> <strong>in</strong>terpret<strong>in</strong>g texts<br />
Interpret<strong>in</strong>g texts is def<strong>in</strong>ed as construct<strong>in</strong>g mean<strong>in</strong>g and draw<strong>in</strong>g <strong>in</strong>ferences from one or more<br />
parts <strong>of</strong> a text. <strong>Indigenous</strong> <strong>students</strong> achieved a mean score <strong>of</strong> 446 on this subscale, which was<br />
83 po<strong>in</strong>ts lower than the mean score for non-<strong>Indigenous</strong> <strong>students</strong>, 55 score po<strong>in</strong>ts lower than<br />
the OECD average and 109 score po<strong>in</strong>ts lower than the average F<strong>in</strong>nish score. This average<br />
score placeed <strong>Indigenous</strong> <strong>students</strong> around half a pr<strong>of</strong>iciency level below the OECD average, one<br />
pr<strong>of</strong>iciency level below non-<strong>Indigenous</strong> Australian <strong>students</strong> and almost one-and-a-half pr<strong>of</strong>iciency<br />
levels below F<strong>in</strong>nish <strong>students</strong> (Table 2.6).<br />
Table 2.6: Means and standard errors for <strong>Indigenous</strong> and non-<strong>Indigenous</strong> <strong>students</strong> on the <strong>in</strong>terpret<strong>in</strong>g<br />
texts subscale for <strong>PISA</strong> 2000<br />
Mean<br />
SE<br />
<strong>Indigenous</strong> <strong>students</strong> 446 5.8<br />
Non-<strong>Indigenous</strong> <strong>students</strong> 529 3.4<br />
OECD average 501 0.6<br />
F<strong>in</strong>land 555 2.9<br />
Figure 2.9 shows the distribution <strong>of</strong> scores for <strong>Indigenous</strong> and non-<strong>Indigenous</strong> <strong>students</strong> by gender<br />
on the <strong>in</strong>terpret<strong>in</strong>g texts subscale. <strong>The</strong> mean score for <strong>Indigenous</strong> females on this subscale was<br />
462 score po<strong>in</strong>ts, which was significantly higher than the mean score for <strong>Indigenous</strong> males <strong>of</strong> 429<br />
score po<strong>in</strong>ts. <strong>The</strong> difference <strong>of</strong> 33 score po<strong>in</strong>ts equates to almost half a pr<strong>of</strong>iciency level.<br />
<strong>Indigenous</strong><br />
females<br />
Non-<strong>Indigenous</strong><br />
females<br />
<strong>Indigenous</strong><br />
males<br />
Non-<strong>Indigenous</strong><br />
males<br />
150 250 350 450 550 650 750<br />
Figure 2.9: Distribution <strong>of</strong> <strong>Indigenous</strong> and non-<strong>Indigenous</strong> <strong>students</strong> on the <strong>in</strong>terpret<strong>in</strong>g text subscale by<br />
gender for <strong>PISA</strong> 2000<br />
Figure 2.10 shows that thirty-five per cent <strong>of</strong> <strong>Indigenous</strong> <strong>students</strong> did not achieve Level 2 on the<br />
<strong>in</strong>terpret<strong>in</strong>g texts subscale. In comparison, 12 per cent <strong>of</strong> non-<strong>Indigenous</strong> <strong>students</strong>, seven per cent<br />
<strong>of</strong> F<strong>in</strong>nish <strong>students</strong> and 18 per cent <strong>of</strong> <strong>students</strong> from across all OECD countries failed to atta<strong>in</strong> this<br />
level <strong>of</strong> pr<strong>of</strong>iciency <strong>in</strong> text <strong>in</strong>terpretation. Thirteen per cent <strong>of</strong> <strong>Indigenous</strong> <strong>students</strong> were achiev<strong>in</strong>g<br />
at Levels 4 and 5, far fewer than the 43 per cent <strong>of</strong> non-<strong>Indigenous</strong> <strong>students</strong> and 54% <strong>of</strong> F<strong>in</strong>nish<br />
<strong>students</strong> who atta<strong>in</strong>ed these higher levels <strong>of</strong> pr<strong>of</strong>iciency.<br />
<strong>Indigenous</strong><br />
13<br />
22<br />
29 23 9 4<br />
Non-<strong>Indigenous</strong><br />
3 9<br />
19 25 25 18<br />
OECD average<br />
6<br />
12<br />
22 28 22 10<br />
F<strong>in</strong>land<br />
2 5<br />
14 26 30 24<br />
-100 -80 -60 -40 -20 0 20 40 60 80 100<br />
Percentage <strong>of</strong> <strong>students</strong><br />
Below Level 1 Level 1 Level 2 Level 3 Level 4 Level 5 Level 6<br />
Figure 2.10: Pr<strong>of</strong>iciency levels on the <strong>in</strong>terpret<strong>in</strong>g text subscale for <strong>Indigenous</strong> and non-<strong>Indigenous</strong><br />
<strong>students</strong>, F<strong>in</strong>nish <strong>students</strong> and the OECD average for <strong>PISA</strong> 2000<br />
20 Read<strong>in</strong>g literacy
<strong>Indigenous</strong> <strong>students</strong>’ performance <strong>in</strong> reflection and evaluation<br />
Reflection and evaluation is def<strong>in</strong>ed as relat<strong>in</strong>g a text to one’s experience, knowledge and ideas.<br />
<strong>The</strong> mean score for <strong>Indigenous</strong> <strong>students</strong> on this subscale was 450 score po<strong>in</strong>ts, which was a<br />
statistically significant 78 score po<strong>in</strong>ts lower than the mean score for non-<strong>Indigenous</strong> <strong>students</strong><br />
(Table 2.7). <strong>The</strong> results on the reflection and evaluation subscale were similar to that on the<br />
retriev<strong>in</strong>g <strong>in</strong>formation subscale. <strong>The</strong> average score <strong>of</strong> <strong>Indigenous</strong> Australian <strong>students</strong> placed them<br />
close to half a pr<strong>of</strong>iciency level lower than the average across the OECD countries, and almost one<br />
and a half pr<strong>of</strong>iciency levels lower than F<strong>in</strong>nish <strong>students</strong>.<br />
Table 2.7: Means and standard errors for <strong>Indigenous</strong> and non-<strong>Indigenous</strong> <strong>students</strong> on the reflection and<br />
evaluation subscale for <strong>PISA</strong> 2000<br />
Mean<br />
SE<br />
<strong>Indigenous</strong> <strong>students</strong> 450 5.8<br />
Non-<strong>Indigenous</strong> <strong>students</strong> 528 3.4<br />
OECD average 502 0.7<br />
F<strong>in</strong>land 533 2.7<br />
Figure 2.11 shows the distribution <strong>of</strong> scores for <strong>Indigenous</strong> and non-<strong>Indigenous</strong> <strong>students</strong> by gender<br />
on the reflection and evaluation subscale. <strong>The</strong> mean score for <strong>Indigenous</strong> females on the reflection<br />
and evaluation subscale was 470 score po<strong>in</strong>ts, which was 41 score po<strong>in</strong>ts (or more than half a<br />
pr<strong>of</strong>iciency level) higher than for <strong>Indigenous</strong> males. <strong>Indigenous</strong> females performed 80 score po<strong>in</strong>ts<br />
lower than non-<strong>Indigenous</strong> females, which was similar to the difference <strong>in</strong> performance between<br />
<strong>Indigenous</strong> and non-<strong>Indigenous</strong> males on this subscale.<br />
<strong>Indigenous</strong><br />
females<br />
Non-<strong>Indigenous</strong><br />
females<br />
<strong>Indigenous</strong><br />
males<br />
Non-<strong>Indigenous</strong><br />
males<br />
150 250 350 450 550 650 750<br />
Figure 2.11: Distribution <strong>of</strong> <strong>Indigenous</strong> and non-<strong>Indigenous</strong> <strong>students</strong> on the reflection and evaluation<br />
subscale by gender for <strong>PISA</strong> 2000<br />
Figure 2.12 shows the percentage <strong>of</strong> <strong>students</strong> at each pr<strong>of</strong>iciency level on the reflection and<br />
evaluation subscale. Approximately 33 per cent <strong>of</strong> <strong>Indigenous</strong> <strong>students</strong> did not achieve Level 2,<br />
compared to 12 per cent <strong>of</strong> non-<strong>Indigenous</strong> <strong>students</strong>, eight per cent <strong>of</strong> F<strong>in</strong>nish <strong>students</strong>, and 18 <strong>of</strong><br />
<strong>students</strong> across all OECD countries who did not reach this m<strong>in</strong>imum benchmark. At the upper end<br />
<strong>of</strong> the pr<strong>of</strong>iciency scale, there were 15 per cent <strong>of</strong> <strong>Indigenous</strong> <strong>students</strong> compared to 42 per cent <strong>of</strong><br />
non-<strong>Indigenous</strong> <strong>students</strong> who achieved Level 4 or 5 on this subscale.<br />
<strong>Indigenous</strong><br />
14<br />
19<br />
28 25 11 4<br />
Non-<strong>Indigenous</strong><br />
3 9<br />
19 27 26 16<br />
OECD average<br />
7<br />
11<br />
21 28 23 11<br />
F<strong>in</strong>land<br />
2 6<br />
16 30 31 14<br />
-100 -80 -60 -40 -20 0 20 40 60 80 100<br />
Percentage <strong>of</strong> <strong>students</strong><br />
Below Level 1 Level 1 Level 2 Level 3 Level 4 Level 5 Level 6<br />
Figure 2.12: Pr<strong>of</strong>iciency levels on the reflection and evaluation subscale for <strong>Indigenous</strong> and<br />
non‐<strong>Indigenous</strong> <strong>students</strong>, F<strong>in</strong>nish <strong>students</strong> and the OECD average for <strong>PISA</strong> 2000<br />
<strong>The</strong> <strong>achievement</strong> <strong>of</strong> Australia’s <strong>Indigenous</strong> <strong>students</strong> <strong>in</strong> <strong>PISA</strong> 2000 – 2006 21
Performance <strong>in</strong> read<strong>in</strong>g literacy over time<br />
One <strong>of</strong> the ma<strong>in</strong> aims <strong>of</strong> <strong>PISA</strong> is to exam<strong>in</strong>e student performance over time so that policy makers<br />
can monitor learn<strong>in</strong>g outcomes <strong>in</strong> both an <strong>in</strong>ternational and national context. Although the optimal<br />
report<strong>in</strong>g <strong>of</strong> trends will occur between each full assessment <strong>of</strong> a literacy doma<strong>in</strong> (for example,<br />
<strong>in</strong> read<strong>in</strong>g between <strong>PISA</strong> 2000 and <strong>PISA</strong> 2009, <strong>in</strong> which the major focus will aga<strong>in</strong> be on read<strong>in</strong>g<br />
literacy), <strong>PISA</strong> has been designed so that it is possible to compare results between each three-year<br />
cycle. Nevertheless, care needs to be taken <strong>in</strong> mak<strong>in</strong>g comparisons <strong>in</strong>volv<strong>in</strong>g m<strong>in</strong>or doma<strong>in</strong>s, as<br />
there are a smaller number <strong>of</strong> test items <strong>in</strong>cluded <strong>in</strong> m<strong>in</strong>or doma<strong>in</strong>s and also small ref<strong>in</strong>ements<br />
cont<strong>in</strong>ue to be made <strong>in</strong> <strong>PISA</strong>’s methodology which may have an effect on comparability over time.<br />
At a national level, there were no statistically significant differences <strong>in</strong> the average read<strong>in</strong>g performance<br />
<strong>of</strong> <strong>students</strong> <strong>in</strong> <strong>PISA</strong> 2000 and <strong>PISA</strong> 2003. Between <strong>PISA</strong> 2003 and <strong>PISA</strong> 2006, however, there<br />
was a significant decrease <strong>in</strong> the average read<strong>in</strong>g literacy performance <strong>of</strong> Australian <strong>students</strong>.<br />
Table 2.8 shows the mean scores for <strong>Indigenous</strong> <strong>students</strong> for <strong>PISA</strong> 2000, <strong>PISA</strong> 2003 and <strong>PISA</strong> 2006<br />
and the differences <strong>in</strong> performance between each cycle. Although there appears to have been a<br />
decl<strong>in</strong>e <strong>in</strong> the average read<strong>in</strong>g literacy performance <strong>of</strong> <strong>Indigenous</strong> <strong>students</strong> across the three <strong>PISA</strong><br />
cycles, these changes are not statistically significant.<br />
Table 2.8: Mean read<strong>in</strong>g literacy scores and standard errors for <strong>PISA</strong> 2000, <strong>PISA</strong> 2003 and <strong>PISA</strong> 2006,<br />
and differences between performance <strong>in</strong> cycles for <strong>Indigenous</strong> <strong>students</strong><br />
<strong>PISA</strong> 2000 <strong>PISA</strong> 2003 <strong>PISA</strong> 2006<br />
<strong>PISA</strong> 2000 and<br />
<strong>PISA</strong> 2003<br />
Differences between<br />
<strong>PISA</strong> 2003 and<br />
<strong>PISA</strong> 2006<br />
<strong>PISA</strong> 2000 and<br />
<strong>PISA</strong> 2006<br />
Mean SE Mean SE Mean SE Diff. SE Diff. SE Diff. SE<br />
448 3.1 444 8.6 434 6.9 -4 10.6 -10 11.9 -14 9.1<br />
Summary<br />
<strong>Indigenous</strong> <strong>students</strong> have performed relatively poorly <strong>in</strong> read<strong>in</strong>g literacy <strong>in</strong> each <strong>of</strong> the three <strong>PISA</strong><br />
cycles, perform<strong>in</strong>g substantially lower than non-<strong>Indigenous</strong> <strong>students</strong> and also substantially lower<br />
than <strong>students</strong> on average across all OECD countries.<br />
Across all three <strong>PISA</strong> cycles, it is apparent that <strong>Indigenous</strong> <strong>students</strong> are over-represented <strong>in</strong> the<br />
lower pr<strong>of</strong>iciency levels and under-represented <strong>in</strong> the high pr<strong>of</strong>iciency levels. In <strong>PISA</strong> 2000, four<br />
per cent <strong>of</strong> <strong>Indigenous</strong> <strong>students</strong> achieved at the highest pr<strong>of</strong>iciency level <strong>in</strong> read<strong>in</strong>g literacy and<br />
more than one third <strong>of</strong> <strong>Indigenous</strong> <strong>students</strong> failed to atta<strong>in</strong> pr<strong>of</strong>iciency Level 2. Similar results<br />
were found <strong>in</strong> <strong>PISA</strong> 2003 and <strong>PISA</strong> 2006.<br />
<strong>Indigenous</strong> females scored significantly higher than <strong>Indigenous</strong> males <strong>in</strong> all <strong>PISA</strong> cycles. This<br />
difference represents more than half <strong>of</strong> a pr<strong>of</strong>iciency level.<br />
At the higher end <strong>of</strong> the read<strong>in</strong>g literacy pr<strong>of</strong>iciency scale, there were similar percentages <strong>of</strong><br />
<strong>Indigenous</strong> female and male <strong>students</strong> who achieved Level 5. At the lower end <strong>of</strong> the pr<strong>of</strong>iciency<br />
scale, there were more <strong>Indigenous</strong> males than <strong>Indigenous</strong> females who had not achieved Level 2.<br />
Investigation on the three subscales (retriev<strong>in</strong>g <strong>in</strong>formation, <strong>in</strong>terpret<strong>in</strong>g texts and reflection and<br />
evaluation) showed <strong>Indigenous</strong> <strong>students</strong> performed at a similar level on each <strong>of</strong> the subscales.<br />
Differences between <strong>Indigenous</strong> and non-<strong>Indigenous</strong> <strong>students</strong>’ performances on each <strong>of</strong> the<br />
subscales were also consistent, however, with more than one whole pr<strong>of</strong>iciency level separat<strong>in</strong>g<br />
them. Approximately 15 per cent <strong>of</strong> <strong>Indigenous</strong> <strong>students</strong> were able to achieve Level 4 or Level 5<br />
<strong>in</strong> each <strong>of</strong> these subscales; however, one third <strong>of</strong> <strong>Indigenous</strong> <strong>students</strong> were not able to achieve<br />
Level 2.<br />
Despite these differences, and the f<strong>in</strong>d<strong>in</strong>g that the average performance <strong>of</strong> Australian <strong>students</strong> as a<br />
whole has decreased across the three <strong>PISA</strong> cycles, the performance <strong>of</strong> <strong>Indigenous</strong> <strong>students</strong> has not<br />
changed significantly <strong>in</strong> the past n<strong>in</strong>e years.<br />
22 Read<strong>in</strong>g literacy
Chapter<br />
3<br />
Mathematical<br />
literacy<br />
In <strong>PISA</strong> 2003 the ma<strong>in</strong> focus <strong>of</strong> assessment was mathematical literacy. In this cycle the<br />
mathematical literacy framework was expanded and pr<strong>of</strong>iciency levels were def<strong>in</strong>ed and described<br />
for mathematical literacy overall, as well as for four subscales.<br />
This chapter starts with a description <strong>of</strong> mathematical literacy and how this doma<strong>in</strong> is measured 8 .<br />
<strong>The</strong> subsequent sections exam<strong>in</strong>e the performance <strong>of</strong> <strong>Indigenous</strong> and non-<strong>Indigenous</strong> <strong>students</strong> <strong>in</strong><br />
mathematical literacy <strong>in</strong> the <strong>PISA</strong> assessments.<br />
Def<strong>in</strong>ition <strong>of</strong> mathematical literacy<br />
<strong>The</strong> <strong>PISA</strong> mathematical literacy doma<strong>in</strong> focuses on the capacities <strong>of</strong> <strong>students</strong> to analyse, reason<br />
and communicate ideas effectively as they pose, formulate, solve and <strong>in</strong>terpret mathematical<br />
problems <strong>in</strong> a variety <strong>of</strong> situations. <strong>The</strong> <strong>PISA</strong> assessment framework def<strong>in</strong>es mathematical literacy<br />
as:<br />
…an <strong>in</strong>dividual’s capacity to identify and understand the role that mathematics plays <strong>in</strong><br />
the world, to make well-founded judgements and to use and engage with mathematics<br />
<strong>in</strong> ways that meet the needs <strong>of</strong> that <strong>in</strong>dividual’s life as a constructive, concerned and<br />
reflective citizen.<br />
(OECD, 2006, p.72)<br />
In this conception, mathematical literacy is about meet<strong>in</strong>g life needs and function<strong>in</strong>g <strong>in</strong> society.<br />
Mathematical literacy is expressed through us<strong>in</strong>g and engag<strong>in</strong>g with mathematics, mak<strong>in</strong>g<br />
<strong>in</strong>formed judgements, and understand<strong>in</strong>g the usefulness <strong>of</strong> mathematics <strong>in</strong> relation to the demands<br />
<strong>of</strong> life.<br />
<strong>The</strong> <strong>PISA</strong> mathematics assessment directly confronts the importance <strong>of</strong> the functional use<br />
<strong>of</strong> mathematics by plac<strong>in</strong>g primary emphasis on a real-world problem situation, and on the<br />
mathematical knowledge and competencies that are likely to be useful <strong>in</strong> deal<strong>in</strong>g effectively with<br />
such a problem. <strong>The</strong> <strong>PISA</strong> mathematics framework was written to encourage an approach to<br />
teach<strong>in</strong>g and learn<strong>in</strong>g mathematics that gives strong emphasis to the processes associated with<br />
confront<strong>in</strong>g a problem <strong>in</strong> a real-world context, transform<strong>in</strong>g the problem <strong>in</strong>to one amenable to<br />
mathematical treatment, mak<strong>in</strong>g use <strong>of</strong> the relevant mathematical knowledge to solve it, and<br />
evaluat<strong>in</strong>g the solution <strong>in</strong> the orig<strong>in</strong>al problem context. If <strong>students</strong> can learn to do these th<strong>in</strong>gs,<br />
they will be much better equipped to make use <strong>of</strong> their mathematical knowledge and skills<br />
throughout their lives.<br />
8 Information about the mathematical literacy assessment framework has been taken from the <strong>PISA</strong> 2006<br />
National Report, Explor<strong>in</strong>g Scientific Literacy: How Australia measures up.<br />
<strong>The</strong> <strong>achievement</strong> <strong>of</strong> Australia’s <strong>Indigenous</strong> <strong>students</strong> <strong>in</strong> <strong>PISA</strong> 2000 – 2006 23
How mathematical literacy is measured<br />
<strong>The</strong> <strong>PISA</strong> framework for mathematical literacy is organised <strong>in</strong>to three broad components: the<br />
situations and contexts <strong>in</strong> which problems are presented and that are used as sources <strong>of</strong> stimulus<br />
material; the mathematical content to which different problems and questions relate; and the<br />
mathematical competencies that need to be activated <strong>in</strong> order to connect the real world, <strong>in</strong> which<br />
problems are generated, with mathematics and then to solve problems.<br />
<strong>The</strong> mathematical tasks given to <strong>students</strong> <strong>in</strong> each cycle <strong>of</strong> <strong>PISA</strong> were equally divided between the<br />
four overarch<strong>in</strong>g ideas (space and shape, change and relationships, quantity and uncerta<strong>in</strong>ty).<br />
Situations and Context<br />
An important aspect <strong>of</strong> mathematical literacy is engagement with mathematics: us<strong>in</strong>g and do<strong>in</strong>g<br />
mathematics <strong>in</strong> a variety <strong>of</strong> situations. Students were shown written materials that described<br />
various situations that they could conceivably confront, and which required them to apply their<br />
mathematical knowledge, understand<strong>in</strong>g or skill to analyse and deal with the situation. Four<br />
situations are def<strong>in</strong>ed <strong>in</strong> the <strong>PISA</strong> mathematical literacy framework: personal, educational or<br />
occupational, public, and scientific. Assessment items are placed with<strong>in</strong> each <strong>of</strong> these contexts.<br />
<strong>The</strong> situations differ <strong>in</strong> terms <strong>of</strong> how directly the problem affects <strong>students</strong>’ lives, that is, the degree<br />
<strong>of</strong> immediacy and directness <strong>in</strong> the connection between the student and the problem context.<br />
For example, personal situations are closest to the student and are characterised by the direct<br />
perceptions <strong>in</strong>volved. <strong>The</strong> situations also differ <strong>in</strong> the extent to which the mathematical aspects<br />
are explicit. Although some tasks <strong>in</strong> the assessment refer only to mathematical objects, symbols<br />
or structures, and make no reference to matters outside the mathematical world, more typically,<br />
the problems are not stated <strong>in</strong> explicit mathematical terms. This reflects the strong emphasis <strong>in</strong><br />
the <strong>PISA</strong> mathematical literacy assessment on explor<strong>in</strong>g the extent to which <strong>students</strong> can identify<br />
mathematical features <strong>of</strong> a problem when it is presented <strong>in</strong> a non-mathematical context, and can<br />
activate their mathematical knowledge to explore and solve the problem and to make sense <strong>of</strong> the<br />
solution <strong>in</strong> the context or situation <strong>in</strong> which the problem arose.<br />
Mathematical Content<br />
<strong>The</strong> <strong>PISA</strong> framework def<strong>in</strong>es mathematical content <strong>in</strong> terms <strong>of</strong> four broad knowledge doma<strong>in</strong>s<br />
and <strong>in</strong>cludes the k<strong>in</strong>ds <strong>of</strong> problems <strong>in</strong>dividuals may come across through <strong>in</strong>teraction with day-today<br />
phenomena and that are based on a conception <strong>of</strong> the ways <strong>in</strong> which mathematical content<br />
presents itself to people. <strong>The</strong>se broad knowledge doma<strong>in</strong>s, referred to as overarch<strong>in</strong>g ideas, reflect<br />
historically well-established branches <strong>of</strong> mathematical th<strong>in</strong>k<strong>in</strong>g and underp<strong>in</strong> mathematical<br />
curricula <strong>in</strong> education systems throughout the world. Together, these broad content areas cover<br />
the range <strong>of</strong> mathematics that 15-year-old <strong>students</strong> need as a foundation for life and for further<br />
extend<strong>in</strong>g their horizon <strong>in</strong> mathematics. <strong>The</strong>re are four overarch<strong>in</strong>g ideas:<br />
◗ ◗ Space and shape relates to spatial and geometric phenomena and relationships, draw<strong>in</strong>g on<br />
the curriculum <strong>of</strong> geometry. Space and shape requires look<strong>in</strong>g for similarities and differences<br />
when analys<strong>in</strong>g the components <strong>of</strong> shapes, recognis<strong>in</strong>g shapes <strong>in</strong> different representations<br />
and different dimensions as well as understand<strong>in</strong>g the properties <strong>of</strong> objects and their<br />
relative positions, and the relationship between visual representations (both two- and threedimensional)<br />
and real objects.<br />
◗ ◗ Change and relationships relates most closely to the curriculum area <strong>of</strong> algebra and recognises<br />
the world is not a constant – every phenomenon is a manifestation <strong>of</strong> change. <strong>The</strong>se changes<br />
can be presented <strong>in</strong> a number <strong>of</strong> ways, <strong>in</strong>clud<strong>in</strong>g a simple equation, an algebraic expression,<br />
a graph or table. As different representations are appropriate <strong>in</strong> different situations, translation<br />
between representations is an important skill when deal<strong>in</strong>g with situations and tasks.<br />
24 Mathematical literacy
◗ ◗ Quantity <strong>in</strong>volves numeric phenomena and quantitative relationships and patterns. It relates<br />
to the understand<strong>in</strong>g <strong>of</strong> relative size, the recognition <strong>of</strong> numerical patterns, and the use <strong>of</strong><br />
numbers to represent quantities and quantifiable attributes <strong>of</strong> real world objects (count<strong>in</strong>g and<br />
measur<strong>in</strong>g). Furthermore, quantity deals with the process<strong>in</strong>g and understand<strong>in</strong>g <strong>of</strong> numbers<br />
that are represented <strong>in</strong> various ways.<br />
◗ ◗ Uncerta<strong>in</strong>ty <strong>in</strong>volves probabilistic and statistical phenomena and relationships. Uncerta<strong>in</strong>ty is<br />
present <strong>in</strong> daily life, where a great deal <strong>of</strong> <strong>in</strong>formation is <strong>of</strong>ten presented as precise and hav<strong>in</strong>g<br />
no error, when <strong>in</strong> fact there is a vary<strong>in</strong>g degree <strong>of</strong> uncerta<strong>in</strong>ty.<br />
Although the overarch<strong>in</strong>g ideas together generally encompass the range <strong>of</strong> mathematical topics<br />
that <strong>students</strong> are expected to have learned, the approach to content <strong>in</strong> <strong>PISA</strong> is somewhat different<br />
<strong>in</strong> terms <strong>of</strong> mathematical <strong>in</strong>struction and the curricular strands taught. <strong>The</strong> assessment <strong>in</strong> <strong>PISA</strong> is<br />
related more to the application <strong>of</strong> mathematical knowledge rather than what content has been<br />
learnt.<br />
Competencies<br />
While the overarch<strong>in</strong>g ideas def<strong>in</strong>e the ma<strong>in</strong> areas <strong>of</strong> mathematics that are assessed <strong>in</strong> <strong>PISA</strong>, they<br />
do not make explicit the mathematical processes that <strong>students</strong> apply as they attempt to solve<br />
problems. <strong>The</strong> <strong>PISA</strong> mathematics framework uses the term ‘mathematisation’ to def<strong>in</strong>e the cycle<br />
<strong>of</strong> activity for <strong>in</strong>vestigat<strong>in</strong>g and solv<strong>in</strong>g real-world problems. Beg<strong>in</strong>n<strong>in</strong>g with a problem situated<br />
<strong>in</strong> reality, <strong>students</strong> must organise it accord<strong>in</strong>g to mathematical concepts. <strong>The</strong>y progressively trim<br />
away the reality <strong>in</strong> order to transform the problem <strong>in</strong>to one that is amenable to direct mathematical<br />
solution. Students can then apply specific mathematical knowledge and skills to solve the<br />
mathematical problem, before us<strong>in</strong>g some form <strong>of</strong> translation <strong>of</strong> the mathematical results <strong>in</strong>to a<br />
solution that works for the orig<strong>in</strong>al problem context; for example, this may <strong>in</strong>volve the formulation<br />
<strong>of</strong> an explanation or justification <strong>of</strong> pro<strong>of</strong>.<br />
Various competencies are called <strong>in</strong>to play as the mathematisation process is employed. <strong>The</strong> <strong>PISA</strong><br />
mathematics framework discusses and groups the competencies <strong>in</strong> three competency clusters:<br />
reproduction, connections, and reflections.<br />
Mathematical literacy performance: scale scores<br />
<strong>Indigenous</strong> <strong>students</strong>’ <strong>PISA</strong> results on mathematical literacy were significantly lower than that <strong>of</strong><br />
non-<strong>Indigenous</strong> <strong>students</strong>. Results for the three completed cycles <strong>of</strong> <strong>PISA</strong> are shown <strong>in</strong> Table 3.1,<br />
together with results for all Australian <strong>students</strong> and the OECD average.<br />
Table 3.1: Means and standard errors for <strong>Indigenous</strong> and non-<strong>Indigenous</strong> <strong>students</strong> on the overall<br />
mathematical literacy scale<br />
<strong>PISA</strong> 2000 <strong>PISA</strong> 2003 <strong>PISA</strong> 2006<br />
Student group<br />
Mean SE Mean SE Mean SE<br />
<strong>Indigenous</strong> 449 7.5 440 5.4 442 7.3<br />
Non-<strong>Indigenous</strong> 535 3.4 526 2.1 522 2.3<br />
Australia 533 3.5 524 2.1 520 2.2<br />
OECD average 500 0.7 500 0.6 498 0.5<br />
In <strong>PISA</strong> 2000, <strong>Indigenous</strong> <strong>students</strong> achieved a mean score 86 po<strong>in</strong>ts lower than that <strong>of</strong> non-<br />
<strong>Indigenous</strong> <strong>students</strong>. <strong>The</strong> large differences <strong>in</strong> mathematical literacy performance cont<strong>in</strong>ued <strong>in</strong><br />
subsequent <strong>PISA</strong> cycles, with <strong>Indigenous</strong> <strong>students</strong> perform<strong>in</strong>g 86 score po<strong>in</strong>ts lower that non-<br />
<strong>Indigenous</strong> <strong>students</strong> <strong>in</strong> <strong>PISA</strong> 2003 and 80 score po<strong>in</strong>ts lower <strong>in</strong> <strong>PISA</strong> 2006. In mathematical<br />
literacy, one pr<strong>of</strong>iciency level equates to 62 score po<strong>in</strong>ts. <strong>Indigenous</strong> <strong>students</strong> also performed<br />
significantly lower (by almost one pr<strong>of</strong>iciency level) than the OECD average.<br />
<strong>The</strong> <strong>achievement</strong> <strong>of</strong> Australia’s <strong>Indigenous</strong> <strong>students</strong> <strong>in</strong> <strong>PISA</strong> 2000 – 2006 25
Figure 3.1 presents the distribution <strong>of</strong> performance scores for <strong>PISA</strong> 2003 on the mathematical<br />
literacy scale. Although many <strong>Indigenous</strong> <strong>students</strong> performed at very low levels, there were also<br />
some <strong>Indigenous</strong> <strong>students</strong> who performed very well. This figure shows that there was a spread<br />
<strong>of</strong> 304 score po<strong>in</strong>ts between the 5th and 95th percentile for <strong>Indigenous</strong> <strong>students</strong>. <strong>The</strong> spread <strong>of</strong><br />
scores for non-<strong>Indigenous</strong> <strong>students</strong> between the 5th and 95th percentile was similar, at 310 score<br />
po<strong>in</strong>ts. <strong>The</strong> spread <strong>of</strong> scores found <strong>in</strong> <strong>PISA</strong> 2000 and <strong>PISA</strong> 2006 was comparable to that <strong>of</strong> <strong>PISA</strong><br />
2003.<br />
<strong>Indigenous</strong><br />
<strong>students</strong><br />
Non-<strong>Indigenous</strong><br />
<strong>students</strong><br />
150 250 350 450 550 650 750<br />
Performance scores<br />
Figure 3.1: Distribution <strong>of</strong> <strong>Indigenous</strong> and non-<strong>Indigenous</strong> <strong>students</strong> on the mathematical literacy scale for<br />
<strong>PISA</strong> 2003<br />
Mathematical literacy performance: pr<strong>of</strong>iciency levels<br />
For mathematical literacy <strong>in</strong> <strong>PISA</strong> 2003, six levels <strong>of</strong> pr<strong>of</strong>iciency were def<strong>in</strong>ed and described. Each<br />
pr<strong>of</strong>iciency level equates to 62 score po<strong>in</strong>ts. <strong>The</strong> <strong>in</strong>formation about the items <strong>in</strong> each level has<br />
been used to develop summary descriptions <strong>of</strong> the k<strong>in</strong>ds <strong>of</strong> mathematical competencies associated<br />
with different levels <strong>of</strong> pr<strong>of</strong>iciency. As a set, the descriptions encapsulate a representation <strong>of</strong><br />
growth <strong>in</strong> mathematical literacy.<br />
Mathematical pr<strong>of</strong>iciency Level 6<br />
<strong>The</strong>se <strong>students</strong> can conceptualise, generalise and utilise <strong>in</strong>formation based on their <strong>in</strong>vestigation<br />
and modell<strong>in</strong>g <strong>of</strong> complex problem situations. <strong>The</strong>y can l<strong>in</strong>k different <strong>in</strong>formation sources and<br />
representations and flexibly translate among them. Students at this level are capable <strong>of</strong> advanced<br />
mathematical th<strong>in</strong>k<strong>in</strong>g and reason<strong>in</strong>g. <strong>The</strong>se <strong>students</strong> can apply this <strong>in</strong>sight and understand<strong>in</strong>g<br />
along with a mastery <strong>of</strong> symbolic and formal mathematical operations and relationships to develop<br />
new approaches and strategies for attack<strong>in</strong>g novel situations. Students at this level can formulate<br />
and precisely communicate their actions and reflections regard<strong>in</strong>g their f<strong>in</strong>d<strong>in</strong>gs, <strong>in</strong>terpretations,<br />
arguments, and the appropriateness <strong>of</strong> these to the orig<strong>in</strong>al situations. Students who scored higher<br />
than 669.3 were pr<strong>of</strong>icient at Level 6 on the mathematical literacy scale.<br />
<strong>The</strong>re were very few <strong>Indigenous</strong> <strong>students</strong> who achieved this high level <strong>of</strong> mathematical literacy<br />
pr<strong>of</strong>iciency. Only one per cent <strong>of</strong> <strong>Indigenous</strong> <strong>students</strong> achieved Level 6, while six per cent <strong>of</strong> non-<br />
<strong>Indigenous</strong> <strong>students</strong>, eleven per cent <strong>of</strong> <strong>students</strong> from Hong Kong-Ch<strong>in</strong>a (the highest perform<strong>in</strong>g<br />
country <strong>in</strong> mathematics <strong>in</strong> <strong>PISA</strong> 2003) and four per cent <strong>of</strong> <strong>students</strong> across OECD countries<br />
performed at this level.<br />
Mathematical pr<strong>of</strong>iciency Level 5<br />
Students at Level 5 can develop and work with models for complex situations, identify<strong>in</strong>g<br />
constra<strong>in</strong>ts and specify<strong>in</strong>g assumptions. <strong>The</strong>y can select, compare, and evaluate appropriate<br />
problem solv<strong>in</strong>g strategies for deal<strong>in</strong>g with complex problems related to these models. Students<br />
at this level can work strategically us<strong>in</strong>g broad, well-developed th<strong>in</strong>k<strong>in</strong>g and reason<strong>in</strong>g skills,<br />
appropriate l<strong>in</strong>ked representations, symbolic and formal characterisations, and <strong>in</strong>sight perta<strong>in</strong><strong>in</strong>g<br />
to these situations. <strong>The</strong>y can reflect on their actions and formulate and communicate their<br />
<strong>in</strong>terpretations and reason<strong>in</strong>g. A score higher than 607.0 but lower than or equal to 669.3 po<strong>in</strong>ts<br />
placed <strong>students</strong> at Level 5.<br />
26 Mathematical literacy
Four per cent <strong>of</strong> <strong>Indigenous</strong> <strong>students</strong> achieved at Level 5, compared to 14 per cent <strong>of</strong> non-<br />
<strong>Indigenous</strong> <strong>students</strong>. Across all OECD countries, an average <strong>of</strong> 11 per cent <strong>of</strong> <strong>students</strong> achieved at<br />
this level, while 20 per cent <strong>of</strong> <strong>students</strong> from Hong Kong-Ch<strong>in</strong>a did so.<br />
Mathematical pr<strong>of</strong>iciency Level 4<br />
At Level 4, <strong>students</strong> can work effectively with explicit models for complex concrete situations that<br />
may <strong>in</strong>volve constra<strong>in</strong>ts or call for mak<strong>in</strong>g assumptions. <strong>The</strong>y can select and <strong>in</strong>tegrate different<br />
representations, <strong>in</strong>clud<strong>in</strong>g symbolic ones, l<strong>in</strong>k<strong>in</strong>g them directly to aspects <strong>of</strong> real-world situations.<br />
Students at this level can utilise well-developed skills and reason flexibly, with some <strong>in</strong>sight, <strong>in</strong><br />
these contexts. <strong>The</strong>y can construct and communicate explanations and arguments based on their<br />
<strong>in</strong>terpretations, arguments, and actions. Students whose scores were higher than 544.7 but lower<br />
than or equal to 607.0 po<strong>in</strong>ts achieved a read<strong>in</strong>g pr<strong>of</strong>iciency at Level 4.<br />
Eight per cent <strong>of</strong> <strong>Indigenous</strong> <strong>students</strong> achieved a pr<strong>of</strong>iciency <strong>of</strong> Level 4, compared to 24 per<br />
cent <strong>of</strong> non-<strong>Indigenous</strong> Australian <strong>students</strong>. <strong>The</strong> average proportion <strong>of</strong> <strong>students</strong> reach<strong>in</strong>g Level 4<br />
across the OECD countries was 19 per cent, while 25 per cent <strong>of</strong> <strong>students</strong> from Hong Kong-Ch<strong>in</strong>a<br />
performed at Level 4.<br />
Mathematical pr<strong>of</strong>iciency Level 3<br />
Students perform<strong>in</strong>g at Level 3 can execute clearly described procedures, <strong>in</strong>clud<strong>in</strong>g those that<br />
require sequential decisions. <strong>The</strong>y can select and apply simple problem-solv<strong>in</strong>g strategies.<br />
Students at this level can <strong>in</strong>terpret and use representations based on different <strong>in</strong>formation<br />
sources and reason directly from them. <strong>The</strong>y can develop short communications report<strong>in</strong>g their<br />
<strong>in</strong>terpretations, results and reason<strong>in</strong>g. A score higher than 482.4 but lower than or equal to 544.7<br />
po<strong>in</strong>ts placed <strong>students</strong> at Level 3.<br />
Seventeen per cent <strong>of</strong> <strong>Indigenous</strong> <strong>students</strong> achieved Level 3, while 25 per cent <strong>of</strong> both non-<br />
<strong>Indigenous</strong> <strong>students</strong> and <strong>of</strong> Hong Kong-Ch<strong>in</strong>ese <strong>students</strong> were pr<strong>of</strong>icient <strong>in</strong> this level. Twenty per<br />
cent <strong>of</strong> <strong>students</strong> across all OECD countries were placed at Level 3.<br />
Mathematical pr<strong>of</strong>iciency Level 2<br />
At Level 2, <strong>students</strong> can <strong>in</strong>terpret and recognise situations <strong>in</strong> contexts that require no more<br />
than direct <strong>in</strong>ference. <strong>The</strong>y can extract relevant <strong>in</strong>formation from a s<strong>in</strong>gle source and make<br />
use <strong>of</strong> a s<strong>in</strong>gle representational mode. Students at this level can employ basic algorithms,<br />
formulae, procedures, or conventions. <strong>The</strong>y are capable <strong>of</strong> direct reason<strong>in</strong>g and mak<strong>in</strong>g literal<br />
<strong>in</strong>terpretations <strong>of</strong> the results. A score higher than 420.1 but lower than or equal to 482.4 po<strong>in</strong>ts<br />
placed <strong>students</strong> at Level 2.<br />
Twenty-seven per cent <strong>of</strong> <strong>Indigenous</strong> <strong>students</strong> achieved this level, compared to 18 per cent <strong>of</strong> non-<br />
<strong>Indigenous</strong> <strong>students</strong>, 14 per cent <strong>of</strong> <strong>students</strong> from Hong Kong-Ch<strong>in</strong>a and 21 per cent <strong>of</strong> <strong>students</strong> <strong>in</strong><br />
OECD countries.<br />
Mathematical pr<strong>of</strong>iciency Level 1<br />
Students at Level 1 can answer questions <strong>in</strong>volv<strong>in</strong>g familiar contexts where all relevant <strong>in</strong>formation<br />
is present and the questions are clearly def<strong>in</strong>ed. <strong>The</strong>y are able to identify <strong>in</strong>formation and to carry<br />
out rout<strong>in</strong>e procedures accord<strong>in</strong>g to direct <strong>in</strong>structions <strong>in</strong> explicit situations. <strong>The</strong>y can perform<br />
actions that are obvious and follow immediately from the given stimuli. Students whose scores<br />
were higher than 357.8 but lower than or equal to 420.1 po<strong>in</strong>ts achieved a read<strong>in</strong>g pr<strong>of</strong>iciency at<br />
Level 1.<br />
<strong>The</strong> <strong>achievement</strong> <strong>of</strong> Australia’s <strong>Indigenous</strong> <strong>students</strong> <strong>in</strong> <strong>PISA</strong> 2000 – 2006 27
Twenty-five per cent <strong>of</strong> <strong>Indigenous</strong> <strong>students</strong> were placed at this level, while four per cent <strong>of</strong> non-<br />
<strong>Indigenous</strong> <strong>students</strong> and <strong>students</strong> from Hong Kong-Ch<strong>in</strong>a performed at this level. On average, 13<br />
per cent <strong>of</strong> <strong>students</strong> across OECD countries performed at pr<strong>of</strong>iciency level 1.<br />
Not yet reached mathematical pr<strong>of</strong>iciency Level 1<br />
Students perform<strong>in</strong>g below 357.8 score po<strong>in</strong>ts, that is, below Level 1 are unable to complete<br />
the most basic type <strong>of</strong> mathematics that <strong>PISA</strong> seeks to measure. Students perform<strong>in</strong>g at this level<br />
would be expected to solve fewer than half <strong>of</strong> the tasks <strong>in</strong> an assessment made up <strong>of</strong> items drawn<br />
solely from Level 1. This raises grave concerns for the <strong>students</strong> placed at this level and the OECD<br />
have argued that performance at this level <strong>of</strong> pr<strong>of</strong>iciency po<strong>in</strong>ts to serious difficulties for young<br />
people <strong>in</strong> us<strong>in</strong>g mathematics to further their education, assist <strong>in</strong> learn<strong>in</strong>g throughout life and adapt<br />
to societal change.<br />
Almost twenty per cent <strong>of</strong> <strong>Indigenous</strong> <strong>students</strong>, or one <strong>in</strong> every five, were unable to demonstrate<br />
a pr<strong>of</strong>iciency <strong>of</strong> Level 1 <strong>in</strong> mathematical literacy, compared to four per cent <strong>of</strong> non-<strong>Indigenous</strong><br />
<strong>students</strong> and four per cent <strong>of</strong> <strong>students</strong> from Hong Kong-Ch<strong>in</strong>a. Eight per cent <strong>of</strong> <strong>students</strong> across<br />
OECD countries were placed below Level 1.<br />
<strong>The</strong> percentage <strong>of</strong> <strong>Indigenous</strong> and non-<strong>Indigenous</strong> <strong>students</strong> at each pr<strong>of</strong>iciency level for the overall<br />
mathematical literacy scale are shown <strong>in</strong> Figure 3.2. <strong>The</strong> figure also <strong>in</strong>cludes the OECD average<br />
and results for Hong Kong-Ch<strong>in</strong>a for comparison.<br />
<strong>Indigenous</strong><br />
18<br />
25<br />
27 17 8 4 1<br />
Non-<strong>Indigenous</strong><br />
4 10<br />
18 24 24 14 6<br />
OECD average<br />
8<br />
13<br />
21 24 19 11 4<br />
Hong Kong - Ch<strong>in</strong>a<br />
4 7<br />
14 20 25 20 11<br />
-100 -80 -60 -40 -20 0 20 40 60 80 100<br />
Percentage <strong>of</strong> <strong>students</strong><br />
Below Level 1 Level 1 Level 2 Level 3 Level 4 Level 5 Level 6<br />
Figure 3.2: Mathematical literacy pr<strong>of</strong>iciency levels for <strong>Indigenous</strong> and non-<strong>Indigenous</strong> <strong>students</strong>, the<br />
OECD average and Hong Kong-Ch<strong>in</strong>a for <strong>PISA</strong> 2003<br />
<strong>The</strong>re are large differences between the percentage <strong>of</strong> <strong>Indigenous</strong> <strong>students</strong> who achieved Level<br />
2 (the m<strong>in</strong>imum standard accepted by OECD) or higher compared to the other student groups.<br />
Fifty-seven per cent <strong>of</strong> <strong>Indigenous</strong> <strong>students</strong> achieved at least Level 2, while 86 per cent <strong>of</strong> non-<br />
<strong>Indigenous</strong> <strong>students</strong> and 90 per cent <strong>of</strong> Hong Kong-Ch<strong>in</strong>ese <strong>students</strong> performed at these levels.<br />
Across the participat<strong>in</strong>g OECD countries, the average proportion <strong>of</strong> <strong>students</strong> perform<strong>in</strong>g at Level 2<br />
or higher was 79 per cent.<br />
At the lower end <strong>of</strong> the mathematical literacy scale, 43 per cent <strong>of</strong> <strong>Indigenous</strong> <strong>students</strong> did not<br />
achieve a pr<strong>of</strong>iciency <strong>of</strong> Level 2. This is <strong>in</strong> comparison to fourteen per cent <strong>of</strong> non-<strong>Indigenous</strong><br />
<strong>students</strong>, eleven per cent <strong>of</strong> Hong Kong-Ch<strong>in</strong>ese <strong>students</strong> and 21 per cent <strong>of</strong> <strong>students</strong> across all<br />
OECD countries.<br />
28 Mathematical literacy
<strong>The</strong> percentages <strong>of</strong> <strong>Indigenous</strong> and non-<strong>Indigenous</strong> <strong>students</strong> who performed at each level on the<br />
mathematical literacy scale <strong>in</strong> <strong>PISA</strong> 2006 are shown <strong>in</strong> Table 3.2. Viewed <strong>in</strong> comb<strong>in</strong>ation with<br />
the proportions displayed <strong>in</strong> Figure 3.2, these show that the under-representation <strong>of</strong> <strong>Indigenous</strong><br />
<strong>students</strong> <strong>in</strong> the upper pr<strong>of</strong>iciency levels and the over-representation <strong>in</strong> the lower levels is evident<br />
over the two most recent cycles <strong>of</strong> <strong>PISA</strong>.<br />
Table 3.2: Mathematical literacy performance for <strong>Indigenous</strong> and non-<strong>Indigenous</strong> <strong>students</strong> for <strong>PISA</strong> 2006<br />
Below Level 1 Level 1 Level 2 Level 3 Level 4 Level 5 Level 6<br />
<strong>Indigenous</strong> 17 22 29 20 10 2 0<br />
Non-<strong>Indigenous</strong> 3 9 20 27 24 12 4<br />
<strong>Indigenous</strong> <strong>students</strong>’ performance from an <strong>in</strong>ternational<br />
perspective<br />
From Figure 3.3, <strong>in</strong> which country means and distributions <strong>of</strong> results on the mathematical literacy<br />
scale are shown, it can be seen that <strong>Indigenous</strong> <strong>students</strong> are one <strong>of</strong> the lowest perform<strong>in</strong>g groups<br />
compared to other <strong>students</strong> across the OECD <strong>in</strong> <strong>PISA</strong> 2003. Hong Kong-Ch<strong>in</strong>a was the highest<br />
perform<strong>in</strong>g country with a mean score <strong>of</strong> 550 po<strong>in</strong>ts. <strong>The</strong> average performance <strong>of</strong> <strong>Indigenous</strong><br />
<strong>students</strong> was 110 score po<strong>in</strong>ts or one-and-three-quarters <strong>of</strong> a pr<strong>of</strong>iciency level lower than that <strong>of</strong><br />
<strong>students</strong> from Hong Kong-Ch<strong>in</strong>a, and 60 score po<strong>in</strong>ts, or approximately one pr<strong>of</strong>iciency level,<br />
lower than the OECD average <strong>in</strong> mathematical literacy.<br />
Students <strong>in</strong> thirty countries performed at a level significantly higher than <strong>Indigenous</strong> Australian<br />
<strong>students</strong>. <strong>The</strong>se countries were those <strong>in</strong> Figure 3.3 from Hong Kong-Ch<strong>in</strong>a through to Portugal.<br />
<strong>The</strong>re were two countries, Serbia and Greece, <strong>in</strong> which <strong>students</strong> achieved equivalent results to<br />
<strong>Indigenous</strong> Australian <strong>students</strong>. Students <strong>in</strong> seven countries (Turkey, Uruguay, Thailand, Mexico,<br />
Indonesia, Tunisia and Brazil) performed significantly lower on average than <strong>Indigenous</strong> <strong>students</strong>.<br />
<strong>The</strong> <strong>achievement</strong> <strong>of</strong> Australia’s <strong>Indigenous</strong> <strong>students</strong> <strong>in</strong> <strong>PISA</strong> 2000 – 2006 29
Hong Kong-Ch<strong>in</strong>a*<br />
F<strong>in</strong>land<br />
Korea<br />
Netherlands<br />
Liechtenste<strong>in</strong>*<br />
Japan<br />
Canada<br />
Belgium<br />
Macao-Ch<strong>in</strong>a*<br />
Switzerland<br />
NON-INDIGENOUS STUDENTS<br />
New Zealand<br />
Australia<br />
Czech Republic<br />
Iceland<br />
Denmark<br />
France<br />
Sweden<br />
Austria<br />
Ireland<br />
Germany<br />
OECD Average<br />
Norway<br />
Luxembourg<br />
Poland<br />
Hungary<br />
Spa<strong>in</strong><br />
Latvia*<br />
United States<br />
Russian Federation*<br />
Italy<br />
Portugal<br />
Greece<br />
INDIGENOUS STUDENTS<br />
Serbia*<br />
Turkey<br />
Uruguay*<br />
Thailand*<br />
Mexico<br />
Indonesia*<br />
Tunisia*<br />
Brazil*<br />
* Partner country<br />
Significantly higher<br />
than the performance<br />
<strong>of</strong> <strong>Indigenous</strong><br />
<strong>students</strong><br />
Not significantly<br />
different from the<br />
performance <strong>of</strong><br />
<strong>Indigenous</strong><br />
<strong>students</strong><br />
Significantly lower<br />
than the performance<br />
<strong>of</strong> <strong>Indigenous</strong><br />
<strong>students</strong><br />
150 250 350 450 550 650 750<br />
Figure 3.3: International student performance <strong>in</strong> mathematical literacy for <strong>PISA</strong> 2003 <strong>in</strong>clud<strong>in</strong>g <strong>Indigenous</strong><br />
and non-<strong>Indigenous</strong> performance<br />
30 Mathematical literacy
Mathematical literacy performance by gender<br />
In <strong>PISA</strong> 2003, more than half <strong>of</strong> the participat<strong>in</strong>g countries had significant gender differences <strong>in</strong><br />
mathematical literacy that favoured males. <strong>The</strong>re was only one country (Iceland) <strong>in</strong> which females<br />
significantly outperformed their male peers. <strong>The</strong> performance advantage <strong>of</strong> males <strong>in</strong> this doma<strong>in</strong><br />
has cont<strong>in</strong>ued <strong>in</strong> <strong>PISA</strong> 2006.<br />
For both <strong>Indigenous</strong> and non-<strong>Indigenous</strong> <strong>students</strong>, there were no significant differences between<br />
females and males <strong>in</strong> <strong>PISA</strong> 2000 and <strong>PISA</strong> 2003 <strong>in</strong> mathematical literacy. In <strong>PISA</strong> 2006, however,<br />
non-<strong>Indigenous</strong> males performed significantly higher than non-<strong>Indigenous</strong> females with mean<br />
scores <strong>of</strong> 529 and 515 po<strong>in</strong>ts, respectively. <strong>The</strong>re was no such gender difference for <strong>Indigenous</strong><br />
<strong>students</strong>.<br />
On average across the <strong>PISA</strong> cycles, <strong>Indigenous</strong> females performed 49 score po<strong>in</strong>ts or<br />
approximately three-quarters <strong>of</strong> a pr<strong>of</strong>iciency level lower than the OECD average for females. <strong>The</strong><br />
difference between the average score for <strong>Indigenous</strong> males across the <strong>PISA</strong> cycles and the OECD<br />
average for males was larger at 62 score po<strong>in</strong>ts, which is the equivalent <strong>of</strong> one pr<strong>of</strong>iciency level.<br />
Table 3.3: Means and standard errors for <strong>Indigenous</strong> and non-<strong>Indigenous</strong> <strong>students</strong> by gender on the<br />
overall mathematical literacy scale<br />
<strong>PISA</strong> 2000 <strong>PISA</strong> 2003 <strong>PISA</strong> 2006<br />
Student group<br />
Mean SE Mean SE Mean SE<br />
<strong>Indigenous</strong> Females 453 11.3 446 4.9 436 10.9<br />
Males 445 9.1 435 8.5 448 8.4<br />
Non-<strong>Indigenous</strong> Females 529 5.0 523 2.7 515 2.4<br />
Males 541 4.0 529 2.9 529 3.2<br />
OECD average Females 495 0.9 494 0.8 492 0.6<br />
Males 506 1.0 506 0.8 503 0.7<br />
In <strong>PISA</strong> 2000 the spread <strong>of</strong> scores between the 5th and 95th percentiles for <strong>Indigenous</strong> females on<br />
the mathematical literacy scale was 281 score po<strong>in</strong>ts. This figure <strong>in</strong>creased to 308 score po<strong>in</strong>ts<br />
<strong>in</strong> <strong>PISA</strong> 2003, and to 316 score po<strong>in</strong>ts <strong>in</strong> <strong>PISA</strong> 2006. On the other hand, the spread <strong>of</strong> scores<br />
between the 5th and 95th percentiles for <strong>Indigenous</strong> males has decreased <strong>in</strong> each <strong>PISA</strong> cycle. In<br />
<strong>PISA</strong> 2000, there were 321 score po<strong>in</strong>ts between the 5th and 9th percentiles for <strong>Indigenous</strong> males.<br />
In <strong>PISA</strong> 2003 and <strong>PISA</strong> 2006 the distribution <strong>of</strong> these scores decreased to 300 and 293 score<br />
po<strong>in</strong>ts, respectively. <strong>The</strong> mean scores and distribution <strong>of</strong> scores for <strong>Indigenous</strong> and non-<strong>Indigenous</strong><br />
<strong>students</strong> by gender on the mathematical literacy scale for <strong>PISA</strong> 2003 are shown <strong>in</strong> Figure 3.4.<br />
<strong>The</strong> distribution <strong>of</strong> scores between the 5th and 95th percentiles for <strong>Indigenous</strong> females and non-<br />
<strong>Indigenous</strong> females was similar <strong>in</strong> <strong>PISA</strong> 2000. In <strong>PISA</strong> 2003 and <strong>PISA</strong> 2006, however, the spread<br />
<strong>of</strong> scores for non-<strong>Indigenous</strong> females was narrower than that for <strong>Indigenous</strong> females.<br />
In <strong>PISA</strong> 2000, there was a greater spread <strong>of</strong> performance for <strong>Indigenous</strong> males than for non-<br />
<strong>Indigenous</strong> males. In <strong>PISA</strong> 2003, <strong>Indigenous</strong> males had a narrower spread between the 5th and<br />
95th percentiles than that <strong>of</strong> non-<strong>Indigenous</strong> male <strong>students</strong>. In <strong>PISA</strong> 2006, the spread <strong>of</strong> results<br />
between the 5th and 95th percentiles for <strong>Indigenous</strong> males was very similar to that for non-<br />
<strong>Indigenous</strong> males.<br />
<strong>The</strong> <strong>achievement</strong> <strong>of</strong> Australia’s <strong>Indigenous</strong> <strong>students</strong> <strong>in</strong> <strong>PISA</strong> 2000 – 2006 31
<strong>Indigenous</strong><br />
females<br />
Non-<strong>Indigenous</strong><br />
females<br />
<strong>Indigenous</strong><br />
males<br />
Non-<strong>Indigenous</strong><br />
males<br />
150 250 350 450 550 650 750<br />
Figure 3.4: Distribution <strong>of</strong> <strong>Indigenous</strong> and non-<strong>Indigenous</strong> <strong>students</strong> on the mathematical literacy scale for<br />
<strong>PISA</strong> 2003<br />
<strong>The</strong> percentages <strong>of</strong> <strong>Indigenous</strong> and non-<strong>Indigenous</strong> females and males at each pr<strong>of</strong>iciency level<br />
for the overall mathematical literacy scale are shown <strong>in</strong> Figure 3.5 9 . Very few <strong>Indigenous</strong> males<br />
and females (4%) were able to perform some <strong>of</strong> the highly complex tasks required to reach Level 5<br />
or Level 6. Approximately five times the proportion <strong>of</strong> non-<strong>Indigenous</strong> <strong>students</strong> as <strong>Indigenous</strong><br />
<strong>students</strong> were perform<strong>in</strong>g at these high levels.<br />
Thirty-n<strong>in</strong>e per cent <strong>of</strong> <strong>Indigenous</strong> females and 46 per cent <strong>of</strong> <strong>Indigenous</strong> males performed below<br />
Level 2, <strong>in</strong>clud<strong>in</strong>g 18% <strong>of</strong> both males and females who did not reach Level 1.<br />
<strong>Indigenous</strong><br />
females<br />
<strong>Indigenous</strong><br />
males<br />
Non-<strong>Indigenous</strong><br />
females<br />
Non-<strong>Indigenous</strong><br />
males<br />
-100 -80 -60 -40 -20<br />
18<br />
18 28<br />
21<br />
4<br />
4<br />
9<br />
10<br />
0<br />
Percentage <strong>of</strong> <strong>students</strong><br />
26 21 10 4 1<br />
28 14 7 4 1<br />
19 25 24 14 5<br />
18 23 23 15 7<br />
20 40 60 80 100<br />
Below Level 1 Level 1 Level 2 Level 3 Level 4 Level 5 Level 6<br />
Figure 3.5: Mathematical literacy pr<strong>of</strong>iciency levels for <strong>Indigenous</strong> and non-<strong>Indigenous</strong> <strong>students</strong> by<br />
gender for <strong>PISA</strong> 2003<br />
Performance on the mathematical literacy subscales<br />
In addition to the overall mathematical literacy scale, results are also available for each <strong>of</strong> the<br />
subscales developed for <strong>PISA</strong> 2003: quantity, space and shape, change and relationships, and<br />
uncerta<strong>in</strong>ty. <strong>The</strong> results on the subscales can provide valuable <strong>in</strong>formation on the relative strengths<br />
and weaknesses <strong>of</strong> <strong>Indigenous</strong> <strong>students</strong>.<br />
<strong>Indigenous</strong> <strong>students</strong>’ performance <strong>in</strong> quantity<br />
<strong>Indigenous</strong> <strong>students</strong> achieved a mean score <strong>of</strong> 435 po<strong>in</strong>ts on the quantity subscale, while non-<br />
<strong>Indigenous</strong> <strong>students</strong> scored 84 po<strong>in</strong>ts, or one-and-a-third pr<strong>of</strong>iciency levels higher, with a mean<br />
score <strong>of</strong> 519 po<strong>in</strong>ts. <strong>Indigenous</strong> <strong>students</strong> performed around one pr<strong>of</strong>iciency level lower than<br />
the average for the OECD. Table 3.4 shows the mean scores for <strong>Indigenous</strong> and non-<strong>Indigenous</strong><br />
<strong>students</strong>, <strong>students</strong> from Hong Kong-Ch<strong>in</strong>a and the OECD average on the quantity subscale.<br />
9 Fewer than one per cent <strong>of</strong> <strong>Indigenous</strong> males and females achieved Level 6 and subsequently this<br />
proportion is not shown <strong>in</strong> this figure.<br />
32 Mathematical literacy
Table 3.4: Means and standard errors for <strong>Indigenous</strong> and non-<strong>Indigenous</strong> <strong>students</strong> on the quantity<br />
subscale for <strong>PISA</strong> 2003<br />
All Females Males<br />
Mean SE Mean SE Mean SE<br />
<strong>Indigenous</strong> <strong>students</strong> 435 6.0 443 5.4 428 9.4<br />
Non-<strong>Indigenous</strong> <strong>students</strong> 519 2.0 518 2.7 520 2.8<br />
OECD average 501 0.6 498 0.8 504 0.8<br />
Hong Kong-Ch<strong>in</strong>a 545 4.2 546 4.1 544 6.0<br />
While the mean score for <strong>Indigenous</strong> females appeared to be higher than that <strong>of</strong> <strong>Indigenous</strong><br />
males, there was no statistically significant difference between their performances on the quantity<br />
subscale. <strong>The</strong> mean and distribution <strong>of</strong> scores for <strong>Indigenous</strong> and non-<strong>Indigenous</strong> <strong>students</strong> by<br />
gender on the quantity subscale are shown <strong>in</strong> Figure 3.6. <strong>The</strong> distributions <strong>of</strong> scores between the<br />
5 th and 95 th percentiles for <strong>Indigenous</strong> females and males were similar at 305 and 308 score po<strong>in</strong>ts<br />
respectively. <strong>The</strong> spread <strong>of</strong> scores for <strong>Indigenous</strong> <strong>students</strong> was slightly narrower than for non-<br />
<strong>Indigenous</strong> <strong>students</strong>.<br />
<strong>Indigenous</strong><br />
females<br />
Non-<strong>Indigenous</strong><br />
females<br />
<strong>Indigenous</strong><br />
males<br />
Non-<strong>Indigenous</strong><br />
males<br />
150 250 350 450 550 650 750<br />
Figure 3.6: Distribution <strong>of</strong> <strong>Indigenous</strong> and on-<strong>Indigenous</strong> <strong>students</strong> on the quantity subscale by gender for<br />
<strong>PISA</strong> 2003<br />
Figure 3.7 shows the percentage <strong>of</strong> <strong>students</strong> at each pr<strong>of</strong>iciency level on the quantity subscale.<br />
At the upper end <strong>of</strong> the quantity subscale, only five per cent <strong>of</strong> <strong>Indigenous</strong> <strong>students</strong> performed at<br />
Level 5 or 6, while 18 per cent <strong>of</strong> non-<strong>Indigenous</strong> <strong>students</strong>, 28 per cent <strong>of</strong> <strong>students</strong> from Hong<br />
Kong-Ch<strong>in</strong>a and 15 per cent <strong>of</strong> <strong>students</strong> from across all OECD countries were placed at this level.<br />
At the lower end <strong>of</strong> the quantity subscale, 44 per cent <strong>of</strong> <strong>Indigenous</strong> <strong>students</strong> were not able to<br />
achieve Level 2 compared to 16 per cent <strong>of</strong> non-<strong>Indigenous</strong> <strong>students</strong>, 11 per cent <strong>of</strong> <strong>students</strong> from<br />
Hong Kong-Ch<strong>in</strong>a and 22 per cent <strong>of</strong> <strong>students</strong> across all OECD countries.<br />
<strong>Indigenous</strong><br />
22<br />
23<br />
25 18 8 4 1<br />
Non-<strong>Indigenous</strong><br />
5 11<br />
19 24 23 13 5<br />
OECD average<br />
9<br />
13<br />
20 24 20 11 4<br />
Hong Kong - Ch<strong>in</strong>a<br />
4<br />
7<br />
14 22 26 19 9<br />
-100 -80 -60 -40 -20 0 20 40 60 80 100<br />
Percentage <strong>of</strong> <strong>students</strong><br />
Below Level 1 Level 1 Level 2 Level 3 Level 4 Level 5 Level 6<br />
Figure 3.7: Pr<strong>of</strong>iciency levels on the quantity subscale for <strong>Indigenous</strong> and non-<strong>Indigenous</strong> <strong>students</strong>, Hong<br />
Kong-Ch<strong>in</strong>ese <strong>students</strong> and OECD average for <strong>PISA</strong> 2003<br />
<strong>The</strong> <strong>achievement</strong> <strong>of</strong> Australia’s <strong>Indigenous</strong> <strong>students</strong> <strong>in</strong> <strong>PISA</strong> 2000 – 2006 33
<strong>Indigenous</strong> <strong>students</strong>’ performance <strong>in</strong> space and shape<br />
<strong>The</strong> performance <strong>of</strong> <strong>Indigenous</strong> and non-<strong>Indigenous</strong> <strong>students</strong> on this subscale, along with results<br />
for Hong Kong-Ch<strong>in</strong>a and the OECD average are shown <strong>in</strong> Table 3.5.<br />
<strong>Indigenous</strong> <strong>students</strong> aga<strong>in</strong> scored significantly lower than non-<strong>Indigenous</strong> <strong>students</strong>, with mean<br />
scores <strong>of</strong> 439 and 522 score po<strong>in</strong>ts, respectively. <strong>Indigenous</strong> <strong>students</strong> scored 57 po<strong>in</strong>ts (or<br />
almost one pr<strong>of</strong>iciency level) lower than the OECD average, and 119 score po<strong>in</strong>ts (or almost two<br />
pr<strong>of</strong>iciency levels) lower than <strong>students</strong> from Hong Kong-Ch<strong>in</strong>a.<br />
Table 3.5: Means and standard errors for <strong>Indigenous</strong> and non-<strong>Indigenous</strong> <strong>students</strong> on the space and<br />
shape subscale for <strong>PISA</strong> 2003<br />
All Females Males<br />
Mean SE Mean SE Mean SE<br />
<strong>Indigenous</strong> <strong>students</strong> 439 6.9 442 5.4 436 12.1<br />
Non-<strong>Indigenous</strong> <strong>students</strong> 522 2.3 516 2.9 529 3.1<br />
OECD average 496 0.6 488 0.8 505 0.8<br />
Hong Kong-Ch<strong>in</strong>a 558 4.8 556 5.0 560 6.8<br />
Table 3.5 shows the mean scores and Figure 3.8 shows the distribution <strong>of</strong> scores for <strong>Indigenous</strong><br />
and non-<strong>Indigenous</strong> <strong>students</strong> by gender. <strong>The</strong>re was no significant difference between the average<br />
performances <strong>of</strong> <strong>Indigenous</strong> males (436 score po<strong>in</strong>ts) and females (442 score po<strong>in</strong>ts). Among<br />
non-<strong>Indigenous</strong> <strong>students</strong>, males performed at a significantly higher level than females, with mean<br />
scores <strong>of</strong> 529 and 516, respectively.<br />
Among the various mathematical literacy subscales, the shape and space subscale shows the<br />
largest gap between high and low perform<strong>in</strong>g <strong>students</strong> for females. <strong>The</strong> spread <strong>of</strong> scores for<br />
<strong>Indigenous</strong> females was 340 score po<strong>in</strong>ts, while on other subscales the spread <strong>of</strong> scores was<br />
approximately 320 score po<strong>in</strong>ts. For non-<strong>Indigenous</strong> females the spread was 328 score po<strong>in</strong>ts,<br />
compared to 300 score po<strong>in</strong>ts on other subscales.<br />
<strong>Indigenous</strong><br />
females<br />
Non-<strong>Indigenous</strong><br />
females<br />
<strong>Indigenous</strong><br />
males<br />
Non-<strong>Indigenous</strong><br />
males<br />
150 250 350 450 550 650 750<br />
Figure 3.8: Distribution <strong>of</strong> <strong>Indigenous</strong> and on-<strong>Indigenous</strong> <strong>students</strong> on the space and shape subscale by<br />
gender for <strong>PISA</strong> 2003<br />
Only a small proportion <strong>of</strong> <strong>Indigenous</strong> <strong>students</strong> (5%) were able to perform the highly complex<br />
tasks required to reach Level 5 and 6 on the space and shape subscale. <strong>The</strong>re were 20 per cent <strong>of</strong><br />
non-<strong>Indigenous</strong> <strong>students</strong>, 36 per cent <strong>of</strong> Hong Kong-Ch<strong>in</strong>ese <strong>students</strong> and 16 per cent <strong>of</strong> <strong>students</strong><br />
from all OECD countries who performed at these high levels. Forty-three per cent <strong>of</strong> <strong>Indigenous</strong><br />
<strong>students</strong> compared to 17 per cent <strong>of</strong> non-<strong>Indigenous</strong> <strong>students</strong>, 11 per cent <strong>of</strong> <strong>students</strong> from Hong<br />
Kong-Ch<strong>in</strong>a and 25 per cent <strong>of</strong> <strong>students</strong> across all OECD countries were not able to complete tasks<br />
at Level 2 <strong>in</strong> the space and shape subscale (Figure 3.9).<br />
34 Mathematical literacy
<strong>Indigenous</strong><br />
21<br />
22<br />
26 17 9 4 1<br />
Non-<strong>Indigenous</strong><br />
6 11<br />
18 23 21 13 7<br />
OECD average<br />
11<br />
14<br />
20 22 17 10 6<br />
Hong Kong - Ch<strong>in</strong>a<br />
4<br />
7<br />
13 19 22 20 16<br />
-100 -80 -60 -40 -20 0 20 40 60 80 100<br />
Percentage <strong>of</strong> <strong>students</strong><br />
Below Level 1 Level 1 Level 2 Level 3 Level 4 Level 5 Level 6<br />
Figure 3.9: Pr<strong>of</strong>iciency levels on the space and shape subscale for <strong>Indigenous</strong> and non-<strong>Indigenous</strong><br />
<strong>students</strong>, Hong Kong - Ch<strong>in</strong>ese <strong>students</strong> and OECD average for <strong>PISA</strong> 2003<br />
<strong>Indigenous</strong> <strong>students</strong>’ performance <strong>in</strong> change and relationships<br />
<strong>Indigenous</strong> <strong>students</strong> achieved a mean score <strong>of</strong> 441 po<strong>in</strong>ts on the change and relationships<br />
subscale, which was significantly lower than the mean scores for non-<strong>Indigenous</strong> <strong>students</strong>,<br />
<strong>students</strong> from Hong Kong-Ch<strong>in</strong>a and <strong>students</strong> across OECD countries (Table 3.6). <strong>The</strong> average<br />
performance <strong>of</strong> <strong>Indigenous</strong> Australian <strong>students</strong> was around one-and-a-half pr<strong>of</strong>iciency levels lower<br />
than that <strong>of</strong> non-<strong>Indigenous</strong> Australian <strong>students</strong>, more than one-and-a-half pr<strong>of</strong>iciency levels lower<br />
than <strong>students</strong> from Hong Kong-Ch<strong>in</strong>a and around one pr<strong>of</strong>iciency level lower than the OECD<br />
average.<br />
Table 3.6: Means and standard errors for <strong>Indigenous</strong> and non-<strong>Indigenous</strong> <strong>students</strong> on the change and<br />
relationships subscale for <strong>PISA</strong> 2003<br />
All Females Males<br />
Mean SE Mean SE Mean SE<br />
<strong>Indigenous</strong> <strong>students</strong> 441 7.3 449 5.6 432 11.6<br />
Non-<strong>Indigenous</strong> <strong>students</strong> 527 2.3 525 2.8 530 3.1<br />
OECD average 499 0.7 493 0.8 504 0.8<br />
Hong Kong-Ch<strong>in</strong>a 540 4.7 539 4.8 540 6.8<br />
<strong>The</strong> mean score for <strong>Indigenous</strong> females on the change and relationships subscale was 449 score<br />
po<strong>in</strong>ts, which was not significantly different to the mean score for <strong>Indigenous</strong> males at 432 po<strong>in</strong>ts.<br />
Figure 3.10 shows the distribution <strong>of</strong> scores on the change and relationships subscale for<br />
<strong>Indigenous</strong> and non-<strong>Indigenous</strong> <strong>students</strong> by gender. <strong>The</strong> spread <strong>of</strong> scores for <strong>Indigenous</strong> females<br />
was 317 score po<strong>in</strong>ts, which was slightly wider than that for <strong>Indigenous</strong> males (307 score po<strong>in</strong>ts).<br />
For non-<strong>Indigenous</strong> <strong>students</strong>, the gap between highest and lowest perform<strong>in</strong>g males on the change<br />
and relationships subscale (334 score po<strong>in</strong>ts) was wider than that for females (301 score po<strong>in</strong>ts).<br />
<strong>Indigenous</strong><br />
females<br />
Non-<strong>Indigenous</strong><br />
females<br />
<strong>Indigenous</strong><br />
males<br />
Non-<strong>Indigenous</strong><br />
males<br />
150 250 350 450 550 650 750<br />
Figure 3.10: Distribution <strong>of</strong> <strong>Indigenous</strong> and on-<strong>Indigenous</strong> <strong>students</strong> on the change and relationships<br />
subscale by gender for <strong>PISA</strong> 2003<br />
<strong>The</strong> <strong>achievement</strong> <strong>of</strong> Australia’s <strong>Indigenous</strong> <strong>students</strong> <strong>in</strong> <strong>PISA</strong> 2000 – 2006 35
Figure 3.11 shows the pr<strong>of</strong>iciency levels for <strong>Indigenous</strong> and non-<strong>Indigenous</strong> <strong>students</strong> on the<br />
change and relationship subscale, along with results for the OECD average and Hong Kong-Ch<strong>in</strong>a.<br />
Only five per cent <strong>of</strong> <strong>Indigenous</strong> <strong>students</strong> were able to achieve at the upper end <strong>of</strong> the change and<br />
relationship subscale, perform<strong>in</strong>g at Level 5 or 6. This was less than one quarter <strong>of</strong> the proportion<br />
<strong>of</strong> non-<strong>Indigenous</strong> <strong>students</strong> perform<strong>in</strong>g at the same levels (21%), which was slightly higher than<br />
the OECD average <strong>of</strong> 16 per cent. At the lower end <strong>of</strong> the pr<strong>of</strong>iciency scale, 41 per cent <strong>of</strong><br />
<strong>Indigenous</strong> <strong>students</strong> were not able to achieve Level 2, compared to 13 per cent <strong>of</strong> non-<strong>Indigenous</strong><br />
<strong>students</strong> and 14 per cent <strong>of</strong> <strong>students</strong> from Hong Kong-Ch<strong>in</strong>a and 23 per cent <strong>of</strong> <strong>students</strong> across all<br />
OECD countries.<br />
<strong>Indigenous</strong><br />
20<br />
21<br />
26 18 9 4 1<br />
Non-<strong>Indigenous</strong><br />
4 9<br />
18 24 23 14 7<br />
OECD average<br />
10<br />
13<br />
20 22 19 11 5<br />
Hong Kong - Ch<strong>in</strong>a<br />
6<br />
8<br />
15 21 23 19 10<br />
-100 -80 -60 -40 -20 0 20 40 60 80 100<br />
Percentage <strong>of</strong> <strong>students</strong><br />
Below Level 1 Level 1 Level 2 Level 3 Level 4 Level 5 Level 6<br />
Figure 3.11: Pr<strong>of</strong>iciency levels on the change and relationship subscale for <strong>Indigenous</strong> and non-<br />
<strong>Indigenous</strong> <strong>students</strong>, Hong Kong-Ch<strong>in</strong>ese <strong>students</strong> and OECD average for <strong>PISA</strong> 2003<br />
<strong>Indigenous</strong> <strong>students</strong>’ performance <strong>in</strong> uncerta<strong>in</strong>ty<br />
<strong>The</strong> performance <strong>of</strong> <strong>Indigenous</strong> and non-<strong>Indigenous</strong> <strong>students</strong> on the uncerta<strong>in</strong>ty subscale are<br />
shown <strong>in</strong> Table 3.7.<br />
<strong>Indigenous</strong> <strong>students</strong>’ mean (442 score po<strong>in</strong>ts) on the uncerta<strong>in</strong>ty subscale was aga<strong>in</strong> significantly<br />
lower than that <strong>of</strong> non-<strong>Indigenous</strong> <strong>students</strong> (533 score po<strong>in</strong>ts) and the OECD average (502 score<br />
po<strong>in</strong>ts). <strong>The</strong> average performance <strong>of</strong> <strong>Indigenous</strong> <strong>students</strong> was almost one-and-a-half pr<strong>of</strong>iciency<br />
levels lower than the performance <strong>of</strong> non-<strong>Indigenous</strong> <strong>students</strong>, and approximately one pr<strong>of</strong>iciency<br />
level lower than the OECD average.<br />
Table 3.7: Means and standard errors for <strong>Indigenous</strong> and non-<strong>Indigenous</strong> <strong>students</strong> on the uncerta<strong>in</strong>ty<br />
subscale for <strong>PISA</strong> 2003<br />
All Females Males<br />
Mean SE Mean SE Mean SE<br />
<strong>Indigenous</strong> <strong>students</strong> 442 6.8 447 6.2 438 10.4<br />
Non-<strong>Indigenous</strong> <strong>students</strong> 533 2.2 529 2.8 537 2.9<br />
OECD average 502 0.6 496 0.8 508 0.7<br />
Hong Kong-Ch<strong>in</strong>a 558 4.6 552 4.6 564 6.6<br />
As with the other mathematical literacy subscales, there was no statistically significant difference<br />
between the average scores <strong>of</strong> <strong>Indigenous</strong> males (438) and females (447) on the uncerta<strong>in</strong>ty<br />
subscale. Non-<strong>Indigenous</strong> males performed significantly better than non-<strong>in</strong>digenous females on<br />
this subscale, however, with mean scores <strong>of</strong> 537 and 529 po<strong>in</strong>ts, respectively.<br />
<strong>The</strong> distribution <strong>of</strong> scores for <strong>Indigenous</strong> and non-<strong>Indigenous</strong> females and males on the uncerta<strong>in</strong>ty<br />
subscale are shown <strong>in</strong> Figure 3.12. For <strong>Indigenous</strong> <strong>students</strong>, the difference between the 5th and<br />
95th percentiles was similar for male and female <strong>students</strong>, close to 320 score po<strong>in</strong>ts. Among non-<br />
<strong>Indigenous</strong> <strong>students</strong>, the spread <strong>of</strong> scores was larger for males, at 330 po<strong>in</strong>ts, than the spread <strong>of</strong><br />
scores for females, which was 302 po<strong>in</strong>ts.<br />
36 Mathematical literacy
<strong>Indigenous</strong><br />
females<br />
Non-<strong>Indigenous</strong><br />
females<br />
<strong>Indigenous</strong><br />
males<br />
Non-<strong>Indigenous</strong><br />
males<br />
150 250 350 450 550 650 750<br />
Figure 3.12: Distribution <strong>of</strong> <strong>Indigenous</strong> and on-<strong>Indigenous</strong> <strong>students</strong> on the uncerta<strong>in</strong>ty subscale by<br />
gender for <strong>PISA</strong> 2003<br />
At the upper end <strong>of</strong> the uncerta<strong>in</strong>ty subscale, only five per cent <strong>of</strong> <strong>Indigenous</strong> <strong>students</strong>, or one <strong>in</strong><br />
every twenty <strong>students</strong>, performed at Level 5 or 6, while 23 per cent <strong>of</strong> non-<strong>Indigenous</strong> <strong>students</strong>,<br />
34 per cent <strong>of</strong> <strong>students</strong> from Hong Kong-Ch<strong>in</strong>a and 15 per cent <strong>of</strong> <strong>students</strong> from across all OECD<br />
countries were placed at this level. At the lower end <strong>of</strong> the uncerta<strong>in</strong>ty subscale, 40 per cent <strong>of</strong><br />
<strong>Indigenous</strong> <strong>students</strong> were not able to achieve a pr<strong>of</strong>iciency <strong>of</strong> Level 2, compared with 13 per cent<br />
<strong>of</strong> non-<strong>Indigenous</strong> <strong>students</strong>, n<strong>in</strong>e per cent <strong>of</strong> <strong>students</strong> from Hong Kong-Ch<strong>in</strong>a and 20 per cent<br />
<strong>of</strong> <strong>students</strong> across all OECD countries who did not reach this standard. Figure 3.13 shows the<br />
percentage <strong>of</strong> <strong>students</strong> at each pr<strong>of</strong>iciency level on the uncerta<strong>in</strong>ty subscale.<br />
<strong>Indigenous</strong><br />
19<br />
21<br />
28 17 9 4 1<br />
Non-<strong>Indigenous</strong><br />
4 9<br />
17 24 23 15 8<br />
OECD average<br />
7<br />
13<br />
22 24 19 11 4<br />
Hong Kong - Ch<strong>in</strong>a<br />
3<br />
6<br />
13 19 25 21 13<br />
-100 -80 -60 -40 -20 0 20 40 60 80 100<br />
Percentage <strong>of</strong> <strong>students</strong><br />
Below Level 1 Level 1 Level 2 Level 3 Level 4 Level 5 Level 6<br />
Figure 3.13: Pr<strong>of</strong>iciency levels on the uncerta<strong>in</strong>ty subscale for <strong>Indigenous</strong> and non-<strong>Indigenous</strong> <strong>students</strong>,<br />
Hong Kong - Ch<strong>in</strong>ese <strong>students</strong> and OECD average for <strong>PISA</strong> 2003<br />
Performance <strong>in</strong> mathematical literacy over time<br />
In the previous chapter, read<strong>in</strong>g literacy performance across <strong>PISA</strong> cycles was exam<strong>in</strong>ed. <strong>The</strong><br />
cautions that were outl<strong>in</strong>ed <strong>in</strong> Chapter 2 also apply when compar<strong>in</strong>g student performance <strong>in</strong><br />
mathematical literacy over time.<br />
As the first major doma<strong>in</strong> assessment <strong>of</strong> mathematical literacy took place <strong>in</strong> 2003, it is only<br />
possible to compare mathematical literacy from 2003 onwards. Table 3.8 shows the mean<br />
performance <strong>of</strong> <strong>Indigenous</strong> <strong>students</strong> <strong>in</strong> <strong>PISA</strong> 2003 and <strong>PISA</strong> 2006. Across these two cycles, there<br />
was an <strong>in</strong>crease <strong>of</strong> two score po<strong>in</strong>ts <strong>in</strong> the average performance <strong>of</strong> Australian <strong>students</strong>, which is not<br />
a statistically significant change.<br />
Table 3.8: Mean mathematical literacy scores and standard errors for <strong>PISA</strong> 2003 and <strong>PISA</strong> 2006, and<br />
differences between performance <strong>in</strong> cycles for <strong>Indigenous</strong> <strong>students</strong><br />
<strong>PISA</strong> 2003 <strong>PISA</strong> 2006<br />
Differences between <strong>PISA</strong><br />
2003 and <strong>PISA</strong> 2006<br />
Mean SE Mean SE Diff. SE<br />
440 5.4 442 7.3 2 9.2<br />
<strong>The</strong> <strong>achievement</strong> <strong>of</strong> Australia’s <strong>Indigenous</strong> <strong>students</strong> <strong>in</strong> <strong>PISA</strong> 2000 – 2006 37
Summary<br />
<strong>Indigenous</strong> <strong>students</strong>’ results <strong>in</strong> mathematical literacy <strong>in</strong> <strong>PISA</strong> were substantially lower than those <strong>of</strong><br />
non-<strong>Indigenous</strong> <strong>students</strong>, and also substantially lower than the OECD average.<br />
On the mathematical literacy pr<strong>of</strong>iciency scale <strong>in</strong> <strong>PISA</strong> 2003, only a small proportion <strong>of</strong><br />
<strong>Indigenous</strong> <strong>students</strong> achieved Level 5 or 6, while around one <strong>in</strong> five non-<strong>Indigenous</strong> <strong>students</strong><br />
were perform<strong>in</strong>g at these levels. At the lower end <strong>of</strong> the mathematical literacy scale, 43 per cent<br />
<strong>of</strong> <strong>Indigenous</strong> <strong>students</strong> did not achieve a pr<strong>of</strong>iciency <strong>of</strong> Level 2 compared to 14 per cent <strong>of</strong> non-<br />
<strong>Indigenous</strong> <strong>students</strong>.<br />
While there was little difference <strong>in</strong> the proportion <strong>of</strong> male and female <strong>students</strong> achiev<strong>in</strong>g at the<br />
highest pr<strong>of</strong>iciency levels <strong>in</strong> mathematics, a greater proportion <strong>of</strong> male <strong>Indigenous</strong> <strong>students</strong> than<br />
female <strong>Indigenous</strong> <strong>students</strong> failed to achieve pr<strong>of</strong>iciency level 2.<br />
<strong>The</strong> performance <strong>of</strong> <strong>Indigenous</strong> <strong>students</strong> on the quantity and space and shape subscales was much<br />
lower than that <strong>of</strong> non-<strong>Indigenous</strong> <strong>students</strong>. This difference was even larger on the uncerta<strong>in</strong>ty and<br />
change and relationships subscales. Among <strong>Indigenous</strong> <strong>students</strong>, there were no significant gender<br />
differences on any <strong>of</strong> the subscales.<br />
On each <strong>of</strong> the subscales, there were approximately five per cent <strong>of</strong> <strong>Indigenous</strong> <strong>students</strong><br />
perform<strong>in</strong>g at the upper end <strong>of</strong> the pr<strong>of</strong>iciency level (Level 5 or 6) while approximately 40% or<br />
more <strong>of</strong> <strong>Indigenous</strong> <strong>students</strong> achieved at Level 2 or below.<br />
<strong>The</strong>re were no significant differences between the performance <strong>of</strong> <strong>Indigenous</strong> <strong>students</strong> <strong>in</strong> <strong>PISA</strong><br />
2003 and <strong>PISA</strong> 2006.<br />
38 Mathematical literacy
Chapter<br />
4<br />
Scientific<br />
literacy<br />
Scientific literacy was the major doma<strong>in</strong> <strong>of</strong> assessment for <strong>PISA</strong> 2006. This allowed the scientific<br />
literacy framework to be expanded and scientific literacy performance to be assessed <strong>in</strong> far greater<br />
detail than <strong>in</strong> the previous <strong>PISA</strong> cycles.<br />
This chapter beg<strong>in</strong>s with a description <strong>of</strong> scientific literacy and how this doma<strong>in</strong> is measured <strong>in</strong><br />
<strong>PISA</strong> 10 . <strong>The</strong> performance <strong>of</strong> <strong>Indigenous</strong> and non-<strong>Indigenous</strong> <strong>students</strong> is then presented <strong>in</strong> a format<br />
similar to the previous two chapters.<br />
Def<strong>in</strong>ition <strong>of</strong> scientific literacy<br />
In <strong>PISA</strong>, scientific literacy is def<strong>in</strong>ed as:<br />
an <strong>in</strong>dividual’s scientific knowledge and use <strong>of</strong> that knowledge to identify questions, to<br />
acquire new knowledge, to expla<strong>in</strong> scientific phenomena, and to draw evidence-based<br />
conclusions about science-related issues, understand<strong>in</strong>g <strong>of</strong> the characteristic features<br />
<strong>of</strong> science as a form <strong>of</strong> human knowledge and enquiry, awareness <strong>of</strong> how science and<br />
technology shape our material, <strong>in</strong>tellectual, and cultural environments, and will<strong>in</strong>gness<br />
to engage <strong>in</strong> science-related issues, and with the issues <strong>of</strong> science, as a reflective citizen.<br />
(OECD, 2006, p. 12)<br />
Scientific literacy relates to the ability to th<strong>in</strong>k scientifically and to use scientific knowledge and<br />
processes to both understand the world around us and to participate <strong>in</strong> decisions that affect it.<br />
Increas<strong>in</strong>gly, science and technology are shap<strong>in</strong>g our lives. Scientific literacy is considered to be<br />
a key outcome <strong>of</strong> education for all <strong>students</strong> by the end <strong>of</strong> school<strong>in</strong>g, not just for future scientists,<br />
given the grow<strong>in</strong>g centrality <strong>of</strong> science and technology <strong>in</strong> modern societies. <strong>The</strong> ability to th<strong>in</strong>k<br />
scientifically about evidence and the absence <strong>of</strong> evidence for claims that are made <strong>in</strong> the media<br />
and elsewhere is vital to daily life.<br />
<strong>The</strong> assessment framework for science <strong>in</strong>cludes three strands:<br />
◗◗ Scientific knowledge or concepts: <strong>The</strong>se constitute the l<strong>in</strong>ks that aid understand<strong>in</strong>g <strong>of</strong> related<br />
phenomena. In <strong>PISA</strong>, while the concepts are familiar ones relat<strong>in</strong>g to physics, chemistry,<br />
biological sciences, and Earth and space sciences, <strong>students</strong> are required to apply their<br />
knowledge <strong>of</strong> the content <strong>of</strong> the items and not just recall them.<br />
◗◗ Scientific processes or competencies: <strong>The</strong>se are centred on the ability to acquire, <strong>in</strong>terpret and<br />
act upon evidence. Three such processes present <strong>in</strong> <strong>PISA</strong> are: i) identify<strong>in</strong>g scientific issues, ii)<br />
expla<strong>in</strong><strong>in</strong>g phenomena scientifically, and iii) us<strong>in</strong>g scientific evidence.<br />
10 Information about the scientific literacy assessment framework has been taken from the <strong>PISA</strong> 2006<br />
National Report, Explor<strong>in</strong>g Scientific Literacy: How Australia measures up.<br />
<strong>The</strong> <strong>achievement</strong> <strong>of</strong> Australia’s <strong>Indigenous</strong> <strong>students</strong> <strong>in</strong> <strong>PISA</strong> 2000 – 2006 39
◗◗<br />
Situations and context: <strong>The</strong>se concern the application <strong>of</strong> scientific knowledge and the use<br />
<strong>of</strong> scientific processes. <strong>The</strong> framework identifies three ma<strong>in</strong> areas: science <strong>in</strong> life and health,<br />
science <strong>in</strong> Earth and environment, and science <strong>in</strong> technology.<br />
How scientific literacy is measured<br />
<strong>The</strong> scientific literacy framework <strong>in</strong> <strong>PISA</strong> 2006 comprises four <strong>in</strong>terrelated aspects: the contexts <strong>in</strong><br />
which tasks are embedded, the competencies that <strong>students</strong> need to apply, the knowledge doma<strong>in</strong>s<br />
<strong>in</strong>volved, and <strong>students</strong>’ attitudes towards science.<br />
<strong>The</strong> <strong>PISA</strong> 2006 science items were distributed across the three scientific competencies. Twentytwo<br />
per cent <strong>of</strong> the science tasks given to <strong>students</strong> <strong>in</strong> the <strong>PISA</strong> assessment were related to<br />
identify<strong>in</strong>g scientific issues, 48 per cent <strong>of</strong> science tasks related to expla<strong>in</strong><strong>in</strong>g phenomena<br />
scientifically and the rema<strong>in</strong><strong>in</strong>g 30 per cent <strong>of</strong> tasks were devoted to us<strong>in</strong>g scientific evidence.<br />
Context<br />
One <strong>of</strong> the foci <strong>of</strong> <strong>PISA</strong> is assess<strong>in</strong>g the extent to which young people are prepared for their future<br />
lives, and so the items for the <strong>PISA</strong> science assessment are situated <strong>in</strong> general life, not just life at<br />
school. In the <strong>PISA</strong> 2006 science assessment, the focus <strong>of</strong> the items was on situations relat<strong>in</strong>g to<br />
the self, family and peer groups (personal), to the community (social) and to life across the world<br />
(global). Some items were framed <strong>in</strong> an historical situation, <strong>in</strong> which an understand<strong>in</strong>g <strong>of</strong> the<br />
advances <strong>in</strong> scientific knowledge can be assessed.<br />
Competencies<br />
<strong>The</strong> <strong>PISA</strong> 2006 science assessment items required <strong>students</strong> to identify scientifically-oriented<br />
issues, expla<strong>in</strong> phenomena scientifically, and use scientific evidence. <strong>The</strong>se three competencies<br />
were chosen because <strong>of</strong> their importance to the practice <strong>of</strong> science and their connection to key<br />
cognitive abilities such as <strong>in</strong>ductive and deductive reason<strong>in</strong>g, systems-based th<strong>in</strong>k<strong>in</strong>g, critical<br />
decision mak<strong>in</strong>g, transformation <strong>of</strong> <strong>in</strong>formation (e.g. creat<strong>in</strong>g tables or graphs out <strong>of</strong> raw data),<br />
th<strong>in</strong>k<strong>in</strong>g <strong>in</strong> terms <strong>of</strong> models and use <strong>of</strong> science.<br />
Scientific knowledge<br />
In <strong>PISA</strong> 2006, scientific knowledge refers to both knowledge <strong>of</strong> science and knowledge about<br />
science itself. <strong>The</strong> areas <strong>of</strong> <strong>students</strong>’ knowledge <strong>of</strong> science assessed <strong>in</strong> <strong>PISA</strong> 2006 were selected<br />
from the major fields <strong>of</strong> physics, chemistry, biology, Earth and space science, and technology. <strong>The</strong><br />
assessment focused on the extent to which <strong>students</strong> were able to apply their knowledge <strong>in</strong> contexts<br />
<strong>of</strong> relevance to their lives.<br />
Four content areas are def<strong>in</strong>ed with<strong>in</strong> knowledge <strong>of</strong> science and represent knowledge required<br />
for understand<strong>in</strong>g the natural world and for mak<strong>in</strong>g sense <strong>of</strong> experiences <strong>in</strong> personal, social and<br />
global contexts.<br />
As well as knowledge <strong>of</strong> science, <strong>PISA</strong> 2006 assessed knowledge about science, for which there<br />
were two categories: scientific enquiry (which centres on enquiry as the central process <strong>of</strong> science<br />
and the various components <strong>of</strong> that process) and scientific explanations (which are the results <strong>of</strong><br />
scientific enquiry).<br />
Attitudes<br />
An important goal <strong>of</strong> science education is help<strong>in</strong>g <strong>students</strong> develop <strong>in</strong>terest <strong>in</strong> science and support<br />
for scientific enquiry. Attitudes towards science play an important role <strong>in</strong> <strong>students</strong>’ decisions to<br />
develop their science knowledge further, pursue careers <strong>in</strong> science, and use scientific concepts<br />
40 Scientific literacy
and methods productively throughout their lives. <strong>PISA</strong>’s view <strong>of</strong> scientific literacy <strong>in</strong>cludes not just<br />
a student’s performance <strong>in</strong> science assessments, but also their disposition towards science. This<br />
<strong>in</strong>cludes attitudes, beliefs, motivational orientations, self-efficacy, and values.<br />
Scientific literacy performance: scale scores<br />
<strong>Indigenous</strong> <strong>students</strong> performed significantly lower on average <strong>in</strong> scientific literacy than non-<br />
<strong>Indigenous</strong> <strong>students</strong>. Table 4.1 shows that <strong>Indigenous</strong> <strong>students</strong> scored, on average, more than one<br />
pr<strong>of</strong>iciency level (equivalent to 75 score po<strong>in</strong>ts) lower than non-<strong>Indigenous</strong> <strong>students</strong> <strong>in</strong> scientific<br />
literacy <strong>in</strong> each <strong>of</strong> the three cycles <strong>of</strong> <strong>PISA</strong>. <strong>The</strong> results for Australia and the OECD average have<br />
been <strong>in</strong>cluded <strong>in</strong> the table for comparison.<br />
In <strong>PISA</strong> 2000, <strong>Indigenous</strong> <strong>students</strong> achieved a mean score <strong>of</strong> 448 score po<strong>in</strong>ts, which was 81 score<br />
po<strong>in</strong>ts lower than the mean <strong>of</strong> 529 score po<strong>in</strong>ts for non-<strong>Indigenous</strong> <strong>students</strong>. In the next cycle <strong>of</strong><br />
<strong>PISA</strong>, <strong>in</strong> 2003, there was a difference <strong>of</strong> 93 score po<strong>in</strong>ts between <strong>Indigenous</strong> and non-<strong>Indigenous</strong><br />
<strong>students</strong>’ performances. In <strong>PISA</strong> 2006, <strong>Indigenous</strong> <strong>students</strong> achieved a mean score <strong>of</strong> 441 score<br />
po<strong>in</strong>ts for scientific literacy, compared to a mean score <strong>of</strong> 529 score po<strong>in</strong>ts for non-<strong>Indigenous</strong><br />
<strong>students</strong>. On average, <strong>Indigenous</strong> <strong>students</strong> performed about 60 score po<strong>in</strong>ts lower than the OECD<br />
average across the three <strong>PISA</strong> cycles. In each cycle, the difference between the mean scores <strong>of</strong><br />
<strong>Indigenous</strong> and non-<strong>Indigenous</strong> <strong>students</strong> was statistically significant.<br />
Table 4.1: Means and standard errors for <strong>Indigenous</strong> and non-<strong>Indigenous</strong> <strong>students</strong> on the overall scientific<br />
literacy scale<br />
Student group<br />
<strong>PISA</strong> 2000 <strong>PISA</strong> 2003 <strong>PISA</strong> 2006<br />
Mean SE Mean SE Mean SE<br />
<strong>Indigenous</strong> 448 9.5 434 7.7 441 7.8<br />
Non-<strong>Indigenous</strong> 529 3.5 527 2.0 529 2.3<br />
Australia 528 3.5 525 2.1 527 2.3<br />
OECD average 500 0.7 500 0.6 500 0.5<br />
Figure 4.1 shows the distribution <strong>of</strong> performance scores for <strong>Indigenous</strong> and non-<strong>Indigenous</strong><br />
<strong>students</strong>, as well as the OECD average on the scientific literacy scale for <strong>PISA</strong> 2006. <strong>The</strong> spread <strong>of</strong><br />
scores shows that although the average performance <strong>of</strong> <strong>Indigenous</strong> <strong>students</strong> is significantly lower<br />
than that <strong>of</strong> non-<strong>Indigenous</strong> <strong>students</strong> and the OECD average, and that there are some <strong>Indigenous</strong><br />
<strong>students</strong> whose performance is <strong>of</strong> great concern, there are also some <strong>students</strong> who are perform<strong>in</strong>g<br />
at reasonably high levels.<br />
<strong>Indigenous</strong> <strong>students</strong><br />
Non-<strong>Indigenous</strong> <strong>students</strong><br />
OECD average<br />
150 250 350 450 550 650 750<br />
Figure 4.1: Distribution <strong>of</strong> <strong>Indigenous</strong> and non-<strong>Indigenous</strong> <strong>students</strong> on the scientific literacy scale for<br />
<strong>PISA</strong> 2006<br />
<strong>The</strong> spread <strong>of</strong> scientific literacy scores between the 5 th and 95 th percentile for <strong>Indigenous</strong> <strong>students</strong><br />
has become wider <strong>in</strong> each <strong>PISA</strong> cycle. In <strong>PISA</strong> 2000, the spread <strong>of</strong> scores for <strong>Indigenous</strong> <strong>students</strong><br />
was 311 score po<strong>in</strong>ts. In <strong>PISA</strong> 2003, the spread <strong>of</strong> scores <strong>in</strong>creased to 332 score po<strong>in</strong>ts and <strong>in</strong><br />
<strong>PISA</strong> 2006 the spread <strong>of</strong> scores for <strong>Indigenous</strong> <strong>students</strong> between the 5 th and 95 th percentile was<br />
<strong>in</strong>creased further to 356 score po<strong>in</strong>ts.<br />
<strong>The</strong> <strong>achievement</strong> <strong>of</strong> Australia’s <strong>Indigenous</strong> <strong>students</strong> <strong>in</strong> <strong>PISA</strong> 2000 – 2006 41
<strong>The</strong> spread <strong>of</strong> scores for non-<strong>Indigenous</strong> <strong>students</strong> was very similar to the spread <strong>of</strong> scores for<br />
<strong>Indigenous</strong> <strong>students</strong> <strong>in</strong> <strong>PISA</strong> 2000 and <strong>PISA</strong> 2003 (309 and 331 score po<strong>in</strong>ts respectively). In <strong>PISA</strong><br />
2006, however, the distribution <strong>of</strong> scores for <strong>Indigenous</strong> <strong>students</strong> was 32 po<strong>in</strong>ts wider than that <strong>of</strong><br />
non-<strong>Indigenous</strong> <strong>students</strong> (324 score po<strong>in</strong>ts).<br />
Scientific literacy performance: pr<strong>of</strong>iciency levels<br />
In <strong>PISA</strong> 2006, descriptions were developed to characterise the overall student performance at<br />
each <strong>of</strong> six scientific literacy pr<strong>of</strong>iciency levels. <strong>The</strong> development <strong>of</strong> three scientific subscales<br />
(identify<strong>in</strong>g scientific issues, expla<strong>in</strong><strong>in</strong>g phenomena scientifically and us<strong>in</strong>g scientific evidence)<br />
adds further <strong>in</strong>formation about <strong>students</strong>’ competencies <strong>in</strong> science. In scientific literacy, one<br />
pr<strong>of</strong>iciency level equates to 75 score po<strong>in</strong>ts.<br />
Science pr<strong>of</strong>iciency Level 6<br />
Students at this level can consistently identify, expla<strong>in</strong> and apply scientific knowledge and<br />
knowledge about science <strong>in</strong> a variety <strong>of</strong> complex life situations. <strong>The</strong>y can l<strong>in</strong>k different<br />
<strong>in</strong>formation sources and explanations and use evidence from those sources to justify decisions.<br />
<strong>The</strong>y clearly and consistently demonstrate advanced scientific th<strong>in</strong>k<strong>in</strong>g and reason<strong>in</strong>g, and they<br />
are will<strong>in</strong>g to use their scientific understand<strong>in</strong>g <strong>in</strong> support <strong>of</strong> solutions to unfamiliar scientific<br />
and technological situations. Students at this level can use scientific knowledge and develop<br />
arguments <strong>in</strong> support <strong>of</strong> recommendations and decisions that centre on personal, social or<br />
global situations. Students who scored 707.9 score po<strong>in</strong>ts and above were placed <strong>in</strong> the highest<br />
pr<strong>of</strong>iciency level.<br />
In <strong>PISA</strong> 2006 fewer than half a per cent <strong>of</strong> <strong>Indigenous</strong> <strong>students</strong> performed at this highest<br />
pr<strong>of</strong>iciency level. <strong>The</strong>re were three per cent <strong>of</strong> non-<strong>Indigenous</strong> <strong>students</strong>, four per cent <strong>of</strong> F<strong>in</strong>nish<br />
<strong>students</strong> (F<strong>in</strong>land be<strong>in</strong>g the highest perform<strong>in</strong>g country <strong>in</strong> <strong>PISA</strong> 2006) and one per cent <strong>of</strong> <strong>students</strong><br />
across all OECD countries who achieved at this level.<br />
Science pr<strong>of</strong>iciency Level 5<br />
At Level 5, <strong>students</strong> can identify the scientific components <strong>of</strong> many complex life situations, apply<br />
both scientific concepts and knowledge about science to these situations, and can compare, select<br />
and evaluate appropriate scientific evidence for respond<strong>in</strong>g to life situations. Students at this level<br />
can use well-developed <strong>in</strong>quiry abilities, l<strong>in</strong>k knowledge appropriately and br<strong>in</strong>g critical <strong>in</strong>sights<br />
to situations. <strong>The</strong>y can construct explanations based on evidence and arguments based on their<br />
critical analysis. Students whose scores were higher than 633.3 but lower than or equal to 707.9<br />
po<strong>in</strong>ts achieved a read<strong>in</strong>g pr<strong>of</strong>iciency at Level 5.<br />
Only three per cent <strong>of</strong> <strong>Indigenous</strong> <strong>students</strong> were placed at Level 5, compared to 12 per cent<br />
<strong>of</strong> non-<strong>Indigenous</strong> <strong>students</strong> and 17 per cent <strong>of</strong> F<strong>in</strong>nish <strong>students</strong>. On average, eight per cent <strong>of</strong><br />
<strong>students</strong> from OECD countries achieved this level <strong>of</strong> pr<strong>of</strong>iciency.<br />
Science pr<strong>of</strong>iciency Level 4<br />
Students who achieved this level <strong>of</strong> scientific pr<strong>of</strong>iciency can work effectively with situations and<br />
issues that may <strong>in</strong>volve explicit phenomena requir<strong>in</strong>g them to make <strong>in</strong>ferences about the role <strong>of</strong><br />
science or technology. <strong>The</strong>y can select and <strong>in</strong>tegrate explanations from different discipl<strong>in</strong>es <strong>of</strong><br />
science or technology and l<strong>in</strong>k those explanations directly to aspects <strong>of</strong> life situations. Students<br />
at this level can reflect on their actions and they can communicate decisions us<strong>in</strong>g scientific<br />
knowledge and evidence. Students whose scores were higher than 558.7 but lower than or equal<br />
to 633.3 po<strong>in</strong>ts achieved a read<strong>in</strong>g pr<strong>of</strong>iciency at Level 4.<br />
42 Scientific literacy
Twelve per cent <strong>of</strong> <strong>Indigenous</strong> <strong>students</strong> were placed at Level 4. One quarter <strong>of</strong> non-<strong>Indigenous</strong><br />
<strong>students</strong> and also approximately one third <strong>of</strong> <strong>students</strong> from F<strong>in</strong>land achieved at Level 4, while the<br />
OECD average was around one fifth <strong>of</strong> <strong>students</strong> at this level.<br />
Science pr<strong>of</strong>iciency Level 3<br />
Students classified at Level 3 can identify clearly described scientific issues <strong>in</strong> a range <strong>of</strong> contexts.<br />
<strong>The</strong>y can select facts and knowledge to expla<strong>in</strong> phenomena and apply simple models or <strong>in</strong>quiry<br />
strategies. Students at this level can <strong>in</strong>terpret and use scientific concepts from different discipl<strong>in</strong>es<br />
and can apply them directly. <strong>The</strong>y can develop short statements us<strong>in</strong>g facts and make decisions<br />
based on scientific knowledge. Students whose scores were higher than 484.1 but lower than or<br />
equal to 558.7 po<strong>in</strong>ts achieved a read<strong>in</strong>g pr<strong>of</strong>iciency at Level 3.<br />
Approximately 20 per cent <strong>of</strong> <strong>Indigenous</strong> <strong>students</strong> and almost 30 per cent <strong>of</strong> non-<strong>Indigenous</strong><br />
<strong>students</strong>, F<strong>in</strong>nish <strong>students</strong> and student across all OECD countries achieved a science pr<strong>of</strong>iciency <strong>of</strong><br />
Level 3.<br />
Science pr<strong>of</strong>iciency Level 2<br />
At Level 2 <strong>students</strong> have adequate scientific knowledge to provide possible explanations <strong>in</strong><br />
familiar contexts or draw conclusions based on simple <strong>in</strong>vestigations. <strong>The</strong>y are capable <strong>of</strong> direct<br />
reason<strong>in</strong>g and mak<strong>in</strong>g literal <strong>in</strong>terpretations <strong>of</strong> the results <strong>of</strong> scientific <strong>in</strong>quiry or technological<br />
problem solv<strong>in</strong>g. Students whose scores were higher than 409.5 but lower than or equal to 484.1<br />
po<strong>in</strong>ts achieved a read<strong>in</strong>g pr<strong>of</strong>iciency at Level 2.<br />
Approximately 25 per cent <strong>of</strong> <strong>Indigenous</strong> <strong>students</strong> achieved Level 2, compared to 20 per cent <strong>of</strong><br />
non-<strong>Indigenous</strong> <strong>students</strong> and 14 per cent <strong>of</strong> F<strong>in</strong>nish <strong>students</strong>. Almost one quarter <strong>of</strong> all <strong>students</strong><br />
across the OECD were able to achieve a pr<strong>of</strong>iciency <strong>of</strong> Level 2.<br />
Science pr<strong>of</strong>iciency Level 1<br />
Students at Level 1 have such a limited scientific knowledge that it can only be applied to a few,<br />
familiar situations. <strong>The</strong>y can present scientific explanations that are obvious and follow explicitly<br />
from given evidence. Students whose scores were higher than 334.9 but lower than or equal to<br />
409.5 po<strong>in</strong>ts achieved a science pr<strong>of</strong>iciency <strong>of</strong> Level 1.<br />
Twenty-three per cent <strong>of</strong> <strong>Indigenous</strong> <strong>students</strong> were placed at this level, compared to n<strong>in</strong>e per cent<br />
<strong>of</strong> non-<strong>Indigenous</strong> <strong>students</strong> and four per cent <strong>of</strong> <strong>students</strong> from F<strong>in</strong>land. Across the participat<strong>in</strong>g<br />
OECD countries, an average <strong>of</strong> 14 per cent <strong>of</strong> <strong>students</strong> performed at Level 1 on the science literacy<br />
assessments.<br />
Not yet reached science pr<strong>of</strong>iciency Level 1<br />
Science tasks any easier than the Level 1 tasks <strong>in</strong> <strong>PISA</strong> no longer fit <strong>PISA</strong>’s concept <strong>of</strong> scientific<br />
literacy. Students who scored below this level have not demonstrated understand<strong>in</strong>g <strong>of</strong> even the<br />
most basic type <strong>of</strong> <strong>in</strong>formation and the OECD have argued that this po<strong>in</strong>ts to serious deficiencies<br />
<strong>in</strong> these <strong>students</strong>’ ability to meet the challenges <strong>of</strong> the future and adapt to societal change.<br />
Seventeen per cent <strong>of</strong> <strong>Indigenous</strong> <strong>students</strong> were unable to demonstrate Level 1 science skills <strong>in</strong><br />
<strong>PISA</strong>, compared to three per cent <strong>of</strong> non-<strong>Indigenous</strong> <strong>students</strong>, one per cent <strong>of</strong> F<strong>in</strong>nish <strong>students</strong> and<br />
five per cent <strong>of</strong> <strong>students</strong> across all OECD countries.<br />
Figure 4.2 shows the percentage <strong>of</strong> <strong>Indigenous</strong> and non-<strong>Indigenous</strong> <strong>students</strong>, F<strong>in</strong>nish <strong>students</strong> and<br />
<strong>students</strong> from the OECD at each scientific literacy pr<strong>of</strong>iciency level, from below Level 1 to<br />
Level 6.<br />
<strong>The</strong> <strong>achievement</strong> <strong>of</strong> Australia’s <strong>Indigenous</strong> <strong>students</strong> <strong>in</strong> <strong>PISA</strong> 2000 – 2006 43
<strong>Indigenous</strong><br />
17<br />
23<br />
26 19 12 3<br />
Non-<strong>Indigenous</strong><br />
3 9<br />
20 28 25 12 3<br />
OECD average<br />
5<br />
14<br />
24 27 20 8 1<br />
F<strong>in</strong>land<br />
1 4<br />
14 29 32 17 4<br />
-100 -80 -60 -40 -20<br />
0<br />
Percentage <strong>of</strong> <strong>students</strong><br />
Below Level 1 Level 1 Level 2 Level 3 Level 4 Level 5 Level 6<br />
Figure 4.2: Scientific literacy pr<strong>of</strong>iciency levels for <strong>Indigenous</strong> and non-<strong>Indigenous</strong> <strong>students</strong>, the OECD<br />
average and F<strong>in</strong>land for <strong>PISA</strong> 2006<br />
Around 60 per cent <strong>of</strong> <strong>Indigenous</strong> <strong>students</strong> were able to achieve Level 2 or higher, compared to 88<br />
per cent <strong>of</strong> non-<strong>Indigenous</strong> <strong>students</strong> and 81 per cent <strong>of</strong> <strong>students</strong> across all OECD countries.<br />
At the lower end <strong>of</strong> the science pr<strong>of</strong>iciency scale, approximately 40 per cent <strong>of</strong> <strong>Indigenous</strong><br />
<strong>students</strong> were not able to achieve a pr<strong>of</strong>iciency <strong>of</strong> Level 2. Level 2 is the base level at which the<br />
OECD argues that <strong>students</strong> are able to demonstrate scientific competencies that will enable them<br />
to actively participate <strong>in</strong> life situations related to science and technology. <strong>The</strong>se results <strong>in</strong>dicate<br />
that a large proportion <strong>of</strong> <strong>Indigenous</strong> <strong>students</strong> are perform<strong>in</strong>g below this basel<strong>in</strong>e and that these<br />
<strong>students</strong> do not have the sufficient skills to allow them to meet the challenges <strong>of</strong> the 21 st century.<br />
In contrast, 12 per cent <strong>of</strong> non-<strong>Indigenous</strong> Australian <strong>students</strong> and 19 per cent <strong>of</strong> <strong>students</strong> across<br />
all OECD countries were perform<strong>in</strong>g below Level 2, while <strong>in</strong> F<strong>in</strong>land only four per cent <strong>of</strong> <strong>students</strong><br />
had not reached this level.<br />
<strong>Indigenous</strong> <strong>students</strong>’ performance from an <strong>in</strong>ternational<br />
perspective<br />
Figure 4.3 shows the <strong>in</strong>ternational student performance on scientific literacy for <strong>PISA</strong> 2006,<br />
with the mean and distribution <strong>of</strong> scores for <strong>Indigenous</strong> and non-<strong>Indigenous</strong> Australian <strong>students</strong><br />
<strong>in</strong>cluded to illustrate <strong>Indigenous</strong> <strong>students</strong>’ performance <strong>in</strong> a world-wide context.<br />
44 Scientific literacy
F<strong>in</strong>land<br />
Hong Kong-Ch<strong>in</strong>a<br />
Canada<br />
Ch<strong>in</strong>ese Taipei<br />
Estonia<br />
Japan<br />
New Zealand<br />
NON-INDIGENOUS STUDENTS<br />
Australia<br />
Netherlands<br />
Liechtenste<strong>in</strong><br />
Korea<br />
Slovenia<br />
Germany<br />
United K<strong>in</strong>gdom<br />
Czech Republic<br />
Switzerland<br />
Macao-Ch<strong>in</strong>a<br />
Austria<br />
Belgium<br />
Ireland<br />
Hungary<br />
Sweden<br />
OECD average<br />
Poland<br />
Denmark<br />
France<br />
Croatia<br />
Iceland<br />
Latvia<br />
United States<br />
Slovak Republic<br />
Spa<strong>in</strong><br />
Lithuania<br />
Norway<br />
Luxembourg<br />
Russian Federation<br />
Italy<br />
Portugal<br />
Greece<br />
Israel<br />
INDIGENOUS STUDENTS<br />
Chile<br />
Serbia<br />
Bulgaria<br />
Uruguay<br />
Turkey<br />
Jordan<br />
Thailand<br />
Romania<br />
Montenegro<br />
Mexico<br />
Indonesia<br />
Argent<strong>in</strong>a<br />
Brazil<br />
Colombia<br />
Tunisia<br />
Azerbaijan<br />
Qatar<br />
Kyrgyzstan<br />
Significantly higher<br />
than the performance<br />
<strong>of</strong> <strong>Indigenous</strong><br />
<strong>students</strong><br />
Not significantly<br />
different from the<br />
performance <strong>of</strong><br />
<strong>Indigenous</strong><br />
<strong>students</strong><br />
Significantly lower<br />
than the performance<br />
<strong>of</strong> <strong>Indigenous</strong><br />
<strong>students</strong><br />
150 250 350 450 550 650 750<br />
Figure 4.3: International student performance <strong>in</strong> scientific literacy for <strong>PISA</strong> 2006 <strong>in</strong>clud<strong>in</strong>g <strong>Indigenous</strong> and<br />
non-<strong>Indigenous</strong> performance<br />
<strong>The</strong> <strong>achievement</strong> <strong>of</strong> Australia’s <strong>Indigenous</strong> <strong>students</strong> <strong>in</strong> <strong>PISA</strong> 2000 – 2006 45
<strong>The</strong> results show that the score for F<strong>in</strong>land, the highest scor<strong>in</strong>g country, was about one-and-ahalf<br />
pr<strong>of</strong>iciency levels higher than the average performance <strong>of</strong> <strong>Indigenous</strong> <strong>students</strong>. Students <strong>in</strong><br />
the majority <strong>of</strong> countries, from F<strong>in</strong>land through to Greece, performed significantly higher than<br />
<strong>Indigenous</strong> Australian <strong>students</strong>. <strong>Indigenous</strong> <strong>students</strong> scored at a level not significantly different<br />
to <strong>students</strong> <strong>in</strong> four countries: Israel, Chile, Serbia and Bulgaria. <strong>Indigenous</strong> <strong>students</strong> scored<br />
significantly higher than <strong>students</strong> <strong>in</strong> fifteen countries (from Uruguay to Kyrgyzstan).<br />
Scientific literacy performance by gender<br />
In <strong>PISA</strong> 2006, there were twenty countries with significant gender differences <strong>in</strong> scientific literacy.<br />
Females significantly outperformed males <strong>in</strong> Qatar, Jordan, Bulgaria, Thailand, Argent<strong>in</strong>a, Turkey,<br />
Greece, Lithuania, Slovenia, Azerbaijan, Latvia and Kyrgyzstan. Significant gender differences<br />
<strong>in</strong> favour <strong>of</strong> males were found <strong>in</strong> Chile, the United K<strong>in</strong>gdom, Luxembourg, Brazil, Denmark, the<br />
Netherlands, Mexico and Switzerland. <strong>The</strong>re was a small, but statistically significant, difference <strong>in</strong><br />
favour <strong>of</strong> males for the OECD average performance <strong>in</strong> scientific literacy.<br />
Although <strong>Indigenous</strong> females appeared to perform at a higher level <strong>in</strong> scientific literacy compared<br />
to <strong>Indigenous</strong> males <strong>in</strong> <strong>PISA</strong> 2000, <strong>PISA</strong> 2003 and <strong>PISA</strong> 2006, these differences were not<br />
statistically significant (Table 4.2).<br />
<strong>Indigenous</strong> females performed about 50 score po<strong>in</strong>ts lower on average than female <strong>students</strong> from<br />
all OECD countries across the three <strong>PISA</strong> cycles. This difference was equivalent to almost threequarters<br />
<strong>of</strong> a pr<strong>of</strong>iciency level. <strong>The</strong>re were larger differences found between the performance<br />
<strong>of</strong> <strong>Indigenous</strong> males and the OECD average for males. Across the three <strong>PISA</strong> cycles, there was<br />
an average difference <strong>of</strong> about 65 score po<strong>in</strong>ts, or almost one pr<strong>of</strong>iciency level, between the<br />
performance <strong>of</strong> <strong>Indigenous</strong> males and the OECD average for males.<br />
Table 4.2: Means and standard errors for <strong>Indigenous</strong> and non-<strong>Indigenous</strong> <strong>students</strong> by gender on the<br />
overall scientific literacy scale<br />
<strong>PISA</strong> 2000 <strong>PISA</strong> 2003 <strong>PISA</strong> 2006<br />
Student group<br />
Mean SE Mean SE Mean SE<br />
<strong>Indigenous</strong> Females 455 10.7 447 6.4 443 11.7<br />
Males 440 16.1 422 11.6 439 10.1<br />
Non-<strong>Indigenous</strong> Females 532 4.9 527 2.8 529 2.6<br />
Males 527 3.8 527 2.8 530 3.2<br />
OECD average Females 501 0.8 497 0.8 499 0.6<br />
Males 501 0.9 503 0.7 501 0.7<br />
Figure 4.4 shows the mean and distribution <strong>of</strong> scores for <strong>Indigenous</strong> and non-<strong>Indigenous</strong> <strong>students</strong><br />
on the <strong>PISA</strong> 2006 scientific literacy scale by gender. <strong>The</strong> spread <strong>of</strong> scores for <strong>Indigenous</strong> females<br />
was 371 score po<strong>in</strong>ts. This spread <strong>of</strong> scores was wider than that for non-<strong>Indigenous</strong> females,<br />
at 309 score po<strong>in</strong>ts between the 5 th and 95 th percentile. <strong>The</strong> spreads <strong>of</strong> scores between the 5th<br />
and 95th percentile for <strong>Indigenous</strong> and non-<strong>Indigenous</strong> males were 345 and 336 score po<strong>in</strong>ts,<br />
respectively.<br />
<strong>Indigenous</strong><br />
females<br />
Non-<strong>Indigenous</strong><br />
females<br />
<strong>Indigenous</strong><br />
males<br />
Non-<strong>Indigenous</strong><br />
males<br />
150 250 350 450 550 650 750<br />
Figure 4.4: Distribution <strong>of</strong> <strong>Indigenous</strong> and non-<strong>Indigenous</strong> <strong>students</strong> on the scientific literacy scale for<br />
<strong>PISA</strong> 2006<br />
46 Scientific literacy
Figure 4.5 shows the percentage <strong>of</strong> <strong>Indigenous</strong> and non-<strong>Indigenous</strong> female and male <strong>students</strong> at<br />
each pr<strong>of</strong>iciency level for scientific literacy. <strong>The</strong> proportions <strong>of</strong> <strong>Indigenous</strong> females and males<br />
perform<strong>in</strong>g at each pr<strong>of</strong>iciency level were similar; approximately 40 per cent <strong>of</strong> <strong>Indigenous</strong><br />
females and males performed below Level 2. <strong>The</strong>se figures were much higher compared to the<br />
correspond<strong>in</strong>g proportions for non-<strong>Indigenous</strong> females and males, with approximately 10 per cent<br />
achiev<strong>in</strong>g below Level 2.<br />
At the higher end <strong>of</strong> the scientific literacy pr<strong>of</strong>iciency scale, 16 per cent <strong>of</strong> non-<strong>Indigenous</strong> males<br />
and thirteen per cent <strong>of</strong> non-<strong>Indigenous</strong> females achieved at Level 5 or Level 6, compared to three<br />
per cent <strong>of</strong> <strong>Indigenous</strong> males and four per cent <strong>of</strong> <strong>Indigenous</strong> females.<br />
<strong>Indigenous</strong><br />
females<br />
<strong>Indigenous</strong><br />
males<br />
Non-<strong>Indigenous</strong><br />
females<br />
Non-<strong>Indigenous</strong><br />
males<br />
-100 -80 -60 -40 -20 0<br />
17<br />
22<br />
16 24<br />
3<br />
2<br />
9<br />
10<br />
Percentage <strong>of</strong> <strong>students</strong><br />
25 22 10 4<br />
27 17 13 3 1<br />
21 29 25 11 2<br />
19 27 25 13 3<br />
20 40 60 80 100<br />
Below Level 1 Level 1 Level 2 Level 3 Level 4 Level 5 Level 6<br />
Figure 4.5: Scientific literacy pr<strong>of</strong>iciency levels for <strong>Indigenous</strong> and non-<strong>Indigenous</strong> <strong>students</strong> by gender for<br />
<strong>PISA</strong> 2006<br />
Performance on the scientific literacy subscales<br />
In <strong>PISA</strong> 2006 three key competencies were chosen for further exploration because <strong>of</strong> their<br />
importance to the practice <strong>of</strong> science and their connections to key cognitive abilities, such<br />
as <strong>in</strong>ductive and deductive reason<strong>in</strong>g, systems-based th<strong>in</strong>k<strong>in</strong>g, critical decision mak<strong>in</strong>g,<br />
transformation <strong>of</strong> <strong>in</strong>formation (e.g. creat<strong>in</strong>g tables or graphs out <strong>of</strong> raw data), th<strong>in</strong>k<strong>in</strong>g <strong>in</strong> terms <strong>of</strong><br />
models, and use <strong>of</strong> science. <strong>The</strong>se three scientific subscales are labelled as identify<strong>in</strong>g scientific<br />
issues, expla<strong>in</strong><strong>in</strong>g phenomena scientifically, and us<strong>in</strong>g scientific evidence.<br />
<strong>Indigenous</strong> <strong>students</strong>’ performance <strong>in</strong> identify<strong>in</strong>g scientific issues<br />
<strong>The</strong> essential features <strong>of</strong> this competency are recognis<strong>in</strong>g issues that are possible to <strong>in</strong>vestigate<br />
scientifically, identify<strong>in</strong>g keywords to search for scientific <strong>in</strong>formation, and recognis<strong>in</strong>g the key<br />
features <strong>of</strong> a scientific <strong>in</strong>vestigation.<br />
<strong>Indigenous</strong> <strong>students</strong> achieved a mean score <strong>of</strong> 453 score po<strong>in</strong>ts on the identify<strong>in</strong>g scientific<br />
issues scale, which was 85 score po<strong>in</strong>ts (or more than one pr<strong>of</strong>iciency level) lower than that <strong>of</strong><br />
non-<strong>Indigenous</strong> <strong>students</strong>, who achieved a mean score <strong>of</strong> 538 score po<strong>in</strong>ts. <strong>Indigenous</strong> <strong>students</strong><br />
performed more than half <strong>of</strong> a pr<strong>of</strong>iciency level lower than <strong>students</strong> across all OECD countries,<br />
who achieved a mean score <strong>of</strong> 499 po<strong>in</strong>ts.<br />
Figure 4.6 shows the distribution <strong>of</strong> scores for <strong>Indigenous</strong> and non-<strong>Indigenous</strong> <strong>students</strong> by gender<br />
on the identify<strong>in</strong>g scientific issues subscale. While the average score <strong>of</strong> <strong>Indigenous</strong> females<br />
appears higher than that <strong>of</strong> <strong>Indigenous</strong> males on the identify<strong>in</strong>g scientific issues subscale (466<br />
compared to 441), there was no statistically significant difference <strong>in</strong> their performances. In<br />
comparison, a significant difference was found between the average performances <strong>of</strong> non-<br />
<strong>Indigenous</strong> males (528) and females (548) on this subscale.<br />
<strong>The</strong> <strong>achievement</strong> <strong>of</strong> Australia’s <strong>Indigenous</strong> <strong>students</strong> <strong>in</strong> <strong>PISA</strong> 2000 – 2006 47
<strong>Indigenous</strong><br />
females<br />
Non-<strong>Indigenous</strong><br />
females<br />
<strong>Indigenous</strong><br />
males<br />
Non-<strong>Indigenous</strong><br />
males<br />
150 250 350 450 550 650 750<br />
Figure 4.6: Pr<strong>of</strong>iciency levels on the identify<strong>in</strong>g scientific issues subscale for <strong>Indigenous</strong> and non-<br />
<strong>Indigenous</strong> <strong>students</strong> by gender for <strong>PISA</strong> 2006<br />
<strong>The</strong> pr<strong>of</strong>iciency levels for <strong>Indigenous</strong> and non-<strong>Indigenous</strong> <strong>students</strong> on the identify<strong>in</strong>g scientific<br />
issues subscale are shown <strong>in</strong> Figure 4.7 along with results for F<strong>in</strong>land and the OECD average.<br />
Approximately one third <strong>of</strong> <strong>Indigenous</strong> <strong>students</strong> did not achieve Level 2, compared to one tenth<br />
<strong>of</strong> non-<strong>Indigenous</strong> <strong>students</strong>, one twentieth <strong>of</strong> F<strong>in</strong>nish <strong>students</strong> and one fifth <strong>of</strong> <strong>students</strong> across all<br />
OECD countries. At the upper end <strong>of</strong> the identify<strong>in</strong>g scientific issues scale, only four per cent <strong>of</strong><br />
<strong>Indigenous</strong> <strong>students</strong> achieved Level 5 or 6, compared to 16 per cent <strong>of</strong> non-<strong>Indigenous</strong> <strong>students</strong><br />
who performed at these levels.<br />
<strong>Indigenous</strong><br />
13<br />
21<br />
26 23 13 4 1<br />
Non-<strong>Indigenous</strong><br />
2 8<br />
18 29 27 13 3<br />
OECD average<br />
5<br />
14<br />
25 28 20 7 1<br />
F<strong>in</strong>land<br />
1 4<br />
15 31 33 15 3<br />
-100 -80 -60 -40 -20 0 20 40 60 80 100<br />
Percentage <strong>of</strong> <strong>students</strong><br />
Below Level 1 Level 1 Level 2 Level 3 Level 4 Level 5 Level 6<br />
Figure 4.7: Pr<strong>of</strong>iciency levels on the identify<strong>in</strong>g scientific issues subscale for <strong>Indigenous</strong> and non-<br />
<strong>Indigenous</strong> <strong>students</strong>, F<strong>in</strong>nish <strong>students</strong> and the OECD average for <strong>PISA</strong> 2006<br />
<strong>Indigenous</strong> <strong>students</strong>’ performance <strong>in</strong> expla<strong>in</strong><strong>in</strong>g phenomena scientifically<br />
<strong>The</strong> ma<strong>in</strong> areas <strong>in</strong> the ‘expla<strong>in</strong><strong>in</strong>g phenomena scientifically’ competency are apply<strong>in</strong>g knowledge<br />
<strong>of</strong> science <strong>in</strong> a given situation, describ<strong>in</strong>g or <strong>in</strong>terpret<strong>in</strong>g phenomena scientifically and predict<strong>in</strong>g<br />
changes, and identify<strong>in</strong>g appropriate descriptions, explanations and predictions.<br />
<strong>Indigenous</strong> <strong>students</strong> did not perform as well on the expla<strong>in</strong><strong>in</strong>g phenomena scientifically subscale<br />
as on the identify<strong>in</strong>g scientific issues subscale. <strong>Indigenous</strong> <strong>students</strong> achieved a mean score <strong>of</strong><br />
438 score po<strong>in</strong>ts, while non-<strong>Indigenous</strong> <strong>students</strong> scored 97 po<strong>in</strong>ts, or more than one-and-a-third<br />
pr<strong>of</strong>iciency levels, higher. <strong>Indigenous</strong> <strong>students</strong> performed more than half a pr<strong>of</strong>iciency level lower<br />
than <strong>students</strong> across all OECD countries on this subscale.<br />
Figure 4.8 shows the distribution <strong>of</strong> scores for <strong>Indigenous</strong> and non-<strong>Indigenous</strong> <strong>students</strong> by gender<br />
on the expla<strong>in</strong><strong>in</strong>g phenomena scientifically subscale. While the average score <strong>of</strong> <strong>Indigenous</strong><br />
females on this subscale appears higher than that <strong>of</strong> <strong>Indigenous</strong> males (432 score po<strong>in</strong>ts compared<br />
to 443), this difference was not statistically significant. Non-<strong>Indigenous</strong> males performed<br />
significantly better than non-<strong>Indigenous</strong> females on the expla<strong>in</strong><strong>in</strong>g phenomena scientifically<br />
subscale, with mean scores <strong>of</strong> 529 and 516, respectively.<br />
48 Scientific literacy
<strong>Indigenous</strong><br />
females<br />
Non-<strong>Indigenous</strong><br />
females<br />
<strong>Indigenous</strong><br />
males<br />
Non-<strong>Indigenous</strong><br />
males<br />
150 250 350 450 550 650 750<br />
Figure 4.8: Pr<strong>of</strong>iciency levels on the expla<strong>in</strong><strong>in</strong>g phenomena scientifically subscale for <strong>Indigenous</strong> and<br />
non-<strong>Indigenous</strong> <strong>students</strong> by gender for <strong>PISA</strong> 2006<br />
Figure 4.9 shows the pr<strong>of</strong>iciency levels for <strong>Indigenous</strong> and non-<strong>Indigenous</strong> <strong>students</strong> on the<br />
expla<strong>in</strong><strong>in</strong>g phenomena scientifically subscale, along with the OECD average and the results for<br />
F<strong>in</strong>land. Only three per cent <strong>of</strong> <strong>Indigenous</strong> <strong>students</strong> were able to achieve at the upper end <strong>of</strong> the<br />
expla<strong>in</strong><strong>in</strong>g phenomena scientifically subscale, perform<strong>in</strong>g at Level 5 or 6. <strong>The</strong>re were more than<br />
four times as many non-<strong>Indigenous</strong> <strong>students</strong> who performed at the same levels (14%), which was<br />
similar to the OECD average <strong>of</strong> 12 per cent <strong>of</strong> <strong>students</strong>.<br />
At the lower end <strong>of</strong> the scale, 41 per cent <strong>of</strong> <strong>Indigenous</strong> <strong>students</strong> were not able to achieve Level 2,<br />
compared to 13 per cent <strong>of</strong> non-<strong>Indigenous</strong> <strong>students</strong> and 18 per cent <strong>of</strong> <strong>students</strong> across all OECD<br />
countries.<br />
<strong>Indigenous</strong><br />
17<br />
24<br />
26 20 11 3<br />
Non-<strong>Indigenous</strong><br />
3 10<br />
22 28 23 11 3<br />
OECD average<br />
5<br />
13<br />
23 26 21 10 2<br />
F<strong>in</strong>land<br />
1 4<br />
13 26 31 19 7<br />
-100 -80 -60 -40 -20 0 20 40 60 80 100<br />
Percentage <strong>of</strong> <strong>students</strong><br />
Below Level 1 Level 1 Level 2 Level 3 Level 4 Level 5 Level 6<br />
Figure 4.9: Pr<strong>of</strong>iciency levels on the expla<strong>in</strong><strong>in</strong>g phenomena scientifically subscale for <strong>Indigenous</strong> and<br />
non-<strong>Indigenous</strong> <strong>students</strong>, F<strong>in</strong>nish <strong>students</strong> and the OECD average for <strong>PISA</strong> 2006<br />
<strong>Indigenous</strong> <strong>students</strong>’ performance <strong>in</strong> us<strong>in</strong>g scientific evidence<br />
<strong>The</strong> ‘us<strong>in</strong>g scientific evidence’ competency required <strong>students</strong> to synthesise knowledge about<br />
science and knowledge <strong>of</strong> science as they apply both <strong>of</strong> these to a life situation or a contemporary<br />
social problem.<br />
<strong>Indigenous</strong> <strong>students</strong>’ performance on the us<strong>in</strong>g scientific evidence subscale was similar to that on<br />
the expla<strong>in</strong><strong>in</strong>g phenomena scientifically subscale. <strong>Indigenous</strong> <strong>students</strong> achieved a mean score <strong>of</strong><br />
439 score po<strong>in</strong>ts, which was 95 score po<strong>in</strong>ts (or more than one pr<strong>of</strong>iciency level) lower than the<br />
mean score <strong>of</strong> 534 score po<strong>in</strong>ts for non-<strong>Indigenous</strong> <strong>students</strong>.<br />
Figure 4.10 shows the distribution <strong>of</strong> scores on the us<strong>in</strong>g scientific evidence subscale for<br />
<strong>Indigenous</strong> and non-<strong>Indigenous</strong> <strong>students</strong> by gender. <strong>The</strong>re were no significant gender differences<br />
found between the performance <strong>of</strong> <strong>Indigenous</strong> females and males, who both achieved a mean<br />
score <strong>of</strong> 439 score po<strong>in</strong>ts. Non-<strong>Indigenous</strong> females and males also performed similarly on this<br />
subscale, with mean scores <strong>of</strong> 536 and 533 po<strong>in</strong>ts, respectively. <strong>Indigenous</strong> females performed 97<br />
score po<strong>in</strong>ts lower than non-<strong>Indigenous</strong> females and a similar gap was found between <strong>Indigenous</strong><br />
males and non-<strong>Indigenous</strong> males with a difference <strong>of</strong> 94 score po<strong>in</strong>ts.<br />
<strong>The</strong> <strong>achievement</strong> <strong>of</strong> Australia’s <strong>Indigenous</strong> <strong>students</strong> <strong>in</strong> <strong>PISA</strong> 2000 – 2006 49
<strong>Indigenous</strong><br />
females<br />
Non-<strong>Indigenous</strong><br />
females<br />
<strong>Indigenous</strong><br />
males<br />
Non-<strong>Indigenous</strong><br />
males<br />
150 250 350 450 550 650 750<br />
Figure 4.10: Pr<strong>of</strong>iciency levels on the us<strong>in</strong>g scientific evidence subscale for <strong>Indigenous</strong> and non-<br />
<strong>Indigenous</strong> <strong>students</strong> by gender for <strong>PISA</strong> 2006<br />
Figure 4.11 shows the proportion <strong>of</strong> <strong>Indigenous</strong> and non-<strong>Indigenous</strong> <strong>students</strong> at each pr<strong>of</strong>iciency<br />
level on the us<strong>in</strong>g scientific evidence subscale. Close to 40 per cent <strong>of</strong> <strong>Indigenous</strong> <strong>students</strong> did<br />
not achieve Level 2, compared to 12 per cent <strong>of</strong> non-<strong>Indigenous</strong> <strong>students</strong>, five per cent <strong>of</strong> F<strong>in</strong>nish<br />
<strong>students</strong> and 22 per cent <strong>of</strong> <strong>students</strong> across all participat<strong>in</strong>g OECD countries. At the upper end <strong>of</strong><br />
the pr<strong>of</strong>iciency scale, there were five per cent <strong>of</strong> <strong>Indigenous</strong> <strong>students</strong> who achieved Level 5 or 6,<br />
while 18 per cent <strong>of</strong> non-<strong>Indigenous</strong> <strong>students</strong> atta<strong>in</strong>ed these higher levels <strong>of</strong> pr<strong>of</strong>iciency <strong>in</strong> us<strong>in</strong>g<br />
scientific evidence.<br />
<strong>Indigenous</strong><br />
19<br />
20<br />
25 20 11 4 1<br />
Non-<strong>Indigenous</strong><br />
3 9<br />
19 26 25 14 4<br />
OECD average<br />
8<br />
14<br />
22 25 20 9 2<br />
F<strong>in</strong>land<br />
1 4<br />
14 26 30 18 7<br />
-100 -80 -60 -40 -20 0 20 40 60 80 100<br />
Percentage <strong>of</strong> <strong>students</strong><br />
Below Level 1 Level 1 Level 2 Level 3 Level 4 Level 5 Level 6<br />
Figure 4.11: Pr<strong>of</strong>iciency levels on the us<strong>in</strong>g scientific evidence for <strong>Indigenous</strong> and non-<strong>Indigenous</strong><br />
<strong>students</strong>, F<strong>in</strong>nish <strong>students</strong> and the OECD average for <strong>PISA</strong> 2006<br />
Summary<br />
Results on the overall scientific literacy scale show that <strong>Indigenous</strong> <strong>students</strong> performed significantly<br />
lower on average than non-<strong>Indigenous</strong> <strong>students</strong>, and significantly lower than the OECD average<br />
across the three <strong>PISA</strong> cycles.<br />
Very few (3%) <strong>Indigenous</strong> <strong>students</strong> achieved at the highest pr<strong>of</strong>iciency level on the scientific<br />
literacy scale, while 15 per cent <strong>of</strong> non-<strong>Indigenous</strong> <strong>students</strong> performed at this level. At the<br />
lower end <strong>of</strong> the scale, there were a substantial proportion <strong>of</strong> <strong>Indigenous</strong> <strong>students</strong> who did<br />
not achieve a pr<strong>of</strong>iciency <strong>of</strong> Level 2 - four <strong>in</strong> every ten <strong>Indigenous</strong> <strong>students</strong> did not reach this<br />
m<strong>in</strong>imum benchmark <strong>in</strong> scientific literacy. <strong>The</strong>re were no statistically significant differences <strong>in</strong> the<br />
performance <strong>of</strong> <strong>Indigenous</strong> females and <strong>Indigenous</strong> males.<br />
<strong>Indigenous</strong> <strong>students</strong> performed at a similar level on the expla<strong>in</strong><strong>in</strong>g phenomena scientifically and<br />
us<strong>in</strong>g scientific evidence subscale, and performed at a higher level on the identify<strong>in</strong>g scientific<br />
issues subscale. <strong>The</strong>re were no significant gender differences for <strong>Indigenous</strong> <strong>students</strong>’ performance<br />
on any <strong>of</strong> the scientific literacy subscales.<br />
50 Scientific literacy
Chapter<br />
5<br />
Summary<br />
and<br />
conclusions<br />
<strong>PISA</strong> assesses how well 15-year-old <strong>students</strong> approach<strong>in</strong>g the end <strong>of</strong> their compulsory school<strong>in</strong>g<br />
are prepared for meet<strong>in</strong>g the challenges they will face <strong>in</strong> their lives beyond school. <strong>The</strong> threeyearly<br />
assessment provides an opportunity to monitor the performance <strong>of</strong> these <strong>students</strong> <strong>in</strong> read<strong>in</strong>g,<br />
mathematical and scientific literacy.<br />
A special focus for Australia has been to ensure that there is a sufficiently large sample <strong>of</strong><br />
Australia’s <strong>Indigenous</strong> <strong>students</strong> so that valid and reliable analysis can be conducted. <strong>Indigenous</strong><br />
<strong>students</strong> performed at a substantially and statistically lower level <strong>in</strong> read<strong>in</strong>g, mathematical and<br />
scientific literacy compared to their non-<strong>Indigenous</strong> peers. Table 5.1 shows the mean scores for<br />
<strong>Indigenous</strong> and non-<strong>Indigenous</strong> <strong>students</strong> for read<strong>in</strong>g, mathematical and scientific literacy when<br />
they were major doma<strong>in</strong>s <strong>in</strong> the <strong>PISA</strong> assessments <strong>of</strong> 2000, 2003 and 2006 respectively. In read<strong>in</strong>g<br />
literacy, mathematical literacy and scientific literacy <strong>in</strong> <strong>PISA</strong> 2000, 2003 and 2006 respectively,<br />
<strong>Indigenous</strong> <strong>students</strong> performed more than 80 score po<strong>in</strong>ts (or more than one pr<strong>of</strong>iciency level)<br />
lower than non-<strong>Indigenous</strong> <strong>students</strong> and more than 50 score po<strong>in</strong>ts lower than the OECD average.<br />
<strong>The</strong> performance <strong>of</strong> <strong>students</strong> was also described <strong>in</strong> <strong>PISA</strong> us<strong>in</strong>g pr<strong>of</strong>iciency levels, which provide<br />
a pr<strong>of</strong>ile <strong>of</strong> what <strong>students</strong> have achieved <strong>in</strong> terms <strong>of</strong> skills and knowledge. Across the doma<strong>in</strong>s,<br />
<strong>Indigenous</strong> <strong>students</strong> were overrepresented at the lower levels and underrepresented at the upper<br />
levels.<br />
Table 5.1 also shows the percentage <strong>of</strong> <strong>Indigenous</strong> and non-<strong>Indigenous</strong> <strong>students</strong> not achiev<strong>in</strong>g<br />
Level 2 (the two lowest pr<strong>of</strong>iciency levels) and the percentage <strong>of</strong> <strong>students</strong> achiev<strong>in</strong>g the two<br />
highest pr<strong>of</strong>iciency levels (Level 4 and 5 <strong>in</strong> read<strong>in</strong>g literacy and Level 5 and 6 <strong>in</strong> mathematical<br />
and scientific literacy). More than one third <strong>of</strong> <strong>Indigenous</strong> <strong>students</strong> have not been able to achieve<br />
Level 2 <strong>in</strong> read<strong>in</strong>g, mathematical or scientific literacy. Only 12 per cent <strong>of</strong> <strong>Indigenous</strong> <strong>students</strong><br />
were able to achieve Level 4 or 5 <strong>in</strong> read<strong>in</strong>g literacy, and no more than 5 per cent <strong>in</strong> mathematical<br />
and scientific literacy. Similar results were reported when assess<strong>in</strong>g the performance <strong>of</strong> <strong>Indigenous</strong><br />
<strong>students</strong> <strong>in</strong> the subscales <strong>of</strong> each <strong>of</strong> the literacy doma<strong>in</strong>s, with <strong>Indigenous</strong> <strong>students</strong> perform<strong>in</strong>g at<br />
levels significantly below those <strong>of</strong> non-<strong>Indigenous</strong> <strong>students</strong>.<br />
<strong>The</strong> <strong>achievement</strong> <strong>of</strong> Australia’s <strong>Indigenous</strong> <strong>students</strong> <strong>in</strong> <strong>PISA</strong> 2000 – 2006 51
Table 5.1: A summary <strong>of</strong> <strong>Indigenous</strong> and non-<strong>Indigenous</strong> performance from <strong>PISA</strong> 2000, 2003 and 2006<br />
<strong>PISA</strong><br />
<strong>Indigenous</strong><br />
<strong>students</strong><br />
Mean and SE<br />
Non-<br />
<strong>Indigenous</strong><br />
<strong>students</strong> <strong>Indigenous</strong> <strong>students</strong> Non- <strong>Indigenous</strong> <strong>students</strong><br />
Mean and SE<br />
< Pr<strong>of</strong>iciency<br />
Level 2<br />
Pr<strong>of</strong>iciency<br />
Level 4 & 5<br />
(for read<strong>in</strong>g)<br />
Level 5 & 6<br />
(for maths &<br />
science)<br />
< Pr<strong>of</strong>iciency<br />
Level 2<br />
Pr<strong>of</strong>iciency<br />
Level 4 & 5<br />
(for read<strong>in</strong>g)<br />
Level 5 & 6<br />
(for maths &<br />
science)<br />
Read<strong>in</strong>g literacy (2000) 448 (5.8) 531 (3.4) 33 12 12 44<br />
Mathematical literacy (2003) 440 (5.4) 526 (2.1) 43 5 14 20<br />
Scientific literacy (2006) 441 (7.8) 529 (2.3) 39 4 12 15<br />
Significant gender differences were found between <strong>Indigenous</strong> males and females <strong>in</strong> read<strong>in</strong>g<br />
literacy, favour<strong>in</strong>g <strong>Indigenous</strong> females by 34 score po<strong>in</strong>ts. No significant gender differences <strong>in</strong><br />
mathematical and scientific literacy were found for <strong>Indigenous</strong> <strong>students</strong>.<br />
<strong>The</strong> performance <strong>of</strong> <strong>Indigenous</strong> <strong>students</strong> <strong>in</strong> <strong>PISA</strong> cont<strong>in</strong>ues to raise concern about the educational<br />
disadvantage faced by <strong>Indigenous</strong> <strong>students</strong>. From an <strong>in</strong>ternational perspective, they are perform<strong>in</strong>g<br />
well below the OECD average and from a national perspective, they are achiev<strong>in</strong>g well below the<br />
performance <strong>of</strong> non-<strong>Indigenous</strong> <strong>students</strong>.<br />
<strong>The</strong>re have been two <strong>PISA</strong> assessments s<strong>in</strong>ce 2000, and the results have shown that the<br />
performance <strong>of</strong> <strong>Indigenous</strong> <strong>students</strong> has not changed statistically over time. <strong>The</strong>se results suggest<br />
that to date, <strong>in</strong>itiatives to improve the education <strong>of</strong> <strong>Indigenous</strong> <strong>students</strong> through educational<br />
policy have had little effect. In terms <strong>of</strong> real-life function<strong>in</strong>g and future opportunities, <strong>Indigenous</strong><br />
<strong>students</strong> rema<strong>in</strong> at a substantial disadvantage.<br />
Further evidence from <strong>PISA</strong> 2006 has shown that although there was a higher percentage <strong>of</strong><br />
<strong>Indigenous</strong> <strong>students</strong> who were slightly older and <strong>in</strong> higher year levels (i.e. they have more years<br />
<strong>of</strong> school<strong>in</strong>g) than <strong>in</strong> previous <strong>PISA</strong> cycles, overall performance across the three literacy doma<strong>in</strong>s<br />
has not improved. Rais<strong>in</strong>g the performance <strong>of</strong> <strong>Indigenous</strong> <strong>students</strong> and clos<strong>in</strong>g the gap between<br />
<strong>Indigenous</strong> and non-<strong>Indigenous</strong> <strong>students</strong> needs to be addressed us<strong>in</strong>g different approaches than<br />
those that have been used to date.<br />
This report has focused on the <strong>achievement</strong> <strong>of</strong> <strong>Indigenous</strong> <strong>students</strong> and their performance <strong>in</strong> <strong>PISA</strong>.<br />
A follow<strong>in</strong>g report will exam<strong>in</strong>e the impact <strong>of</strong> background factors, <strong>in</strong>clud<strong>in</strong>g socioeconomic status,<br />
and psychological factors such as attitudes and beliefs on the performance <strong>of</strong> <strong>Indigenous</strong> <strong>students</strong>.<br />
52 Summary and conclusions
References<br />
Australian Bureau <strong>of</strong> Statistics (ABS). (2007). Population Distribution, Aborig<strong>in</strong>al and Torres Strait<br />
Islander Australians, 2006 (Cat. No. 4705.0). Canberra: ABS<br />
Commonwealth <strong>of</strong> Australia. (2002). National report on <strong>Indigenous</strong> education and tra<strong>in</strong><strong>in</strong>g 2001.<br />
Canberra: Commonwealth <strong>of</strong> Australia<br />
Hillman, K. & Thomson, S. (2006). Pathways from <strong>PISA</strong>: <strong>The</strong> <strong>PISA</strong> Australian <strong>PISA</strong> sample two<br />
years on. Paper presented at the ECER 2006 Annual Conference: Transform<strong>in</strong>g knowledge.<br />
Geneva, 11-16 September.<br />
Hunter, B., & Schwab, R.G. (2003). Practical reconciliation and recent trends <strong>in</strong> <strong>Indigenous</strong><br />
education. Centre for Aborig<strong>in</strong>al Economic Policy Research Discussion Paper, 249. Canberra:<br />
ANU.<br />
M<strong>in</strong>isterial Council on Education, Employment, Tra<strong>in</strong><strong>in</strong>g and Youth Affairs (MCEETYA), (2006).<br />
National Assessment Program – Civics and Citizenship Years 6 & 10 Report 2004. Carlton:<br />
Curriculum Corporation.<br />
M<strong>in</strong>isterial Council on Education, Employment, Tra<strong>in</strong><strong>in</strong>g and Youth Affairs (MCEETYA), (2007).<br />
National Assessment Program – ICT Literacy Years 6 & 10 Report 2005. Carlton: Curriculum<br />
Corporation.<br />
M<strong>in</strong>isterial Council on Education, Employment, Tra<strong>in</strong><strong>in</strong>g and Youth Affairs (MCEETYA),<br />
(2008). National Declaration on Educational Goals for Young Australians – Draft.<br />
Carlton: Curriculum Corporation. (http://www.curriculum.edu.au/mceetya/melbourne_<br />
declaration,25979.html)<br />
OECD (2000). Measur<strong>in</strong>g student knowledge and skills: <strong>The</strong> <strong>PISA</strong> 2000 assessment <strong>of</strong> read<strong>in</strong>g,<br />
mathematical and scientific literacy. Paris: OECD.<br />
OECD (2006). Assess<strong>in</strong>g scientific, read<strong>in</strong>g and mathematical literacy. Paris: OECD.<br />
<strong>The</strong> <strong>achievement</strong> <strong>of</strong> Australia’s <strong>Indigenous</strong> <strong>students</strong> <strong>in</strong> <strong>PISA</strong> 2000 – 2006 53
<strong>The</strong> <strong>achievement</strong> <strong>of</strong> Australia’s <strong>Indigenous</strong> <strong>students</strong> <strong>in</strong> <strong>PISA</strong> 2000 – 2006<br />
ISBN 978-0-86431-901-2<br />
www.oecd.org • www.ozpisa.acer.edu.au<br />
9 780864 319012