Descriptive modeling - Radiation Epidemiology Course - National ...
Descriptive modeling - Radiation Epidemiology Course - National ...
Descriptive modeling - Radiation Epidemiology Course - National ...
Create successful ePaper yourself
Turn your PDF publications into a flip-book with our unique Google optimized e-Paper software.
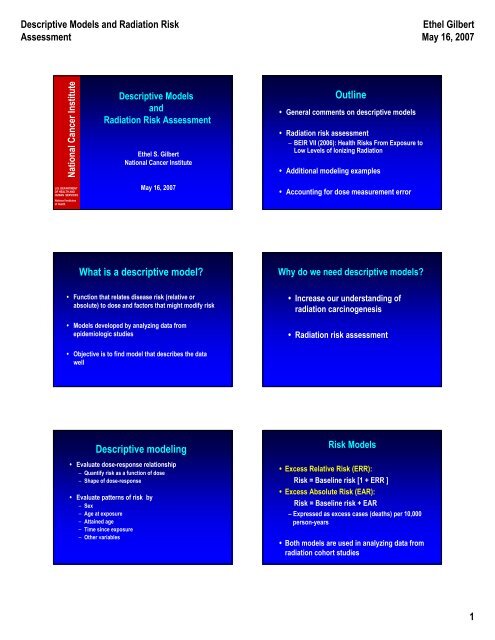
<strong>Descriptive</strong> Models and <strong>Radiation</strong> Risk<br />
Assessment<br />
Ethel Gilbert<br />
May 16, 2007<br />
<strong>National</strong> Cancer Institute<br />
<strong>Descriptive</strong> Models<br />
and<br />
<strong>Radiation</strong> Risk Assessment<br />
Ethel S. Gilbert<br />
<strong>National</strong> Cancer Institute<br />
Outline<br />
• General comments on descriptive models<br />
• <strong>Radiation</strong> risk assessment<br />
– BEIR VII (2006): Health Risks From Exposure to<br />
Low Levels of Ionizing <strong>Radiation</strong><br />
• Additional <strong>modeling</strong> examples<br />
U.S. DEPARTMENT<br />
OF HEALTH AND<br />
HUMAN SERVICES<br />
<strong>National</strong> Institutes<br />
of Health<br />
May 16, 2007<br />
• Accounting for dose measurement error<br />
What is a descriptive model<br />
Why do we need descriptive models<br />
• Function that relates disease risk (relative or<br />
absolute) to dose and factors that might modify risk<br />
• Models developed by analyzing data from<br />
epidemiologic studies<br />
• Increase our understanding of<br />
radiation carcinogenesis<br />
• <strong>Radiation</strong> risk assessment<br />
• Objective is to find model that describes the data<br />
well<br />
<strong>Descriptive</strong> <strong>modeling</strong><br />
• Evaluate dose-response relationship<br />
– Quantify risk as a function of dose<br />
– Shape of dose-response<br />
• Evaluate patterns of risk by<br />
– Sex<br />
– Age at exposure<br />
– Attained age<br />
– Time since exposure<br />
– Other variables<br />
Risk Models<br />
• Excess Relative Risk (ERR):<br />
Risk = Baseline risk [1 + ERR ]<br />
• Excess Absolute Risk (EAR):<br />
Risk = Baseline risk + EAR<br />
– Expressed as excess cases (deaths) per 10,000<br />
person-years<br />
• Both models are used in analyzing data from<br />
radiation cohort studies<br />
1
<strong>Descriptive</strong> Models and <strong>Radiation</strong> Risk<br />
Assessment<br />
Ethel Gilbert<br />
May 16, 2007<br />
Modeling the ERR and EAR<br />
• ERR can be modeled<br />
• Using cohort or case-control data<br />
• Non-parametric <strong>modeling</strong> of the baseline risk<br />
possible<br />
• Unlike ERR model, EAR <strong>modeling</strong> requires<br />
• Cohort data<br />
• Parametric <strong>modeling</strong> of baseline risk<br />
Shape of Dose-Response<br />
• Linear (and linear-quadratic) models used extensively<br />
• Can be justified based on radiobiological<br />
considerations<br />
• Risks at low doses of special interest<br />
• Often difficult to distinguish among various doseresponse<br />
functions<br />
Linear excess relative risk model<br />
• RR = Relative Risk = 1 + $ d<br />
– d is dose (Gy)<br />
– $ is the Excess Relative Risk (ERR) per Gy<br />
• Contrasts with log-linear model: RR = exp($ d)<br />
– “Standard” model for analyzing epidemiologic data<br />
• ERR model can be fit with the Epicure software<br />
– Cohort studies: AMFIT module for Poisson regression<br />
Linear excess relative risk model<br />
• RR = Relative Risk = 1 + $ d f(s, e, a)<br />
s=sex; e = age at exposure; a = attained age<br />
Commonly used model:<br />
• RR = Relative Risk =<br />
1 + $ s d exp[γe + η log(a)]<br />
Excess absolute risk model<br />
Risk = Baseline risk + EAR<br />
• Baseline risk is a function of age, sex, and other<br />
variables<br />
• EAR = $ d f(s, e, a)<br />
$ expressed per 10 4 person-year-Gy<br />
Commonly used model:<br />
EAR = $ s d exp [γe + η log(a)]<br />
• Patterns of risk by sex and attained age are often<br />
markedly different for the ERR and EAR<br />
s=sex; e = age at exposure; a = attained age; d= dose in Gy<br />
Outline<br />
• General comments on descriptive models<br />
• <strong>Radiation</strong> risk assessment<br />
– BEIR VII (2006): Health Risks From Exposure to<br />
Low Levels of Ionizing <strong>Radiation</strong><br />
• Additional <strong>modeling</strong> examples<br />
• Accounting for dose measurement error<br />
2
<strong>Descriptive</strong> Models and <strong>Radiation</strong> Risk<br />
Assessment<br />
Ethel Gilbert<br />
May 16, 2007<br />
<strong>Radiation</strong> Risk Assessment<br />
• <strong>Radiation</strong> literature periodically reviewed and<br />
evaluated by several national and<br />
international committees<br />
• Many of these committees develop and<br />
recommend models for estimating risks<br />
• These models can then be applied to specific<br />
exposure situations<br />
Examples where radiation risk<br />
estimates needed<br />
• Risk from exposure received as a result of<br />
mammography<br />
• Risk from residential exposure to radon<br />
• Risk from I-131 exposure from atmospheric<br />
nuclear tests<br />
• Risk from pediatric CT examinations<br />
<strong>Radiation</strong> Risk Assessments<br />
• <strong>National</strong> Research Council of the <strong>National</strong><br />
Academies of Science (BEIR Reports)<br />
• UNSCEAR (United Nations Scientific Committee on<br />
the Effects of Atomic <strong>Radiation</strong>)<br />
• NCI-CDC Working Group to Revise the 1985 NIH<br />
Radioepidemiological Tables (2003)<br />
• NCRP (<strong>National</strong> Committee on <strong>Radiation</strong> Protection<br />
and Measurements)<br />
• ICRP (International Commission on <strong>Radiation</strong><br />
Protection)<br />
BEIR VII: Health risks from exposure<br />
to low levels of ionizing radiation<br />
• <strong>National</strong> Research Council of the <strong>National</strong><br />
Academies of Science<br />
• BEIR = Biological Effects of Ionizing <strong>Radiation</strong><br />
BEIR V (1990): Low levels of radiation<br />
BEIR VI (1999): Radon<br />
BEIR VII (2006): Low levels of radiation<br />
• BEIR VII Committee:<br />
– 18 scientists<br />
– 11 meetings (6 public)<br />
• Released 6/29/05 (www.nap.edu)<br />
From BEIR VII Statement of Task<br />
“The primary objective is to develop the best<br />
possible risk estimate for exposure to lowdose,<br />
low energy transfer (LET) radiation in<br />
human subjects.”<br />
• BEIR VII committee defined “low dose” as<br />
– < 100 mGy (0.1 Gy) or<br />
– < 0.1 mGy/min over months or a lifetime<br />
BEIR VII Chapters<br />
Public Summary<br />
Executive Summary<br />
1-4: Biology<br />
5-9: <strong>Epidemiology</strong><br />
10: Integration of biology and epidemiology<br />
11: Risk assessment models and methods<br />
12: Estimating cancer risks<br />
13: Summary and Research Needs<br />
3
<strong>Descriptive</strong> Models and <strong>Radiation</strong> Risk<br />
Assessment<br />
Ethel Gilbert<br />
May 16, 2007<br />
Estimating Cancer Risks<br />
• Estimate lifetime risk allowing for<br />
dependencies on<br />
– Dose<br />
– Sex<br />
– Age at exposure<br />
Lifetime risk: Risk of developing (fatal)<br />
cancer over exposed person’s lifespan<br />
BEIR VII Cancer Endpoints<br />
• Cancer mortality<br />
• Cancer incidence<br />
• Separate estimates for<br />
– leukemia<br />
– all solid cancers<br />
– cancers of several specific sites<br />
Cancer sites evaluated by BEIR VII<br />
Estimating Lifetime Risk<br />
• Stomach<br />
• Colon<br />
• Liver<br />
• Lung<br />
• Female breast<br />
• Prostate<br />
• Uterus<br />
• Ovary<br />
• Bladder<br />
• Thyroid<br />
• All other solid cancers<br />
• Leukemia<br />
• Use data from epidemiologic studies to develop<br />
risk models<br />
• Apply models to estimate lifetime risk from lowdose<br />
exposure to the US population<br />
BEIR VII models: What data were used<br />
• Most cancer sites:<br />
– A-bomb survivor cancer incidence and mortality data<br />
– All analyses based on DS02 dosimetry<br />
– Analyses conducted by BEIR VII Committee<br />
• Breast cancer: Pooled analysis of data on A-bomb<br />
survivors and medically exposed persons<br />
– Preston et al. 2002<br />
• Thyroid cancer: Pooled analysis of data on A-bomb<br />
survivors and medically exposed persons<br />
– Ron et al. 1995<br />
Strengths of A-bomb Survivor Study for Use<br />
in Risk Assessment<br />
• Large population size<br />
• All ages and both sexes<br />
• Long term follow-up for both mortality and<br />
cancer incidence<br />
• Whole body exposure<br />
• Well-characterized dose estimates for individual<br />
study subjects<br />
• Useful range of doses<br />
4
<strong>Descriptive</strong> Models and <strong>Radiation</strong> Risk<br />
Assessment<br />
Ethel Gilbert<br />
May 16, 2007<br />
A-bomb survivors:<br />
Useful range of doses<br />
• 30,000 (62%) exposed survivors with doses<br />
0.005 to 0.1 Sv<br />
• 18,000 survivors with higher does (0.1-4 Sv)<br />
– allow reasonably precise risk estimates<br />
• Doses lower than in many studies of persons<br />
exposed for therapeutic medical reasons<br />
Medical studies<br />
• Huge number of studies<br />
• Radiotherapy for malignant disease<br />
(cancers of the cervix, breast, ovary, testis, thyroid,<br />
Hodgkin disease, childhood cancer)<br />
• Radiotherapy for benign disease in children<br />
(skin hemangioma, tinea capitis, enlarged tonsils,<br />
enlarged thymus)<br />
• Radiotherapy for benign disease in adults<br />
(ankylosing spondylitis, peptic ulcer, breast and<br />
gynecological disease, hyperthyroidism)<br />
• Diagnostic radiation<br />
(chest fluoroscopy, I-131, scoliosis)<br />
Medical Studies<br />
• Many studies lack individual dose estimates<br />
• Therapeutic doses often very high (10+ Gy)<br />
• Doses usually vary markedly by organ<br />
• Risk estimates often very imprecise<br />
• Data are strongest for thyroid and breast cancer where<br />
there are many studies with both<br />
– Individual dose estimates<br />
– Doses in a useful range (comparable to A-bomb)<br />
BEIR VII models: What data were used<br />
• Most cancer sites:<br />
– A-bomb survivor cancer incidence and mortality data<br />
– All analyses based on DS02 dosimetry<br />
– Analyses conducted by BEIR VII Committee<br />
• Breast cancer: Pooled analysis of data on A-bomb<br />
survivors and medically exposed persons<br />
– Preston et al. 2002<br />
• Thyroid cancer: Pooled analysis of data on A-bomb<br />
survivors and medically exposed persons<br />
– Ron et al. 1995<br />
BEIR VII Models<br />
Models developed for:<br />
• Excess Relative Risk (ERR):<br />
Risk = Baseline risk [1 + ERR ]<br />
• Excess Absolute Risk (EAR):<br />
Risk = Baseline risk + EAR<br />
• Both ERR and EAR<br />
• Depend on dose<br />
• May depend on sex, age at exposure, attained age,<br />
time since exposure<br />
BEIR VII Models for Solid Cancers<br />
• Based primarily on cancer incidence data 1958-<br />
1998<br />
• Risk expressed as linear function of dose<br />
• Explored many functions for describing the<br />
dependency of the ERR and EAR on<br />
– Age at exposure<br />
– Attained age or time since exposure<br />
5
<strong>Descriptive</strong> Models and <strong>Radiation</strong> Risk<br />
Assessment<br />
Ethel Gilbert<br />
May 16, 2007<br />
BEIR VII Models for Solid Cancers<br />
Selected Models:<br />
• Both ERR and EAR decreased with increasing<br />
age at exposure over the range 0 to 30 years<br />
– No further decrease after age 30<br />
• Both ERR and EAR depended on attained age<br />
– ERR decreased with attained age<br />
– EAR increased with attained age<br />
Excess Relative Risk (1 Sv)<br />
2.4<br />
2.2<br />
2.0<br />
1.8<br />
1.6<br />
1.4<br />
1.2<br />
1.0<br />
0.8<br />
0.6<br />
0.4<br />
Solid Cancer: ERR per Sv<br />
Age at exposure 10<br />
Age at exposure 20<br />
Age at exposure 30+<br />
0.2<br />
30 40 50 60 70 80 90<br />
Attained age<br />
Solid Cancer:<br />
Excess cases per 10,000 PY-Sv<br />
Models for site-specific solid cancers*<br />
Excess cases per 10,000 PY-Sv<br />
70<br />
60<br />
50<br />
40<br />
30<br />
20<br />
10<br />
Age at exposure 10<br />
Age at exposure 20<br />
Age at exposure 30+<br />
• Both ERR and EAR models developed from A-<br />
bomb survivor cancer incidence data<br />
• Patterns with age at exposure and attained age<br />
assumed to the same as those for all solid cancer<br />
– A few exceptions<br />
• All models sex-specific<br />
0<br />
30 40 50 60 70 80 90<br />
Attained age<br />
*Other than breast and thyroid cancer<br />
BEIR VII Models for Leukemia<br />
• Based on A-bomb survivor mortality data 1950-2000<br />
(Preston et al. 2004)<br />
• Risk expressed as linear-quadratic function of dose<br />
• Explored many functions for describing the dependency<br />
of the ERR and EAR on<br />
– Age at exposure<br />
– Attained age or time since exposure<br />
Excess relative risk per Sv<br />
20<br />
15<br />
10<br />
5<br />
Leukemia: ERR per Sv<br />
Age at exposure 10<br />
Age at exposure 20<br />
Age at exposure 30+<br />
• Final models allowed for dependencies on age at<br />
exposure and time since exposure<br />
0<br />
0 10 20 30 40 50 60<br />
Time since exposure<br />
6
<strong>Descriptive</strong> Models and <strong>Radiation</strong> Risk<br />
Assessment<br />
Ethel Gilbert<br />
May 16, 2007<br />
Leukemia: Excess deaths per 10,000 PY-Sv<br />
5<br />
Estimating Lifetime Risk<br />
Excess deaths per 10,000 PY-Sv<br />
4<br />
3<br />
2<br />
1<br />
Age at exposure 10<br />
Age at exposure 20<br />
Age at exposure 30+<br />
• Use data from epidemiologic studies to develop<br />
risk models<br />
• Apply models to estimate lifetime risk from lowdose<br />
exposure to the US population<br />
0<br />
0 10 20 30 40 50 60<br />
Time since exposure<br />
• Life-table methods<br />
Applying Risk Model<br />
– Follow the population forward in time allowing for<br />
attrition as the population ages<br />
– Apply age-specific ERR (EAR) to obtain excess<br />
cancers occurring at each age<br />
• Needed information on population of interest<br />
– Age-sex composition<br />
– Survival (life-table) data<br />
– Age- and sex-specific baseline rates for cancer(s) of<br />
interest (for ERR models)<br />
Applying Risk Model :<br />
Two Issues of Importance<br />
• Use of model to estimate risk at low doses and<br />
dose rates<br />
• “Transporting” risk from Japanese A-bomb<br />
survivors to US population<br />
• Both issues discussed in Chapter 10: Integration<br />
of Biology and <strong>Epidemiology</strong><br />
Use of model to estimate risk at low<br />
doses and dose rates<br />
• Radiobiological data support:<br />
– Linear-quadratic dose-response over the range 0-2 Gy<br />
with upward curvature<br />
– Curvature is ratio of quadratic and linear coefficients<br />
• A-bomb survivor solid cancer incidence data well<br />
described by linear model<br />
– Compatible with small amount of curvature<br />
LSS solid cancer incidence: Excess relative risk<br />
Excess Relative Risk of Solid Cancer<br />
0.0 0.5 1.0 1.5<br />
Low Dose Range<br />
0 1 2 3 4 5 6<br />
Leukemia<br />
(for comparison)<br />
0.0 0.5 1.0 1.5 2.0<br />
Linear fit, 0 - 1.5 Sv<br />
Linear-quadratic fit, 0 - 1.5 Sv<br />
0.0 0.5 1.0 1.5 2.0<br />
BEIR VII,<br />
Fig. ES-1<br />
<strong>Radiation</strong> Dose (Sv)<br />
7
<strong>Descriptive</strong> Models and <strong>Radiation</strong> Risk<br />
Assessment<br />
Ethel Gilbert<br />
May 16, 2007<br />
Use of model to estimate risk at low doses<br />
and dose rates<br />
• If true response is linear-quadratic, linear<br />
estimates need to be reduced<br />
1.2<br />
Dose and Dose Rate Effectiveness Factor<br />
(DDREF)<br />
Excess Relative Risk as a function of dose<br />
• Factor used for this is known as the Dose and<br />
Dose Rate Effectiveness Factor (DDREF)<br />
• Many past risk assessment have used a DDREF<br />
of 2<br />
1<br />
0.8<br />
0.6<br />
0.4<br />
0.2<br />
0<br />
0 1 Gy 2 Gy 3 Gy<br />
True response<br />
Linear approximation<br />
Low-dose response<br />
Dose and Dose Rate Effectiveness<br />
Factor (DDREF)<br />
• Not a universal low-dose correction factor<br />
• Depends on what is meant by high dose<br />
• BEIR VII DDREF estimated in a way that is<br />
specific for use with the A-bomb survivor solid<br />
cancer incidence data<br />
Dose and Dose Rate Effectiveness<br />
Factor (DDREF)<br />
• BEIR VII DDREF derived from Bayesian analyses<br />
of<br />
– A-bomb survivor solid cancer incidence data<br />
– Data from relevant studies in mice<br />
• Estimate with 95% interval: 1.5 (1.1 – 2.3)<br />
• Referred to as “LSS DDREF”<br />
LSS = Life Span Study of A-bomb survivors<br />
Applying Risk Model : Issues<br />
• Use of model to estimate risk at low doses and<br />
dose rates<br />
• “Transporting” risk from Japanese A-bomb<br />
survivors to the US population<br />
Baseline Cancer Incidence Rates in US<br />
and Japan (Females)<br />
US Japan<br />
All 280 185<br />
Stomach 3.5 34<br />
Colon 22 17<br />
Liver 1.3 9.8<br />
Lung 34 12<br />
Breast 89 30<br />
Bladder 5.9 2.6<br />
Source: Cancer Incidence in Five Continents, 1997<br />
8
<strong>Descriptive</strong> Models and <strong>Radiation</strong> Risk<br />
Assessment<br />
Ethel Gilbert<br />
May 16, 2007<br />
Approaches for Transporting Risks from<br />
Japan to US<br />
• Absolute risk transport (AR): Absolute risks the<br />
same for Japan and US (BEIR III)<br />
• Relative risk transport (RR): Excess relative risks<br />
the same for Japan and US (BEIR V)<br />
• Intermediate approaches<br />
(EPA, NIH Radio-epidemiological Tables)<br />
Model for transporting risks:<br />
How do we decide<br />
• Compare epidemiologic data on non-Japanese<br />
populations and A-bomb survivors<br />
• Evaluate interaction of radiation and factors that<br />
contribute to differences in baseline risks<br />
• Biological considerations (initiation/promotion)<br />
BEIR VII approach to transport<br />
Breast and thyroid cancer<br />
• Estimates based on pooled analyses that<br />
included non-Japanese populations<br />
• Breast cancer: EAR model from Preston et<br />
al. 2002<br />
• Thyroid cancer: ERR model from Ron et<br />
al. 1995<br />
BEIR VII approach to transport<br />
Sites other than breast and thyroid:<br />
• Provide estimates based on both relative and<br />
absolute risk transport<br />
– Use ERR and EAR models<br />
– Range reflects uncertainty<br />
• Use weighted mean for point estimates<br />
– All sites except lung: 0.7 for RR; 0.3 for AR<br />
– Lung: 0.3 for RR; 0.7 for AR<br />
– Weighting conducted on logarithmic scale<br />
Example: Lifetime Risk* of<br />
Stomach Cancer Incidence in Males<br />
Estimate based on RR transport: 25<br />
Estimate based on AR transport: 280<br />
Weighted mean: 52<br />
Weighted estimate reduced<br />
by DDREF of 1.5: 34<br />
Lifetime risk estimates<br />
• Estimates for “all solid cancers” obtained by<br />
summing site-specific estimates.<br />
*Number of cases per 100,000 persons exposed to 0.1 Gy<br />
RR = Relative Risk transport; AR = Absolute Risk transport<br />
9
<strong>Descriptive</strong> Models and <strong>Radiation</strong> Risk<br />
Assessment<br />
Ethel Gilbert<br />
May 16, 2007<br />
Lifetime risk for incidence of solid<br />
cancer and leukemia<br />
If 100 people exposed to<br />
0.1 Gy (100 mGy), expect<br />
• 1 cancer from this<br />
exposure<br />
• 42 cancers from other<br />
causes<br />
Sources of Uncertainty Included in<br />
Quantitative Assessment<br />
• Statistical uncertainties in estimating<br />
model parameters<br />
• Use of model to estimate risk at low doses<br />
and dose rates (DDREF)<br />
• Transporting risk from Japanese A-bomb<br />
survivors to US population<br />
Lifetime Risk Estimates. Number of cases or<br />
deaths per 100,000 persons exposed to 0.1 Gy<br />
Incidence Mortality<br />
All solid cancers<br />
Males 800 (400-1600) 410 (200-830)<br />
Females 1300 (690-2500) 610 (300-1200)<br />
Leukemia<br />
Males 100 (30-300) 70 (20-250)<br />
Females 70 (20-250) 50 (10-190)<br />
Estimates with 95% subjective confidence intervals<br />
Lifetime Risk Estimates* for Cancer Incidence<br />
and Mortality in Females<br />
Incidence Mortality<br />
Stomach 43 (5-390) 25 (3-220)<br />
Colon 96 (34-270) 46 (16-130)<br />
Liver 12 (1-130) 11 (1-130)<br />
Lung 300 (120-780) 270 (110-660)<br />
Breast 310 (160-610) 73 (37-150)<br />
Ovary 40 (9-170) 24 (6-98)<br />
Bladder 94 (30-290) 28 (10-81)<br />
Number of cases or deaths per 100,000 persons exposed to 0.1 Gy<br />
BEIR VII Example exposure scenarios<br />
• Single exposure of 0.1 Gy to population of mixed ages<br />
• Single exposure of 0.1 Gy to persons aged 0, 5, 10, 15,<br />
20, 30, 40, 50, 60, 70 and 80<br />
• Exposure of 1 mGy per year throughout life<br />
• Exposure of 10 mGy per year from ages 18 to 65<br />
• Estimates for each scenario shown for<br />
– Cancer incidence and mortality<br />
– Each of 12 specific cancer categories<br />
Lifetime risk estimates for solid cancer incidence by<br />
age at exposure<br />
Males<br />
Females<br />
Age at exposure<br />
10 1330 (660-2660) 2530 (1290-2660)<br />
30 600 (290-1260) 1000 (500-2020)<br />
50 510 (240-1100) 680 (350-1320)<br />
All ages 800 (400-1600) 1300 (690-2500)<br />
Number of cases per 100,000 persons exposed to 0.1 Gy<br />
10
<strong>Descriptive</strong> Models and <strong>Radiation</strong> Risk<br />
Assessment<br />
Ethel Gilbert<br />
May 16, 2007<br />
Comparison of Lifetime Risk Estimates for Solid<br />
Cancer* Mortality. Both sexes.<br />
Estimate DDREF<br />
BEIR VII (2005) 510 1.5<br />
BEIR V (1990) 695 No DDREF<br />
ICRP (1991) 450 2<br />
EPA (1999) 520 2<br />
*Or all cancers except leukemia<br />
Number of cases per 100,000 persons exposed to 0.1 Gy<br />
Comparison of Lifetime Risk Estimates for Solid<br />
Cancer* Mortality. Both sexes.<br />
Estimate DDREF Estimate using<br />
DDREF of 1.5<br />
BEIR VII (2005) 510 1.5 510<br />
BEIR V (1990) 695 No DDREF 460<br />
ICRP (1991) 450 2 600<br />
EPA (1999) 520 2 690<br />
*Or all cancers except leukemia<br />
Number of cases per 100,000 persons exposed to 0.1 Gy<br />
Sources of Uncertainty Included in<br />
Quantitative Assessment<br />
• Statistical uncertainties in estimating<br />
model parameters<br />
• Use of model to estimate risk at low doses<br />
and dose rates (DDREF)<br />
• Transporting risk from Japanese A-bomb<br />
survivors to US population<br />
Uncertainties in Lifetime Cancer Incidence<br />
Estimates for Females<br />
Percent of variance due to<br />
Estimation Transport DDREF 95% factor*<br />
All solid 11 6 83 1.9<br />
Stomach 4 89 7 9.2<br />
Colon 54 14 32 2.8<br />
Liver 21 73 6 10.9<br />
Lung 16 44 39 2.6<br />
Breast 25 0 75 2.0<br />
Ovary 79 5 17 4.2<br />
*Ratio of upper 95% bound to estimate<br />
Features of BEIR VII Risk Estimates (1)<br />
• Equal attention to cancer incidence and mortality<br />
• Based on greatly strengthened epidemiologic<br />
data<br />
– A-bomb survivor incidence and mortality data<br />
• 13,000 incident cases<br />
• 10,000 solid cancer deaths (5600 for BEIR V)<br />
• DS02 dosimetry<br />
– Pooled analyses including several medical studies for<br />
estimating breast and thyroid cancer risks<br />
Features of BEIR VII Risk Estimates (2)<br />
• Expanded list of cancer sites<br />
• DDREF estimated using Bayesian analyses<br />
– A-bomb survivor data<br />
– Experimental data in mice<br />
• Explicit attention to transport of risks<br />
• Quantitative evaluation of major sources of<br />
uncertainty<br />
11
<strong>Descriptive</strong> Models and <strong>Radiation</strong> Risk<br />
Assessment<br />
Ethel Gilbert<br />
May 16, 2007<br />
Outline<br />
• General comments on descriptive models<br />
• <strong>Radiation</strong> risk assessment<br />
– BEIR VII (2006): Health Risks From Exposure to<br />
Low Levels of Ionizing <strong>Radiation</strong><br />
• Additional <strong>modeling</strong> examples<br />
Testicular Cancer Study<br />
• International cohort of 40,576 1-year survivors<br />
– 16 population-based cancer registries<br />
• Focused on second solid cancers in 20,987 10-year<br />
survivors<br />
– 1694 second solid cancers<br />
• Mean age at testicular cancer diagnosis = 35 years<br />
• Accounting for dose measurement error<br />
Travis LB, Fossa SD, Schonfeld SJ, et al. J Natl Cancer Inst 97:1354-1365, 2005.<br />
Testicular Cancer Study<br />
• Treatment for testicular cancer includes<br />
– Surgery<br />
– Radiotherapy<br />
– Chemotherapy<br />
• Data available on initial treatment<br />
– Not available for all registries<br />
– Not detailed<br />
– Possibly incomplete<br />
Travis LB, Fossa SD, Schonfeld SJ, et al. J Natl Cancer Inst 97:1354-1365, 2005.<br />
Simple measures for cohort study<br />
• Compare cancer incidence rates of testicular cancer<br />
patients to those of the general population<br />
• Standardized incidence ratio (SIR)<br />
– A measure of relative risk<br />
– Estimate by O/E<br />
• O = observed number of cases or deaths from disease of interest<br />
• E = expected number of cases or deaths based on general<br />
population rates<br />
• Excess absolute risk (EAR)<br />
– (O – E)/person-years<br />
– Often expressed per 10 4 person-years<br />
Testicular Cancer Study: Objectives<br />
• Quantify the RR and EAR<br />
• Evaluate how the RR and EAR depend on<br />
variables such as<br />
– Age at diagnosis of first cancer<br />
– Attained age<br />
– Time since diagnosis<br />
– Treatment (limited data)<br />
Evaluating dependencies of the RR and<br />
EAR on age and other variables<br />
• Commonly used approach is to calculate<br />
the SIR and EAR for several categories<br />
defined by the variable of interest<br />
– SIR = O/E<br />
– EAR = (O–E)/person-years<br />
12
<strong>Descriptive</strong> Models and <strong>Radiation</strong> Risk<br />
Assessment<br />
Ethel Gilbert<br />
May 16, 2007<br />
Simple measures of RR of 2 nd solid cancer 1<br />
Time since TC # solid SIR (O/E)<br />
diagnosis cancers (95% CI)<br />
10-19 y 802 1.7 (1.6 – 1.8)<br />
20-29 y 563 1.7 (1.6 – 1.9)<br />
30-34 y 169 1.8 (1.5 – 2.1)<br />
35+ y 160 1.9 (1.6 – 2.2)<br />
Modeling RR and EAR<br />
• Express RR and EAR as continuous functions of<br />
– age at diagnosis (agedx)<br />
– attained age (aa)<br />
– other variables<br />
• Example: RR = 1 + θ exp[β 1 (agedx) + β 2 ln (aa)]<br />
EAR = θ exp[β 1 (agedx) + β 2 ln (aa)]<br />
1 Among 10-year survivors of testicular cancer<br />
Advantages of <strong>modeling</strong><br />
• Allow simultaneous evaluation of several<br />
variables (multivariate analyses)<br />
• Use of continuous variables allows<br />
estimation of risks at any specified values<br />
of these variables<br />
Excess cases per 10 4 person-years<br />
200<br />
150<br />
100<br />
50<br />
Excess absolute risk of 2nd solid cancer in 10-year<br />
survivors of testicular cancer (TC)<br />
Age 20 at TC diagnosis<br />
Age 35 at TC diagnosis<br />
Age 50 at TC diagnosis<br />
0<br />
30 40 50 60 70 80 90<br />
Attained age in years<br />
4<br />
3<br />
RR<br />
2<br />
Relative risk of 2 nd solid cancer in 10-year<br />
survivors of testicular cancer (TC)<br />
Age 20 at TC diagnosis<br />
Age 35 at TC diagnosis<br />
Age 50 at TC diagnosis<br />
1<br />
30 40 50 60 70 80 90<br />
Attained age in years<br />
Adjusted and unadjusted RR of 2 nd solid<br />
cancer 1<br />
Time since TC # solid RR* RR**<br />
diagnosis cancers (95% CI) (95% CI)<br />
10-19 y 802 1.7 (1.6 – 1.8) 2.1 (1.9 – 2.3)<br />
20-29 y 563 1.7 (1.6 – 1.9) 2.0 (1.8 – 2.2)<br />
30-34 y 169 1.8 (1.5 – 2.1) 1.8 (1.5 – 2.1)<br />
35+ y 160 1.9 (1.6 – 2.2) 1.7 (1.5 – 2.0)<br />
*Not adjusted for attained age<br />
**Adjusted for attained age<br />
1 Among 10-year survivors of testicular cancer<br />
13
<strong>Descriptive</strong> Models and <strong>Radiation</strong> Risk<br />
Assessment<br />
Ethel Gilbert<br />
May 16, 2007<br />
Cumulative Risk<br />
• Risk of developing event of interest in specified time<br />
interval<br />
– e.g. second solid cancer following testicular cancer<br />
• Depends on length of interval<br />
• Often presented as a function of time<br />
– e.g. time since diagnosis of testicular cancer<br />
• Need to account for competing risks<br />
Cumulative Risk in Testicular Cancer Patients<br />
• Used EAR model for solid cancer risks along with data<br />
on the the general population<br />
Competing risks<br />
• Death from testicular cancer<br />
– Modeled as a function of age at diagnosis, attained age, and<br />
time since diagnosis<br />
• Death from non-cancer causes<br />
– Used general population rate<br />
Cumulative risk (%) of 2nd solid cancer in 1-year<br />
survivors of seminoma<br />
Cumulative risk (%) of 2nd solid cancer in 1-year<br />
survivors of seminoma projected to age 90<br />
%<br />
70<br />
60<br />
50<br />
40<br />
30<br />
20<br />
10<br />
Age 20 at TC diagnosis<br />
Age 35 at TC diagnosis<br />
Age 50 at TC diagnosis<br />
19%<br />
0<br />
20 30 40 50 60 70 80 90<br />
Attained age in years<br />
36%<br />
42%<br />
70<br />
60<br />
50<br />
40<br />
%<br />
30<br />
20<br />
10<br />
Age 20 at TC diagnosis<br />
Age 35 at TC diagnosis<br />
Age 50 at TC diagnosis<br />
0<br />
20 30 40 50 60 70 80 90<br />
Attained age in years<br />
60%<br />
50%<br />
42%<br />
Lung cancer following Hodgkin disease<br />
• Case-control study (Travis et al. 2002; Gilbert et al. 2003)<br />
• Investigate interaction of 3 exposures<br />
Lung cancer following Hodgkin disease:<br />
Some candidate models<br />
I. Multiplicative interaction for all exposures:<br />
(1 + β smk pks)(1 + β rad dose)(1 + β AA cyc)<br />
Exposure<br />
<strong>Radiation</strong><br />
Alkylating<br />
agents (AA)<br />
Smoking<br />
Measure<br />
Dose to site of lung tumor<br />
Number of cycles (cyc)<br />
Pack-years (pks)<br />
II. Additive interaction for all exposures:<br />
(1 + β smk pks + β rad dose + β AA cyc)<br />
III. Multiplicative for smoking and treatment: additive<br />
for radiation and alkylating agents<br />
(1 + β smk pks)(1 + β rad dose + β AA cyc)<br />
14
<strong>Descriptive</strong> Models and <strong>Radiation</strong> Risk<br />
Assessment<br />
Ethel Gilbert<br />
May 16, 2007<br />
Lung cancer following Hodgkin disease<br />
Also evaluated more general models:<br />
Example:<br />
(1 + β smk pks) (1 + β rad dose + β AA cyc + γ dose*cyc)<br />
γ = 0 yields Model III<br />
γ = β rad β AA yields Model I<br />
(1 + 0.15 dose + 0.75 cyc + .001 *dose*cyc)<br />
Nearly identical fit to Model III<br />
Improved fit over Model I (p = .017)<br />
Lung cancer following Hodgkin disease<br />
Compared the fits of several models.<br />
Conclusions:<br />
• Interaction of radiation and alkylating agents almost<br />
exactly additive; could reject multiplicative model<br />
• Interaction of radiation and smoking compatible with<br />
multiplicative relationship; could reject additive model<br />
• Model III described data well<br />
Dose Measurement Error<br />
• The fact that dose can be measured is a major<br />
strength of radiation studies<br />
• Dose estimates subject to errors<br />
• In most studies, dose estimation is retrospective<br />
• Complex systems often needed to estimate dose<br />
Some sources of uncertainty in A-<br />
bomb survivor estimates<br />
Uncertainty in<br />
• Yields of the bombs<br />
• Location of individual survivors<br />
• Shielding of individual survivors<br />
• Models for evaluating dependence of dose on<br />
distance from epicenter<br />
• Models for evaluating the effects of various types<br />
of shielding<br />
Possible Effects of Not Accounting<br />
for Errors in Dose Estimates<br />
• Bias in estimates of risk coefficients<br />
• Distortion of the shape of the doseresponse<br />
function<br />
• Biased comparisons across subgroups<br />
and studies<br />
• Underestimation of uncertainty<br />
Accounting for Errors in Dose Estimates<br />
• Requires good understanding of error structure<br />
• Shared errors require different treatment than<br />
errors that are independent for different<br />
subjects<br />
• Classical errors require different treatment than<br />
Berkson errors<br />
• Requires lots of communication between<br />
dosimetrists and statisticians<br />
15
<strong>Descriptive</strong> Models and <strong>Radiation</strong> Risk<br />
Assessment<br />
Ethel Gilbert<br />
May 16, 2007<br />
Errors in Dose Estimates Used in<br />
Epidemiologic Analyses<br />
• Increasingly, errors are being evaluated and<br />
considered in radiation dose-response analyses<br />
• A-bomb survivors: Recent analyses calibrated to<br />
adjust for random errors<br />
Examples where dose estimation<br />
errors have been taken into account<br />
• A-bomb survivors (Pierce et al. 1996)<br />
• Nuclear workers (Gilbert 1998)<br />
• Residential radon exposure (Reeves et al.<br />
1998)<br />
• Utah fallout study (Thomas et al. 1999)<br />
• Underground miners (Stram et al. 1999)<br />
• Tinea capitis patients (Schafer et al. 2001;<br />
Lubin et al. 2004)<br />
16


