NPP - APRSAF
NPP - APRSAF
NPP - APRSAF

Create successful ePaper yourself
Turn your PDF publications into a flip-book with our unique Google optimized e-Paper software.
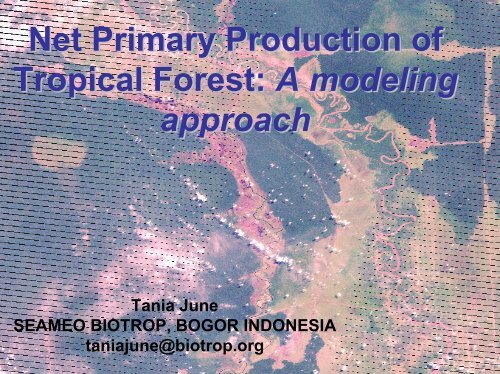
Net Primary Production of<br />
Tropical Forest: A modeling<br />
approach<br />
Tania June<br />
SEAMEO BIOTROP, BOGOR INDONESIA<br />
taniajune@biotrop.org
Increasing atmospheric CO 2 and<br />
Global warming<br />
• Demand for more accurate ecosystems<br />
carbon budgets for projecting how these<br />
ecosystems will be affected by climatic and<br />
atmospheric change<br />
• Better modelling of canopy photosynthesis is<br />
needed An extrapolation of result from point<br />
modeling to become spatial information is<br />
needed<br />
• Challenging research area
CENTRAL KALIMANTAN<br />
Study Site<br />
Palangkaraya<br />
• 3 million ha peatlands<br />
(Mega rice project<br />
started in 1995)<br />
• Drainage of peatsoil<br />
through channel<br />
development of 4000<br />
km long<br />
• Very vulnerable to fire<br />
The area is Abandoned in 1999<br />
Source: Parish (1995)<br />
Source: Landsat ETM+ 118/062<br />
Date: 2004-06-25
CHANNELS DEVELOPMENT<br />
FROM THE MRP<br />
(MEGA RICE PROJECT)<br />
• Illegal logging occurs all over<br />
the area:<br />
1991-1997 = 1.9% per year<br />
1997-2000 = 6.5% per year<br />
1991-2001 = 3.3% per year<br />
• Disturb hydrology of the peat land<br />
• Drought and low water tables<br />
(Boehm et al, 2003)<br />
INCREASING FIRE RISK
PEATLAND FOREST FIRES IN<br />
INDONESIA<br />
• 1982-1983 : 500.000<br />
ha burned<br />
• 1988: 1.5 million ha<br />
burned<br />
• 1997 forest fire: 60% of<br />
haze-SE Asia<br />
• > 500 million t CO 2<br />
emitted
HUGE AMOUNT OF CARBON<br />
(CO2) INTO THE ATMOSPHERE<br />
FOREST FIRE<br />
1997 AND 2002<br />
CONTRIBUTES TO GLOBAL<br />
WARMING<br />
TRANSBOUNDARY POLLUTION<br />
LOSS OF FOREST AS CARBON SINK<br />
LOSS OF BIODIVERSITY<br />
NEED TO ESTIMATE HOW MUCH CARBON IS ABSORB BY<br />
THE REMAINING VEGETATION AND BY VEGETATION<br />
REGROWTH AFTER FIRE
Tower<br />
site<br />
Study Site:<br />
Kalampangan Area<br />
Channels development from the MRP<br />
(Mega Rice Project) = 4,000 km
Continous measurement of<br />
CO2, H2O and microclimate<br />
in Central Kalimantan<br />
Height 50 m<br />
Lat.: 2 o 20’41.6”<br />
Long.: 114 o 02’11.3”
Method to estimate CO 2<br />
sequestration by vegetation<br />
Remote sensing<br />
<strong>NPP</strong><br />
=<br />
365<br />
∑<br />
i=<br />
1<br />
e*<br />
fAPAR*<br />
PAR<br />
Meteorology<br />
station<br />
Semi-mechanistic<br />
modelling<br />
<strong>NPP</strong> = net CO2 assimilation rate per year (g m -2 year -1 )<br />
e = radiation use efficiency (g MJ -1 )<br />
fAPAR = fraction of absorbed PAR<br />
PAR = Photosynthetically active<br />
radiation
Definitions for CO 2 Release/uptake by<br />
Vegetation<br />
• Gross Primary Production (GPP):<br />
Uptake of C by plants<br />
• Net Primary Production (<strong>NPP</strong>):<br />
<strong>NPP</strong>=GPP-R<br />
• Net Ecosystem Production (NEP):<br />
NEP=<strong>NPP</strong>- R H<br />
• Net Biosphere Production (NBP):<br />
NBP=NEP-D<br />
• R: Plant respiration<br />
• R H<br />
: Heterotrophic respiration<br />
• D: Disturbance effects
The Model<br />
c a<br />
Temperature<br />
I. H 2 O g supply<br />
II. N<br />
k<br />
c i<br />
V<br />
J<br />
demand<br />
Light<br />
reduced<br />
carbon<br />
temperature
Outline of the C3 Photosynthesis Model to estimate canopy efficiency, e and <strong>NPP</strong>: Equations (1) and (2) showing<br />
the effect CO2 concentration on leaf assimilation rate; Equations (3) showing the light effect; Equations (4)<br />
showing the temperature effects on model parameters.; Equation (5) showing supply of CO2 and Equations (6)<br />
and (7) showing e and <strong>NPP</strong>.
Light use efficiency (e)<br />
• Light use efficiency, or canopy efficiency, in this simulation<br />
is defined as mol CO 2<br />
assimilated per mol of absorbed light,<br />
i.e A c<br />
divided by I c<br />
.<br />
e =<br />
A<br />
I<br />
c<br />
c<br />
<strong>NPP</strong><br />
=<br />
365<br />
∑<br />
e*<br />
fAPAR<br />
*<br />
PAR<br />
i=<br />
1
Software used and Data Input for NetPro v. 1.0<br />
Sofware used are:<br />
• Visual Basic 6.0<br />
• ERMapper 6.4<br />
• ArcView 3.3<br />
• MapObject 2.1.<br />
Data input includes:<br />
• Shapefile of NDVI class<br />
• Daily averaged climate<br />
data (Global radiation,<br />
maximum and minimum<br />
temperature).
NDVI ANALYSIS<br />
(NIR – R)<br />
(NIR + R)<br />
LANDSAT<br />
ORIGINAL IMAGE<br />
LANDSAT<br />
NDVI IMAGE
Calculation of <strong>NPP</strong>
LAI - NDVI<br />
LandSat TM<br />
LAI = NDVI*1.71+ 0.4(Asrar et al,<br />
1985 for grass-land)<br />
LAI= (NDVI / 0.31)0.2 (Spancer et al,<br />
1990 for conifer/needle-leaf)<br />
LAI= (NDVI / 0.26)2 (Priece et al, 1993<br />
for broad leaf)<br />
NOAA AVHRR
f APAR -NDVI<br />
Ochi and Shibasaki (1999) for some<br />
type of asian vegetation ;<br />
fAPAR = - 0.08 +1.075 NDVI<br />
(r2 = 0.75) using NOAA/AVHRR<br />
Knorr, et al. (1999)
LAI,f APAR, and <strong>NPP</strong>
Study site
Flux Measurement<br />
LoreLindu National<br />
Park, Central<br />
Sulawesi<br />
Height 70 m<br />
Lat. 1 o 39′-1 o 42′ S<br />
Long. 120 o 10′-120 o 12′ E
Model Output<br />
3000<br />
<strong>NPP</strong> (gC m -2 year -1 )<br />
2900<br />
2800<br />
2700<br />
2600<br />
2500<br />
2400<br />
2300<br />
CO 2<br />
700,<br />
0 o C temp. increase<br />
CO 2<br />
700,<br />
6 o C temp. increase<br />
2200<br />
CO 2<br />
350,<br />
0 o C temp. increase<br />
2100<br />
110 115 120 125 130 135 140 145 150 155<br />
Leaf Nitrogen (mmol m -2 )
Model Output<br />
2900<br />
2800<br />
2700<br />
LowN<br />
CO 2<br />
700<br />
3000<br />
2900<br />
2800<br />
High N<br />
CO 2<br />
350<br />
<strong>NPP</strong> (gCm -2 year -1 )<br />
2600<br />
2500<br />
2400<br />
2300<br />
2200<br />
2100<br />
2000<br />
1900<br />
1800<br />
LowN<br />
CO 2<br />
350<br />
0 1 2 3 4 5 6<br />
<strong>NPP</strong> (gCm -2 year -1 )<br />
2700<br />
2600<br />
2500<br />
2400<br />
2300<br />
2200<br />
2100<br />
2000<br />
1900<br />
High N<br />
CO 2<br />
700<br />
0 1 2 3 4 5 6<br />
Increase in Temperature ( o C)<br />
Increase in Temperature ( o C)
RESEARCH NEEDED<br />
• Site specific parameterisation<br />
–Vcmax<br />
• Site variable measurement and estimation<br />
– Leaf Nitrogen, LAI, f APAR<br />
• Climate data: diurnal global radiation, min<br />
and max temperature, diffuse radiation.<br />
•CO 2 flux data and e from tower for<br />
validation of model<br />
• Develop specific site equations for<br />
NDVI-LAI and NDVI-f APAR