

PDF: 9795 KB - Bureau of Infrastructure, Transport and Regional ...
PDF: 9795 KB - Bureau of Infrastructure, Transport and Regional ...
PDF: 9795 KB - Bureau of Infrastructure, Transport and Regional ...

Create successful ePaper yourself
Turn your PDF publications into a flip-book with our unique Google optimized e-Paper software.
BITRE | Working paper 73<br />
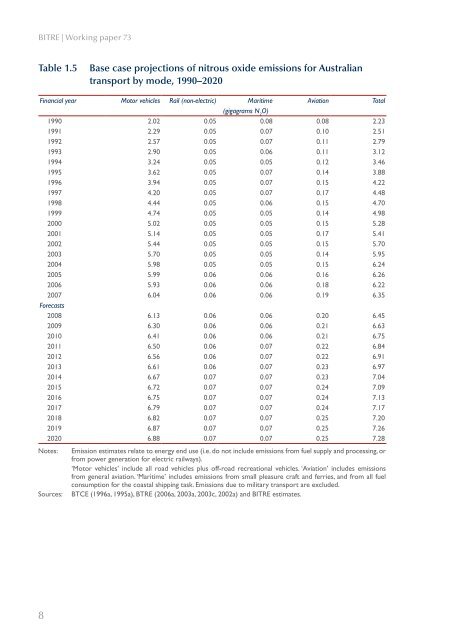
Table 1.5<br />
Base case projections <strong>of</strong> nitrous oxide emissions for Australian<br />
transport by mode, 1990–2020<br />
Financial year Motor vehicles Rail (non-electric) Maritime Aviation Total<br />
(gigagrams N 2<br />
O)<br />
1990 2.02 0.05 0.08 0.08 2.23<br />
1991 2.29 0.05 0.07 0.10 2.51<br />
1992 2.57 0.05 0.07 0.11 2.79<br />
1993 2.90 0.05 0.06 0.11 3.12<br />
1994 3.24 0.05 0.05 0.12 3.46<br />
1995 3.62 0.05 0.07 0.14 3.88<br />
1996 3.94 0.05 0.07 0.15 4.22<br />
1997 4.20 0.05 0.07 0.17 4.48<br />
1998 4.44 0.05 0.06 0.15 4.70<br />
1999 4.74 0.05 0.05 0.14 4.98<br />
2000 5.02 0.05 0.05 0.15 5.28<br />
2001 5.14 0.05 0.05 0.17 5.41<br />
2002 5.44 0.05 0.05 0.15 5.70<br />
2003 5.70 0.05 0.05 0.14 5.95<br />
2004 5.98 0.05 0.05 0.15 6.24<br />
2005 5.99 0.06 0.06 0.16 6.26<br />
2006 5.93 0.06 0.06 0.18 6.22<br />
2007 6.04 0.06 0.06 0.19 6.35<br />
Forecasts<br />
2008 6.13 0.06 0.06 0.20 6.45<br />
2009 6.30 0.06 0.06 0.21 6.63<br />
2010 6.41 0.06 0.06 0.21 6.75<br />
2011 6.50 0.06 0.07 0.22 6.84<br />
2012 6.56 0.06 0.07 0.22 6.91<br />
2013 6.61 0.06 0.07 0.23 6.97<br />
2014 6.67 0.07 0.07 0.23 7.04<br />
2015 6.72 0.07 0.07 0.24 7.09<br />
2016 6.75 0.07 0.07 0.24 7.13<br />
2017 6.79 0.07 0.07 0.24 7.17<br />
2018 6.82 0.07 0.07 0.25 7.20<br />
2019 6.87 0.07 0.07 0.25 7.26<br />
2020 6.88 0.07 0.07 0.25 7.28<br />
Notes: Emission estimates relate to energy end use (i.e. do not include emissions from fuel supply <strong>and</strong> processing, or<br />
from power generation for electric railways).<br />
‘Motor vehicles’ include all road vehicles plus <strong>of</strong>f-road recreational vehicles. ‘Aviation’ includes emissions<br />
from general aviation. ‘Maritime’ includes emissions from small pleasure craft <strong>and</strong> ferries, <strong>and</strong> from all fuel<br />
consumption for the coastal shipping task. Emissions due to military transport are excluded.<br />
Sources: BTCE (1996a, 1995a), BTRE (2006a, 2003a, 2003c, 2002a) <strong>and</strong> BITRE estimates.<br />
8


