

PDF: 9795 KB - Bureau of Infrastructure, Transport and Regional ...
PDF: 9795 KB - Bureau of Infrastructure, Transport and Regional ...
PDF: 9795 KB - Bureau of Infrastructure, Transport and Regional ...

Create successful ePaper yourself
Turn your PDF publications into a flip-book with our unique Google optimized e-Paper software.
BITRE | Working paper 73<br />
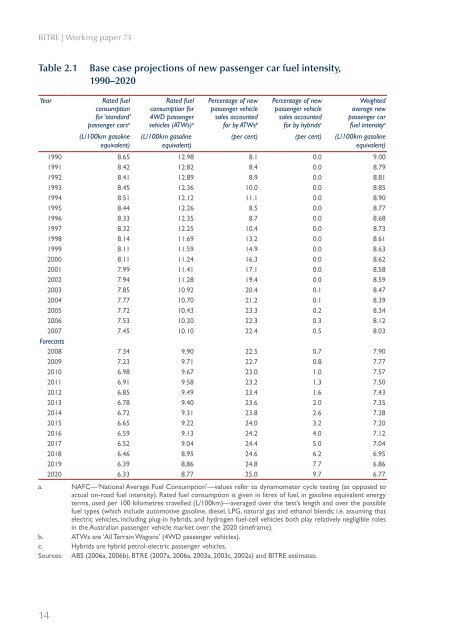
Table 2.1<br />
Base case projections <strong>of</strong> new passenger car fuel intensity,<br />
1990–2020<br />
Year<br />
Rated fuel<br />
consumption<br />
for ‘st<strong>and</strong>ard’<br />
passenger cars a<br />
(L/100km gasoline<br />
equivalent)<br />
Rated fuel<br />
consumption for<br />
4WD passenger<br />
vehicles (ATWs) a<br />
(L/100km gasoline<br />
equivalent)<br />
Percentage <strong>of</strong> new<br />
passenger vehicle<br />
sales accounted<br />
for by ATWs b<br />
Percentage <strong>of</strong> new<br />
passenger vehicle<br />
sales accounted<br />
for by hybrids c<br />
Weighted<br />
average new<br />
passenger car<br />
fuel intensity a<br />
(per cent) (per cent) (L/100km gasoline<br />
equivalent)<br />
1990 8.65 12.98 8.1 0.0 9.00<br />
1991 8.42 12.82 8.4 0.0 8.79<br />
1992 8.41 12.89 8.9 0.0 8.81<br />
1993 8.45 12.36 10.0 0.0 8.85<br />
1994 8.51 12.12 11.1 0.0 8.90<br />
1995 8.44 12.26 8.5 0.0 8.77<br />
1996 8.33 12.35 8.7 0.0 8.68<br />
1997 8.32 12.25 10.4 0.0 8.73<br />
1998 8.14 11.69 13.2 0.0 8.61<br />
1999 8.11 11.59 14.9 0.0 8.63<br />
2000 8.11 11.24 16.3 0.0 8.62<br />
2001 7.99 11.41 17.1 0.0 8.58<br />
2002 7.94 11.28 19.4 0.0 8.59<br />
2003 7.85 10.92 20.4 0.1 8.47<br />
2004 7.77 10.70 21.2 0.1 8.39<br />
2005 7.72 10.43 23.3 0.2 8.34<br />
2006 7.53 10.20 22.3 0.3 8.12<br />
2007 7.45 10.10 22.4 0.5 8.03<br />
Forecasts<br />
2008 7.34 9.90 22.5 0.7 7.90<br />
2009 7.23 9.71 22.7 0.8 7.77<br />
2010 6.98 9.67 23.0 1.0 7.57<br />
2011 6.91 9.58 23.2 1.3 7.50<br />
2012 6.85 9.49 23.4 1.6 7.43<br />
2013 6.78 9.40 23.6 2.0 7.35<br />
2014 6.72 9.31 23.8 2.6 7.28<br />
2015 6.65 9.22 24.0 3.2 7.20<br />
2016 6.59 9.13 24.2 4.0 7.12<br />
2017 6.52 9.04 24.4 5.0 7.04<br />
2018 6.46 8.95 24.6 6.2 6.95<br />
2019 6.39 8.86 24.8 7.7 6.86<br />
2020 6.33 8.77 25.0 9.7 6.77<br />
a. NAFC—‘National Average Fuel Consumption’—values refer to dynamometer cycle testing (as opposed to<br />
actual on-road fuel intensity). Rated fuel consumption is given in litres <strong>of</strong> fuel, in gasoline equivalent energy<br />
terms, used per 100 kilometres travelled (L/100km)—averaged over the test’s length <strong>and</strong> over the possible<br />
fuel types (which include automotive gasoline, diesel, LPG, natural gas <strong>and</strong> ethanol blends; i.e. assuming that<br />
electric vehicles, including plug-in hybrids, <strong>and</strong> hydrogen fuel-cell vehicles both play relatively negligible roles<br />
in the Australian passenger vehicle market over the 2020 timeframe).<br />
b. ATWs are ‘All Terrain Wagons’ (4WD passenger vehicles).<br />
c. Hybrids are hybrid petrol-electric passenger vehicles.<br />
Sources: ABS (2006a, 2006b), BTRE (2007a, 2006a, 2003a, 2003c, 2002a) <strong>and</strong> BITRE estimates.<br />
14


