Environmental indicators in industry - University of Sussex
Environmental indicators in industry - University of Sussex
Environmental indicators in industry - University of Sussex

Create successful ePaper yourself
Turn your PDF publications into a flip-book with our unique Google optimized e-Paper software.
Abstract<br />
<strong>Environmental</strong> <strong><strong>in</strong>dicators</strong> <strong>in</strong> <strong>in</strong>dustry –<br />
the MEPI experience 1<br />
Frans BERKHOUT, Julia HERTIN 2 , Jérôme CARLENS † , Daniel TYTECA 3 ,<br />
Xander OLSTHOORN 4 , Marcus WAGNER 5 and Walter WEHRMEYER 6<br />
The paper reports on the experience ga<strong>in</strong>ed <strong>in</strong> the scope <strong>of</strong> a European<br />
Community funded research project, called MEPI - Measur<strong>in</strong>g <strong>Environmental</strong><br />
Performance <strong>of</strong> Industry. The project was based on data collected with<strong>in</strong> six <strong>in</strong>dustrial<br />
sectors (electricity, pulp and paper, pr<strong>in</strong>t<strong>in</strong>g, fertilizers, textile, computer manufactur<strong>in</strong>g)<br />
accross six European countries (Austria, Belgium, Germany, Italy, Netherlands, UK).<br />
The methodology is based on physical variables, describ<strong>in</strong>g the efficiency <strong>of</strong> processes<br />
with respect to resource use and pollution, as well as management variables, reflect<strong>in</strong>g<br />
the efforts accomplished by a company towards <strong>in</strong>tegration <strong>of</strong> environmental issues <strong>in</strong> its<br />
activities and strategies. Results show, among other, that performance varies widely for<br />
most sectors and <strong><strong>in</strong>dicators</strong> analysed. Among the factors that affect environmental<br />
performance, technology exerts the most significant effect. Other variables, such as<br />
1 The MEPI project (Measur<strong>in</strong>g <strong>Environmental</strong> Performance <strong>of</strong> Industry) was conducted by a network <strong>of</strong><br />
research teams <strong>in</strong> six European countries, coord<strong>in</strong>ated by SPRU (Univ. Of <strong>Sussex</strong>, UK), and funded<br />
under the Fourth Framework Porgramme (Environment and Climate) <strong>of</strong> DGXII <strong>of</strong> the European<br />
Commission. Besides the authors <strong>in</strong>dicated, other contributors were Frans VAN DER WOERD and<br />
Michiel VAN DRUNEN (Institute for <strong>Environmental</strong> Studies, Vrije Univesiteit Amsterdam,<br />
Netherlands), Giovanni AZZONE and Giuliano NOCI (Department <strong>of</strong> Economics and Production,<br />
Politecnico di Milano, Italy), Christ<strong>in</strong>e JASCH (Institut für Ökologische Wirtschaftsforschung - IÖW -<br />
Austria), Tom GAMESON and Oliver WOLF (Institute for Prospective Technological Studies - IPTS,<br />
Sevilla, Spa<strong>in</strong>).<br />
2 SPRU (<strong>University</strong> <strong>of</strong> <strong>Sussex</strong>, UK).<br />
† Jérôme CARLENS worked on the project at the Université catholique de Louva<strong>in</strong>. He died <strong>in</strong> tragical<br />
circumstances <strong>in</strong> April 2001. Work<strong>in</strong>g with him was both scientifically stimulat<strong>in</strong>g and enjoyable. The<br />
other authors and contributors wish to dedicate this paper to his memory.<br />
3 Université catholique de Louva<strong>in</strong> (Belgium). Correspond<strong>in</strong>g author (Centre Entreprise -<br />
Environnement, Institut d'Adm<strong>in</strong>istration et de Gestion, Place des Doyens, 1, B-1348 Louva<strong>in</strong>-la-Neuve,<br />
Belgium. E-mail tyteca@qant.ucl.ac.be).<br />
4 Vrije Universiteit Amsterdam (Netherlands).<br />
5 formerly <strong>University</strong> <strong>of</strong> Surrey (UK), now with <strong>University</strong> <strong>of</strong> Lueneburg (Germany).
<strong>Environmental</strong> <strong><strong>in</strong>dicators</strong> <strong>in</strong> <strong>in</strong>dustry - the MEPI experience 2<br />
company size, national context, time, pr<strong>of</strong>itability and environmental management<br />
systems were found to have no <strong>in</strong>fluence or only little, sometimes not <strong>in</strong> the expected<br />
sense. The paper concludes with some relevant issues for policy, among which the need<br />
to organise more systematically and standardise the process <strong>of</strong> environmental data<br />
collection and report<strong>in</strong>g, both at the corporate level and the level <strong>of</strong> public decision<br />
makers.<br />
1. The approach <strong>of</strong> the MEPI project<br />
Among the human activities impos<strong>in</strong>g a heavy burden on our environment,<br />
<strong>in</strong>dustrial activities are <strong>in</strong> the foreground. While <strong>in</strong> the previous two or three decades the<br />
behaviour <strong>of</strong> <strong>in</strong>dustries <strong>in</strong> that respect was ma<strong>in</strong>ly dictated by government, some<br />
companies have begun to recognise the potential competitiveness and other benefits <strong>of</strong><br />
adopt<strong>in</strong>g more conscious and proactive behaviour toward the environment. In parallel to<br />
this, there is an <strong>in</strong>creas<strong>in</strong>g need for tools that allow for proper and objective<br />
measurement and benchmark<strong>in</strong>g <strong>of</strong> the performance <strong>of</strong> firms with respect to the<br />
environment. "Demands on companies to measure, document and disclose <strong>in</strong>formation<br />
about environmental performance will become more <strong>in</strong>vasive - i. e., as the result <strong>of</strong><br />
pressures from employees, neighbors, the general public, environmental groups and<br />
regulatory agencies. In the same way that public companies are measured by their<br />
f<strong>in</strong>ancial results, environmental performance will <strong>in</strong>creas<strong>in</strong>gly become a critical factor to<br />
scrut<strong>in</strong>ize" (GREENO & ROBINSON, 1992).<br />
<strong>Environmental</strong> performance <strong><strong>in</strong>dicators</strong> are used by stakeholders <strong>in</strong> different ways:<br />
* Bus<strong>in</strong>ess managers use environmental performance <strong><strong>in</strong>dicators</strong> as an <strong>in</strong>ternal<br />
management tool and for external communication.<br />
* Banks and <strong>in</strong>surers exam<strong>in</strong>e the environmental performance <strong>of</strong> firms to help assess<br />
longer-term economic risks.<br />
6 <strong>University</strong> <strong>of</strong> Surrey (UK).
<strong>Environmental</strong> <strong><strong>in</strong>dicators</strong> <strong>in</strong> <strong>in</strong>dustry - the MEPI experience 3<br />
* Fund managers use environmental criteria to respond to the demand for<br />
environmental and ethical concerns to be taken <strong>in</strong>to account <strong>in</strong> <strong>in</strong>vestment<br />
decisions.<br />
* Policy makers may evaluate the effectiveness <strong>of</strong> different policy <strong>in</strong>struments <strong>in</strong><br />
improv<strong>in</strong>g firms' overall environmental performance.<br />
* <strong>Environmental</strong> groups compare the environmental pr<strong>of</strong>ile <strong>of</strong> firms <strong>in</strong> order to put<br />
political pressure on poor performers.<br />
* Neighbours observe to what extent companies damage their local environment.<br />
* Researchers analyse patterns and trends to improve understand<strong>in</strong>g <strong>of</strong> the causes <strong>of</strong><br />
good and poor environmental performance.<br />
In all cases, <strong><strong>in</strong>dicators</strong> can provide only partial <strong>in</strong>formation that may need to be<br />
qualified with <strong>in</strong>formation from other sources. Indicators are deliberately simple<br />
measures that stand as proxies for complex and <strong>of</strong>ten diffuse phenomena. Indicators<br />
<strong>in</strong>dicate. Awareness <strong>of</strong> their specific limitations and biases is an important aspect <strong>of</strong> their<br />
<strong>in</strong>terpretation.<br />
In this paper we briefly report on the experience ga<strong>in</strong>ed <strong>in</strong> these matters <strong>in</strong> the<br />
scope <strong>of</strong> a European Community funded research project, called MEPI - Measur<strong>in</strong>g<br />
<strong>Environmental</strong> Performance <strong>of</strong> Industry. More details can be found on a Web site<br />
entitled http://www.environmental-performance.org.<br />
How can we measure environmental performance?<br />
challenges:<br />
Measur<strong>in</strong>g the environmental performance <strong>of</strong> a company presents many<br />
* <strong>Environmental</strong> issues are complex and <strong>of</strong>ten difficult to quantify.<br />
* Compar<strong>in</strong>g the environmental impacts <strong>of</strong> firms with different economic activities is<br />
problematic.
<strong>Environmental</strong> <strong><strong>in</strong>dicators</strong> <strong>in</strong> <strong>in</strong>dustry - the MEPI experience 4<br />
* There is no universally accepted approach to weigh<strong>in</strong>g different environmental<br />
impacts aga<strong>in</strong>st each other, and any overall assessment will produce highly<br />
contested results.<br />
* There is no standard approach to environmental report<strong>in</strong>g and measurement,<br />
although a range <strong>of</strong> guidel<strong>in</strong>es has now been developed.<br />
* The availability and quality <strong>of</strong> environmental data is <strong>of</strong>ten poor.<br />
It is <strong>of</strong>ten argued that environmental performance cannot be compared because<br />
companies are different. However, the same could be said <strong>of</strong> company f<strong>in</strong>ances, yet the<br />
report<strong>in</strong>g <strong>of</strong> f<strong>in</strong>ancial performance is rout<strong>in</strong>e. Dist<strong>in</strong>ctiveness should not stand <strong>in</strong> the way<br />
<strong>of</strong> comparison between competitors, be it <strong>in</strong> terms <strong>of</strong> pr<strong>of</strong>itability, market value or<br />
environmental performance.<br />
Faced with these challenges, some <strong>in</strong>itiatives have decided to assess the<br />
'greenness' <strong>of</strong> a company on the basis <strong>of</strong> qualitative criteria, such as whether they have<br />
adopted certified environmental management systems and environmental targets. These<br />
'effort <strong><strong>in</strong>dicators</strong>' assume that management effort translates <strong>in</strong> a predictable way <strong>in</strong>to<br />
environmental outcomes. There is little evidence as yet to support this assumption. In<br />
fact, the MEPI project has found that <strong>in</strong> some cases the reverse may be true.<br />
Other 'guidel<strong>in</strong>e-driven' <strong>in</strong>itiatives, such as the Global Report<strong>in</strong>g Initiative<br />
(WHITE 1999; MULLINS 2000) or the eco-efficiency <strong>in</strong>itiative led by the World Bus<strong>in</strong>ess<br />
Council for Susta<strong>in</strong>able Development (VERFAILLIE & BIDWELL 2000), have concluded<br />
that quantitative assessment requires detailed environmental and technical data. Although<br />
this is a useful approach which may produce results over the longer term, it also has its<br />
drawbacks. Many firms are not will<strong>in</strong>g or able to gather and disclose all the <strong>in</strong>formation<br />
required by these guidel<strong>in</strong>es. Other voluntary schemes <strong>in</strong>volv<strong>in</strong>g report<strong>in</strong>g, such as the<br />
European Eco-Management and Audit<strong>in</strong>g Scheme (EMAS), also demonstrate that<br />
diffusion <strong>of</strong> guidel<strong>in</strong>es <strong>in</strong>to practice can be slow.
<strong>Environmental</strong> <strong><strong>in</strong>dicators</strong> <strong>in</strong> <strong>in</strong>dustry - the MEPI experience 5<br />
The MEPI approach<br />
The MEPI project aimed to demonstrate that robust quantitative analysis <strong>of</strong><br />
<strong>in</strong>dustrial environmental performance can be carried out on the basis <strong>of</strong> publicly available<br />
<strong>in</strong>formation. To achieve this, a balance has to be found between do<strong>in</strong>g justice to<br />
complexity on the one hand, and pragmatism about data availability and quality on the<br />
other hand.<br />
<strong>Environmental</strong> performance <strong><strong>in</strong>dicators</strong> should aim to compare the comparable. In<br />
most cases, this means compar<strong>in</strong>g companies and sites with<strong>in</strong> the same economic sector<br />
on an annual basis. For example, benchmark<strong>in</strong>g the energy use <strong>of</strong> an <strong>in</strong>surance company<br />
with the energy use <strong>of</strong> a chemical firm may not generate useful results to either.<br />
Sometimes - if companies with<strong>in</strong> the same sector use processes with very different<br />
environmental pr<strong>of</strong>iles - it may be necessary to def<strong>in</strong>e sub-sectors, as shown <strong>in</strong> Table 1 :<br />
Table 1. – The sectors analysed <strong>in</strong> the MEPI project and correspond<strong>in</strong>g subsectors.<br />
MEPI Sectors Sub-sectors<br />
Book and magaz<strong>in</strong>e pr<strong>in</strong>t<strong>in</strong>g rotogravure, <strong>of</strong>fset, mixed, other<br />
Computer manufacture<br />
Electricity generation coal, gas, nuclear, hydro, mixed, other<br />
Fertiliser production nitrogen, phosphorus, mixed, other<br />
Pulp and paper manufacture corrugated board, conta<strong>in</strong>er board,<br />
Textile f<strong>in</strong>ish<strong>in</strong>g<br />
tissue, fluff, newspr<strong>in</strong>t and magaz<strong>in</strong>es,<br />
f<strong>in</strong>e, mixed, other<br />
The process <strong>of</strong> data collection, <strong>in</strong>dicator development and data analysis
<strong>Environmental</strong> <strong><strong>in</strong>dicators</strong> <strong>in</strong> <strong>in</strong>dustry - the MEPI experience 6<br />
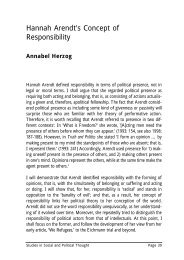
The MEPI approach dist<strong>in</strong>guishes between variables and <strong><strong>in</strong>dicators</strong>. Through<br />
literature reviews that identified the environmental pr<strong>of</strong>iles <strong>of</strong> different <strong>in</strong>dustry sectors,<br />
and follow<strong>in</strong>g consultation with representatives from <strong>in</strong>dustry, policymak<strong>in</strong>g and<br />
f<strong>in</strong>ancial organisations, <strong>in</strong>dicator sets for each <strong>of</strong> the sectors studied were generated.<br />
These presented identifiable data requirements. Data is collected for this set <strong>of</strong> variables,<br />
provid<strong>in</strong>g the <strong>in</strong>formation necessary to measure environmental performance. For<br />
example, CO2 emissions or pr<strong>of</strong>its. In a second step, <strong><strong>in</strong>dicators</strong> are constructed from<br />
these variables (Figure 1). In most cases <strong><strong>in</strong>dicators</strong> are simple ratios <strong>of</strong> two variables<br />
(e.g. water consumption per tonne <strong>of</strong> paper produced).<br />
Sectoral<br />
review<br />
Generate<br />
variable set<br />
Figure 1. – The process <strong>of</strong> data collection, <strong>in</strong>dicator development and data analysis.<br />
A number <strong>of</strong> standard denom<strong>in</strong>ators were used to construct environmental<br />
performance <strong><strong>in</strong>dicators</strong> (OLSTHOORN et al. 2001) :<br />
* Functional unit: a standardised unit <strong>of</strong> production from a given sector<br />
* Turnover: total sales for a given company (or site)<br />
* Employees: number <strong>of</strong> personnel employed by the company (or site)<br />
* Value added: total value <strong>of</strong> sales m<strong>in</strong>us cost <strong>of</strong> materials<br />
* Pr<strong>of</strong>it: untaxed total value <strong>of</strong> sales m<strong>in</strong>us cost <strong>of</strong> sales<br />
When compar<strong>in</strong>g <strong>in</strong>dicator sets across sectors, it is clear that many environmental<br />
issues are generally applicable, for example energy use, greenhouse gas emissions and<br />
water consumption. Other problems are specific to certa<strong>in</strong> production processes, for<br />
example nuclear fuel discharges and copper emissions. Therefore, MEPI uses a<br />
comb<strong>in</strong>ation <strong>of</strong> generic and sector-specific variables. This approach reduces complexity<br />
while also provid<strong>in</strong>g some flexibility. Details are given <strong>in</strong> BERKHOUT et al. (2001) and<br />
TYTECA et al. (2001).<br />
Collect<br />
data<br />
Normalise<br />
data<br />
Generate<br />
<strong><strong>in</strong>dicators</strong><br />
Analyse<br />
data
<strong>Environmental</strong> <strong><strong>in</strong>dicators</strong> <strong>in</strong> <strong>in</strong>dustry - the MEPI experience 7<br />
Limitations <strong>of</strong> the MEPI approach<br />
The MEPI approach also has some limitations:<br />
* The approach is based on economic sectors and their different environmental<br />
characteristics. However, an <strong>in</strong>creas<strong>in</strong>g number <strong>of</strong> large companies operate <strong>in</strong> a<br />
wide range <strong>of</strong> sectors. The sectoral frame and the comparisons that flow from it<br />
may therefore need to be treated with caution.<br />
* The MEPI approach assumes that companies with<strong>in</strong> a sector or sub-sector face<br />
similar environmental challenges. It is less suitable for sectors with more diverse<br />
products and processes.<br />
* <strong>Environmental</strong> data is usually focused on production processes. Currently, it does<br />
not provide a means for assess<strong>in</strong>g the environmental performance <strong>of</strong> goods and<br />
services provided by a firm over their entire life cycle.<br />
2. Overview <strong>of</strong> results<br />
The results obta<strong>in</strong>ed <strong>in</strong> the scope <strong>of</strong> the MEPI project are described <strong>in</strong> a report to<br />
the European Commission (BERKHOUT et al. 2001) ; some details are also given <strong>in</strong><br />
TYTECA et al. (2001) and WEHRMEYER et al. (2001). In this section we give an<br />
overview <strong>of</strong> the general results. Table 2 gives an idea <strong>of</strong> the data coverage, by country<br />
and sector. It must be said that although the global coverage appears rather good <strong>in</strong><br />
several sectors, there were many blanks <strong>in</strong> the data, due to the unavailability <strong>of</strong> values for<br />
many <strong>of</strong> the variables that make part <strong>of</strong> the MEPI database. In order to account for this,<br />
and to identify the most significant variables that <strong>in</strong>fluence the companies' environmental<br />
performance, statistical analyses (i.e., pr<strong>in</strong>cipal component analyses) were conducted<br />
(see details <strong>in</strong> the references given above).<br />
Analysis confirmed that aggregate environmental performance can be adequately<br />
reflected by a subset <strong>of</strong> the variables <strong>in</strong>corporated <strong>in</strong> the database. These results have<br />
important implications for the statistical analysis carried out. Construction <strong>of</strong>
<strong>Environmental</strong> <strong><strong>in</strong>dicators</strong> <strong>in</strong> <strong>in</strong>dustry - the MEPI experience 8<br />
performance <strong><strong>in</strong>dicators</strong>, benchmark<strong>in</strong>g and analysis <strong>of</strong> explanatory factors was based on<br />
those variables that appeared to be both sufficiently available with<strong>in</strong> the dataset and were<br />
found to be significantly <strong>in</strong>fluential to the environmental performance. Also, the analyses<br />
that we were able to perform depended on the sector analysed. Due to the lack <strong>of</strong> data,<br />
no further analysis <strong>of</strong> the computer manufactur<strong>in</strong>g sector was possible. In some <strong>of</strong> the<br />
sectors (pulp and paper, fertilizer) with more heterogeneous processes and products,<br />
analysis needed to be sensitive to the problem <strong>of</strong> compar<strong>in</strong>g apples and pears.<br />
Country<br />
Table 2. - Distribution <strong>of</strong> firm-years accross countries and sectors.<br />
Sector<br />
Pulp &<br />
paper<br />
Fertil-<br />
izer<br />
Textile<br />
f<strong>in</strong>ish<strong>in</strong>g<br />
Pr<strong>in</strong>t<strong>in</strong>g Electric.<br />
generat.<br />
Comput<br />
manuf.<br />
Total<br />
Austria 23 1 4 2 30<br />
Belgium 24 19 14 15 72<br />
F<strong>in</strong>land 3 3<br />
Germany 78 6 30 52 31 16 213<br />
Italy 38 16 26 19 73 16 188<br />
Netherlands 70 20 43 7 140<br />
Sweden 11 11<br />
UK 22 20 17 59<br />
Total 269 81 114 75 145 32 716<br />
Correlation between bus<strong>in</strong>ess, management and environmental variables<br />
One aim <strong>of</strong> the MEPI study was to understand better underly<strong>in</strong>g patterns <strong>in</strong><br />
bus<strong>in</strong>ess environmental performance. In particular, we were <strong>in</strong>terested <strong>in</strong> understand<strong>in</strong>g<br />
whether there are relationships between aspects <strong>of</strong> bus<strong>in</strong>ess and management<br />
performance and environmental performance (for <strong>in</strong>stance, are more pr<strong>of</strong>itable firms<br />
higher environmental performers?). Regression analyses were carried out, us<strong>in</strong>g the<br />
reduced core variable sets only. All regressions were conducted us<strong>in</strong>g environmental
<strong>Environmental</strong> <strong><strong>in</strong>dicators</strong> <strong>in</strong> <strong>in</strong>dustry - the MEPI experience 9<br />
<strong><strong>in</strong>dicators</strong> normalised by 'functional unit (FU)'. Multiple l<strong>in</strong>ear regressions were carried<br />
out with stepwise enter<strong>in</strong>g <strong>of</strong> dependent variables. A summary <strong>of</strong> the most significant<br />
results is shown <strong>in</strong> Table 3 <strong>in</strong> the Appendix. The table summarises many results, a few <strong>of</strong><br />
which will be further commented on <strong>in</strong> the next section.<br />
Rank<strong>in</strong>gs and benchmark<strong>in</strong>g<br />
Rank<strong>in</strong>gs <strong>of</strong> firms across three core environmental performance <strong><strong>in</strong>dicators</strong>, for<br />
five MEPI sectors (book and magaz<strong>in</strong>e pr<strong>in</strong>t<strong>in</strong>g, electricity generation, fertiliser<br />
production, pulp and paper manufacture and textile f<strong>in</strong>ish<strong>in</strong>g). Company rank<strong>in</strong>gs are a<br />
powerful way <strong>of</strong> us<strong>in</strong>g greater transparency <strong>in</strong> corporate environmental performance to<br />
<strong>in</strong>fluence management decisions. However, rank<strong>in</strong>gs <strong>of</strong> performance must be treated<br />
with caution. A lower rank does not necessarily <strong>in</strong>dicate poor environmental<br />
management. It may be expla<strong>in</strong>ed by the technological, market or regulatory constra<strong>in</strong>ts<br />
the firm operates with<strong>in</strong>. For example, its products may require a particularly energy-<br />
<strong>in</strong>tensive production process. Besides the company level, results were also obta<strong>in</strong>ed at<br />
the site level, with some particular methodological issues regard<strong>in</strong>g, among other,<br />
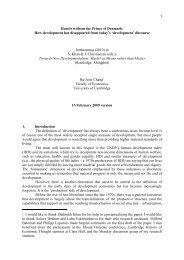
aggregate <strong><strong>in</strong>dicators</strong> (TYTECA et al. 2001). An example show<strong>in</strong>g water use by pr<strong>in</strong>t<strong>in</strong>g<br />
firms is shown <strong>in</strong> Figure 1.<br />
Rank Firm or Bus<strong>in</strong>ess Unit m 3 /employee*<br />
1 Druckerei Rudolph 7.8<br />
2 Georg Kohl GmbH 12.8<br />
3 Monti n.v. 17.4<br />
4 Walter Medien GmbH 19.2<br />
5 Alfred Wall AG 26<br />
6 Brühl Druck & Pressehaus Giessen 26.2<br />
7 Bisch<strong>of</strong> & Kle<strong>in</strong> GmbH 34.2<br />
8 Süddeutscher Zeitungsdienst Aalen 35.3<br />
9 Stark Druck GmbH 41.6<br />
10 Enschede-Van Muysew<strong>in</strong>kel n.v. 50.3<br />
* Mean value for all available years.
<strong>Environmental</strong> <strong><strong>in</strong>dicators</strong> <strong>in</strong> <strong>in</strong>dustry - the MEPI experience 10<br />
Figure 1 : Rank<strong>in</strong>g table - Pr<strong>in</strong>t<strong>in</strong>g Firms on Water Use (Water Input per Employee)
<strong>Environmental</strong> <strong><strong>in</strong>dicators</strong> <strong>in</strong> <strong>in</strong>dustry - the MEPI experience 11<br />
3. Methodological and analytical results<br />
The MEPI project generated methodological and analytical results lead<strong>in</strong>g to a<br />
number <strong>of</strong> policy conclusions, The most salient <strong>of</strong> these are commented on here.<br />
Evidence support<strong>in</strong>g these conclusions can be found at the project website.<br />
Methodological results<br />
1. Although measur<strong>in</strong>g environmental performance poses many challenges, the MEPI<br />
study has demonstrated that an evidence base now exists for conduct<strong>in</strong>g well-<br />
founded analysis <strong>of</strong> performance on the basis <strong>of</strong> publicly available data <strong>in</strong> some<br />
<strong>in</strong>dustrial sectors.<br />
2. After several years <strong>of</strong> experimentation and fragmentation, there is evidence <strong>of</strong><br />
methodological convergence across different approaches to environmental<br />
performance measurement proposed by the Global Report<strong>in</strong>g Initiative (GRI), World<br />
Bus<strong>in</strong>ess Council for Susta<strong>in</strong>able Development (WBCSD), MEPI and other<br />
<strong>in</strong>itiatives. All stress the need for a consolidated core set <strong>of</strong> <strong><strong>in</strong>dicators</strong>, as well as<br />
sector-specific <strong><strong>in</strong>dicators</strong>. MEPI provides the most comprehensive pilot<strong>in</strong>g <strong>of</strong> this<br />
approach across several <strong>in</strong>dustries.<br />
3. Because environmental impact from bus<strong>in</strong>esses can be analysed at multiple levels<br />
(process, production site, bus<strong>in</strong>ess unit, and firm) and has multiple dimensions<br />
(energy use, resource use, emissions, and environmental management), data needs<br />
are potentially large. It is crucial to focus on the most relevant elements <strong>of</strong> corporate<br />
environmental performance. The MEPI study developed an approach to focus<strong>in</strong>g<br />
analysis on <strong><strong>in</strong>dicators</strong> with high explanatory value, so reduc<strong>in</strong>g data collection and<br />
analytical effort.<br />
4. Normalisation is a critical issue for the measurement <strong>of</strong> environmental performance.<br />
There is frequently a mismatch between the functional units which are most<br />
appropriate (value added and pr<strong>of</strong>its) and those for which data is available<br />
(employees and production output). Variables for which data availability is better<br />
were frequently used <strong>in</strong> the MEPI analysis.
<strong>Environmental</strong> <strong><strong>in</strong>dicators</strong> <strong>in</strong> <strong>in</strong>dustry - the MEPI experience 12<br />
Analytical results<br />
1. Core <strong><strong>in</strong>dicators</strong>: Analysis <strong>of</strong> the MEPI performance data suggests that a small<br />
number <strong>of</strong> <strong><strong>in</strong>dicators</strong> give a relatively good representation <strong>of</strong> the overall<br />
environmental performance <strong>of</strong> a firm. For the pulp and paper, fertiliser and electricity<br />
sectors these core <strong><strong>in</strong>dicators</strong> are: total waste; SO2, NOx, and CO2 emissions to air;<br />
nitrogen, phosphorous, chemical oxygen demand (COD) emissions to water; total<br />
water <strong>in</strong>put; and total energy <strong>in</strong>put.<br />
2. Performance variability: Performance between firms tends to vary widely for most<br />
sectors and <strong><strong>in</strong>dicators</strong> analysed. Frequently the range <strong>of</strong> performance spans orders <strong>of</strong><br />
magnitude. The ma<strong>in</strong> explanation appears to be the production technology used, but<br />
significant variability <strong>in</strong> performance was also revealed between companies us<strong>in</strong>g<br />
similar technologies.<br />
3. Performance trends: In cases for which time series data was available, change <strong>in</strong><br />
environmental performance did not occur progressively over time. This is because<br />
performance is dependent on two factors, one environmental the other related to<br />
bus<strong>in</strong>ess performance.<br />
4. Size effect: The size <strong>of</strong> the production site appears not to be related to environmental<br />
performance. The relationship between firm size and environmental performance<br />
seems from our data to be mixed, depend<strong>in</strong>g on the sector and variable concerned.<br />
For example, large paper firms had relatively higher COD emissions, but large<br />
electricity firms tended to be more efficient <strong>in</strong> convert<strong>in</strong>g fuel <strong>in</strong>puts <strong>in</strong>to energy<br />
outputs. This is an <strong>in</strong>terest<strong>in</strong>g result s<strong>in</strong>ce large firms are generally held to have both<br />
greater <strong>in</strong>ternal capabilities to manage environmental performance, and to be under<br />
more susta<strong>in</strong>ed regulatory pressure. However, the result appears not to confirm that<br />
smaller-scale niche operators use technologies with dist<strong>in</strong>ct environmental<br />
advantages.<br />
5. Pr<strong>of</strong>it effect: There is little evidence, on the basis <strong>of</strong> the MEPI data, <strong>of</strong> a l<strong>in</strong>k between<br />
high pr<strong>of</strong>itability and high levels <strong>of</strong> environmental performance, but neither is there<br />
evidence <strong>of</strong> a negative correlation. We f<strong>in</strong>d three cases where higher environmental<br />
performance does correlate significantly with higher pr<strong>of</strong>itability: waste generation <strong>in</strong><br />
the pulp and paper <strong>in</strong>dustry; and air emissions and energy consumption <strong>in</strong> the
<strong>Environmental</strong> <strong><strong>in</strong>dicators</strong> <strong>in</strong> <strong>in</strong>dustry - the MEPI experience 13<br />
fertiliser <strong>in</strong>dustry. That is, we f<strong>in</strong>d that paper companies that produce more waste<br />
also tend to be less pr<strong>of</strong>itable.<br />
6. <strong>Environmental</strong> management effect: Firms with a certified environmental management<br />
system do not appear to perform better than those without, although at both the site<br />
(EMAS) and firm levels the statistical significance <strong>of</strong> this result was low. In some<br />
cases, firms with certified environmental management systems performed worse. At<br />
the firm level, the only exception was found <strong>in</strong> fertiliser production (lower nitrogen<br />
emissions to water among ISO/EMAS registered firms). At the site level there is<br />
some more evidence <strong>of</strong> a positive <strong>in</strong>fluence <strong>of</strong> environmental management systems.<br />
The study found that certified/registered paper production sites had lower COD<br />
emissions to water and had lower water <strong>in</strong>puts. The th<strong>in</strong>ness <strong>of</strong> the evidence for an<br />
‘environmental management effect’ is somewhat surpris<strong>in</strong>g, given the expectations<br />
that voluntary schemes would have a positive impact on performance.<br />
7. Technology effect: Perhaps not surpris<strong>in</strong>gly, the environmental performance on the<br />
site-level is strongly related to the sub-sector <strong>in</strong> which the site is operat<strong>in</strong>g, and the<br />
process technology be<strong>in</strong>g used. For example there were consistent marked<br />
differences <strong>in</strong> the environmental performance across a range <strong>of</strong> measures <strong>of</strong> graphic<br />
f<strong>in</strong>e paper, hygienic fluff and packag<strong>in</strong>g production sites <strong>in</strong> the pulp and paper sector.<br />
8. Country effect: A strong country effect could not be shown. Significant differences<br />
between countries appeared only <strong>in</strong> a few countries, sectors and variables (Belgian<br />
and Dutch electricity sites are significantly cleaner than UK companies, but these<br />
differences are significant only for SO2 and NOx, not for CO2).<br />
4. Issues for policy<br />
Support<strong>in</strong>g an extension <strong>of</strong> transparency
<strong>Environmental</strong> <strong><strong>in</strong>dicators</strong> <strong>in</strong> <strong>in</strong>dustry - the MEPI experience 14<br />
There are a number <strong>of</strong> reasons why transparency is becom<strong>in</strong>g a key pr<strong>in</strong>ciple <strong>in</strong><br />
environmental policy:<br />
* Citizens demand the right to know whether companies are behav<strong>in</strong>g responsibly<br />
* <strong>Environmental</strong> competition between companies (competition on environmental<br />
performance, as well as on price and quality) requires a common <strong>in</strong>formation,<br />
report<strong>in</strong>g and analytical basis.<br />
* New voluntary and market-based policy <strong>in</strong>struments are more <strong>in</strong>formation-<br />
<strong>in</strong>tensive. Markets for environmental services cannot operate without transparency.<br />
* Evaluation <strong>of</strong> environmental policy impact needs to be based on empirical<br />
evidence. Without evidence <strong>of</strong> benefit commensurate with costs, the legitimacy <strong>of</strong><br />
policy is underm<strong>in</strong>ed.<br />
The MEPI project has demonstrated that an <strong>in</strong>formation base for conduct<strong>in</strong>g<br />
<strong>in</strong>tegrated analysis <strong>of</strong> the environmental performance <strong>of</strong> European <strong>in</strong>dustry is becom<strong>in</strong>g<br />
available. It has also demonstrated the major weaknesses and gaps that still exist <strong>in</strong> this<br />
<strong>in</strong>formation base. The level <strong>of</strong> performance report<strong>in</strong>g varies widely between countries,<br />
sectors and firms.<br />
EU and national-level policy can play a critical role <strong>in</strong> encourag<strong>in</strong>g and mandat<strong>in</strong>g<br />
an extension <strong>of</strong> performance report<strong>in</strong>g by more firms <strong>in</strong> more sectors. While<br />
governments are beg<strong>in</strong>n<strong>in</strong>g to encourage more measurement and report<strong>in</strong>g, the<br />
commitment to these transparency measures rema<strong>in</strong>s weak. Widespread benchmark<strong>in</strong>g<br />
will enable firms to set targets for improv<strong>in</strong>g eco-efficiency, as well as provid<strong>in</strong>g<br />
<strong>in</strong>centives for do<strong>in</strong>g so by <strong>in</strong>form<strong>in</strong>g shareholders, customers and regulators about sites'<br />
and firms' relative performance.<br />
The process <strong>of</strong> standardis<strong>in</strong>g environmental data collection, report<strong>in</strong>g and<br />
performance measurement needs to be supported by policy measures. Many voluntary<br />
standardisation <strong>in</strong>itiatives have produced conceptual frameworks, but few practical tools.<br />
Sector-based voluntary and mandatory schemes also need to be considered.
<strong>Environmental</strong> <strong><strong>in</strong>dicators</strong> <strong>in</strong> <strong>in</strong>dustry - the MEPI experience 15<br />
Reduc<strong>in</strong>g the variability <strong>of</strong> <strong>in</strong>dustrial environmental performance<br />
The MEPI project confirmed the wide <strong>in</strong>tra-sectoral variability <strong>in</strong> measured<br />
environmental performance (across both regulated and unregulated performance<br />
measures) <strong>in</strong> EU <strong>in</strong>dustry. Some <strong>of</strong> this variability can be expla<strong>in</strong>ed by technological<br />
differences with<strong>in</strong> sectors and some by differ<strong>in</strong>g regulatory standards and enforcement.<br />
However, these prelim<strong>in</strong>ary results suggest that there rema<strong>in</strong> large potentials for<br />
improv<strong>in</strong>g the eco-efficiency and for reduc<strong>in</strong>g environmental impact <strong>of</strong> European<br />
<strong>in</strong>dustry.<br />
The results <strong>of</strong> the project also show that many assumptions about environmental<br />
performance need to be revisited. In particular we have been unable to detect clear l<strong>in</strong>ks<br />
between firm size and environmental performance, and firm location and environmental<br />
performance. Small southern European firms seem equally likely, on this evidence, to be<br />
good performers, as large northern European firms.<br />
Policy has a role <strong>in</strong> both widen<strong>in</strong>g the scope <strong>of</strong> environmental performance<br />
benchmark<strong>in</strong>g between firms on an EU basis and by us<strong>in</strong>g this <strong>in</strong>formation <strong>in</strong> the<br />
development <strong>of</strong> new policy and the implementation <strong>of</strong> exist<strong>in</strong>g policy.<br />
The uncerta<strong>in</strong> benefits <strong>of</strong> environmental management systems<br />
Over the last ten years many companies have adopted environmental management<br />
systems, whether registered/certified or not. There has been a wide expectation that<br />
these new management approaches would lead to tangible benefits <strong>in</strong> terms <strong>of</strong> improved<br />
environmental performance. Many companies have argued that 'regulatory relief' should<br />
be given to firms with environmental management systems.<br />
The l<strong>in</strong>k between environmental management and performance was analysed<br />
statistically <strong>in</strong> the MEPI project. In general, we do not f<strong>in</strong>d that those companies with a<br />
registered/certified EMS perform significantly better than those without. Indeed, <strong>in</strong> some
<strong>Environmental</strong> <strong><strong>in</strong>dicators</strong> <strong>in</strong> <strong>in</strong>dustry - the MEPI experience 16<br />
cases they appear to perform worse than those without an EMS. This is an unexpected<br />
result for which there may be a number <strong>of</strong> possible explanations:<br />
* a 'lag effect' <strong>in</strong> which companies with an EMS do not immediately experience an<br />
environmental performance benefit; or<br />
* a 'catch<strong>in</strong>g-up effect' <strong>in</strong> which companies that perceive themselves to be poor<br />
performers are those that seek to implement a system as a way <strong>of</strong> reach<strong>in</strong>g the best<br />
practice frontier.<br />
This result suggests that more evidence is needed before environmental<br />
arguments are made <strong>in</strong> favour <strong>of</strong> regulatory relief for certified firms. It also underscores<br />
the need for a better <strong>in</strong>formation base for evaluat<strong>in</strong>g the impacts <strong>of</strong> voluntary and<br />
market-based environmental policy <strong>in</strong>struments.
<strong>Environmental</strong> <strong><strong>in</strong>dicators</strong> <strong>in</strong> <strong>in</strong>dustry - the MEPI experience 17<br />
References<br />
BERKHOUT, F. (coord.), AZZONE, G., CARLENS, J., HERTIN, J., JASCH, C., NOCI, G.,<br />
OLSTHOORN, X., TYTECA, D., VAN DER WOERD, F., VAN DRUNEN, M., WAGNER,<br />
M., WEHRMEYER, W., & WOLF, O., 2001. - MEPI – Measur<strong>in</strong>g the <strong>Environmental</strong><br />
Performance <strong>of</strong> Industry. F<strong>in</strong>al report, EC Environment and Climate Research<br />
Programme: Research Theme 4 - Human Dimensions <strong>of</strong> <strong>Environmental</strong> Change -<br />
Contract No: ENV4-CT97-0655. February 2001. Web site<br />
http://www.environmental-performance.org.<br />
GREENO & ROBINSON, 1992. - Reth<strong>in</strong>k<strong>in</strong>g corporate environmental management.<br />
Columbia Journal <strong>of</strong> World Bus<strong>in</strong>ess Fall & W<strong>in</strong>ter 1992, 222-232.<br />
MULLINS, J.M., 2000. - Public Accountability: Disclosure <strong>in</strong> a Competitive<br />
Environment. prepared for the <strong>Environmental</strong>, Health and Safety Audit<strong>in</strong>g Roundtable<br />
newsletter. http://www.globalreport<strong>in</strong>g.org.<br />
OLSTHOORN, X., TYTECA, D., WAGNER, M. & WEHRMEYER, W., 2001. - Us<strong>in</strong>g<br />
environmental <strong><strong>in</strong>dicators</strong> for bus<strong>in</strong>ess ? - A literature review and the need for<br />
standardisation and aggregation <strong>of</strong> data. To appear <strong>in</strong> Journal <strong>of</strong> Cleaner Production.<br />
TYTECA, D., CARLENS, J., BERKHOUT, F., HERTIN, J., WEHRMEYER, W. & WAGNER,<br />
W., 2001. - Corporate environmental performance evaluation: evidence from the<br />
MEPI project. To appear <strong>in</strong> Bus<strong>in</strong>ess Strategy and the Environment.<br />
VERFAILLIE, H.A. & BIDWELL, R., 2000. - Measur<strong>in</strong>g eco-efficiency - a guide to<br />
report<strong>in</strong>g company performance. World Bus<strong>in</strong>ess Council for Susta<strong>in</strong>able<br />
Development.<br />
WEHRMEYER, W., TYTECA, D. & WAGNER, M., 2001. - How many (and which)<br />
Indicators are necessary to compare the <strong>Environmental</strong> Performance <strong>of</strong> Companies? A<br />
sectoral and statistical answer. Paper for The 7 th European Roundtable on Cleaner<br />
Production, 2-4 May 2001, Lund, Sweden.<br />
WHITE, A.L., 1999. - Susta<strong>in</strong>ability and the accountable corporation: society's ris<strong>in</strong>g<br />
expectations <strong>of</strong> bus<strong>in</strong>ess. Environment 41 (8), 30-43.
Management<br />
Bus<strong>in</strong>ess<br />
<strong>Environmental</strong><br />
<strong>Environmental</strong> <strong><strong>in</strong>dicators</strong> <strong>in</strong> <strong>in</strong>dustry - the MEPI experience 18<br />
Appendix - Table 3. – Correlations between management, bus<strong>in</strong>ess and environmental<br />
performance variables <strong>in</strong> firms surveyed by MEPI<br />
EMAS<br />
ISO<br />
Invest Rep<br />
Pulp and<br />
paper<br />
No result<br />
Number <strong>of</strong><br />
employees<br />
(+)<br />
Sales COD (+)<br />
Pr<strong>of</strong>it<br />
Number <strong>of</strong><br />
employees<br />
COD (+);<br />
Total waste<br />
(-)<br />
Energy<br />
<strong>in</strong>put (+)<br />
Waste Pr<strong>of</strong>it (-)<br />
Air<br />
emissions<br />
Water<br />
emissions<br />
Fertiliser<br />
manufacture<br />
Certified firms<br />
have: NOx (+);<br />
N(itrogen) (-); Pr<strong>of</strong>it<br />
(+)<br />
No result<br />
(no regression s<strong>in</strong>ce<br />
Sales are functional<br />
unit)<br />
Energy <strong>in</strong>put (-);<br />
SO2 (-);<br />
Heavy metals (+)<br />
NOx (-);<br />
SO2 (-);<br />
COD (+); N (-);<br />
Water <strong>in</strong>put (+)<br />
Number <strong>of</strong><br />
employees (+)<br />
Sales (+) Pr<strong>of</strong>it (-)<br />
Sales (+)<br />
Heavy metals (+);<br />
Number <strong>of</strong><br />
employees (-)<br />
Electricity<br />
generation<br />
No result<br />
Pr<strong>of</strong>it<br />
(pr<strong>of</strong>itable<br />
firms report)<br />
Energy <strong>in</strong>put<br />
(-);<br />
Municipal<br />
waste (-)<br />
Total Fuel<br />
<strong>in</strong>put (-);<br />
CO2 (-)<br />
Renewables<br />
(-);<br />
Gas Input (-),<br />
EMAS<br />
certification<br />
No result<br />
Variables were<br />
excluded from<br />
analysis<br />
Textile f<strong>in</strong>ish<strong>in</strong>g Pr<strong>in</strong>t<strong>in</strong>g<br />
No result No results<br />
No result No results<br />
CO2 (+);<br />
Water <strong>in</strong>put (-);<br />
Total waste (+)<br />
CO2 (-);<br />
Water <strong>in</strong>put (+);<br />
Total <strong>in</strong>k (+);<br />
ISO (certified<br />
firms larger)<br />
No result Total <strong>in</strong>k (+)<br />
CO2 (+);<br />
Total waste (+);<br />
Energy <strong>in</strong>put (-)<br />
Sales (+);<br />
Pr<strong>of</strong>it (-);<br />
Number <strong>of</strong><br />
employees (+)<br />
Number <strong>of</strong><br />
employees (+)<br />
Number <strong>of</strong><br />
employees (+);<br />
Pr<strong>of</strong>it (+)<br />
CO2 (+);<br />
Isopropyl alcohol<br />
<strong>in</strong>put (-);<br />
Total electricity<br />
(+)<br />
Total waste:<br />
Pr<strong>of</strong>it (-);<br />
Hazardous waste:<br />
Employees (-)<br />
Sales (+)<br />
Employees (CO2<br />
+; SO2 -)<br />
No result
<strong>Environmental</strong> <strong><strong>in</strong>dicators</strong> <strong>in</strong> <strong>in</strong>dustry - the MEPI experience 19<br />
Water <strong>in</strong>put<br />
Energy<br />
<strong>in</strong>put<br />
Number <strong>of</strong><br />
employees<br />
(+)<br />
Number <strong>of</strong><br />
employees<br />
(+)<br />
No result<br />
Pr<strong>of</strong>it (-);<br />
No ISO registration<br />
Separate<br />
report<strong>in</strong>g <strong>of</strong><br />
environmental<br />
<strong>in</strong>vestment<br />
Sales (-);<br />
Pr<strong>of</strong>it (+);<br />
Number <strong>of</strong><br />
employees (+)<br />
Sales (+);<br />
Pr<strong>of</strong>it (-);<br />
Number <strong>of</strong><br />
employees (+)<br />
Results obta<strong>in</strong>ed from regressions on the MEPI variables at the company level. A "+" <strong>in</strong><br />
brackets follow<strong>in</strong>g the variable name means a positive correlation, a "-" a negative<br />
regression coefficient. 'No result' signifies that no significant correlations could be found<br />
between the variable identified <strong>in</strong> the left hand column and other variables.<br />
Sales (+); EMAS<br />
registered (lower<br />
<strong>in</strong>put); Employees<br />
(-)<br />
Pr<strong>of</strong>it (+)<br />
Fuel: Pr<strong>of</strong>it (+)<br />
EMAS (higher)<br />
Electricity: Sales<br />
(+), Employees<br />
(-);<br />
Pr<strong>of</strong>it (+)<br />
ISO (lower)