Chapter Review - Nelson Education
Chapter Review - Nelson Education
Chapter Review - Nelson Education

Create successful ePaper yourself
Turn your PDF publications into a flip-book with our unique Google optimized e-Paper software.
Table of Contents<br />
<strong>Chapter</strong> 1: Systems of Linear Equations 2<br />
Getting Started 4<br />
1.1 Representing Linear Relations 8<br />
1.2 Solving Linear Equations 15<br />
1.3 Graphically Solving Linear Systems 21<br />
Curious Math 29<br />
Mid-<strong>Chapter</strong> <strong>Review</strong> 30<br />
1.4 Solving Linear Systems: Substitution 33<br />
1.5 Equivalent Linear Systems 41<br />
1.6 Solving Linear Systems: Elimination 49<br />
1.7 Exploring Linear Systems 57<br />
<strong>Chapter</strong> <strong>Review</strong> 60<br />
<strong>Chapter</strong> Self-Test 64<br />
<strong>Chapter</strong> Task 65<br />
<strong>Chapter</strong> 2: Analytic Geometry:<br />
Line Segments and Circles 66<br />
Getting Started 68<br />
2.1 Midpoint of a Line Segment 72<br />
2.2 Length of a Line Segment 81<br />
2.3 Equation of a Circle 88<br />
Mid-<strong>Chapter</strong> <strong>Review</strong> 94<br />
2.4 Classifying Figures on a Coordinate Grid 96<br />
2.5 Verifying Properties of Geometric Figures 104<br />
2.6 Exploring Properties of Geometric Figures 111<br />
Curious Math 114<br />
2.7 Using Coordinates to Solve Problems 115<br />
<strong>Chapter</strong> <strong>Review</strong> 122<br />
<strong>Chapter</strong> Self-Test 126<br />
<strong>Chapter</strong> Task 127<br />
<strong>Chapter</strong> 3: Graphs of Quadratic<br />
Relations 128<br />
Getting Started 130<br />
3.1 Exploring Quadratic Relations 134<br />
3.2 Properties of Graphs of Quadratic Relations 138<br />
Curious Math 149<br />
3.3 Factored Form of a Quadratic Relation 150<br />
Mid-<strong>Chapter</strong> <strong>Review</strong> 159<br />
3.4 Expanding Quadratic Expressions 161<br />
3.5 Quadratic Models Using Factored Form 169<br />
3.6 Exploring Quadratic and<br />
Exponential Graphs 179<br />
<strong>Chapter</strong> <strong>Review</strong> 183<br />
<strong>Chapter</strong> Self-Test 187<br />
<strong>Chapter</strong> Task 188<br />
<strong>Chapter</strong>s 1–3 Cumulative <strong>Review</strong> 189<br />
<strong>Chapter</strong> 4: Factoring Algebraic<br />
Expressions 192<br />
Getting Started 194<br />
4.1 Common Factors in Polynomials 198<br />
4.2 Exploring the Factorization of Trinomials 205<br />
4.3 Factoring Quadratics: x 2 + bx + c 207<br />
Mid-<strong>Chapter</strong> <strong>Review</strong> 214<br />
4.4 Factoring Quadratics: ax 2 + bx + c 217<br />
4.5 Factoring Quadratics: Special Cases 225<br />
Curious Math 232<br />
4.6 Reasoning about Factoring Polynomials 233<br />
<strong>Chapter</strong> <strong>Review</strong> 238<br />
<strong>Chapter</strong> Self-Test 242<br />
<strong>Chapter</strong> Task 243<br />
iv<br />
Table of Contents<br />
Draft Evaluation Copy<br />
NEL
<strong>Chapter</strong> 5: Applying Quadratic<br />
Models 244<br />
Getting Started 246<br />
5.1 Stretching/Reflecting Quadratic Relations 250<br />
5.2 Exploring Translations of Quadratic Relations 259<br />
5.3 Graphing Quadratics in Vertex Form 263<br />
Mid-<strong>Chapter</strong> <strong>Review</strong> 273<br />
5.4 Quadratic Models Using Vertex Form 275<br />
5.5 Solving Problems Using Quadratic Relations 285<br />
Curious Math 296<br />
5.6 Connecting Standard and Vertex Forms 297<br />
<strong>Chapter</strong> <strong>Review</strong> 303<br />
<strong>Chapter</strong> Self-Test 306<br />
<strong>Chapter</strong> Task 307<br />
<strong>Chapter</strong> 6: Quadratic Equations 308<br />
Getting Started 310<br />
6.1 Solving Quadratic Equations 314<br />
6.2 Exploring the Creation of Perfect Squares 322<br />
Curious Math 324<br />
6.3 Completing the Square 325<br />
Mid-<strong>Chapter</strong> <strong>Review</strong> 333<br />
6.4 The Quadratic Formula 336<br />
6.5 Interpreting Quadratic Equation Roots 345<br />
6.6 Solving Problems Using Quadratic Models 352<br />
<strong>Chapter</strong> <strong>Review</strong> 360<br />
<strong>Chapter</strong> Self-Test 363<br />
<strong>Chapter</strong> Task 364<br />
<strong>Chapter</strong>s 4–6 Cumulative <strong>Review</strong> 365<br />
<strong>Chapter</strong> 7: Similar Triangles<br />
and Trigonometry 368<br />
Getting Started 370<br />
7.1 Congruence and Similarity in Triangles 374<br />
7.2 Solving Similar Triangle Problems 382<br />
Mid-<strong>Chapter</strong> <strong>Review</strong> 389<br />
7.3 Exploring Similar Right Triangles 391<br />
7.4 The Primary Trigonometric Ratios 394<br />
7.5 Solving Right Triangles 400<br />
Curious Math 407<br />
7.6 Solving Right Triangle Problems 408<br />
<strong>Chapter</strong> <strong>Review</strong> 415<br />
<strong>Chapter</strong> Self-Test 418<br />
<strong>Chapter</strong> Task 419<br />
<strong>Chapter</strong> 8: Acute Triangle<br />
Trigonometry 420<br />
Getting Started 422<br />
8.1 Exploring the Sine Law 426<br />
8.2 Applying the Sine Law 428<br />
Mid-<strong>Chapter</strong> <strong>Review</strong> 435<br />
8.3 Exploring the Cosine Law 437<br />
Curious Math 439<br />
8.4 Applying the Cosine Law 440<br />
8.5 Solving Problems Using Acute Triangles 446<br />
<strong>Chapter</strong> <strong>Review</strong> 452<br />
<strong>Chapter</strong> Self-Test 454<br />
<strong>Chapter</strong> Task 455<br />
<strong>Chapter</strong>s 7–8 Cumulative <strong>Review</strong> 456<br />
Appendix A:<br />
REVIEW OF ESSENTIAL SKILLS AND KNOWLEDGE 459<br />
Appendix B:<br />
REVIEW OF TECHNICAL SKILLS 486<br />
Glossary 518<br />
Answers 525<br />
Index 584<br />
Credits 588<br />
NEL<br />
Draft Evaluation Copy<br />
Table of Contents<br />
v
244<br />
NEL
<strong>Chapter</strong><br />
5<br />
Applying<br />
Quadratic<br />
Models<br />
GOALS<br />
You will be able to<br />
• Investigate the y a(x h) 2 k form of<br />
a quadratic relation<br />
• Apply transformations to sketch graphs<br />
of quadratic relations<br />
• Apply quadratic models to solve<br />
problems<br />
• Investigate connections among the<br />
different forms of a quadratic relation<br />
<br />
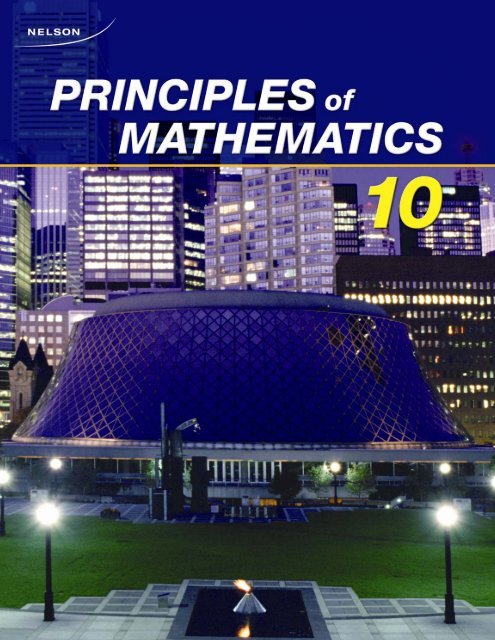
An arch is a structure that spans<br />
a distance and supports weight.<br />
The ancient Romans were the first<br />
people to use semicircular arches<br />
in a wide range of structures.<br />
The arches in this bridge are the<br />
strongest type.<br />
What characteristics of these arches<br />
suggest that they are parabolas<br />
NEL 245
5 Getting Started<br />
Study<br />
a) transformation<br />
b) translation<br />
c) reflection<br />
d) parabola<br />
e) vertex<br />
f) factored form of a<br />
quadratic relation<br />
Aid<br />
• For more help and practice,<br />
see Appendix A-13.<br />
6<br />
4<br />
y<br />
C<br />
2<br />
A B x<br />
-4<br />
0<br />
-2<br />
-2<br />
2 4 6<br />
-4<br />
y<br />
6<br />
C<br />
4<br />
C′<br />
2 A′ B′<br />
A B x<br />
-4<br />
0<br />
-2 A″<br />
-2<br />
B″ 4 6<br />
-4 C″<br />
WORDS YOU NEED to Know<br />
1. Match each term at the left with the correct description or example.<br />
i) a point that relates to the maximum or minimum value<br />
of a quadratic relation<br />
ii) the result of moving or changing the size of a shape according to a rule<br />
iii) the result of sliding each point on a shape the same distance<br />
in the same direction<br />
iv) y = a(x - r)(x - s)<br />
v) the result of flipping a shape to produce a mirror image of the shape<br />
vi) the graph of a quadratic relation<br />
SKILLS AND CONCEPTS You Need<br />
Working with Transformations<br />
Translations, reflections, rotations, and dilatations are types of<br />
transformations. They can be applied to a point, a line, or a shape.<br />
EXAMPLE<br />
Apply the following transformations to ^ ABC shown at the left.<br />
a) Translate ^ ABC 3 units right and 2 units up.<br />
b) Reflect ^ ABC in the x-axis.<br />
Solution<br />
Apply the same translation and the same reflection to points A, B, and C.<br />
Plot the image points, and draw each image triangle.<br />
a)<br />
Original Point Image Point<br />
b)<br />
A(0, 1) A¿ (3, 3)<br />
B(2, 1) B¿ (5, 3)<br />
C(2, 4) C¿ (5, 6)<br />
2. a) In the diagram at the right, is figure B,<br />
figure C, or figure D the result of a<br />
translation of figure A Explain.<br />
b) Which figure is the result of a<br />
reflection of figure A in the x-axis<br />
Explain.<br />
c) Which figure is the result of a<br />
reflection of figure A in the y-axis<br />
Explain.<br />
Original Point<br />
B<br />
2<br />
0<br />
-4 -2<br />
-2<br />
-4<br />
C<br />
Image Point<br />
A(0, 1) A– (0, 1)<br />
B(2, 1) B– (2, 1)<br />
C(2, 4) C– (2, 4)<br />
y<br />
A<br />
D<br />
4<br />
x<br />
246 Getting Started<br />
Draft Evaluation Copy<br />
NEL
Getting Started<br />
Understanding Quadratic Relations<br />
A quadratic relation can be expressed algebraically as an equation in standard<br />
form or factored form. You can determine information about its parabola from<br />
the equation of the relation.<br />
EXAMPLE<br />
Study<br />
Aid<br />
• For more help and<br />
practice, see Lesson 3.3,<br />
Examples 2 to 4.<br />
Determine the properties of the relation defined by the equation<br />
y = (x - 2)(x - 4). Then sketch the graph of the relation.<br />
Solution<br />
The equation y = (x - 2)(x - 4) is the equation of a quadratic relation<br />
in factored form.<br />
The values x = 2 and x = 4 make the factors (x - 2) and (x - 4) equal<br />
to zero. These are called the zeros of the relation and are the x-intercepts<br />
of the graph.<br />
The axis of symmetry is the perpendicular bisector of the line segment<br />
that joins the zeros. Its equation is x = 2 + 4 or x = 3.<br />
2<br />
The vertex of the parabola lies on the axis of symmetry. To determine the<br />
y-coordinate of the vertex, substitute x = 3 into the equation and evaluate.<br />
y = (3 - 2)(3 - 4)<br />
y = (1)(-1)<br />
y = -1<br />
The vertex is (3, -1).<br />
6<br />
4<br />
2<br />
0<br />
-2<br />
y<br />
y (x 2)(x 4)<br />
x 3<br />
2<br />
x-intercepts<br />
4 6 8<br />
vertex<br />
x<br />
3. Determine the value of y in each quadratic relation for each value of x.<br />
a) y = x 2 + 2x + 5, when x = -4<br />
b) y = x 2 - 3x - 28, when x = 7<br />
4. Determine the zeros, the equation of the axis of symmetry, and the<br />
vertex of each quadratic relation.<br />
a) y = (x + 5)(x - 3) b) y = 2(x - 4)(x + 1) c) y = -4x(x + 3)<br />
NEL Draft Evaluation Copy<br />
<strong>Chapter</strong> 5 247
Study<br />
8<br />
6<br />
Aid<br />
• For help, see the <strong>Review</strong> of<br />
Essential Skills and<br />
Knowledge Appendix.<br />
Question<br />
y<br />
Q<br />
Appendix<br />
5, 6 A-13<br />
R Q′<br />
P<br />
2<br />
R′<br />
P′ x<br />
0<br />
-2 Q″ 6 8<br />
-2<br />
R″<br />
-4 P″<br />
PRACTICE<br />
5. State the coordinates of the image point after applying the indicated<br />
transformation(s).<br />
a) A(3, 4) is translated 2 units left and 5 units up.<br />
b) B(1, 5) is translated 4 units right and 3 units down.<br />
c) C(2, 7) is translated 2 units left and 7 units up.<br />
d) D(3, 5) is reflected in the x-axis.<br />
6. Describe the transformation that was used to translate each triangle<br />
onto the image in the diagram at the left.<br />
a) ^PQR to ^P¿Q¿R¿<br />
b) ^PQR to ^P–Q–R–<br />
c) ^P¿Q¿R¿ to ^P–Q–R–<br />
7. State the zeros, equation of the axis of symmetry, and the vertex<br />
of each quadratic relation.<br />
a) y b)<br />
y<br />
4<br />
4<br />
-4<br />
2<br />
x<br />
0<br />
-2 2 4<br />
-2<br />
-4<br />
-6<br />
-8<br />
-10<br />
-6<br />
2<br />
x<br />
0<br />
-4 -2 2<br />
-2<br />
-4<br />
-6<br />
-8<br />
-10<br />
8. Express each quadratic relation in standard form.<br />
a) y = (x + 4)(x + 5) c) y = -3(x - 4)(x + 7)<br />
b) y = (2x - 3)(x + 2) d) y = (x + 5) 2<br />
9. Sketch the graph of each quadratic relation in question 8.<br />
10. Express y = 2x 2 - 4x - 48 in factored form. Then determine<br />
its minimum value.<br />
11. Copy and complete the chart to show what you know about quadratic<br />
relations. Share your chart with a classmate.<br />
Definition:<br />
Special Properties:<br />
Examples:<br />
Quadratic<br />
Relation<br />
Non-examples:<br />
248 Getting Started<br />
Draft Evaluation Copy<br />
NEL
APPLYING What You Know<br />
Tiling Transformers<br />
Jesse and Tyler decided to have a competition to see who could transform the<br />
figures from the Start grid to the End grid in the fewest number of moves.<br />
Start<br />
End<br />
y<br />
y<br />
8<br />
6<br />
4<br />
Getting Started<br />
YOU WILL NEED<br />
• grid paper<br />
• ruler<br />
• coloured pencils or markers<br />
• scissors<br />
-8<br />
-6<br />
-4<br />
4<br />
0<br />
-2<br />
-2<br />
x<br />
2<br />
-8<br />
-6<br />
-4<br />
-4<br />
0<br />
4 6 8<br />
x<br />
What is the fewest number of moves needed to transform<br />
these figures<br />
A. On a piece of grid paper, draw the five figures on the Start grid. Cut out<br />
each figure.<br />
B. Draw x- and y-axes on another piece of grid paper. Label each axis<br />
from 10 to 10.<br />
C. Put the yellow figure on the grid paper in the position shown<br />
on the Start grid.<br />
D. Apply one or more transformations to move the yellow figure to the<br />
position shown on the End grid.<br />
E. Make a table like the one below. Record the transformation(s) that you<br />
used to move the yellow figure for part D.<br />
Move<br />
Figure<br />
Original<br />
Coordinates<br />
Player 1<br />
Transformation<br />
New<br />
Coordinates<br />
B(–3, 7)<br />
8<br />
y<br />
6<br />
4<br />
A(–6, 4) 2<br />
0<br />
-8 -6 -4 -2 2<br />
A′(–1, –2)<br />
-4<br />
B′(2, 1)<br />
x<br />
4<br />
1<br />
yellow<br />
A(–6, 4), B(–3, 7)<br />
translation<br />
5 units right,<br />
6 units down<br />
A(–1, –2), B(2, 1)<br />
2<br />
F. Repeat parts C to E for another figure. (The second figure can move<br />
across the first figure if necessary.)<br />
G. Continue transforming figures and recording results until you have<br />
created the design shown on the End grid.<br />
H. How many moves did you need Compare your results with those of<br />
other classmates. What is the fewest number of moves needed<br />
NEL<br />
Draft Evaluation Copy<br />
<strong>Chapter</strong> 5 249
5.1<br />
Stretching/Reflecting<br />
Quadratic Relations<br />
YOU WILL NEED<br />
• graphing calculator<br />
• dynamic geometry software<br />
(optional)<br />
• grid paper<br />
• ruler<br />
GOAL<br />
Examine the effect of the parameter a in the equation<br />
y ax 2 on the graph of the equation.<br />
INVESTIGATE the Math<br />
Suzanne’s mother checks the family’s investments regularly. When Suzanne<br />
saw the stock chart that her mother was checking, she noticed trends in<br />
sections of the graph. These trends looked like the shapes of the parabolas<br />
she had been studying. Each “parabola” was a different shape.<br />
As of 10-Jun-09<br />
80.00<br />
Canadian Dollars<br />
75.00<br />
70.00<br />
65.00<br />
60.00<br />
<br />
What is the relationship between the value of a in the equation<br />
y ax 2 and the shape of the graph of the relation<br />
A. Enter y = x 2 as Y1 in the equation editor of a graphing calculator.<br />
Tech<br />
Support<br />
For help graphing relations and<br />
adjusting the window settings,<br />
see Appendix B-2 and B-4.<br />
B. The window settings shown are “friendly”<br />
because they allow you to trace using<br />
intervals of 0.1. Graph the parabola using<br />
these settings.<br />
C. Enter y = 2x 2 in Y2 and y = 5x 2 in Y3,<br />
and graph these quadratic relations. What<br />
appears to be happening to the shape of the<br />
graph as the value of a increases<br />
250 5.1 Stretching/Reflecting Quadratic Relations<br />
Draft Evaluation Copy<br />
NEL
D. Where would you expect the graph of y = 3x 2 to appear, relative to<br />
the other three graphs Check by entering y = 3x 2 into Y4 and graph<br />
with a bold line. Was your conjecture correct<br />
E. Where would you expect the graphs of y = 1 and y = 1 to<br />
4 x 2<br />
2 x 2<br />
appear, relative to the graph of y = x 2 Clear the equations from Y2,<br />
Y3, and Y4. Enter y = 1 into Y2 and y = 1 into Y3, and graph<br />
4 x 2<br />
2 x 2<br />
these quadratic relations. Describe the effect of the parameter a on the<br />
parabola when 0 a 1.<br />
F. Where you would expect the graph of y = 3 to appear, relative to<br />
4 x 2<br />
the other three graphs Check by entering y = 3 into Y4 and graph<br />
4 x 2<br />
with a bold line.<br />
G. Clear the equations from Y2, Y3, and Y4. Enter y = -4x 2 into Y2<br />
1<br />
and y = - into Y3, and graph these quadratic relations. Describe<br />
4 x 2<br />
the effect of a on the parabola when a 0.<br />
H. Ask a classmate to give you an equation in the form y = ax 2 , where<br />
a 0. Describe to your classmate what its graph would look like<br />
relative to the other three graphs. Verify your description by graphing<br />
the equation in Y4.<br />
I. How does changing the value of a in the equation y = ax 2 affect<br />
the shape of the graph<br />
Reflecting<br />
J. Which parabola in the stock chart has the greatest value of a Which<br />
has the least value of a Which parabolas have negative values of a<br />
Explain how you know.<br />
K. What happens to the x-coordinates of all the points on the graph<br />
of y = x 2 when the parameter a is changed in y = ax 2 What<br />
happens to the y-coordinates What happens to the shape of the<br />
parabola near its vertex<br />
L. State the ranges of values of a that will cause the graph of y = x 2 to be<br />
i) vertically stretched<br />
ii) vertically compressed<br />
iii)reflected across the x-axis<br />
Tech<br />
Support<br />
5.1<br />
Move the cursor to the left of<br />
ENTER<br />
Y4. Press = to change the<br />
line style to bold.<br />
parameter<br />
a coefficient that can be<br />
changed in a relation; for<br />
example, a, b, and c are<br />
parameters in y ax 2 bx c<br />
vertical stretch<br />
a transformation that increases<br />
all the y-coordinates of a<br />
relation by the same factor<br />
vertical compression<br />
a transformation that decreases<br />
all the y-coordinates of a<br />
relation by the same factor<br />
NEL Draft Evaluation Copy<br />
<strong>Chapter</strong> 5 251
APPLY the Math<br />
EXAMPLE 1<br />
Selecting a transformation strategy<br />
to graph a parabola<br />
a) Sketch the graph of the equation y = 3x 2 by transforming the graph<br />
of y = x 2 .<br />
b) Describe how the graphs of y = 3x 2 and y = -3x 2 are related.<br />
Zack’s Solution<br />
a)<br />
x 2 1 0 1 2<br />
y 4 1 0 1 4<br />
I created a table of values to<br />
determine five points on the<br />
graph of y x 2 .<br />
12<br />
y<br />
y x 2<br />
10<br />
8<br />
6<br />
4<br />
2<br />
x<br />
-8 -6 -4<br />
0<br />
-2<br />
-2<br />
2 4 6 8<br />
-4<br />
x 2 1 0 1 2<br />
y 12 3 0 3 12<br />
I plotted the points on a grid and<br />
joined them with a smooth curve.<br />
I can use these five points any<br />
time I want to sketch the graph<br />
of y x 2 because they include<br />
the vertex and two points on<br />
each side of the parabola.<br />
I decided to call this my five-point<br />
sketch.<br />
To transform my graph into<br />
a graph of y 3x 2 , I multiplied<br />
the y-coordinates of each point on<br />
y x 2 by 3. For example,<br />
y x 2 12<br />
y<br />
10 (2, 12)<br />
y 3x 2<br />
8<br />
6<br />
4 (2, 4)<br />
2<br />
-8 -6 -4<br />
0<br />
-2<br />
-2<br />
2 4 6<br />
-4<br />
x<br />
8<br />
(2, 4) (2, 12)<br />
4 3<br />
I plotted and joined my new<br />
points to get the graph of<br />
y 3x 2 . a 3 represents a<br />
vertical stretch by a factor of 3.<br />
This means that the y-coordinates<br />
of the points on the graph of<br />
y 3x 2 will become greater<br />
faster, so the parabola will be<br />
narrower near its vertex compared<br />
to the graph of y x 2 .<br />
252 5.1 Stretching/Reflecting Quadratic Relations Draft Evaluation Copy<br />
NEL
)<br />
x 2 1 0 1 2<br />
y 12 3 0 3 12<br />
12<br />
10<br />
8<br />
y<br />
6<br />
4<br />
2<br />
y 3x 2 x<br />
-4<br />
0<br />
-2<br />
-2<br />
2 4<br />
-4<br />
y 3x 2<br />
-6<br />
-8<br />
-10<br />
-12<br />
(2, -12)<br />
The graph of y = -3x 2 is<br />
the reflection of the graph of<br />
y = 3x 2 in the x-axis.<br />
To get the graph of y 3x 2 ,<br />
I multiplied the y-coordinates of<br />
all the points on the graph of<br />
y 3x 2 by 1. For example,<br />
(2,12) (2,12)<br />
12 (1)<br />
a 3 represents a vertical<br />
stretch by a factor of 3 and a<br />
reflection in the x-axis. This means<br />
that all the points on the graph of<br />
y 3x 2 are reflected in the x-axis.<br />
5.1<br />
EXAMPLE 2<br />
Determining the value of a from a graph<br />
Determine an equation of a quadratic relation that models the arch<br />
of San Francisco’s Bay Bridge in the photograph below.<br />
NEL Draft Evaluation Copy<br />
<strong>Chapter</strong> 5 253
Mary’s Solution: Representing the picture on a hand-drawn grid<br />
2<br />
-3 5<br />
-2<br />
I located a point on the graph and estimated<br />
the coordinates of the point to be (5, 1).<br />
y = ax 2<br />
1 = a(5) 2<br />
1 = 25a<br />
1<br />
25 = 25a<br />
25<br />
1<br />
25 = a<br />
An equation that models the arch of the bridge<br />
is y = 1 .<br />
25 x 2<br />
I used a photocopy of the photograph. I laid<br />
a transparent grid with axes on top of the<br />
photocopy.<br />
I placed the origin at the vertex of the arch. I did<br />
this since all parabolas defined by y ax 2 have<br />
their vertex at (0, 0).<br />
The equation of the graph is in the form y ax 2 .<br />
To determine the value of a, I had to determine the<br />
coordinates of a point on the parabola. I chose the<br />
point (5, 1). I substituted x 5 and y 1 into the<br />
equation and solved for a.<br />
The graph that models the arch is a vertical<br />
compression of the graph of y x 2 by a factor<br />
1<br />
of .<br />
25<br />
Sandeep’s Solution: Selecting dynamic geometry software<br />
4<br />
2<br />
-3 5<br />
-2<br />
-4<br />
I imported the photograph into dynamic geometry<br />
software. I superimposed a grid over the<br />
photograph. Then I adjusted the grid so that the<br />
origin was at the vertex of the bridge’s parabolic<br />
arch. I need to create a graph using the relation<br />
y = ax 2 by choosing a value for the parameter a.<br />
Support<br />
Tech<br />
For help creating and graphing<br />
relations using parameters in<br />
dynamic geometry software,<br />
as well as animating the<br />
parameter, see Appendix B-17.<br />
254 5.1 Stretching/Reflecting Quadratic Relations Draft Evaluation Copy<br />
NEL
5.1<br />
a<br />
f(x) = •x 2<br />
= 1.00<br />
a<br />
4<br />
2<br />
-3 5<br />
-2<br />
-4<br />
When I used a 1, the graph of y = x 2 appeared.<br />
The parabola was too narrow. It had to be vertically<br />
compressed to fit the arch. To do this, I needed<br />
a lower value of a, between 0 and 1. I needed<br />
a positive value because the arch opens upward.<br />
a<br />
f(x) = •x 2<br />
= 0.04<br />
a<br />
4<br />
2<br />
-3 5<br />
-2<br />
-4<br />
I tried a 0.5, but the parabola was not wide<br />
enough.<br />
I tried a 0.1. This value gave me a better fit.<br />
I still wasn’t satisfied, so I tried different values of a<br />
between 0 and 0.1. I found that a 0.04 gave me<br />
a good fit.<br />
An equation that models the bridge is y = 0.04x 2 .<br />
Vertically compressing the graph of y = x 2 by a factor<br />
of 0.04 creates a graph that fits the photograph.<br />
In Summary<br />
Key Idea<br />
• When compared with the graph of y x 2 , the graph of y ax 2 is<br />
a parabola that has been stretched or compressed vertically by a factor of a.<br />
Need to Know<br />
• Vertical stretches are determined by the value of a. When a 1, the<br />
graph is stretched vertically. When a 1, the graph is stretched<br />
vertically and reflected across the x-axis.<br />
• Vertical compressions are also determined by the value of a. When<br />
0 a 1, the graph is compressed vertically. When 1 a 0,<br />
the graph is compressed vertically and reflected across the x-axis.<br />
• If a 0, the parabola opens upward.<br />
• If a 0, the parabola opens downward.<br />
y x 2<br />
y ax 2 ,<br />
a 1<br />
y<br />
y ax 2 ,<br />
0 a 1<br />
x<br />
y ax 2 ,<br />
1 a 0<br />
y ax 2 ,<br />
a 1<br />
NEL Draft Evaluation Copy<br />
<strong>Chapter</strong> 5 255
CHECK Your Understanding<br />
1. Match each graph with the correct equation. The graph of<br />
is in green in each diagram.<br />
a) c) y = 2 3 x 2<br />
b) y = -3x 2 d) y = -0.4x 2<br />
y = 4x 2 y = x 2 NEL<br />
i) y ii) y iii) y iv)<br />
10<br />
6<br />
6<br />
8<br />
6<br />
4<br />
2<br />
0<br />
-4 -2 2<br />
-2<br />
4<br />
x<br />
4<br />
y x 2 2<br />
x<br />
0<br />
-4 -2 2 4<br />
-2<br />
-4<br />
-6<br />
y x 2<br />
4<br />
2<br />
0<br />
-4 -2 2<br />
-2<br />
-4<br />
-6<br />
4<br />
x<br />
y x 2<br />
10<br />
8<br />
6<br />
4<br />
2<br />
y<br />
0<br />
-4 -2 2<br />
-2<br />
4<br />
x<br />
y x 2 2. The graph of is transformed to ( ). For each<br />
y = x 2<br />
y = ax 2 a Z 1<br />
point on y = x 2 , determine the coordinates of the transformed point<br />
for the indicated value of a.<br />
a) (1, 1) when a = 5 c) (5, 25) when a = -0.6<br />
b) (2, 4), when a = -3 d) (4, 16) when a = 1 2<br />
3. Write the equations of two different quadratic relations that match<br />
each description.<br />
a) The graph is narrower than the graph of y = x 2 near its vertex.<br />
b) The graph is wider than the graph of y = -x 2 near its vertex.<br />
c) The graph opens downward and is narrower than the graph<br />
of y = 3x 2 near its vertex.<br />
PRACTISING<br />
y = 3x 2 y = 1 4 x 2<br />
4. Sketch the graph of each equation by applying a transformation<br />
K to the graph of y = x 2 . Use a separate grid for each equation, and<br />
a) d)<br />
start by sketching the graph of y = x 2 .<br />
b) y = -0.5x 2 e) y = - 3 2 x 2<br />
c) y = -2x 2 f) y = 5x 2<br />
256 5.1 Stretching/Reflecting Quadratic Relations Draft Evaluation Copy
5. Describe the transformation(s) that were applied to the graph of y = x 2<br />
to obtain each black graph. Write the equation of the black graph.<br />
a)<br />
14<br />
y<br />
c)<br />
12<br />
10<br />
8<br />
6<br />
4<br />
2<br />
0<br />
-8 -6 -4 -2 2<br />
4 6 8<br />
x<br />
y<br />
y x 2 4<br />
2<br />
-8 -6 -4<br />
0<br />
-2<br />
-2<br />
2<br />
-4<br />
-6<br />
-8<br />
-10<br />
4 6 8<br />
x<br />
5.1<br />
y x 2 y x 2<br />
b) y<br />
d)<br />
8<br />
y x 2<br />
6<br />
4<br />
2<br />
-8 -6 -4<br />
0<br />
-2<br />
-2<br />
2<br />
-4<br />
-6<br />
4 6 8<br />
x<br />
y x 2<br />
10<br />
0<br />
-8 -6 -4 -2 2<br />
-2<br />
8<br />
6<br />
4<br />
2<br />
-4<br />
y<br />
4 6 8<br />
x<br />
6. Andy modelled the arch of the bridge in the photograph at the right<br />
C by tracing a parabola onto a grid. Now he wants to determine the<br />
equation of the parabola. Explain the steps he should use to do this,<br />
and state the equation.<br />
7. Determine the equation of a quadratic model for each natural arch.<br />
y<br />
-4 -2<br />
0<br />
2<br />
-2<br />
4 6<br />
x<br />
-6 -4 -2<br />
-2<br />
0<br />
y<br />
2 4<br />
x<br />
y<br />
2<br />
-4 -2<br />
0<br />
2 4<br />
-2<br />
-4<br />
x<br />
-4<br />
-6<br />
a) Lover’s Arch on the Isle of<br />
Capri in Italy<br />
-4<br />
-6<br />
b) Jett Arch in Arizona<br />
NEL Draft Evaluation Copy<br />
<strong>Chapter</strong> 5 257
8. Identify the transformation(s) that must be applied to the graph<br />
of y = x 2 to create a graph of each equation. Then state the<br />
coordinates of the image of the point (2, 4).<br />
a) y = 4x 2 c) y = 0.25x 2 e) y = -x 2<br />
2<br />
b) y = -<br />
d) y = -5x 2 f) y = 1 5 x 2<br />
3 x 2<br />
9. By tracing the bridge at the left onto a grid, determine an equation that<br />
A models the lower outline of the Sydney Harbour Bridge in Australia.<br />
10. Seth claims that changing the value of a in quadratic relations of the<br />
T form y = ax 2 will never result in a parabola that is congruent to the<br />
parabola y = x 2 . Do you agree or disagree Justify your decision.<br />
11. Copy and complete the following table.<br />
Direction Description of Shape of Graph<br />
of Opening Transformation Compared with<br />
(upward/ (stretch/ Graph of y x 2<br />
Equation downward) compress) (wider/narrower)<br />
y = 5x 2<br />
y = 0.25x 2<br />
y = -<br />
1<br />
3 x 2<br />
y = -8x 2<br />
12. Explain why it makes sense that each statement about the graph<br />
of y = ax 2 is true.<br />
a) If a 0, then the parabola opens downward.<br />
b) If a is a rational number between 1 and 1, then the parabola<br />
is wider than the graph of y = x 2 .<br />
c) The vertex is always (0, 0).<br />
Extending<br />
13. The graph of y = ax 2 (a Z 1, a 0) is either a vertical stretch or<br />
a vertical compression of the graph of y = x 2 . Use graphing technology<br />
to determine whether changing the value of a has a similar effect on the<br />
graphs of equations such as y = ax, y = ax 3 , y = ax 4 , and .<br />
14. The equation of a circle with radius r and centre (0, 0) is<br />
.<br />
a) Explore the effect of changing positive values of a when graphing<br />
ax 2 + ay 2 = r 2 .<br />
b) Explore the effects of changing positive values of a and b when<br />
graphing ax 2 + by 2 = r 2 .<br />
x 2 + y 2 = r 2 y = ax 1 2<br />
258 5.1 Stretching/Reflecting Quadratic Relations Draft Evaluation Copy<br />
NEL
5.2<br />
Exploring Translations<br />
of Quadratic Relations<br />
GOAL<br />
Investigate the roles of h and k in the graphs of y x 2 k,<br />
y (x h) 2 , and y (x h) 2 k.<br />
YOU WILL NEED<br />
• grid paper<br />
• ruler<br />
• graphing calculator<br />
EXPLORE the Math<br />
Hammad has been asked to paint<br />
a mural of overlapping parabolas on<br />
a wall in his school. A sketch of his<br />
final design is shown at the right.<br />
He is using his graphing calculator<br />
to try to duplicate his design. His<br />
design uses parabolas that have the<br />
same shape as y = x 2 , but he<br />
doesn’t know what equations he<br />
should enter into his graphing<br />
calculator to place the parabolas in<br />
different locations on the screen.<br />
8<br />
6<br />
4<br />
-8 -6 -4<br />
2<br />
0<br />
-2<br />
-2<br />
-4<br />
-6<br />
-8<br />
2 4 6 8<br />
x<br />
<br />
What is the connection between the location of the vertex<br />
of a parabola and the equation of its quadratic relation<br />
A. Enter the equation y = x 2 as Y1 in the<br />
equation editor of a graphing calculator.<br />
Graph the equation using the window<br />
settings shown.<br />
B. Enter an equation of the form y = x 2 + k<br />
in Y2 by adding or subtracting a number after the x 2 term. For example,<br />
y = x 2 + 1 or y = x 2 - 3. Graph your equation, and compare<br />
the graph with the graph of y = x 2 . Try several other equations,<br />
replacing the one you have in Y2 each time. Be sure to change<br />
the number you add or subtract after the x 2 term.<br />
C. Copy this table. Use the table to record your findings for part B.<br />
Tech<br />
Support<br />
For help graphing relations,<br />
changing window settings,<br />
and tracing along a graph, see<br />
Appendix B-2 and B-4.<br />
Tech<br />
Support<br />
Use the TRACE key and<br />
the up arrow to help<br />
you distinguish<br />
^one graph<br />
from another.<br />
Value of k Equation Distance and Direction from y x 2 Vertex<br />
0 y x 2 not applicable (0, 0)<br />
NEL Draft Evaluation Copy<br />
<strong>Chapter</strong> 5 259
D. Investigate what happens to the graph of y = x 2 when a number is<br />
added to or subtracted from the value of x before it is squared, creating<br />
an equation of the form y = (x - h) 2 . For example, y = (x + 1) 2 or<br />
y = (x - 2) 2 . Graph your new equations in Y2 each time using<br />
a graphing calculator. Then copy this table and record your findings.<br />
Value of h<br />
Equation<br />
Distance and Direction from y x 2<br />
Vertex<br />
0 y x 2 not applicable (0, 0)<br />
E. Identify the type of transformations that have been applied to the<br />
graph of y = x 2 to obtain the graphs in your table for part C and<br />
your table for part D.<br />
F. Make a conjecture about how you could predict the equation of a parabola<br />
if you knew the translations that were applied to the graph of y = x 2 .<br />
G. Copy and complete this table to investigate and test your conjecture<br />
for part F.<br />
Value Value Relationship to y x 2<br />
of h of k Equation Left/Right Up/Down Vertex<br />
0 0 y = x 2<br />
not applicable not applicable (0, 0)<br />
left 3 down 5<br />
4 1<br />
y = (x - 4) 2 + 1<br />
(2, 6)<br />
y = (x + 5) 2 - 3<br />
H. Use what you have discovered to identify the equations that Hammad<br />
should type into his calculator to graph the parabolas in the mural design.<br />
I. If the equation of a quadratic relation is given in the form<br />
y = (x - h) 2 + k, what can you conclude about its vertex<br />
Reflecting<br />
J. Describe how changing the value of k in y = x 2 + k affects<br />
i) the graph of y = x 2<br />
ii) the coordinates of each point on the parabola y = x 2<br />
iii) the parabola’s vertex and axis of symmetry<br />
K. Describe how changing the value of h in y = (x - h) 2 affects<br />
i) the graph of y = x 2<br />
ii) the coordinates of each point on the parabola y = x 2<br />
iii) the parabola’s vertex and axis of symmetry<br />
260 5.2 Exploring Translations of Quadratic Relations Draft Evaluation Copy<br />
NEL
L. For parabolas defined by y = (x - h) 2 + k,<br />
i) how do their shapes compare to the parabola defined by y = x 2 <br />
ii) what is the equation of the axis of symmetry<br />
iii) what are the coordinates of the vertex<br />
5.2<br />
In Summary<br />
Key Ideas<br />
• The graph of y = (x - h) 2 + k is congruent to the graph of y = x 2 , but<br />
translated horizontally and vertically.<br />
• Translations can also be described as shifts. Vertical shifts are up or<br />
down, and horizontal shifts are left or right.<br />
Need to Know<br />
• The value of h tells how far and in what<br />
direction the parabola is translated<br />
horizontally. If h 6 0, the parabola is<br />
translated h units left. If h 7 0, the<br />
parabola is translated h units right.<br />
• The vertex of y = (x - h) 2 is the point (h, 0).<br />
• The equation of the axis of symmetry of<br />
y = (x - h) 2 is x = h.<br />
y (x h) 2 h 0<br />
y<br />
h 0 h 0<br />
x<br />
• The value of k tells how far and in what<br />
direction the parabola is translated vertically.<br />
If k 6 0, the parabola is translated k units<br />
down. If k 7 0, the parabola is translated<br />
k units up.<br />
• The vertex of y = x 2 + k is the point (0, k).<br />
• The equation of the axis of symmetry of<br />
y = x 2 + k is x = 0.<br />
y x 2 k<br />
y<br />
k 0<br />
k 0<br />
k 0<br />
x<br />
• The vertex of y = (x - h) 2 + k is the<br />
point (h, k).<br />
• The equation of the axis of symmetry<br />
of y = (x - h) 2 + k is x = h.<br />
y x 2<br />
y (x h) 2 k<br />
y<br />
x h<br />
(h, k)<br />
x<br />
NEL Draft Evaluation Copy<br />
<strong>Chapter</strong> 5 261
i)<br />
FURTHER Your Understanding<br />
2<br />
x<br />
0<br />
-8 -6 -4 -2 2<br />
-2<br />
1. The following transformations are applied to a parabola with<br />
the equation y = x 2 . Determine the values of h and k, and write<br />
the equation in the form y = (x - h) 2 + k.<br />
a) The parabola moves 3 units right.<br />
b) The parabola moves 4 units down.<br />
c) The parabola moves 2 units left.<br />
d) The parabola moves 5 units up.<br />
e) The parabola moves 7 units down and 6 units left.<br />
f) The parabola moves 2 units right and 5 units up.<br />
2. Match each equation with the correct graph.<br />
a) y = (x - 2) 2 + 3 c) y = (x + 3) 2 - 2<br />
b) y = (x + 2) 2 - 3 d) y = (x - 3) 2 + 2<br />
8<br />
6<br />
4<br />
y<br />
iii)<br />
8<br />
6<br />
4<br />
y<br />
2<br />
x<br />
0<br />
-4 -2 2 4 6<br />
-2<br />
v)<br />
2<br />
x<br />
0<br />
-8 -6 -4 -2 2<br />
-2<br />
6<br />
4<br />
-4<br />
y<br />
ii)<br />
6<br />
y<br />
iv)<br />
8<br />
y<br />
vi)<br />
6<br />
y<br />
4<br />
6<br />
4<br />
2<br />
x<br />
-8 -6 -4<br />
0<br />
-2<br />
-2<br />
2<br />
-4<br />
4<br />
2<br />
x<br />
0<br />
-2 2 4 6 8<br />
-2<br />
2<br />
x<br />
-4<br />
0<br />
-2<br />
-2<br />
2 4 6<br />
-4<br />
3. Sketch the graph of each relation by hand. Start with the graph<br />
of y = x 2 , and apply the appropriate transformations.<br />
a) y = x 2 - 4 c) y = x 2 + 2 e) y = (x + 1) 2 - 2<br />
b) y = (x - 3) 2 d) y = (x + 5) 2 f) y = (x - 5) 2 + 3<br />
4. Describe the transformations that are applied to the graph of<br />
to obtain the graph of each quadratic relation.<br />
y = x 2<br />
b) y = (x - 3) 2 d) y = (x + 7) 2 f) y = (x + 6) 2 + 12<br />
a) y = x 2 + 5 c) y = -3x 2 e) y = 1 2 x 2<br />
5. State the vertex and the axis of symmetry of each parabola in question 4.<br />
262 5.2 Exploring Translations of Quadratic Relations Draft Evaluation Copy<br />
NEL
5.3<br />
GOAL<br />
y x 2<br />
8<br />
6<br />
4<br />
2<br />
y<br />
0<br />
-4 -2 2 4<br />
-2<br />
-4<br />
Graphing Quadratics<br />
in Vertex Form<br />
y = a(x - h) 2 + k by hand<br />
by hand. They know that they need to apply a series<br />
y = x 2<br />
Selecting a transformation strategy<br />
to graph a quadratic relation<br />
y = 2(x - 3) 2 - 8<br />
I began by graphing y = x 2 using<br />
five key points. The quadratic<br />
relation y = 2(x - 3) 2 - 8 is<br />
expressed in vertex form.<br />
Since h 3, I added 3 to the<br />
x-coordinate of each point on<br />
y = x 2 . This means that the vertex<br />
is (3, 0).<br />
y (x 3) 2<br />
Graph a quadratic relation in the form<br />
and with graphing technology.<br />
LEARN ABOUT the Math<br />
Srinithi and Kevin are trying to sketch the graph of the quadratic relation<br />
y = 2(x - 3) 2 - 8<br />
of transformations to the graph of .<br />
<br />
How do you apply transformations to the quadratic relation<br />
y x 2 to sketch the graph of <br />
y = 2(x - 3) 2 - 8<br />
EXAMPLE 1<br />
Use transformations to sketch the graph of .<br />
Srinithi’s Solution: Applying a horizontal translation first<br />
y = x 2<br />
x 2 1 0 1 2<br />
y 4 1 0 1 4<br />
y = (x - 3) 2<br />
x 1 2 3 4 5<br />
y 4 1 0 1 4<br />
6<br />
x<br />
The equation of the new red<br />
graph is y = (x - 3) 2 . To draw it,<br />
I translated the green parabola<br />
3 units right.<br />
YOU WILL NEED<br />
• grid paper<br />
• ruler<br />
• graphing calculator<br />
vertex form<br />
a quadratic relation of the form<br />
y = a(x - h) 2 + k, where the<br />
vertex is (h, k)<br />
NEL Draft Evaluation Copy<br />
<strong>Chapter</strong> 5 263
Since I multiplied all the<br />
y = 2(x - 3) 2<br />
a = 2, y x 2 6 y 2x 2 the graph of y = x 2 vertically by<br />
x 1 2 3 4 5<br />
y-coordinates of the points on the<br />
red graph by 2. The vertex stays at<br />
y 8 2 0 2 8<br />
(3, 0). The equation of this graph<br />
is y = 2(x - 3) 2 .<br />
y 2(x 3) 2 y (x 3) 2<br />
y<br />
To draw this new blue graph,<br />
8<br />
I applied a vertical stretch by<br />
6<br />
a factor of 2 to the red graph.<br />
4<br />
The blue graph looks correct<br />
because the graph with the<br />
2<br />
greater a value should be<br />
x<br />
0<br />
narrower than the other graph.<br />
-4 -2 2 4 6<br />
-2<br />
-4<br />
y = 2(x - 3) 2 - 8<br />
I knew that k = -8. I subtracted<br />
8 from the y-coordinate of each<br />
x 1 2 3 4 5<br />
point on the blue graph. The<br />
y 0 6 8 6 0<br />
vertex is now (3, 8). The<br />
equation of the graph is<br />
y = 2(x - 3) 2 - 8.<br />
y 2(x 3) 2 8<br />
y<br />
4<br />
y 2(x 3) 2<br />
2<br />
Since k 6 0, I knew that I had to<br />
x<br />
translate the blue graph 8 units<br />
-4<br />
0<br />
-2 2 4 6<br />
down to get the final black graph.<br />
-2<br />
-4<br />
-6<br />
-8<br />
Kevin’s Solution: Applying a vertical stretch first<br />
8<br />
4<br />
y<br />
Since a 2, I decided to stretch<br />
a factor of 2. I multiplied the<br />
2<br />
y-coordinate of each point on<br />
x<br />
the graph of y = x 2 by 2.<br />
-4<br />
0<br />
-2 2 4 6<br />
The equation of the resulting red<br />
-2<br />
graph is y = 2x 2 .<br />
-4<br />
264 5.3 Graphing Quadratics in Vertex Form Draft Evaluation Copy<br />
NEL
5.3<br />
y 2x 2 y 2(x 3) 2 8<br />
4<br />
2<br />
y<br />
0<br />
-4 -2 2 4<br />
-2<br />
6<br />
-4<br />
-6<br />
-8 (3, –8)<br />
x<br />
I applied both translations in one<br />
step. Adding 3 to the x-coordinate<br />
and subtracting 8 from the<br />
y-coordinate from each point on<br />
the red graph causes the red<br />
graph to move 3 units right<br />
and 8 units down.<br />
The equation of the resulting<br />
black graph is .<br />
y = 2(x - 3) 2 - 8<br />
Reflecting<br />
A. Why was it not necessary for Kevin to use two steps for the<br />
translations In other words, why did he not have to shift the graph<br />
to the right in one step, and then down in another step<br />
B. What are the advantages and disadvantages of each solution<br />
C. How can thinking about the order of operations applied to the<br />
coordinates of points on the graph of y = x 2 help you apply<br />
transformations to draw a new graph<br />
APPLY the Math<br />
EXAMPLE 2<br />
Reasoning about sketching the graph of a quadratic relation<br />
Sketch the graph of y = -3(x + 5) 2 + 1, and explain your reasoning.<br />
Winnie’s Solution: Connecting a sequence of transformations to the equation<br />
Applying a vertical stretch of factor 3 and a reflection<br />
in the x-axis gives the graph of y = -3x 2 .<br />
y<br />
y 3x 2 6<br />
y x 2<br />
4<br />
2<br />
x<br />
y 3x 2<br />
-6 -4<br />
0<br />
-2<br />
-2<br />
2 4<br />
-4<br />
-6<br />
6<br />
In the quadratic relation y = -3(x + 5) 2 + 1, the<br />
value of a is 3. This represents a vertical stretch<br />
by a factor of 3 and a reflection in the x-axis.<br />
I noticed that I can combine the stretch and<br />
reflection into a single step by multiplying each<br />
y-coordinate of points on y = x 2 by 3.<br />
NEL Draft Evaluation Copy<br />
<strong>Chapter</strong> 5 265
In the equation, h = -5 and k = 1. Therefore,<br />
the vertex is at (-5, 1) . I translated the blue<br />
graph 5 units left and 1 unit up.<br />
y<br />
6 y x 2<br />
4<br />
2<br />
x<br />
0<br />
-6 -4 -2 2 4 6<br />
-2<br />
-4<br />
-6<br />
y 3x 2<br />
y 3(x 5) 2 1<br />
I determined that the vertex is (5, 1). Then I<br />
shifted all the points on the graph of y = -3x 2 so<br />
that they were 5 units left and 1 unit up.<br />
I drew a smooth curve through the new points<br />
to sketch the graph.<br />
Beth’s Solution: Connecting the properties of a parabola to the equation<br />
Based on the equation y = -3(x + 5) 2 + 1,<br />
the parabola has these properties:<br />
• Since a 6 0, the parabola opens downward.<br />
• The vertex of the parabola is (5, 1).<br />
• The equation of the axis of symmetry is x = -5.<br />
y = -3(-3 + 5) 2 + 1<br />
y = -3(2) 2 + 1<br />
y = -12 + 1<br />
y = -11<br />
Therefore, (3, 11) is a point on the parabola.<br />
2<br />
y<br />
x<br />
-8 -6 -4<br />
0<br />
-2<br />
-2<br />
2 4 6 8<br />
-4<br />
-6<br />
-8<br />
-10<br />
-12<br />
x 5 -14<br />
y 3(x 5) 2 1<br />
Since the equation was given in vertex form, I listed<br />
the properties of the parabola that I could determine<br />
from the equation.<br />
To determine another point on the parabola, I let<br />
x 3.<br />
I plotted the vertex and the point I had determined,<br />
(3, 11). Then I drew the axis of symmetry. I<br />
used symmetry to determine the point directly<br />
across from (3, 11). This point is ( 7, 11).<br />
I plotted the points and joined them with<br />
a smooth curve.<br />
266 5.3 Graphing Quadratics in Vertex Form Draft Evaluation Copy<br />
NEL
EXAMPLE 3<br />
Reasoning about the effects of transformations on a quadratic relation<br />
For a high school charity event, the principal pays to drop a watermelon<br />
from a height of 100 m. The height, h, in metres, of the watermelon after<br />
t seconds is h = -0.5gt 2 + k, where g is the acceleration due to gravity<br />
and k is the height from which the watermelon is dropped.<br />
On Earth, g = 9.8 m/s 2 .<br />
a) The clock that times the fall of the watermelon runs for 3 s before the<br />
principal releases the watermelon. How does this change the graph<br />
shown Determine the equation of the new relation.<br />
b) On Mars, g = 3.7 m/s 2 . Suppose that an astronaut dropped<br />
a watermelon from a height of 100 m on Mars. Determine the<br />
equation for the height of the watermelon on Mars. How does the<br />
graph for Mars compare with the graph for Earth in part a)<br />
c) The principal drops another watermelon from a height of 50 m on Earth.<br />
How does the graph in part a) change How does the relation change<br />
d) Repeat part c) for an astronaut on Mars.<br />
100<br />
80<br />
60<br />
40<br />
20<br />
t<br />
0<br />
-10 10<br />
h<br />
h 4.9t 2 100<br />
5.3<br />
Nadia’s Solution<br />
a) The equation of the original relation is<br />
h = -0.5(9.8)t 2 + 100<br />
h = -4.9t 2 + 100, where t Ú 0<br />
The parabola is translated 3 units right.<br />
The equation of the new relation is<br />
h = -4.9(t - 3) 2 + 100, where t Ú 3.<br />
The original graph is a parabola that opens<br />
downward, with vertex (0, k) (0, 100).<br />
I wrote and simplified the original relation.<br />
I subtracted 3 from the t-coordinate to determine<br />
the new relation. Since the watermelon is not<br />
falling before 3 s, the relation only holds for t Ú 3.<br />
h<br />
100<br />
80<br />
60<br />
40<br />
20<br />
t<br />
0<br />
-10 10<br />
h 4.9(t 3) 2 100<br />
If the clock runs for 3 s before the watermelon is<br />
dropped, then the watermelon will be at its highest<br />
point at 3 s. So, the vertex of the new parabola is<br />
(3, 100), which is a shift of the original parabola 3<br />
units right.<br />
NEL Draft Evaluation Copy<br />
<strong>Chapter</strong> 5 267
) The equation of the relation on Mars is<br />
h = -0.5(3.7)t 2 + 100 I used the value of g on Mars, g = 3.7m/s 2 , instead<br />
h = -1.85t 2 + 100, where t Ú 0<br />
of g = 9.8 m/s 2 .<br />
The graph for Mars is wider near the vertex.<br />
100<br />
80<br />
60<br />
40<br />
20<br />
t<br />
0<br />
-10 10<br />
h<br />
h 1.85t 2 100<br />
The t-intercept is farther from the origin, so the<br />
watermelon would take longer to hit the ground<br />
on Mars compared to Earth.<br />
A smaller (negative) a-value means that<br />
the parabola is wider.<br />
c) The equation of the new relation is<br />
h = -4.9t 2 + 50, where t Ú 0.<br />
The new graph has the same shape but is<br />
translated 50 units down.<br />
60<br />
40<br />
20<br />
t<br />
0<br />
-10 10<br />
h<br />
h 4.9t 2 50<br />
d) The new graph for Mars is wider than the<br />
original graph and is translated 50 units down.<br />
h<br />
60<br />
40<br />
20<br />
t<br />
0<br />
-10 10<br />
h 1.85t 2 50<br />
In the relation, k changes from 100 to 50.<br />
The new vertex is half the distance above the<br />
origin, at (0, 50) instead of (0, 100). This is a shift<br />
of 50 units down.<br />
The new graph for Mars is wider than the original<br />
graph, like the graph in part b). It is translated<br />
down, like the graph in part c).<br />
268 5.3 Graphing Quadratics in Vertex Form Draft Evaluation Copy<br />
NEL
5.3<br />
In Summary<br />
Key Idea<br />
• Compared with the graph of y = x 2 , the graph of y = a(x - h) 2 + k is<br />
a parabola that has been stretched or compressed vertically by a factor<br />
of a, translated horizontally by h, and translated vertically by k. As well,<br />
if a 6 0, the parabola is reflected in the x-axis.<br />
Need to Know<br />
• The vertex of y = a(x - h) 2 + k has the coordinates (h, k). The equation<br />
of the axis of symmetry of y = a(x - h) 2 + k is x = h.<br />
• When sketching the graph of y = a(x - h) 2 + k as a transformation<br />
of the graph of y = x 2 , follow the order of operations for the<br />
arithmetic operations to be performed on the coordinates of each point.<br />
Apply vertical stretches/compressions and reflections, which involve<br />
multiplication, before translations, which involve addition or subtraction.<br />
y a(x h) 2 k<br />
y<br />
y x 2 y ax 2<br />
(h, k)<br />
x h<br />
x<br />
CHECK Your Understanding<br />
1. Describe the transformations you would apply to the graph of y = x 2 ,<br />
in the order you would apply them, to obtain the graph of each<br />
quadratic relation.<br />
a) y = x 2 - 3<br />
c)<br />
1<br />
y = -<br />
2 x 2<br />
b) y = (x + 5) 2 d) y = 4(x + 2) 2 - 16<br />
2. For each quadratic relation in question 1, identify<br />
i) the direction in which the parabola opens<br />
ii) the coordinates of the vertex<br />
iii) the equation of the axis of symmetry<br />
3. Sketch the graph of each quadratic relation. Start with a sketch of y = x 2 ,<br />
and then apply the appropriate transformations in the correct order.<br />
a) y = (x + 5) 2 - 4 c) y = 2(x - 3) 2<br />
b) y = -0.5x 2 + 8 d)<br />
y = 1 2 (x - 4)2 - 2<br />
PRACTISING<br />
4. What transformations would you apply to the graph of y = x 2<br />
to create the graph of each relation List the transformations<br />
in the order you would apply them.<br />
a) y = -x 2 + 9<br />
c) y = (x + 2) 2 - 1<br />
b) y = (x - 3) 2 d) y = -x 2 - 6<br />
NEL Draft Evaluation Copy<br />
<strong>Chapter</strong> 5 269
e) y = -2(x - 4) 2 + 16 g)<br />
y = -<br />
f) y = 1 h) y = 5(x - 4) 2 - 12<br />
2 (x + 6)2 + 12<br />
5. Sketch a graph of each quadratic relation in question 4 on a separate<br />
grid. Use the properties of the parabola and additional points as<br />
necessary.<br />
6. Match each equation with the correct graph.<br />
1<br />
2 (x + 4)2 - 7<br />
a) y = 1 2 (x - 2)2 - 5 d)<br />
b) y = 1 2 (x - 4)2 - 2 e)<br />
y = -2(x - 2) 2 - 5<br />
y = 4(x - 5) 2 - 2<br />
c) y = -2(x + 2) 2 + 5 f) y = 1 3 x 2 - 2<br />
i) y<br />
iii) y v) y<br />
8<br />
6<br />
6<br />
6<br />
4<br />
2<br />
x<br />
0<br />
-4 -2 2 4 6<br />
-2<br />
-4<br />
4<br />
2<br />
0<br />
-4 -2 2 4<br />
-2<br />
-4<br />
-6<br />
x<br />
4<br />
2<br />
x<br />
0<br />
-2 2 4 6 8<br />
-2<br />
-4<br />
-6<br />
ii)<br />
6<br />
y<br />
iv)<br />
6<br />
y vi)<br />
4<br />
4<br />
2<br />
2<br />
x<br />
x<br />
-4<br />
0<br />
0<br />
-2 2 4 6 -6 -4 -2<br />
-2<br />
-2<br />
2 4<br />
-4<br />
-6<br />
-4<br />
-6<br />
2<br />
y<br />
x<br />
-4<br />
0<br />
-2<br />
-2<br />
2 4 6<br />
-4<br />
-6<br />
-8<br />
-10<br />
7. Sketch the graph of each quadratic relation by hand. Start with<br />
a sketch of y = x 2 , and then apply the appropriate transformations<br />
in the correct order.<br />
a) y = -(x - 2) 2 d) y = 3 4 x 2 - 5<br />
b) y = 1 e)<br />
2 (x + 2)2 - 8<br />
y = 1 2 (x - 2)2 - 5<br />
c) y = -3(x - 1) 2 + 7 f) y = -1.5(x + 3) 2 + 10<br />
270 5.3 Graphing Quadratics in Vertex Form Draft Evaluation Copy<br />
NEL
8. Copy and complete the following table.<br />
5.3<br />
Stretch/<br />
Horizontal/<br />
Quadratic Compression Reflection Vertical Axis of<br />
Relation Factor in x-axis Translation Vertex Symmetry<br />
y = 4(x + 2) 2 - 3<br />
y = -(x - 1) 2 + 4<br />
y = 0.8(x - 6) 2<br />
y = 2x 2 - 5<br />
right 2,<br />
3 no down 5 (2, 5) x 2<br />
9. Determine the equations of three different parabolas with a vertex<br />
C at (2, 3). Describe how the graphs of the parabolas are different<br />
from each other. Then sketch the graphs of the three relations on<br />
the same set of axes.<br />
10. When an object with a parachute is released to fall freely, its height, h, in<br />
metres, after t seconds is modelled by h = -0.5(g - r)t 2 + k, where g<br />
is the acceleration due to gravity, r is the resistance offered by the<br />
parachute, and k is the height from which the object is dropped. On<br />
Earth, g 9.8 m/s 2 . The resistance offered by a single bed sheet is<br />
0.6 m/s 2 , by a car tarp is 2.1 m/s 2 , and by a regular parachute is 8.9 m/s 2 .<br />
a) Describe how the graphs will differ for objects dropped from a height<br />
of 100 m using each of the three types of parachutes.<br />
b) Is it possible to drop an object attached to the bed sheet and a similar<br />
object attached to a regular parachute and have them hit the ground<br />
at the same time Describe how it would be possible and what the<br />
graphs of each might look like.<br />
11. Write the equation of a parabola that matches each description.<br />
a) The graph of y = x 2 is reflected about the x-axis and then<br />
translated 5 units up.<br />
b) The graph of y = x 2 is stretched vertically by a factor of 5 and<br />
then translated 2 units left.<br />
1<br />
c) The graph of y = x 2 is compressed vertically by a factor of<br />
5<br />
and then translated 6 units down.<br />
d) The graph of y = x 2 is reflected about the x-axis, stretched vertically<br />
by a factor of 6, translated 3 units right, and translated 4 units up.<br />
12. Sketch the graph of each parabola described in question 11 by applying<br />
K the given sequence of transformations. Use a separate grid for each graph.<br />
NEL Draft Evaluation Copy<br />
<strong>Chapter</strong> 5 271
y<br />
6<br />
4<br />
2<br />
x<br />
0<br />
-2 2 4 6 8<br />
-2<br />
13. Which equation represents the graph shown at the left Explain your<br />
reasoning.<br />
2<br />
2<br />
a) y = -<br />
c) y = -<br />
3 (x - 3)2 + 5<br />
3 x 2 + 5<br />
b) y = -(x - 3) 2 + 5 d) y = 2 3 (x - 3)2 + 5<br />
14. A sky diver jumped from an airplane. He used his watch to time the<br />
length of his jump. His height above the ground can be modelled by<br />
h = -5(t - 4) 2 + 2500, where h is his height above the ground in<br />
metres and t is the time in seconds from the time he started the timer.<br />
a) How long did the sky diver delay his jump<br />
b) From what height did he jump<br />
15. A video tracking device recorded the height, h, in metres, of a baseball<br />
A after it was hit. The data collected can be modelled by<br />
h = -5(t - 2) 2 + 21, where t is the time in seconds after the ball<br />
was hit.<br />
a) Sketch a graph that represents the height of the baseball.<br />
b) What was the maximum height reached by the baseball<br />
c) When did the baseball reach its maximum height<br />
d) At what time(s) was the baseball at a height of 10 m<br />
e) Approximately when did the baseball hit the ground<br />
16. When a graph of y = x 2 is transformed, the point (3, 9) moves to<br />
T (8, 17). Describe three sets of transformations that could make this<br />
happen. For each set, give the equation of the new parabola.<br />
17. Express the quadratic relation y = 2(x - 4)(x + 10) in both standard<br />
form and vertex form.<br />
18. Copy and complete the chart to show what you know about the<br />
quadratic relation y = -2(x + 3) 2 + 4.<br />
Translation:<br />
Reflection:<br />
y 2(x 3) 2 4<br />
Stretch/<br />
Compression:<br />
Vertex:<br />
Extending<br />
19. Determine one of the zeros of the quadratic relation<br />
y = ax - k 2<br />
.<br />
2 b (k - 2)2<br />
-<br />
4<br />
272 5.3 Graphing Quadratics in Vertex Form Draft Evaluation Copy<br />
NEL
5<br />
Mid-<strong>Chapter</strong> <strong>Review</strong><br />
FREQUENTLY ASKED Questions<br />
Q: How do you know whether the graph of y ax 2 will have<br />
a wider or narrower shape near its vertex, compared<br />
with the graph of y x 2 <br />
A: The shape depends on the value of a in the equation. Each y-value<br />
is multiplied by a factor of a. When a 1, the y-values increase.<br />
The parabola appears to be vertically stretched and becomes narrower<br />
near its vertex. When 0 a 1, the y-values decrease. The parabola<br />
appears to be vertically compressed and becomes wider near its vertex.<br />
Q: Why is the vertex form, y a(x h) 2 k, useful<br />
for graphing quadratic relations<br />
A1: You can use the constants a, h, and k to determine how the graph<br />
of y = x 2 has been transformed.<br />
• When a 1, the parabola is vertically stretched and<br />
when 0 a 1, the parabola is vertically compressed.<br />
• When a 0, the parabola is reflected in the x-axis.<br />
• The parabola is translated to the right when h 0 and to the left<br />
when h 0. The parabola is translated up when k 0 and down<br />
when k 0.<br />
• The coordinates of the vertex are (h, k).<br />
A2: You can use the constants a, h, and k to determine key features<br />
of the parabola.<br />
• When a 0, the parabola opens upward. When a 0, the<br />
parabola opens downward.<br />
• The coordinates of the vertex are (h, k).<br />
• The equation of the axis of symmetry is x = h.<br />
You can use these properties, as well as the coordinates of a few other<br />
points, to draw an accurate sketch of any parabola.<br />
Q: When you use transformations to sketch a graph, why is the<br />
order in which you apply the transformations important<br />
A: When a graph is transformed, operations are performed on the<br />
coordinates of each point. Apply transformations in the same order you<br />
would apply calculations. Apply vertical stretches/compressions and<br />
reflections (multiplication) before translations (addition or subtraction).<br />
Study<br />
Aid<br />
• See Lesson 5.1,<br />
Examples 1 and 2.<br />
• Try Mid-<strong>Chapter</strong> <strong>Review</strong><br />
Questions 1 and 2.<br />
Study<br />
Aid<br />
• See Lesson 5.3,<br />
Examples 1 to 3.<br />
• Try Mid-<strong>Chapter</strong> <strong>Review</strong><br />
Questions 3, 4, 6, and 7.<br />
Study<br />
Aid<br />
• See Lesson 5.3, Examples<br />
1 to 3.<br />
• Try Mid-<strong>Chapter</strong> <strong>Review</strong><br />
Question 5.<br />
Stretch Reflect Translate<br />
NEL Draft Evaluation Copy<br />
<strong>Chapter</strong> 5 273
PRACTICE Questions<br />
Lesson 5.1<br />
1. Sketch the graph of each equation by correctly<br />
applying the required transformation(s) to<br />
points on the graph of y = x 2 . Use a separate<br />
grid for each graph.<br />
a) y = 2x 2 c) y = -3x 2<br />
b) y = -0.25x 2 d) y = 2 3 x 2<br />
2. Describe the transformation(s) that were applied<br />
to the graph of y = x 2 to obtain each black<br />
graph. Write the equation of the black graph.<br />
a)<br />
y<br />
8 y x 2<br />
b)<br />
Lesson 5.2<br />
6<br />
4<br />
2<br />
0<br />
-4 -2 2 4<br />
-2<br />
6<br />
4<br />
2<br />
y<br />
0<br />
-4 -2 2 4<br />
-2<br />
-4<br />
-6<br />
y x 2<br />
3. Determine the values of h and k for each of the<br />
following transformations. Write the equation in<br />
the form y = (x - h) 2 + k. Sketch the graph.<br />
a) The parabola moves 3 units down and<br />
2 units right.<br />
b) The parabola moves 4 units left and<br />
6 units up.<br />
x<br />
x<br />
4. The parabolas<br />
displayed on the<br />
graphing calculator<br />
screen were entered as<br />
equations of the form<br />
y = (x - h) 2 + k.<br />
Determine as many of the equations as you can.<br />
Lesson 5.3<br />
5. Describe the sequence of transformations that<br />
you would apply to the graph of y = x 2 to<br />
sketch each quadratic relation.<br />
a) y = -3(x - 1) 2<br />
b)<br />
c)<br />
d)<br />
6. Sketch a graph of each quadratic relation in<br />
question 5 on a separate grid. Use the properties<br />
of the parabola and some additional points.<br />
7. For each quadratic relation,<br />
i) state the stretch/compression factor and the<br />
horizontal/vertical translations<br />
ii) determine whether the graph is reflected in<br />
the x-axis<br />
iii) state the vertex and the equation of the axis<br />
of symmetry<br />
iv) sketch the graph by applying transformations<br />
to the graph of y = x 2<br />
a)<br />
b)<br />
c)<br />
d)<br />
y = 1 2 (x + 3)2 - 8<br />
y = 4(x - 2) 2 - 5<br />
y = 2 3 x 2 - 1<br />
y = (x - 2) 2 + 1<br />
1<br />
y = - (x + 4)2<br />
2<br />
y = 2(x + 1) 2 - 8<br />
y = -0.25x 2 + 5<br />
8. A parabola lies in only two quadrants. What<br />
does this tell you about the values of a, h, and k<br />
Explain your thinking, and provide the equation<br />
of a parabola as an example.<br />
274 Mid-<strong>Chapter</strong> <strong>Review</strong><br />
Draft Evaluation Copy<br />
NEL
5.4<br />
Quadratic Models Using<br />
Vertex Form<br />
GOAL<br />
Write the equation of the graph of a quadratic relation<br />
in vertex form.<br />
LEARN ABOUT the Math<br />
The Best Bread Bakery wants to<br />
determine its daily profit from bread<br />
sales. This graph shows the data gathered<br />
by the company.<br />
<br />
What equation represents the relationship between the<br />
price of bread and the daily profit from bread sales<br />
EXAMPLE 1<br />
Determine the equation of this quadratic relation from its graph.<br />
Sabrina’s Solution<br />
Connecting a parabola to the vertex form of its equation<br />
Profit ($)<br />
YOU WILL NEED<br />
• grid paper<br />
• ruler<br />
• graphing calculator<br />
• spreadsheet program (optional)<br />
Bakery Profits from Bread Sales<br />
y<br />
400<br />
(1.75, 400)<br />
350<br />
300<br />
250<br />
200<br />
150<br />
0<br />
(0.75, 300)<br />
0.5 1 1.5 2 2.5<br />
Price per loaf ($)<br />
3<br />
x<br />
y = a(x - h) 2 + k<br />
y = a(x - 1.75) 2 + 400<br />
300 = a(0.75 - 1.75) 2 + 400<br />
300 = a(–1) 2 + 400<br />
300 = a + 400<br />
–100 = a<br />
The equation that represents the relationship<br />
is .<br />
y = –100(x - 1.75) 2 + 400<br />
Since the graph is a parabola and the coordinates of<br />
the vertex are given, I decided to use vertex form.<br />
Since (1.75, 400) is the vertex, h 1.75 and<br />
k 400. I substituted these values into the equation.<br />
To determine the value of a, I chose the point<br />
(0.75, 300) on the graph. I substituted these<br />
coordinates for x and y in the equation.<br />
I followed the order of operations and solved for the<br />
value of a.<br />
Reflecting<br />
A. What information do you need from the graph of a quadratic relation<br />
to determine the equation of the relation in vertex form<br />
B. You have used the standard, factored, and vertex forms of a quadratic<br />
relation. Which form do you think is most useful for determining<br />
the equation of a parabola from its graph Explain why.<br />
NEL Draft Evaluation Copy<br />
<strong>Chapter</strong> 5 275
APPLY the Math<br />
EXAMPLE 2<br />
Connecting information about a parabola to its equation<br />
The graph of y = x 2 was stretched by a factor of 2 and reflected in the x-axis.<br />
The graph was then translated to a position where its vertex is not visible in the<br />
viewing window of a graphing calculator. Determine the quadratic relation in<br />
18<br />
vertex form from the partial graph displayed in the screen shot. The scale factor<br />
on the y-axis is 5, and the scale factor on the x-axis is 2.<br />
4<br />
Terri’s Solution<br />
a = -2<br />
y = -2(x - h) 2 + k<br />
The zeros of the graph are 3 and 13.<br />
h = 3 + 13<br />
2<br />
h = 8<br />
18 = -2(4 - 8) 2 + k<br />
18 = -2(16) + k<br />
18 = -32 + k<br />
50 = k<br />
The equation of the graph is y = -2(x - 8) 2 + 50.<br />
The graph was stretched by a factor of 2 and<br />
reflected in the x-axis.<br />
I substituted the value of a into the vertex form<br />
of the quadratic relation.<br />
I determined the mean of the two zeros to calculate<br />
the value of h. The vertex lies on the axis of symmetry,<br />
which is halfway between the zeros of the graph.<br />
I saw that (4, 18) is a point on the graph. By<br />
substituting these coordinates, as well as the value<br />
I determined for h, I was able to solve for k.<br />
EXAMPLE 3<br />
Selecting a strategy to determine a quadratic model<br />
The amount of gasoline that a car consumes depends on its speed. A group<br />
of students decided to research the relationship between speed and fuel<br />
consumption for a particular car. They collected the data in the table. Determine<br />
an equation that models the relationship between speed and fuel consumption.<br />
Speed (km/h) 10 20 30 40 50 60 70 80 90 100 110 120<br />
Gas Consumed<br />
(litres/100 km)<br />
9.2 8.1 7.4 7.2 6.4 6.1 5.9 5.8 6.0 6.3 7.5 8.4<br />
276 5.4 Quadratic Models Using Vertex Form Draft Evaluation Copy<br />
NEL
Eric’s Solution: Representing a relation with a scatter plot and determining<br />
the equation algebraically<br />
5.4<br />
Gas (litres/100 km)<br />
10<br />
-8<br />
6<br />
4<br />
2<br />
0<br />
y<br />
vertex<br />
(75, 5.8)<br />
x<br />
20 40 60 80 100 120 140<br />
Speed (km/h)<br />
I constructed a scatter plot to display the data and<br />
drew a curve of good fit. Since the curve looked<br />
parabolic and I knew that I could estimate the<br />
coordinates of the vertex. I estimated the<br />
coordinates of the vertex to be about (75, 5.8).<br />
y = a(x - h) 2 + k<br />
y = a(x - 75) 2 + 5.8<br />
I decided to use the vertex form of the equation.<br />
I substituted the estimated values (75, 5.8) into the<br />
general equation.<br />
6.0 = a(90 - 75) 2 + 5.8<br />
6.0 = a(15) 2 + 5.8<br />
6.0 = 225a + 5.8<br />
0.2 = 225a<br />
0.0009 a<br />
The equation that models the data is<br />
y = 0.0009(x - 75) 2 + 5.8.<br />
From the table, I knew that the point (90, 6.0) is<br />
close to the curve. I substituted the coordinates of<br />
this point for x and y to determine a.<br />
I solved for a.<br />
Gas (L/100 km)<br />
10.0<br />
8.0<br />
6.0<br />
4.0<br />
2.0<br />
Gas Consumption<br />
y 0.0009x 2 0.1317x<br />
10.534<br />
0.0<br />
0 50 100 150<br />
Speed (km/h)<br />
I checked my equation using a spreadsheet.<br />
I entered the data from the table. I used column A<br />
for the Speed values and column B for the Gas<br />
values. I created a graph, added a trend line using<br />
quadratic regression of order 2, and chose the<br />
option to display the equation on the graph.<br />
Tech<br />
Support<br />
For help creating a scatter plot<br />
and performing a regression<br />
analysis using a spreadsheet,<br />
see Appendix B-35.<br />
NEL Draft Evaluation Copy<br />
<strong>Chapter</strong> 5 277
y = 0.0009(x - 75) 2 + 5.8<br />
y = 0.0009(x 2 - 150x + 5625) + 5.8<br />
y = 0.0009x 2 - 0.135x + 5.0625 + 5.8<br />
y = 0.0009x 2 - 0.135x + 10.8625<br />
The spreadsheet equation was in standard form,<br />
but my equation was in vertex form. To compare<br />
the two equations, I expanded my equation.<br />
The two equations are very close, so they are both<br />
good quadratic models for this set of data.<br />
Gillian’s Solution: Selecting a graphing calculator and an informal curve-fitting process<br />
I entered the data into L1 and L2 in the data editor<br />
of a graphing calculator and created a scatter plot.<br />
y = a(x - 75) 2 + 5.8<br />
The points had a parabolic pattern, so I estimated<br />
the coordinates of the vertex to be about (75, 5.8).<br />
I substituted these coordinates into the general<br />
equation.<br />
Since the parabola opens upward, I knew that<br />
a 7 0. I used a = 1 and entered the equation<br />
y = 1(x - 75) 2 + 5.8 into Y1 of the equation<br />
editor. Then I graphed the equation. The location<br />
of the vertex looked good, but the parabola wasn’t<br />
wide enough.<br />
I decreased the value of a to a = 0.1, but the<br />
parabola still wasn’t wide enough.<br />
I decreased the value of a several more times until I<br />
got a good fit. I found that a = 0.0009 worked<br />
fairly well.<br />
An equation that models the relationship between speed<br />
and fuel consumption is .<br />
y = 0.0009(x - 75) 2 + 5.8<br />
Tech<br />
Support<br />
For help creating a scatter plot<br />
using a graphing calculator,<br />
see Appendix B-10.<br />
278 5.4 Quadratic Models Using Vertex Form Draft Evaluation Copy<br />
NEL
I checked my equation by comparing it with the<br />
equation produced by quadratic regression on the<br />
graphing calculator. To do this, I had to expand<br />
my equation.<br />
5.4<br />
y = 0.0009(x - 75) 2 + 5.8<br />
y = 0.0009(x 2 - 150x + 5625) + 5.8<br />
y = 0.0009x 2 - 0.135x + 5.0625 + 5.8<br />
y = 0.0009x 2 - 0.135x + 10.8625<br />
The two equations are close, so they are both<br />
good models for this set of data.<br />
Tech<br />
Support<br />
For help performing a<br />
quadratic regression analysis<br />
using a graphing calculator,<br />
see Appendix B-10.<br />
In Summary<br />
Key Idea<br />
• If you know the coordinates of the vertex (h, k) and one other point<br />
on a parabola, you can determine the equation of the relation using<br />
y = a(x - h) 2 + k.<br />
Need to Know<br />
• To determine the value of a, substitute the coordinates of a point<br />
on the graph into the general equation and solve for a:<br />
• If (h, k) = (., .), then y = a(x - .) 2 + ..<br />
• If a point on the graph has coordinates x = . and y = ., then, by<br />
substitution, . = a(. - .) 2 + ..<br />
• Since a is the only remaining unknown, its value can be determined<br />
by solving the equation.<br />
• The vertex form of an equation<br />
can be determined using the<br />
zeros of the graph. The axis of<br />
symmetry is x = h, where h is<br />
the mean of the zeros.<br />
• You can convert a quadratic<br />
equation from vertex form to<br />
standard form by expanding<br />
and then collecting like terms.<br />
y<br />
(r, 0)<br />
(h, k)<br />
(s, 0)<br />
x —<br />
h<br />
r s<br />
2<br />
x<br />
NEL Draft Evaluation Copy<br />
<strong>Chapter</strong> 5 279
CHECK Your Understanding<br />
1. Match each equation with the correct graph.<br />
a) y = 2x 2 – 8 c) y = -2(x – 3) 2 + 8<br />
b) y = (x + 3) 2 d) y = (x – 3) 2 – 8<br />
i) y<br />
iii)<br />
10<br />
4<br />
y<br />
8<br />
6<br />
4<br />
2<br />
-4<br />
0<br />
-2<br />
-2<br />
2<br />
4<br />
x<br />
2<br />
x<br />
0<br />
-2 2 4 6 8<br />
-2<br />
-4<br />
-6<br />
-8<br />
-4<br />
-10<br />
ii)<br />
4<br />
y<br />
iv)<br />
10<br />
y<br />
2<br />
x<br />
0<br />
-2 2 4 6 8<br />
-2<br />
8<br />
6<br />
4<br />
-4<br />
-6<br />
-8<br />
2<br />
x<br />
-8 -6 -4 -2 2<br />
-2<br />
0<br />
-10<br />
-4<br />
2. The vertex of a quadratic relation is (4, 12).<br />
a) Write an equation to describe all parabolas with this vertex.<br />
b) A parabola with the given vertex passes through point (13, 15).<br />
Determine the value of a for this parabola.<br />
c) Write the equation of the relation in part b).<br />
d) State the transformations that must be applied to y x 2 to obtain<br />
the quadratic relation you wrote for part c).<br />
e) Graph the quadratic relation you wrote for part c).<br />
280 5.4 Quadratic Models Using Vertex Form Draft Evaluation Copy<br />
NEL
5.4<br />
PRACTISING<br />
3. Write the equation of each parabola in vertex form.<br />
a) y<br />
6<br />
c) y<br />
6<br />
e)<br />
6<br />
y<br />
4<br />
4<br />
4<br />
2<br />
(2, 1)<br />
-4<br />
0<br />
-2<br />
-2<br />
2 4<br />
x<br />
2<br />
(2, 0)<br />
0<br />
-4 -2 2 4<br />
-2<br />
x<br />
2<br />
-4<br />
0<br />
-2<br />
-2<br />
2<br />
(3, 1)<br />
x<br />
4<br />
b) y<br />
d) y<br />
f)<br />
6<br />
4<br />
4<br />
y<br />
4<br />
(–2, 2) 2<br />
0<br />
-4 -2 2<br />
-2<br />
4<br />
x<br />
2<br />
0<br />
-4 -2 2<br />
(–1, –2)<br />
-4<br />
4<br />
x<br />
(–3, 2) 2<br />
-4<br />
0<br />
-2<br />
-2<br />
2<br />
-4<br />
4<br />
x<br />
4. The following transformations are applied to the graph of y = x 2 .<br />
Determine the equation of each new relation.<br />
a) a vertical stretch by a factor of 4<br />
b) a translation of 3 units left<br />
c) a reflection in the x-axis, followed by a translation 2 units up<br />
1<br />
d) a vertical compression by a factor of 2<br />
e) a translation of 5 units right and 4 units down<br />
f) a vertical stretch by a factor of 2, followed by a reflection<br />
in the x-axis and a translation 1 unit left<br />
5. Write the equation of a parabola with each set of properties.<br />
a) vertex at (0, 4), opens upward, the same shape as y x 2<br />
b) vertex at (5, 0), opens downward, the same shape as y x 2<br />
c) vertex at (2, 3), opens upward, narrower than y x 2<br />
d) vertex at (3, 5), opens downward, wider than y x 2<br />
e) axis of symmetry x 4, opens upward, two zeros, narrower<br />
than y x 2<br />
f) vertex at (3, – 4), no zeros, wider than y x 2<br />
6. Determine the equation of a quadratic relation in vertex form, given<br />
K the following information.<br />
a) vertex at (2, 3), passes through (4, 1)<br />
b) vertex at (1, 1), passes through (0, 1)<br />
c) vertex at (2, 3), passes through (5, 6)<br />
d) vertex at (2, 5), passes through (1, 4)<br />
NEL Draft Evaluation Copy<br />
<strong>Chapter</strong> 5 281
7. Each table of values defines a parabola. Determine the axis of<br />
symmetry of the parabola, and write the equation in vertex form.<br />
a) b)<br />
x y<br />
x y<br />
2 33<br />
0 12<br />
3 13<br />
4 1<br />
5 3<br />
6 1<br />
1 4<br />
2 4<br />
3 12<br />
4 28<br />
8. A child kicks a soccer ball so that it barely clears a 2 m fence. The<br />
soccer ball lands 3 m from the fence. Determine the equation, in<br />
vertex form, of a quadratic relation that models the path of the ball.<br />
9. Data for DVD sales in Canada, over several years, are given in the table.<br />
Year 2002 2003 2004 2005 2006<br />
x, Years Since 2002 0 1 2 3 4<br />
DVDs Sold (1000s) 1446 3697 4573 4228 3702<br />
a) Using graphing technology, create a scatter plot to display the data.<br />
b) Estimate the vertex of the graph you created for part a). Then<br />
determine an equation in vertex form to model the data.<br />
c) How many DVDs would you expect to be sold in 2010<br />
d) Check the accuracy of your model using quadratic regression.<br />
10. A school custodian finds a tennis ball on the roof of the school and<br />
A throws it to the ground below. The table gives the height of the ball<br />
above the ground as it moves through the air.<br />
Time (s) 0.0 0.5 1.0 1.5 2.0 2.5 3.0<br />
Height (m) 5.00 11.25 15.00 16.25 15.00 11.25 5.00<br />
a) Do the data appear to be linear or quadratic Explain.<br />
b) Create a scatter plot, and draw a quadratic curve of good fit.<br />
c) Estimate the coordinates of the vertex.<br />
d) Determine an algebraic relation in vertex form to model the data.<br />
e) Use your model to predict the height of the ball at 2.75 s and 1.25 s.<br />
f) How effective is your model for time values that are greater than<br />
3.5 s Explain.<br />
g) Check the accuracy of your model using quadratic regression.<br />
282 5.4 Quadratic Models Using Vertex Form Draft Evaluation Copy<br />
NEL
11. A chain of ice cream stores sells $840 of ice cream cones per day. Each<br />
ice cream cone costs $3.50. Market research shows the following trend<br />
in revenue as the price of an ice cream cone is reduced.<br />
5.4<br />
Price ($) 3.50 3.00 2.50 2.00 1.50 1.00 0.50<br />
Revenue ($) 840 2520 3600 4080 3960 3240 1920<br />
a) Create a scatter plot, and draw a quadratic curve of good fit.<br />
b) Determine an equation in vertex form to model this relation.<br />
c) Use your model to predict the revenue if the price of an ice cream<br />
cone is reduced to $2.25.<br />
d) To maximize revenue, what should an ice cream cone cost<br />
e) Check the accuracy of your model using quadratic regression.<br />
12. This table shows the number of imported cars that were sold<br />
in Newfoundland between 2003 and 2007.<br />
Year 2003 2004 2005 2006 2007<br />
Sales of Imported<br />
Cars (number sold)<br />
3996 3906 3762 3788 4151<br />
a) Create a scatter plot, and draw a quadratic curve of good fit.<br />
b) Determine an algebraic equation in vertex form to model<br />
this relation.<br />
c) Use your model to predict how many imported cars were sold<br />
in 2008.<br />
d) What does your model predict for 2006 Is this prediction<br />
accurate Explain.<br />
e) Check the accuracy of your model using quadratic regression.<br />
13. The Lion’s Gate Bridge in Vancouver, British Columbia, is a<br />
T suspension bridge that spans a distance of 1516 m. Large cables are<br />
attached to the tops of the towers, 50 m above the road. The road is<br />
suspended from the large cables by many smaller vertical cables. The<br />
smallest vertical cable measures about 2 m. Use this information to<br />
determine a quadratic model for the large cables.<br />
14. A model rocket is launched from the ground. After 20 s, the rocket<br />
C reaches a maximum height of 2000 m. It lands on the ground after<br />
40 s. Explain how you could determine the equation of the relationship<br />
between the height of the rocket and time using two different strategies.<br />
NEL Draft Evaluation Copy<br />
<strong>Chapter</strong> 5 283
15. The owner of a small clothing company wants to create a<br />
mathematical model for the company’s daily profit, p, in dollars, based<br />
on the selling price, d, of the dresses made. The owner has noticed that<br />
the maximum daily profit the company has made is $1600. This<br />
occurred when the dresses were sold for $75 each. The owner also<br />
noticed that selling the dresses for $50 resulted in a profit of $1225.<br />
Using a quadratic relation to model this problem, create an equation<br />
for the company’s daily profit.<br />
16. Compare the three forms of the equation of a quadratic relation using<br />
this concept circle. Under what conditions would you use one form<br />
instead of the other forms when trying to connect a graph to its<br />
equation Explain your thinking.<br />
Quadratic Relations<br />
Factored<br />
Form<br />
Standard<br />
Form<br />
Vertex<br />
Form<br />
Extending<br />
17. The following transformations are applied to a parabola with the<br />
equation y = 2(x + 3) 2 – 1. Determine the equation that will result<br />
after each transformation.<br />
a) a translation 4 units right<br />
b) a reflection in the x-axis<br />
c) a reflection in the x-axis, followed by a translation 5 units down<br />
d) a stretch by a factor of 6<br />
1<br />
e) a compression by a factor of , followed by a reflection in the y-axis<br />
18. The vertex of the parabola y = 3x 2 + bx + c is at (1, 4).<br />
Determine the values of b and c.<br />
4<br />
19. Determine an algebraic expression for the solution, x, to the equation<br />
0 = a(x - h) 2 + k. Do not expand the equation.<br />
284 5.4 Quadratic Models Using Vertex Form Draft Evaluation Copy<br />
NEL
5.5<br />
Solving Problems Using<br />
Quadratic Relations<br />
GOAL<br />
Model and solve problems using the vertex form of a quadratic<br />
relation.<br />
YOU WILL NEED<br />
• grid paper<br />
• ruler<br />
LEARN ABOUT the Math<br />
Smoke jumpers are firefighters who parachute into remote locations to<br />
suppress forest fires. They are often the first people to arrive at a fire. When<br />
smoke jumpers exit an airplane, they are in free fall until their parachutes open.<br />
A quadratic relation can be used to determine the height, H, in metres, of<br />
a jumper t seconds after exiting an airplane. In this relation, a = -0.5g,<br />
where g is the acceleration due to gravity. On Earth, g = 9.8 m/s 2 .<br />
<br />
If a jumper exits an airplane at a height of 554 m, how long will<br />
the jumper be in free fall before the parachute opens at 300 m<br />
EXAMPLE 1<br />
Connecting information from a problem<br />
to a quadratic model<br />
a) Determine the quadratic relation that will model the height, H, of the<br />
smoke jumper at time t.<br />
b) Determine the length of time that the jumper is in free fall.<br />
Conor’s Solution<br />
a) H = a(t - h) 2 + k<br />
I decided to use the vertex form<br />
of the quadratic relation because<br />
the problem contains<br />
information about the vertex.<br />
NEL Draft Evaluation Copy<br />
<strong>Chapter</strong> 5 285
H = a(t - 0) 2 + 554<br />
H = -0.5(9.8)(t - 0) 2 + 554<br />
H = -4.9(t - 0) 2 + 554 is an<br />
equation in vertex form for the<br />
quadratic relation that models<br />
this situation.<br />
H = -4.9t 2 + 554 is an equation<br />
in standard form for the quadratic<br />
relation that models this situation.<br />
b) 300 = -4.9t 2 + 554<br />
-254 = -4.9t 2<br />
-254<br />
-4.9 = -4.9t 2<br />
-4.9<br />
51.84 = t 2<br />
151.84 = t<br />
7.2 t, since t 7 0<br />
The jumper is in free fall<br />
for about 7.2 s.<br />
The vertex is the point at which<br />
the jumper exited the plane. So<br />
the vertex has coordinates (0, 554).<br />
I substituted these coordinates into<br />
the general equation.<br />
Since a 0.5g and<br />
g 9.8 m/s 2 , I substituted these<br />
values into the vertex form of the<br />
equation.<br />
I noticed that the value of a is the<br />
same in both vertex form and<br />
standard form. This makes sense<br />
because the parabolas would not<br />
be congruent if they were different.<br />
Because the parachute opened<br />
at 300 m, I substituted 300 for H.<br />
Then I solved for t.<br />
In this situation, time can’t be<br />
negative. So, I didn’t use the<br />
negative square root of 51.84.<br />
Reflecting<br />
A. Why was zero used for the t-coordinate of the vertex<br />
B. How would the equation change if the jumper hesitated for 2 s before<br />
exiting the airplane, after being given the command to jump<br />
C. Why was the vertex form easier to use than either of the other two<br />
forms of a quadratic relation in this problem<br />
286 5.5 Solving Problems Using Quadratic Relations Draft Evaluation Copy<br />
NEL
APPLY the Math<br />
EXAMPLE 2<br />
Solving a problem using a quadratic model<br />
5.5<br />
The underside of a concrete railway underpass forms a parabolic arch. The<br />
arch is 30.0 m wide at the base and 10.8 m high in the centre. The upper<br />
surface of the underpass is 40.0 m wide. The concrete is 2.0 m thick at the<br />
centre. Can a truck that is 5 m wide and 7.5 m tall get through this underpass<br />
Lisa’s Solution<br />
y<br />
4<br />
I started by drawing a diagram. I used a grid and<br />
2 (0, 0)<br />
x marked the top of the arch as (0, 0). The upper<br />
0<br />
-20 -16 -12 -8 -4 4 8 12 16 20<br />
surface of the underpass is 2 m above the top of<br />
-4<br />
the arch at the centre. The arch is 10.8 m high in<br />
-6<br />
-8<br />
the centre and 30 m wide at the base (or 15 m<br />
-10<br />
wide on each side). I marked the points<br />
(–15, –10.8) -12<br />
(15, –10.8)<br />
-14<br />
(15, 10.8) and (15, 10.8) and drew a<br />
parabola through these two points and the origin.<br />
y = ax 2<br />
The vertex of the parabola is at the origin, so I did<br />
not translate y = ax 2 .<br />
-10.8 = a(15) 2<br />
-10.8 = 225a<br />
-0.048 = a<br />
y = -0.048x 2 is the quadratic relation that models<br />
the arch of the railway underpass.<br />
I determined the value of a by substituting the<br />
coordinates of a point on the graph, (15, 10.8),<br />
into this equation. Then I solved for a.<br />
y<br />
4<br />
2 (0, 0)<br />
0<br />
-20 -16 -12 -8 -4 4 8 12 16 20<br />
-4<br />
-6<br />
-8<br />
-10<br />
(–15, –10.8) -12<br />
(15, –10.8)<br />
-14<br />
x<br />
The truck has the best chance of getting through<br />
the underpass if it passes through the centre. Since<br />
the truck is 5 m wide, this means that the position<br />
of the right corner of the truck has an x-coordinate<br />
of 2.5. I substituted x = 2.5 into the equation to<br />
check the height of the underpass at this point.<br />
Height at<br />
y = -0.048(2.5) 2<br />
y = -0.048(6.25)<br />
y = -0.3<br />
(2.5, -0.3) = 10.8 - 0.3<br />
= 10.5<br />
The truck can get through. Since the truck is<br />
7.5 m tall, there is 3 m of clearance.<br />
I determined the height from the ground at this<br />
point by subtracting 0.3 from 10.8.<br />
The truck can get through the overpass, even if it is<br />
a little off the centre of the overpass.<br />
NEL Draft Evaluation Copy<br />
<strong>Chapter</strong> 5 287
EXAMPLE 3<br />
Selecting a strategy to determine<br />
the vertex form<br />
Write the quadratic relation y = x 2 - 4x - 5 in vertex form, and sketch<br />
the graph by hand.<br />
Coral’s Solution<br />
y = x 2 - 4x - 5<br />
y = (x + 1)(x - 5)<br />
Zeros:<br />
0 = (x + 1)(x - 5)<br />
x = -1 and x = 5<br />
The axis of symmetry is<br />
x = -1 + 5 so x 2.<br />
2<br />
y = (2) 2 - 4(2) - 5<br />
y = 4 - 8 - 5<br />
y = -9<br />
I rewrote the equation of the<br />
quadratic relation in factored<br />
form because I knew that I could<br />
determine the coordinates of the<br />
vertex from this form.<br />
I set y 0 to determine the zeros.<br />
I used the zeros to determine the<br />
equation of the axis of symmetry.<br />
I substituted x = 2 into the<br />
standard form of the equation to<br />
solve for y.<br />
The vertex is at (h, k) = (2, -9).<br />
The coefficient of x 2 is a = 1.<br />
The relation is y = (x - 2) 2 - 9<br />
in vertex form.<br />
y x 2 16<br />
y<br />
12<br />
8<br />
4<br />
x<br />
-6 -4<br />
0<br />
-2<br />
-4<br />
2 4 6 8<br />
-8<br />
-12<br />
y (x 2) 2 9<br />
-16<br />
I knew that the value of a must<br />
be the same in the standard,<br />
factored, and vertex forms. If it<br />
were different, the parabola<br />
would have different widths.<br />
I substituted what I knew into the<br />
vertex form, y = a (x - h) 2 + k.<br />
I sketched the graph of y = x 2<br />
and translated each point 2 units<br />
right and 9 units down.<br />
288 5.5 Solving Problems Using Quadratic Relations Draft Evaluation Copy<br />
NEL
5.5<br />
EXAMPLE 4<br />
Representing a situation with a quadratic<br />
model<br />
The Next Cup coffee shop sells a special blend of coffee for $2.60 per mug.<br />
The shop sells about 200 mugs per day. Customer surveys show that for<br />
every $0.05 decrease in the price, the shop will sell 10 more mugs per day.<br />
a) Determine the maximum daily revenue from coffee sales and the price<br />
per mug for this revenue.<br />
b) Write an equation in both standard form and vertex form to model<br />
this problem. Then sketch the graph.<br />
Dave’s Solution: Connecting the zeros of a parabola<br />
to the vertex form of the equation<br />
a) Let x represent the number of<br />
$0.05 decreases in price, where<br />
Revenue (price)(mugs sold).<br />
r = (2.60 - 0.05x)(200 + 10x)<br />
I defined a variable that connects<br />
the price per mug to the number<br />
of mugs sold.<br />
I used the information in the<br />
problem to write expressions for<br />
the price per mug and the<br />
number of mugs sold in terms<br />
of x. If I drop the price by $0.05,<br />
x times, then the price per mug<br />
is 2.60 0.05x and the number<br />
of mugs sold is 200 10x.<br />
I used my expressions to write a<br />
relationship for daily revenue, r.<br />
0 = (2.60 - 0.05x)(200 + 10x)<br />
2.60 - 0.05x = 0 or<br />
200 + 10x = 0<br />
x = 52 and x = -20<br />
52 + (-20)<br />
x =<br />
2<br />
x = 16<br />
Since the equation is in factored<br />
form, the zeros of the equation<br />
can be calculated by letting<br />
r 0 and solving for x.<br />
I used the zeros to determine<br />
the equation of the axis of<br />
symmetry.<br />
r = [2.60 - 0.05(16)][200 + 10(16)]<br />
r = (1.80)(360)<br />
r = 648<br />
The maximum daily revenue<br />
is $648.<br />
The maximum value occurs<br />
at the vertex. To calculate it,<br />
I substituted, the x-value for<br />
the axis of symmetry into the<br />
revenue equation.<br />
NEL Draft Evaluation Copy<br />
<strong>Chapter</strong> 5 289
Price per mug for maximum revenue<br />
= 2.60 - 0.05(16)<br />
= 1.80<br />
The coffee shop should sell each<br />
mug of coffee for $1.80 to achieve<br />
a maximum daily revenue of $648.<br />
b) In this relation, the maximum<br />
value is r = 648. It occurs when<br />
x = 16.<br />
The vertex is (16, 648) (h, k).<br />
r = a(x - 16) 2 + 648<br />
When x = 0,<br />
r = (2.60)(200) = 520<br />
520 = a(0 - 16) 2 + 648<br />
520 = a(-16) 2 + 648<br />
-128 = 256a<br />
-0.5 = a<br />
The equation in vertex form is<br />
r = -0.5(x - 16) 2 + 648.<br />
I substituted x 16 into the<br />
expression for the price<br />
per mug.<br />
The maximum value occurs<br />
at the vertex of a quadratic<br />
relation. To write the equation<br />
in vertex form, substitute<br />
the values of h and k into the<br />
vertex form of the general<br />
equation.<br />
Since the coffee shop sells 200<br />
mugs of coffee when the price<br />
is $2.60 per mug, the point<br />
(0, 520) is on the graph. I<br />
substituted these coordinates<br />
into the equation and solved<br />
for a.<br />
r = -0.5(x - 16) 2 + 648<br />
r = -0.5(x 2 - 32x + 256) + 648<br />
r = -0.5x 2 + 16x - 128 + 648<br />
r = -0.5x 2 + 16x + 520<br />
The equation in standard form is<br />
r = -0.5x 2 + 16x + 520.<br />
I expanded to get the equation<br />
in standard form.<br />
700<br />
r<br />
(16, 648)<br />
600<br />
500<br />
400<br />
300<br />
200<br />
100<br />
-20 -10<br />
0<br />
10 20 30 40 50<br />
x<br />
The vertex is at (16, 648).<br />
The zeros are at (52, 0) and<br />
(20, 0).<br />
The y-intercept is at (0, 520).<br />
I used these points to sketch<br />
the graph of the relation.<br />
290 5.5 Solving Problems Using Quadratic Relations Draft Evaluation Copy<br />
NEL
5.5<br />
Toni’s Solution: Selecting a graphing calculator to determine<br />
the quadratic model<br />
a)<br />
Once I created the revenue<br />
equation, I entered it into the<br />
equation editor as Y1.<br />
I graphed the revenue equation.<br />
I had to adjust the window<br />
settings until I could see the<br />
zeros and the vertex.<br />
Since the vertex in this model<br />
represents the maximum value,<br />
I determined it using the<br />
maximum operation.<br />
Tech<br />
Support<br />
For help determining the<br />
maximum value of a relation<br />
using a graphing calculator,<br />
see Appendix B-9.<br />
The vertex is at (16, 648).<br />
The maximum daily revenue<br />
is $648.<br />
Selling price 2.60 0.05(16)<br />
1.80<br />
Each mug of coffee should be<br />
sold for $1.80 to maximize the<br />
daily revenue.<br />
b) The equation in standard form is<br />
y = (2.60 – 0.05x)(200 + 10x)<br />
y = -0.5x 2 + 16x + 520<br />
a = -0.5<br />
The vertex is at (16, 648) (h, k).<br />
y = a(x - h) 2 + k<br />
y = -0.5(x - 16) 2 + 648<br />
This is the equation in vertex form.<br />
The maximum value is y = 648.<br />
This means that the maximum<br />
daily revenue is $648. It occurs<br />
when x = 16.<br />
Since the calculator has already<br />
produced the graph of the<br />
model, I only needed to<br />
determine the vertex form. I<br />
took the revenue equation and<br />
expanded it to get the equation<br />
in standard form.<br />
Since the value of a is the same<br />
in all forms of a quadratic<br />
relation, I used it along with the<br />
coordinates of the vertex, and<br />
substituted to obtain the<br />
equation in vertex form.<br />
NEL Draft Evaluation Copy<br />
<strong>Chapter</strong> 5 291
In Summary<br />
Key Idea<br />
• All quadratic relations can be expressed in vertex form and standard<br />
form. Quadratic relations that have zeros can also be expressed in<br />
factored form.<br />
• For any parabola, the value of a is the same in all three forms of the<br />
equation of the quadratic relation.<br />
Need to Know<br />
• The y-coordinate of the vertex of a parabola represents the maximum or<br />
minimum value of the quadratic relation. The coordinates of the vertex<br />
are easily determined from the vertex form of the equation.<br />
• If a situation can be modelled by a quadratic relation of the form<br />
y a(x h) 2 k, the maximum or minimum value of y is k and it<br />
occurs when x h.<br />
x h<br />
a 0, k is a maximum<br />
y<br />
(h, k)<br />
x<br />
(h, k)<br />
a 0, k is a minimum<br />
x h<br />
• If y ax 2 bx c can be factored as a product of first-degree<br />
binomials and a constant,<br />
y a(x r)(x s), then this equation can be used to determine the<br />
vertex form of the quadratic relation.<br />
r + s<br />
• Use x to determine the equation of the axis of symmetry.<br />
2<br />
This gives you the value of h.<br />
r + s<br />
• Substitute x <br />
2<br />
into y ax 2 bx c to determine the<br />
y-coordinate of the vertex.<br />
This gives you the value of k.<br />
• Substitute the values of a, h, and k into y a(x h) 2 k.<br />
292 5.5 Solving Problems Using Quadratic Relations Draft Evaluation Copy<br />
NEL
CHECK Your Understanding<br />
1. Use the given information to determine the equation of each quadratic<br />
relation in vertex form, y = a(x - h) 2 + k.<br />
a) a = 2, vertex at (0, 3) c) a = -1, vertex at (3, 2)<br />
b) a = -3, vertex at (2, 0) d) a = 0.5, vertex at (3.5, 18.3)<br />
2. Determine each maximum or minimum value in question 1.<br />
3. The centre arch of the bridge of this photo can be modelled by a parabola<br />
with equation y = -0.062x 2 . Two complete arches on a second bridge,<br />
farther up the river, can also be seen in this photo. Assuming that these<br />
two arches are congruent to the arch in the foreground, write an equation<br />
in vertex form to describe each of them.<br />
PRACTISING<br />
4. Determine the equation of a quadratic relation in vertex form,<br />
given the following information.<br />
a) vertex at (0, 3), passes through (2, 5)<br />
b) vertex at (2, 0), passes through (5, 9)<br />
c) vertex at (3, 2), passes through (1, 14)<br />
d) vertex at (5, 3), passes through (1, 8)<br />
5. Determine the equation of each parabola in vertex form.<br />
a) y<br />
c) y<br />
6<br />
6<br />
(4, 4)<br />
4<br />
4<br />
2<br />
(1, 0)<br />
-4<br />
0<br />
-2<br />
-2<br />
2 4<br />
(–1, –4)<br />
-6<br />
x<br />
2<br />
(2, 0) (6, 0) x<br />
0<br />
-2<br />
-2<br />
2 4 6 8<br />
-4<br />
-6<br />
4<br />
2<br />
5.5<br />
-5<br />
0<br />
5<br />
-2<br />
-4<br />
y<br />
x<br />
b)<br />
6<br />
y<br />
(6, 6)<br />
d)<br />
4<br />
2<br />
x<br />
0<br />
-2 2 4 6 8<br />
-2<br />
(4, –2)<br />
-4<br />
-6<br />
6<br />
y<br />
4<br />
(0, 4)<br />
2 (2, 2)<br />
-4<br />
0<br />
-2<br />
-2<br />
2 4<br />
-4<br />
-6<br />
x<br />
NEL Draft Evaluation Copy<br />
<strong>Chapter</strong> 5 293
6. Write each equation in question 5 in standard form and factored form.<br />
7. A quadratic relation has zeros at –2 and 8, and a y-intercept of 8.<br />
K Determine the equation of the relation in vertex form.<br />
8. The quadratic relation y = 2(x + 4) 2 - 7 is translated 5 units right<br />
and 3 units down. What is the minimum value of the new relation<br />
Write the equation of this relation in vertex form.<br />
9. Express each equation in standard form and factored form.<br />
a) y = (x - 4) 2 - 1 c) y = –(x + 5) 2 + 1<br />
b) y = 2(x + 1) 2 - 18 d) y = –3(x + 3) 2 + 75<br />
10. Express each equation in factored form and vertex form.<br />
a) y = 2x 2 - 12x<br />
c) y = 2x 2 - x - 6<br />
b) y = –2x 2 + 24x - 64 d) y = 4x 2 + 20x + 25<br />
11. A dance club has a $5 cover charge and averages 300 customers<br />
on Friday nights. Over the past several months, the club has changed<br />
the cover price several times to see how this affects the number<br />
of customers. For every increase of $0.50 in the cover charge,<br />
the number of customers decreases by 30. Use an algebraic model<br />
to determine the cover charge that maximizes revenue.<br />
18 m<br />
3 m 3 m<br />
12. The graph of y = -2(x + 5) 2 + 8 is translated so that its new zeros<br />
are 4 and 2. Determine the translation that was applied to the<br />
original graph.<br />
13. The average ticket price at a regular movie theatre (all ages) from 1995<br />
to 1999 can be modelled by C = 0.06t 2 - 0.27t + 5.36, where C<br />
is the price in dollars and t is the number of years since 1995 ( t = 0<br />
for 1995, t = 1 for 1996, and so on).<br />
a) When were ticket prices the lowest during this period<br />
b) What was the average ticket price in 1998<br />
c) What does the model predict the average ticket price will be<br />
in 2010<br />
d) Write the equation for the model in vertex form.<br />
14. A bridge is going to be constructed over a river. The underside of the<br />
A bridge will form a parabolic arch, as shown in the picture. The river is<br />
18 m wide and the arch will be anchored on the ground, 3 m back<br />
from the riverbank on both sides. The maximum height of the arch<br />
must be between 22 m and 26 m above the surface of the river. Create<br />
two different equations to represent arches that satisfy these conditions.<br />
Then use graphing technology to graph your equations on the same grid.<br />
294 5.5 Solving Problems Using Quadratic Relations Draft Evaluation Copy<br />
NEL
15. A movie theatre can accommodate a maximum of 350 moviegoers per<br />
day. The theatre operators have been changing the admission price to<br />
find out how price affects ticket sales and profit. Currently, they charge<br />
$11 a person and sell about 300 tickets per day. After reviewing their<br />
data, the theatre operators discovered that they could express the<br />
relation between profit, P, and the number of $1 price increases, x,<br />
as P = 20(15 - x)(11 + x) .<br />
a) Determine the vertex form of the profit equation.<br />
b) What ticket price results in the maximum profit What is the<br />
maximum profit About how many tickets will be sold at this price<br />
16. The underside of a bridge forms a parabolic arch. The arch has a<br />
maximum height of 30 m and a width of 50 m. Can a sailboat pass<br />
under the bridge, 8 m from the axis of symmetry, if its mast is 27 m<br />
above the water Justify your solution.<br />
17. A parabola has a y-intercept of 4 and passes through points (2, 8)<br />
T and (1, 1). Determine the vertex of the parabola.<br />
18. Serena claims that the standard form of a quadratic relation is best for<br />
C solving problems where you need to determine the maximum or<br />
minimum value, and that the vertex form is best to use to determine a<br />
parabola’s zeros. Do you agree or disagree Explain.<br />
5.5<br />
Extending<br />
19. The equation of a parabola is y = a(x - 1) 2 + q, and the points<br />
(1, 9) and (1, 1) lie on the parabola. Determine the maximum<br />
value of y.<br />
20. A rectangular swimming pool has a row of water fountains along<br />
each of its two longer sides. The two rows of fountains are 10 m<br />
apart. Each fountain sprays an identical parabolic-shaped stream<br />
of water a total horizontal distance of 8 m toward the opposite<br />
side. Looking from one end of the pool, the streams of water<br />
from the two sides cross each other in the middle of the pool<br />
at a height of 3 m.<br />
a) Determine an equation that represents a stream of water from<br />
the left side and another equation that represents a stream of<br />
water from the right side. Graph both equations on the same<br />
set of axes.<br />
b) Determine the maximum height of the water.<br />
8 m<br />
3 m<br />
10 m<br />
NEL Draft Evaluation Copy<br />
<strong>Chapter</strong> 5 295
YOU WILL NEED<br />
• graphing calculator<br />
Curious<br />
Math<br />
The Golden Rectangle<br />
The golden rectangle is considered one of the most pleasing shapes to the<br />
human eye. It is often used in architectural design, and it can be seen in<br />
many famous works of art. For example, the golden rectangle can be seen in<br />
Leonardo Da Vinci’s Mona Lisa and in The Parthenon in Athens, Greece.<br />
One of the properties of the golden rectangle is its dimensions. When it is<br />
divided into a square and a smaller rectangle, the smaller rectangle is similar<br />
to the original rectangle.<br />
Golden Rectangle<br />
1<br />
square<br />
smaller<br />
rectangle<br />
1<br />
x<br />
x 1<br />
The ratio of the longer side to the shorter side in a golden rectangle is<br />
called the golden ratio.<br />
If the length of the shorter side is 1 unit, and if x represents the length<br />
x<br />
of the longer side, then is also the value of the golden ratio. A<br />
1 = x<br />
quadratic relation can be used to determine the value of the golden ratio.<br />
1. Create a proportion statement to compare the golden ratio with the<br />
ratio of the lengths of the corresponding sides in the smaller rectangle.<br />
2. Substitute the values in the diagram into your proportion statement.<br />
Then rearrange your proportion statement to obtain a quadratic<br />
equation.<br />
3. Using graphing technology, graph the quadratic relation that<br />
corresponds to this equation.<br />
4. What feature of the graph represents the value of the golden ratio<br />
5. Use graphing technology to determine the value of the golden ratio,<br />
correct to three decimal places.<br />
296 Curious Math Draft Evaluation Copy<br />
NEL
5.6<br />
Connecting Standard<br />
and Vertex Forms<br />
GOAL<br />
Sketch or graph a quadratic relation with an equation of the form<br />
y ax 2 bx c using symmetry.<br />
YOU WILL NEED<br />
• grid paper<br />
• ruler<br />
INVESTIGATE the Math<br />
Many places hold a fireworks display on Canada Day. Clayton,<br />
a member of the local fire department, launches a series of rockets<br />
from a barge that is floating in the middle of the lake. Each rocket is<br />
choreographed to explode at the correct time. The equation<br />
h = -5t 2 + 40t + 2 can be used to model the height, h, of each rocket<br />
in metres above the water at t seconds after its launch. A certain rocket is<br />
scheduled to explode 3 min 21 s into the program.<br />
<br />
Assuming that the rocket will explode at its highest point, when<br />
should Clayton launch it from the barge so it will explode at the<br />
correct time<br />
A. What information do you need to determine so that you can model<br />
the height of the rocket<br />
B. Copy and complete the table of values at the right for the rocket. Then<br />
plot the points, and sketch the graph of this relation.<br />
C. What happens to the rocket between 8 s and 9 s after it is launched<br />
D. The axis of symmetry of a quadratic relation can be determined from<br />
the zeros. In this problem, however, there is only one zero because<br />
t 7 0. Suggest another way to determine the axis of symmetry.<br />
E. The rocket is 2 m above the water when it is launched. When will<br />
the rocket be at the same height again Write the coordinates of these<br />
two points.<br />
F. Consider the coordinates of the two points for part E. Why must the<br />
axis of symmetry be the same distance from both of these points<br />
What is the equation of the axis of symmetry<br />
Time (s) Height (m)<br />
0 2<br />
1 37<br />
2<br />
3<br />
4<br />
5<br />
6<br />
7<br />
8<br />
9<br />
G. How does knowing the equation of the axis of symmetry help you<br />
determine the vertex of a parabola What is the vertex of this parabola<br />
NEL Draft Evaluation Copy<br />
<strong>Chapter</strong> 5 297
H. When should Clayton launch the rocket to ensure that it explodes<br />
3 min 21 s into the program<br />
Reflecting<br />
I. Can you determine the maximum height of the rocket directly from<br />
the standard form of the quadratic relation h = -5t 2 + 40t + 2<br />
Explain.<br />
J. How did you determine the vertex, even though one of the zeros<br />
of the quadratic relation was unknown<br />
K. Write the quadratic relation in vertex form. How can you compare this<br />
equation with the equation given in standard form to determine<br />
whether they are identical<br />
APPLY the Math<br />
EXAMPLE 1<br />
Connecting the vertex form to partial factors of the equation<br />
Determine the maximum value of the quadratic relation y = -3x 2 + 12x + 29.<br />
Michelle’s Solution<br />
y = -3x 2 + 12x + 29<br />
I tried to factor the expression, but I couldn’t<br />
determine two integers with a product of<br />
(3) 29 and a sum of 12. This means that I can’t<br />
use the zeros to help me.<br />
y = x(-3x + 12) + 29<br />
When y = 29,<br />
29 = x(-3x + 12) + 29<br />
x = 0 or -3x + 12 = 0<br />
x = 0<br />
x = 4<br />
I had to determine the axis of symmetry, since the<br />
vertex (where the maximum value occurs) lies on it.<br />
To do this, I had to locate two points with the same<br />
y-coordinate. I removed a partial factor of x from<br />
the first two terms.<br />
I noticed that the y-value will be 29 if either factor<br />
in the equation equals 0. I decided to determine<br />
the two points on the parabola with a y-coordinate<br />
of 29 by setting each partial factor equal to 0 and<br />
solving for x.<br />
298 5.6 Connecting Standard and Vertex Forms Draft Evaluation Copy<br />
NEL
5.6<br />
45<br />
40<br />
35<br />
30<br />
25<br />
20<br />
15<br />
10<br />
y 3x 2 12x 29<br />
y<br />
y 29<br />
5<br />
x<br />
0<br />
-8 -6 -4 -2 2 4 6 8<br />
-5<br />
y 3x 2 12x<br />
(0, 29) and (4, 29) are on the graph of the original<br />
quadratic relation. This makes sense since the points<br />
(0, 0) and (4, 0) are the zeros of the translated graph.<br />
The equation of the axis of symmetry is<br />
x = 0 + 4 so x 2.<br />
2<br />
y = -3(2) 2 + 12(2) + 29<br />
y = -12 + 24 + 29<br />
y = 41<br />
The maximum value is 41.<br />
I knew that this would work because it was like<br />
translating the graph down 29 units to make the<br />
points with a y-coordinate of 29 turn into points<br />
with a y-coordinate of 0.<br />
This let me determine the zeros of the new<br />
translated graph.<br />
I noticed that the axis of symmetry was the same<br />
for the two graphs.<br />
These points are the same distance from the axis of<br />
symmetry. So, I know that the axis of symmetry is<br />
halfway between x 0 and x 4.<br />
I calculated the mean of the x-coordinates of these<br />
points to determine the axis of symmetry.<br />
The y-coordinate of the vertex is the maximum<br />
value because the graph opens downward. To<br />
determine the maximum, I substituted x 2 into<br />
y 3x 2 12x 29.<br />
EXAMPLE 2<br />
Selecting a partial factoring strategy to sketch the graph<br />
of a quadratic relation<br />
Express the quadratic relation y = 2x 2 + 8x + 5 in vertex form.<br />
Then sketch a graph of the relation by hand.<br />
Marnie’s Solution<br />
y = 2x 2 + 8x + 5<br />
y = x(2x + 8) + 5<br />
x = 0 or 2x + 8 = 0<br />
x = 0 x = -4<br />
The points (0, 5) and (4, 5) are on the parabola.<br />
This equation cannot be factored fully since you<br />
can’t determine two integers with a product of<br />
2 5 and a sum of 8. I removed a partial factor<br />
of x from the first two terms.<br />
I found two points with a y-coordinate of 5 by setting<br />
each partial factor equal to 0. Both of these points<br />
are the same distance from the axis of symmetry.<br />
NEL Draft Evaluation Copy<br />
<strong>Chapter</strong> 5 299
The axis of symmetry is x = -2.<br />
At the vertex,<br />
y = 2(-2) 2 + 8(-2) + 5<br />
y = -3<br />
The vertex of the parabola is at (2, 3).<br />
In vertex form, the equation of the parabola is<br />
y = 2(x + 2) 2 - 3.<br />
y 2x 2 8x 5<br />
y<br />
8<br />
6<br />
(–4, 5) (0, 5)<br />
4<br />
2<br />
x<br />
0<br />
-6 -4 -2 2 4<br />
-2<br />
(–2, –3) -4<br />
I found the axis of symmetry by calculating the<br />
mean of the x-coordinates of these points.<br />
Since the parabola is symmetric, the vertex is on<br />
the line x 2. I substituted this value into the<br />
relation.<br />
I know that the value of a is the same in standard<br />
form and vertex form. In this case, a 2.<br />
The parameter a is positive, so the parabola opens<br />
upward.<br />
I used the vertex and the two points I found, (0, 5)<br />
and (4, 5), to sketch the parabola.<br />
In Summary<br />
Key Idea<br />
• If a quadratic relation is in standard form and cannot be factored fully,<br />
you can use partial factoring to help you determine the axis of symmetry<br />
of the parabola. Then you can use the axis of symmetry to determine<br />
the coordinates of the vertex.<br />
Need to Know<br />
• If y ax 2 bx c cannot be factored, you can express the relation<br />
in the partially factored form y x(ax b) c. Then you can use this<br />
form to determine the vertex form:<br />
• Set x(ax b) 0 and solve for x to determine two points on the<br />
parabola that are the same distance from the axis of symmetry. Both<br />
of these points have y-coordinate c.<br />
• Determine the axis of symmetry, x h, by calculating the mean<br />
of the x-coordinates of these points.<br />
• Substitute x h into the relation to determine k, the y-coordinate<br />
of the vertex.<br />
• Substitute the values of a, h, and k into y a(x h) 2 k.<br />
300 5.6 Connecting Standard and Vertex Forms Draft Evaluation Copy<br />
NEL
CHECK Your Understanding<br />
1. Determine the equation of the axis of symmetry of a parabola that<br />
passes through points (2, 8) and (6, 8).<br />
2. Determine two points that are the same distance from the axis<br />
of symmetry of the quadratic relation y = 4x 2 - 12x + 5.<br />
3. Use partial factoring to determine the vertex form of the quadratic<br />
relation y = 2x 2 - 10x + 11.<br />
5.6<br />
PRACTISING<br />
4. A parabola passes through points (3, 0), (7, 0), and (9, 24).<br />
a) Determine the equation of the axis of symmetry.<br />
b) Determine the coordinates of the vertex, and write the equation<br />
in vertex form.<br />
c) Write the equation in standard form.<br />
5. For each quadratic relation,<br />
i) determine the coordinates of two points on the graph that are<br />
the same distance from the axis of symmetry<br />
ii) determine the equation of the axis of symmetry<br />
iii) determine the coordinates of the vertex<br />
iv) write the relation in vertex form<br />
a) y = (x - 1)(x + 7) d) y = x(3x + 12) + 2<br />
b) y = x(x - 6) - 8<br />
e) y = x 2 + 5x<br />
c) y = –2(x + 3)(x - 7) f) y = x 2 - 11x + 21<br />
6. The equation of one of these parabolas at the right is y = x 2 - 8x + 18.<br />
K Determine the equation of the other in vertex form.<br />
7. For each quadratic relation,<br />
i) use partial factoring to determine two points that are the same<br />
distance from the axis of symmetry<br />
ii) determine the coordinates of the vertex<br />
iii) express the relation in vertex form<br />
iv) sketch the graph<br />
a) y = x 2 - 6x + 5<br />
d) y = -x 2 - 6x - 13<br />
b) y = x 2 - 4x - 11 e) y = - 1 2 x 2 + 2x - 3<br />
c) y = -2x 2 + 12x - 11 f) y = 2x 2 - 10x + 11<br />
8. Use two different strategies to determine the equation of the axis<br />
C of symmetry of the parabola defined by y = -2x 2 + 16x - 24.<br />
Which strategy do you prefer Explain why.<br />
6<br />
y<br />
4<br />
2<br />
0<br />
-2<br />
-2<br />
2 4 6<br />
x<br />
NEL Draft Evaluation Copy<br />
<strong>Chapter</strong> 5 301
9. Determine the values of a and b in the relation y = ax 2 + bx + 7<br />
T if the vertex is located at (4, 5).<br />
10. Determine the values of a and b in the relation<br />
if the vertex is located at (1, 7).<br />
11. A model rocket is launched straight up, with an initial velocity<br />
of 150 m/s. The height of the rocket can be modelled by<br />
h = -5t 2 + 150t, where h is the height in metres and t is the elapsed<br />
time in seconds. What is the maximum height reached by the rocket<br />
12. A baseball is hit from a height of 1 m. The height, h, of the ball in<br />
A metres after t seconds can be modelled by h = -5t 2 + 9t + 1.<br />
Determine the maximum height reached by the ball.<br />
13. A movie theatre can accommodate a maximum of 450 moviegoers per<br />
day. The theatre operators have determined that the profit per day, P, is<br />
related to the ticket price, t, by<br />
. What<br />
ticket price will maximize the daily profit<br />
14. The world production of gold from 1970 to 1990 can be modelled by<br />
, where G is the number of tonnes of gold<br />
and t is the number of years since 1970 ( t = 0 for 1970, t = 1 for<br />
1971, and so on).<br />
a) During this period, when was the minimum amount of gold mined<br />
b) What was the least amount of gold mined in one year<br />
c) How much gold was mined in 1985<br />
G = 1492 - 76t + 5.2t 2 P = -30t 2 + 450t - 790<br />
15. Create a concept web that summarizes the different algebraic strategies<br />
you can use to determine the axis of symmetry and the vertex of a<br />
quadratic relation given in the form y = ax 2 + bx + c.<br />
Extending<br />
y = ax 2 + bx + 8<br />
16. A farmer has $3000 to spend on fencing for two adjoining rectangular<br />
pastures, both with the same dimensions. A local contracting company<br />
can build the fence for $5.00/m. What is the largest total area that<br />
the farmer can have fenced for this price<br />
17. A city transit system carries an average of 9450 people per day on its<br />
buses, at a fare of $1.75 each. The city wants to reduce pollution from<br />
cars and, at the same time, maximize the transit system’s revenue by<br />
increasing bus ridership. A survey shows that the number of riders will<br />
increase by 150 for every $0.05 decrease in the fare. What fare will<br />
result in the greatest revenue<br />
302 5.6 Connecting Standard and Vertex Forms Draft Evaluation Copy<br />
NEL
5 <strong>Chapter</strong> <strong>Review</strong><br />
FREQUENTLY ASKED Questions<br />
Q: What information do I need about the graph of a quadratic<br />
relation to write its equation in vertex form<br />
A: You can write the equation in vertex form if you know the coordinates<br />
of the vertex and one additional point on the graph.<br />
Q: What kinds of problems can you solve using the vertex<br />
form of a quadratic relation<br />
A: The vertex form of a quadratic relation is usually the easiest form to<br />
use when you need to determine the equation of a parabola of good<br />
fit on a scatter plot. The vertex form is also useful when you need to<br />
determine the maximum or minimum value of a quadratic relation.<br />
Q: How can you relate the standard form of a quadratic<br />
relation to its vertex form<br />
A: The standard form of a quadratic relation, y = ax 2 + bx + c, can<br />
be rewritten in vertex form if you know the value of a and the<br />
coordinates of the vertex:<br />
• If the quadratic relation can be written in factored form, you can<br />
determine the zeros by setting each factor equal to zero. Calculating<br />
the mean of the x-coordinates of the zeros gives you the axis of<br />
symmetry and the x-coordinate of the vertex. Substitute the<br />
x-coordinate of the vertex into the quadratic relation to determine<br />
the y-coordinate of the vertex.<br />
• If y = ax 2 + bx + c cannot be factored, you can use partial<br />
factoring to express the equation in the form y = x(ax + b) + c.<br />
Solving x(ax + b) = 0 gives two points with the same<br />
y-coordinate, c. Calculating the mean of the x-coordinates of these<br />
points gives you the axis of symmetry and the x-coordinate of the<br />
vertex. Substitute the x-coordinate of the vertex into the quadratic<br />
relation to determine the y-coordinate of the vertex.<br />
• If you graph y = ax 2 + bx + c using graphing technology, then<br />
you can approximate the vertex from the graph or determine it<br />
exactly, depending on the features of the technology.<br />
In all cases, after you know the vertex, you can use the value of<br />
a from the standard form of the relation to write the relation in vertex<br />
form, y = a(x - h) 2 + k.<br />
Study<br />
Aid<br />
• See Lesson 5.4,<br />
Examples 1 to 3.<br />
• Try <strong>Chapter</strong> <strong>Review</strong><br />
Questions 8 to 10.<br />
Study<br />
Aid<br />
• See Lesson 5.5,<br />
Examples 1, 2, and 4.<br />
• Try <strong>Chapter</strong> <strong>Review</strong><br />
Questions 11 to 13.<br />
Study<br />
Aid<br />
• See Lesson 5.5, Example 3,<br />
and Lesson 5.6,<br />
Examples 1 and 2.<br />
• Try <strong>Chapter</strong> <strong>Review</strong><br />
Questions 14 to 17.<br />
NEL Draft Evaluation Copy<br />
<strong>Chapter</strong> 5 303
PRACTICE Questions<br />
Lesson 5.1<br />
1. Write the equations of two different quadratic<br />
relations that match each description.<br />
a) The graph has a narrower opening than<br />
the graph of y = 2x 2 .<br />
b) The graph has a wider opening than<br />
the graph of y = -0.5x 2 .<br />
c) The graph opens downward and has a<br />
narrower opening than the graph of y = 5x 2 .<br />
2. The point ( p, q) lies on the parabola y = ax 2 . If<br />
you did not know the value of a, how could you<br />
use the values of p and q to determine whether<br />
the parabola is wider or narrower than y = x 2 <br />
Lesson 5.2<br />
3. Match each translation with the correct<br />
quadratic relation.<br />
a) 3 units left, 4 units down<br />
b) 2 units right, 4 units down<br />
c) 5 units left<br />
d) 3 units right, 2 units up<br />
i) y = (x - 3) 2 + 2 iii) y = (x - 2) 2 - 4<br />
ii) y = (x + 3) 2 - 4 iv) y = (x + 5) 2<br />
Lesson 5.3<br />
4. Which equation represents<br />
the graph shown Explain<br />
your reasoning.<br />
a)<br />
b)<br />
c)<br />
d)<br />
y = -3(x + 3) 2 + 8<br />
y = -3(x - 3) 2 + 8<br />
y = 3(x - 3) 2 - 8<br />
y = -2(x - 3) 2 + 8<br />
5. The parabola y = x 2 is transformed in two<br />
different ways to produce the parabolas<br />
y = 2(x - 4) 2 + 5 and y = 2(x - 5) 2 + 4.<br />
How are these transformations the same, and<br />
how are they different<br />
6. Blake rotated the parabola y = x 2 by 180° around<br />
a point. The new vertex is (6, -8). What is the<br />
equation of the new parabola<br />
8<br />
6<br />
4<br />
2<br />
-2<br />
0<br />
y<br />
x<br />
2 4 6<br />
7. Reggie used transformations to graph<br />
y = -2(x - 4) 2 + 3. He started by reflecting<br />
the graph of y = x 2 in the x-axis. Then he<br />
translated the graph so that its vertex moved to<br />
(4, 3). Finally, he stretched the graph vertically<br />
by a factor of 2.<br />
a) Why was Reggie’s final graph not correct<br />
b) What sequence of transformations should<br />
he have used<br />
c) Use transformations to sketch<br />
y = -2(x - 4) 2 + 3 on grid paper.<br />
Lesson 5.4<br />
8. Use the point marked on each parabola, as well<br />
as the vertex of the parabola, to determine the<br />
equation of the parabola in vertex form.<br />
a) b) c) d)<br />
y<br />
8<br />
4<br />
0<br />
-12 -8 -4 4<br />
-4<br />
-8<br />
x<br />
8 12<br />
9. Use the given information to determine the<br />
equation of each quadratic relation in vertex form.<br />
a) vertex at (-3, 2), passes through (-1, 4)<br />
b) vertex at (1, 5), passes through (3, -3)<br />
10. This table shows residential energy use by<br />
Canadians from 2002 to 2006, where<br />
1 petajoule equals 1 000 000 000 000 000 joules.<br />
Year<br />
Residential Energy Use<br />
(petajoules)<br />
2002 1286.70<br />
2003 1338.20<br />
2004 1313.00<br />
2005 1296.60<br />
2006 1250.30<br />
304 <strong>Chapter</strong> <strong>Review</strong><br />
Draft Evaluation Copy<br />
NEL
<strong>Chapter</strong> <strong>Review</strong><br />
a) Use technology to create a scatter plot and<br />
a quadratic regression model.<br />
b) Determine the vertex, and write the<br />
equation of the model in vertex form.<br />
c) According to your model, when was energy<br />
use at a maximum during this period<br />
Lesson 5.5<br />
11. Karla hits a golf ball from an elevated tee to the<br />
green below. This table shows the height of the<br />
ball above the ground as it moves through the air.<br />
Time (s)<br />
Height (m)<br />
0.0 30.00<br />
0.5 41.25<br />
1.0 50.00<br />
1.5 56.25<br />
2.0 60.00<br />
2.5 61.25<br />
3.0 60.00<br />
3.5 56.25<br />
4.0 50.00<br />
a) Create a scatter plot, and draw a curve of<br />
good fit.<br />
b) Estimate the coordinates of the vertex.<br />
c) Determine a quadratic relation in vertex<br />
form to model the data.<br />
d) Use the quadratic regression feature of<br />
graphing technology to create a model for<br />
the data. Compare this model with the<br />
model you created by hand for part c). How<br />
accurate is the model you created by hand<br />
12. A farming community collected data on the<br />
effect of different amounts of fertilizer, x, in<br />
100 kg/ha, on the yield of carrots, y, in tonnes.<br />
The resulting quadratic regression model is<br />
y = -0.5x 2 + 1.4x + 0.1. Determine the<br />
amount of fertilizer needed to produce the<br />
maximum yield.<br />
13. A local club alternates between booking live<br />
bands and booking DJs. By tracking receipts<br />
over a period of time, the owner of the club<br />
determined that her profit from a live band<br />
depended on the ticket price. Her profit, P, can<br />
be modelled using P = -15x 2 + 600x + 50,<br />
where x represents the ticket price in dollars.<br />
a) Sketch the graph of the relation to help the<br />
owner understand this profit model.<br />
b) Determine the maximum profit and the<br />
ticket price she should charge to achieve the<br />
maximum profit.<br />
14. For each quadratic relation,<br />
i) write the equation in factored form<br />
ii) determine the coordinates of the vertex<br />
iii) write the equation in vertex form<br />
iv) sketch the graph<br />
a)<br />
b)<br />
c)<br />
Lesson 5.6<br />
15. Express each quadratic relation in vertex form using<br />
partial factoring to determine two points that are<br />
the same distance from the axis of symmetry.<br />
a)<br />
b)<br />
c)<br />
d)<br />
y = x 2 - 8x + 15<br />
y = 2x 2 - 8x - 64<br />
y = -4x 2 - 12x + 7<br />
y = x 2 + 2x + 5<br />
y = -x 2 + 6x - 3<br />
y = -3x 2 + 42x - 147<br />
y = 2x 2 - 20x + 41<br />
16. Write each quadratic relation in vertex form<br />
using an appropriate strategy.<br />
a) y = x 2 - 6x - 8<br />
b) y = -2(x + 3)(x - 7)<br />
c) y = x(3x + 12) + 2<br />
d) y = -2x 2 + 12x - 11<br />
17. A punter kicks a football. The height, h, of the<br />
football in metres after t seconds can be modelled<br />
by h = -4.9t 2 + 22.54t + 1.1.<br />
a) What was the height of the football when<br />
the punter kicked it<br />
b) Determine the maximum height of the<br />
football, correct to one decimal place, and the<br />
time when it reached this maximum height.<br />
NEL Draft Evaluation Copy<br />
<strong>Chapter</strong> 5 305
5 <strong>Chapter</strong> Self-Test<br />
10<br />
y<br />
y x 2<br />
8<br />
6<br />
4<br />
2<br />
x<br />
-6 -4<br />
0<br />
-2<br />
-2<br />
2 4 6 8<br />
-4<br />
-6<br />
-8<br />
-10<br />
1. a) The black graph at the left resulted from transforming the green<br />
graph of y = x 2 . Determine the equation of the black graph.<br />
Explain your reasoning.<br />
b) State the transformations that were applied to the graph of y = x 2<br />
to result in the black graph.<br />
2. Determine the equation of each quadratic relation in vertex form.<br />
a) vertex at (7, 5), opens downward, vertical stretch of 4<br />
b) zeros at 1 and 5, minimum value of -12, passes through (6, 15)<br />
3. Sketch each quadratic relation by applying the correct sequence of<br />
transformations to the graph of y = x 2 .<br />
a) y = -2(x - 3) 2 + 8 b) y = 0.5(x + 2) 2 - 5<br />
4. The parabola y = x 2 is compressed vertically and translated down and<br />
right. The point (4, -10) is on the new graph. What is a possible<br />
equation for the new graph<br />
5. Accountants for the HiTech Shoe Company have determined that the<br />
quadratic relation P = -2x 2 + 24x - 54 models the company’s profit<br />
for the next quarter. In this relation, P represents the profit (in $100 000s)<br />
and x represents the number of pairs of shoes sold (in 100 000s).<br />
a) Express the equation in factored form.<br />
b) What are the zeros of the relation What do they represent<br />
in this context<br />
c) Determine the number of pairs of shoes that the company must sell<br />
to maximize its profit. How much would the maximum profit be<br />
6. A toy rocket that is sitting on a tower is launched vertically upward.<br />
The table shows the height, h, of the rocket in centimetres at t seconds<br />
after its launch.<br />
t (s) 0 1 2 3 4 5 6 7<br />
h (cm) 88 107 116 115 104 83 52 11<br />
a) Using a graphing calculator, create a scatter plot to display the<br />
data.<br />
b) Estimate the vertex of your model. Then write the equation of the<br />
model in vertex form and standard form.<br />
c) Use the regression feature on the graphing calculator to create a<br />
quadratic model for the data. Compare this model with the model<br />
you created for part b).<br />
d) What is the maximum height of the rocket When does the rocket<br />
reach this maximum height<br />
e) When will the rocket hit the ground<br />
306 <strong>Chapter</strong> Self-Test<br />
Draft Evaluation Copy<br />
NEL
5 <strong>Chapter</strong> Task<br />
Infectious Diseases: HIV/AIDS<br />
Every year, many people become infected with HIV. Over 90% of HIV<br />
infections in children in the United States are due to mother-to-child<br />
transmission at birth. The data in the table show the number of mother-tochild<br />
HIV infections diagnosed in the United States in various years from<br />
1985 to 2005.<br />
Year 1985 1987 1990 1993 1996 1998 2001 2003 2005<br />
Number of Cases 210 500 780 770 460 300 317 188 142<br />
<br />
What can we learn about the fight against HIV infections<br />
from the data<br />
A. Create a scatter plot to display the data. Why does a quadratic model<br />
make sense<br />
B. Determine an equation for this relation. Which form (standard, vertex,<br />
or factored) do you think is the best for these data Explain.<br />
C. Identify the transformations that you would apply to the graph of<br />
y = x 2 to obtain the model you created for part B.<br />
D. The decline in the number of mother-to-child HIV infections is due<br />
to the introduction of preventive drug therapies. Based on your model,<br />
when do you think an effective drug therapy was first introduced<br />
Explain your reasoning.<br />
E. Based on your model, will the number of HIV cases ever be reduced to<br />
zero If so, when might this occur Do you think your prediction is<br />
accurate Explain your reasoning.<br />
F. Suggest some reasons why a mathematical description of the data<br />
could be useful to researchers or government agencies.<br />
Task<br />
Checklist<br />
✔ Did you draw your graph<br />
accurately and label it<br />
correctly<br />
✔ Did you choose an<br />
appropriate graphing<br />
window to display your<br />
scatter plot<br />
✔ Did you show all the<br />
appropriate calculations<br />
✔ Did you explain your<br />
reasoning clearly<br />
NEL Draft Evaluation Copy<br />
<strong>Chapter</strong> 5 307
COMING MAY 2009!<br />
<strong>Nelson</strong> Principles of Mathematics 10 helps<br />
students build a solid foundation of learning for<br />
success in senior level courses.<br />
• Numerous worked examples with clear<br />
explanations provide support for students<br />
both in and out of the classroom<br />
• Four chapters on Quadratics with extensive<br />
support for skill development<br />
• “Frequently Asked Questions” section in<br />
every chapter provides accessible review<br />
• Achievement chart category questions<br />
identified in every lesson<br />
• 100% curriculum match<br />
New for<br />
MPM2D<br />
Table of Contents<br />
1. Systems of Linear Equations 7. Similar Triangles and Trigonometry<br />
2. Analytic Geometry: Line Segment and Circles 8. Acute Triangle Trigonometry<br />
3. Graphs of Quadratic Relations Appendix A: <strong>Review</strong> of Essential Skills and Knowledge<br />
4. Factoring Algebraic Expressions Appendix B: <strong>Review</strong> of Technical Skills<br />
5. Applying Quadratic Models Glossary<br />
6. Quadratic Equations Answers<br />
For more information, please contact your<br />
<strong>Nelson</strong> <strong>Education</strong> Sales Representative<br />
or Customer Support: 1-800-268-2222