No Border
No Border
No Border

You also want an ePaper? Increase the reach of your titles
YUMPU automatically turns print PDFs into web optimized ePapers that Google loves.
Nissin Food Products Co., Ltd., and Its Consolidated Subsidiaries<br />
Financial Highlights<br />
For the years ended March 31<br />
Net sales ¥ 316,973 ¥ 320,033 $2,951,606 –1.0<br />
Operating income 28,963 23,203 269,699 24.8<br />
Net income 16,612 14,051 154,689 18.2<br />
As of March 31<br />
Total assets ¥ 361,105 ¥ 343,645 $3,362,557 5.1<br />
Shareholders’ equity 258,139 244,439 2,403,753 5.6<br />
Per share (yen, U.S. dollars)<br />
Millions of yen Thousands of U.S. dollars Percent change<br />
2005 2004 2005 (%)<br />
Net income ¥ 134.36 ¥ 113.61 $ 1.25 18.2<br />
Cash dividends applicable to earnings of the year 30.00 30.00 0.28 —<br />
Shareholders’ equity 2,091.16 1,980.14 19.47 5.6<br />
Value & performance indicators 2005 2004 2003<br />
Operating margin (%) 9.1 7.3 8.4<br />
Return on assets (%) 4.7 4.2 4.4<br />
Return on equity (%) 6.6 5.9 6.2<br />
Inventory turnover (times) 12.9 13.6 13.6<br />
<strong>No</strong>tes: 1. U.S. dollar amounts represent translations of yen, for convenience only, at US$1 = ¥107.39,<br />
the approximate rate prevailing on March 31, 2005.<br />
2. Inventory turnover = Cost of sales / Average total inventory<br />
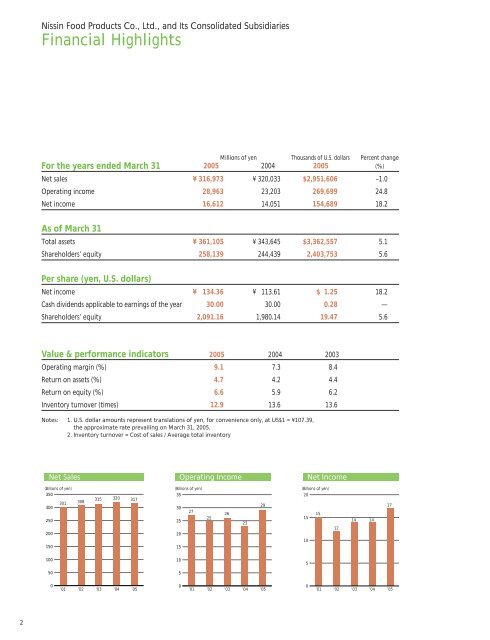
Net Sales Operating Income Net Income<br />
(Billions of yen) (Billions of yen) (Billions of yen)<br />
350<br />
35<br />
20<br />
315 320 317<br />
301 308<br />
29<br />
300<br />
30<br />
27<br />
26<br />
15<br />
250<br />
25<br />
25<br />
15<br />
23<br />
200<br />
20<br />
10<br />
150<br />
15<br />
12<br />
14 14<br />
17<br />
100<br />
50<br />
10<br />
5<br />
5<br />
0<br />
0<br />
0<br />
’01 ’02 ’03 ’04 ’05 ’01 ’02 ’03 ’04 ’05 ’01 ’02 ’03 ’04 ’05<br />
2