Download PDF version English(2664KB) - Hamon
Download PDF version English(2664KB) - Hamon
Download PDF version English(2664KB) - Hamon

Create successful ePaper yourself
Turn your PDF publications into a flip-book with our unique Google optimized e-Paper software.
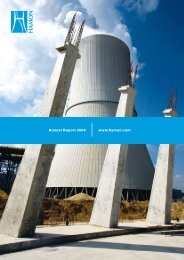
Annual report 2010<br />
www.hamon.com
2<br />
<strong>Hamon</strong> Annual Report 2010<br />
Part 1 - General presentation of the Group<br />
6 Key figures<br />
8 Discussion with Francis Lambilliotte<br />
12 Group profile<br />
14 Evolution of our markets<br />
16 Corporate Social Responsibility<br />
16 Introduction<br />
17 Social responsibilities<br />
20 Environmental responsibilities<br />
22 Statement of corporate governance<br />
22 Corporate governance<br />
29 Internal control and risk management systems<br />
33 Relations with our shareholders and other stakeholders<br />
36 Review of the year 2010<br />
Part 2 - Overview by Business Unit<br />
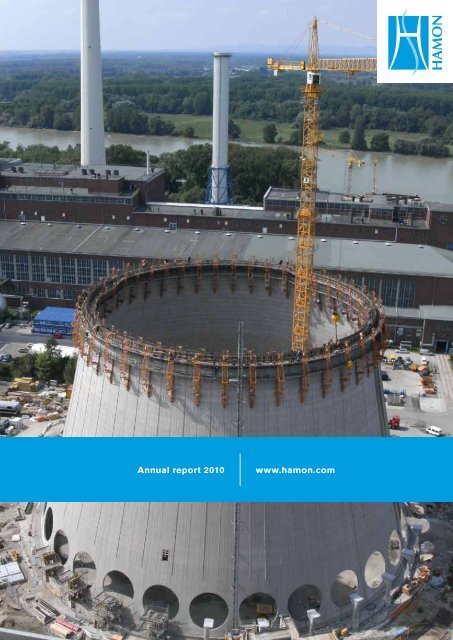
42 Cooling Systems<br />
44 Process Heat Exchangers<br />
46 Air Pollution Control EMEA / Brazil<br />
48 Air Pollution Control NAFTA<br />
50 Chimneys<br />
Part 3 - Financial statements<br />
54 Table of content<br />
56 Consolidated income statements<br />
56 Consolidated statements of comprehensive income<br />
57 Consolidated balance sheet<br />
58 Consolidated cash flow statements<br />
59 Consolidated statements of changes in equity<br />
60 Notes to the consolidated financial statements<br />
110 Auditor’s report on the consolidated financial statements<br />
112 Summarized statutory accounts of <strong>Hamon</strong> & Cie (International) SA<br />
Annexures<br />
114 Key performance indicators (Health & Safety and Environment)<br />
116 Report parameters<br />
118 GRI correspondence grid<br />
120 Glossary<br />
121 General information
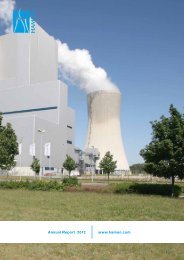
Annual report 2010<br />
www.hamon.com
Part 1
General presentation of the Group
6<br />
<strong>Hamon</strong> Annual Report 2010<br />
Key figures<br />
in EUR million 2010 2009 2008 2007 2006<br />
RATIOS<br />
EBIT / revenue 7,6% 10,2% 11,9% 10,0% 9,0%<br />
ROCE (1) 23,5% 53,9% 63,0% 57,8% 44,8%<br />
Debt / equity (2) 0,1 (0,1) 0,2 0,8 2,2<br />
Enterprise value / REBITDA (3) 7,6 4,4 3,3 7,8 6,5<br />
DATA PER SHARE (in EUR/share)<br />
Group’s share in net result for the year 1,62 2,42 2,57 2,54 2,19<br />
Net result from continued operations 1,83 2,54 2,87 2,72 2,50<br />
Equity (excl. Non-controlling interests) 11,07 9,00 6,77 4,74 3,16<br />
Gross dividend 0,60 0,60 0,57 0 0<br />
P/E (share price on 31.12) (4) 14,7 10,8 6,8 17,2 10,6<br />
Total weighted number of shares 7 191 472 7 191 472 7 191 472 7 191 472 5 948 680<br />
Total number of shares on 31.12 7 191 472 7 191 472 7 191 472 7 191 472 7 191 472<br />
Market capitalization<br />
on 31.12 (EUR million) 193,2 197,0 140,2 336,1 190,6<br />
Share closing price on 31.12 26,87 27,40 19,50 46,74 26,50<br />
Year average share closing price 28,00 23,76 29,79 38,66 13,93
Part 1 - General presentation of the Group<br />
7<br />
in EUR million 2010 2009 2008 2007 2006<br />
NEW ORDER BOOKINGS 449,7 301,5 469,5 435,0 422,3<br />
INCOME STATEMENT<br />
Revenue 345,5 379,8 366,7 432,6 354,4<br />
Recurrent EBITDA (5) 28,1 42,8 45,7 46,3 35,8<br />
EBIT (operating profit<br />
after non-recurring items) 26,1 38,8 43,7 43,4 32,0<br />
Net result from continued operations 13,2 18,3 20,7 19,6 14,9<br />
Net result of discontinued operations (0,0) (0,2) (1,8) (1,2) (1,8)<br />
Group’s share in net result for the year 11,6 17,4 18,5 18,3 13,0<br />
Cash flow (6) (1,5) 47,7 34,7 28,5 20,5<br />
BALANCE SHEET<br />
Non-current assets 110,5 88,4 66,8 57,0 59,9<br />
Available-for-sale financial assets 0,0 0,0 0,2 0,0 0,1<br />
Cash and cash equivalents 68,1 83,3 59,1 35,7 24,4<br />
Other current assets 158,3 135,2 159,5 142,2 127,9<br />
Total assets 336,9 306,9 285,6 234,8 212,4<br />
Equity (7) 86,1 65,8 49,4 34,4 19,1<br />
of which non-controlling interests 6,5 1,1 0,7 0,3 0,3<br />
Financial liabilities<br />
(current & non-current) 81,0 75,1 69,9 62,6 66,4<br />
Non-current provisions 4,5 5,0 3,9 3,6 4,2<br />
Other non-current liabilities 7,6 9,3 5,4 10,2 6,1<br />
Current liabilities (excl. Financial liabilities) 157,7 151,7 157,1 124,0 116,5<br />
Total equity and liabilities 336,9 306,9 285,6 234,8 212,4<br />
Net working capital (8) 0,6 (16,4) 2,4 18,2 11,3<br />
Net financial debts (9) 12,9 (8,2) 10,8 26,9 42,0<br />
Capital employed (10) 111,1 72,0 69,4 75,1 71,4<br />
Average staff number (yearly average) 1 221 1 140 1 015 912 779<br />
(1) EBIT / capital employed<br />
(2) Net financial debts / equity (incl. Non-controlling interests)<br />
(3) Enterprise value = 31.12 market capitalization + non-controlling interests + net financial debts - investment in associates<br />
(4) Share price on 31.12 / net result from continued operations (per share)<br />
(5) REBITDA = operating profit before depreciation, amortization and non-recurring items<br />
(6) Cash flow = net cash from operations after restructuring<br />
(7) Including non-controlling interest<br />
(8) Current assets (excluding Cash & cash equivalents) - non-financial current liabilities (continued operations only)<br />
(9) Borrowings - Cash & cash equivalents<br />
(10) Non-current assets + net working capital + net available-for-sale financial assets
8<br />
<strong>Hamon</strong> Annual Report 2010<br />
Discussion with Francis Lambilliotte<br />
“Keeping our international development on track,<br />
particularly in emerging markets, is our priority for<br />
2011. We have the experience, innovative products,<br />
and competent men and women in our teams to<br />
consolidate or even enhance a major and lasting<br />
breakthrough in countries where we aim to become<br />
a leading company. The outlook is optimistic for<br />
our long-term growth and gives legitimacy to<br />
our services.”
Part 1 - General presentation of the Group<br />
9<br />
Was 2010, as you anticipated at the end of 2009, a year of<br />
consolidation for the <strong>Hamon</strong> Group<br />
In some ways. Let me explain… The effects of the<br />
2008/2009 financial crisis lasted longer than predicted,<br />
especially in Europe, and the upturn – that we hoped<br />
would come early in 2010 – was a long time coming.<br />
In this context, our results were not as good as predicted<br />
in terms of sales, with revenues showing a 9% decrease<br />
compared to 2009 and a slump in EBIT (- 33%).<br />
2010 was therefore a lackluster year in terms of results.<br />
For the Group, convinced that the financial crisis is<br />
temporary and that the future starts here, our strategic<br />
decision was not to reduce the overheads or the most<br />
vital areas and to move our focus to emerging markets.<br />
This strategy was no doubt worthwhile as at the end<br />
of 2010 we took significantly large orders in these<br />
countries, particularly in India, Brazil and to a lesser<br />
extent in China, where we have strengthened our<br />
commercial presence.<br />
Speaking of the order book, was it conclusive for all your<br />
markets and operational units<br />
Our order book at the end of 2010, worth 490 million<br />
euro, is at an historic high! We have strengthened our<br />
activities relating to cooling systems as well as to a<br />
lesser extent, air pollution control systems. If we take a<br />
quick overview of the international situation, we have<br />
been awarded an important contract for the construction<br />
of two natural draft cooling towers for the Plant<br />
Vogtle nuclear power station, located in Waynesboro,<br />
United States; this project marks the official return of<br />
<strong>Hamon</strong> to the market for cooling systems in North<br />
America. In South America, our subsidiary has enjoyed<br />
great commercial success with the signing of a contract<br />
for air finned coolers for a new petrochemical plant. In<br />
India, our cooling activities have the wind in their sails,<br />
with orders for cooling towers for three coal-fired and<br />
natural gas-powered plants for Reliance. Another<br />
significant contract is for a second nuclear plant in<br />
China and there are also turnkey projects underway in
10<br />
<strong>Hamon</strong> Annual Report 2010<br />
R&D is another important development axis. Have you<br />
developed new products, processes or innovative techniques<br />
Our desire is to remain the leader in areas where<br />
<strong>Hamon</strong> excels and which have borne fruit. It is a<br />
challenge that we want to win, as it is an indication of<br />
future trends. We are investing a considerable amount<br />
of money in R&D. <strong>Hamon</strong> is currently number one in the<br />
world for wet cooling towers for electrical power plants<br />
and a leader in air pollution control systems and heat<br />
exchangers. In order to meet the innovation challenges,<br />
we have continued to invest in dry cooling in 2010:<br />
technological and commercial developments, new tools,<br />
efficient fabrication plants, etc. All the assets are in<br />
place to ensure our commercial success.<br />
Has the establishment of a Sustainable Development Charter<br />
had a profound influence on the way you work<br />
Corporate Social Responsibility has become an<br />
essential part of the route to clean energy that we are<br />
constructing. In each of our units and subsidiaries, the<br />
men and women who make up our teams as well as our<br />
partners are involved in sustainable development<br />
activities. However, raising people’s awareness on a<br />
daily basis, in their acts and their work methods, takes<br />
time and progresses slowly... Respect for the ethical<br />
code, standards relating to work, heath and the environment,<br />
their dissemination, measures of control at regular<br />
intervals and the resulting corrective actions go hand in<br />
hand with our sustainable development policy.<br />
How do you communicate the connection between <strong>Hamon</strong>’s<br />
activities and sustainable development<br />
Korea… These promising contracts enable us to<br />
approach the future with determination for the period<br />
2011-2013!<br />
India, China, Korea, Brazil… Will <strong>Hamon</strong>’s growth be<br />
focused on emerging countries from now on<br />
This is a fact! Our results confirm it: Asia, for example,<br />
has increased from 14% to almost 30% of our total<br />
new order bookings in 2010. We will continue to apply<br />
our know-how to emerging countries, particularly by<br />
introducing new technologies, increasing our commercial<br />
presence and strengthening our local teams, while<br />
maintaining our market shares in Western countries.<br />
We have always practiced sustainable development in<br />
our activities, without saying it explicitly and without really<br />
being conscious of it, no doubt. Now, we must say it,<br />
communicate it. This year we decided to implement the<br />
recent regulation ISO 26000 on Corporate Social<br />
Responsibility, which will be explained later in this report.<br />
We also incorporated the guidelines from the Global<br />
Reporting Initiative (GRI), an international body which has<br />
developed a standardized framework for reporting on<br />
sustainable development; we have also selected a series<br />
of performance indicators and quality standards for the<br />
management and dissemination of information. It is<br />
important that we explain in a transparent manner the<br />
way in which <strong>Hamon</strong> carries out its activities and share<br />
our vision of financial as well as non-financial matters.<br />
We also want to highlight <strong>Hamon</strong>’s relationship with the<br />
environment, its social responsibility in relation to its<br />
employees, partners, local communities, respect for<br />
human rights, etc. At <strong>Hamon</strong>, we are keen to show that<br />
profitability, efficiency and social objectives are compatible.
Part 1 - General presentation of the Group<br />
11<br />
Uncovering new talent is most likely an essential factor for<br />
the Group…<br />
Managing human resources, particularly in emerging<br />
countries, has become a crucial issue. Developing local<br />
skills and constantly training people are central to our<br />
priorities in order to meet tomorrow’s new challenges.<br />
The demand of companies in emerging countries<br />
looking for ever more qualified and motivated employees,<br />
in growing markets, is rapidly increasing. The recent<br />
boom in India is a good example. To adapt to this<br />
evolution, we will do everything possible to attract<br />
good employees, who share the same culture of<br />
professionalism, which is inherent in the Group. With<br />
this in mind, <strong>Hamon</strong> as an employer is committed to<br />
the principle of equal opportunities in the workplace.<br />
Is the message to your shareholders in 2011 one of optimism<br />
and confidence<br />
I will conclude by saying that 2010 was a year of<br />
transition. We have prepared for the future by applying<br />
our technological know-how and using or geographical<br />
diversity. In the last quarter of 2010 we were already<br />
reaping the fruits of this policy. When I travel, I sense<br />
that there is a huge potential for our products. We will<br />
therefore continue to invest in emerging countries with<br />
client partners hungry for technology and international<br />
experience. Keeping profitability on track is our priority<br />
for 2011. We have, I believe, the right commercial<br />
approach, innovative products and expertise to achieve<br />
a major breakthrough in countries where our ambition is<br />
to be a leading company.<br />
What is the challenge for 2011<br />
In fast-growing national markets, local companies in<br />
emerging countries are riding an unprecedented wave<br />
of growth, enabling them to gain experience and<br />
standing. The challenge for 2011 is to be better than<br />
our local competitors and to win market shares in these<br />
countries – a challenge that does not scare us!
12<br />
<strong>Hamon</strong> Annual Report 2010<br />
<strong>Hamon</strong> in the world<br />
Plant<br />
Office<br />
R&D Center<br />
Group profile<br />
<strong>Hamon</strong> is one of the leaders in its niche markets,<br />
related to environment protection and energy.<br />
Positioning<br />
<strong>Hamon</strong>, an international engineering and contracting<br />
company (EPC), is positioned as one of the world leaders,<br />
both for equipment and aftermarket sales and service in<br />
the following niche markets:<br />
■ Cooling systems<br />
■ Air Pollution Control systems<br />
■ Process Heat Exchangers<br />
■ Industrial chimneys<br />
The services offered to clients include design, manufacture<br />
of certain key components, project management,<br />
on-site installation (including civil works in some cases),<br />
start-up and aftermarket sales and service.<br />
The main clients are principally:<br />
■ Electric power plants<br />
■ Oil, gas and petrochemical industries<br />
■ Other heavy industries including steel, cement,<br />
minerals, glass, waste incineration.<br />
<strong>Hamon</strong> offers its customers innovative systems that use<br />
the latest technology at competitive prices and that<br />
effectively respond to their needs, all within strict cost<br />
control.<br />
Vision – Mission - Values<br />
Vision<br />
To be the leading provider of technology and equipment,<br />
enabling our customers to produce cleaner energy and to<br />
maintain the air quality while they operate.
Part 1 - General presentation of the Group<br />
13<br />
<strong>Hamon</strong> in Europe<br />
2. Respect for others<br />
<strong>Hamon</strong> respects the Universal Declaration of Human Rights<br />
and aims to foster a positive relationship with its teams.<br />
3. Respect for the environment<br />
Environment protection is at the heart of <strong>Hamon</strong>’s<br />
activities and services.<br />
4. Respect for cultural diversity<br />
<strong>Hamon</strong> promotes cultural diversity in its working<br />
relationships with partners, teams and local communities<br />
all around the world.<br />
Our presence in the world<br />
In 2010, <strong>Hamon</strong> employed 1 221 people in about 20<br />
countries and on the five continents across the world.<br />
Let us mention that among these countries, none<br />
appears on the list of fragile states / territories<br />
published by the World Bank. Moreover, several hundred<br />
other people are hired on limited duration contracts<br />
(most notably on job sites). In 2010, the Group revenue<br />
amounted to EUR 346 million. See the other key figures<br />
presented in the first pages of this annual report.<br />
<strong>Hamon</strong> shares are listed on the Euronext stock<br />
exchange of Brussels, since 1997.<br />
Sales breakdown by region (2010)<br />
Mission<br />
■ Develop new technologies, design, install and provide<br />
an after-sales service for key components of cooling<br />
systems, heat exchangers, air pollution control<br />
systems and chimneys.<br />
■ Improve our customers’ performance in the energy, oil<br />
and gas sectors and other heavy industries, such as<br />
steel, glass, cement, etc.<br />
■ Execute all of our projects on time, within the given<br />
budget and in line with the customer’s specifications.<br />
■ Provide a quality service for all of our activities, while<br />
ensuring the satisfaction and development of staff,<br />
respect for the environment and offering shareholders<br />
a return at least equal to the market rate.<br />
14,3%<br />
10,4%<br />
11,0%<br />
28,3%<br />
36,0%<br />
Values<br />
1. Professionalism<br />
<strong>Hamon</strong> attaches great importance to the innovation and<br />
performance of the services and products it provides its<br />
customers.<br />
Europe<br />
North America<br />
Asia-Pacific<br />
Middle East & Africa<br />
Other America’s
14<br />
<strong>Hamon</strong> Annual Report 2010<br />
New order bookings by industry, in EUR million.<br />
Breakdown of sales by business unit, in EUR million.<br />
500<br />
500<br />
400<br />
17%<br />
19%<br />
400<br />
300<br />
200<br />
100<br />
29%<br />
54%<br />
5%<br />
5%<br />
37%<br />
53%<br />
17%<br />
64%<br />
300<br />
200<br />
100<br />
25%<br />
21%<br />
10%<br />
13%<br />
30%<br />
19%<br />
18%<br />
10%<br />
14%<br />
38%<br />
15%<br />
13%<br />
21%<br />
12%<br />
37%<br />
0<br />
2008<br />
2009 2010<br />
0<br />
2008<br />
2009 2010<br />
Incineration<br />
Other Industries<br />
Oil and Gas<br />
Power generation<br />
Chimneys<br />
Air Pollution Control NAFTA<br />
Air Pollution Control EMEA / Brazil<br />
Process Heat Exchangers<br />
Cooling Systems<br />
Evolution of our markets<br />
During the first three quarters of 2010, the markets<br />
in which <strong>Hamon</strong> operates experienced a slowdown<br />
and delays in the placement of orders, particularly<br />
in developed economies.<br />
Major markets for <strong>Hamon</strong><br />
The main clients (end users) of the <strong>Hamon</strong> Group are<br />
producers of electricity, followed by the oil and gas<br />
industries, as shown in the graph above. These are<br />
followed by other heavy industries, such as steel,<br />
non-ferrous metals, household waste incineration,<br />
cement, chemicals, etc. It is worth noting that orders are<br />
split between new installations and after-sales service.<br />
For a breakdown by geographical area, see the previous<br />
section on the Group profile. We are observing that an<br />
increasing number of orders come from Asia and other<br />
emerging countries. As previously mentioned, <strong>Hamon</strong>’s<br />
main activities are cooling systems and air pollution<br />
control, as shown in the graph above.<br />
Markets affected by the general economic<br />
conditions in 2010, particularly in developed<br />
countries<br />
After a downturn of approximately 2% in 2009, the<br />
global economy began to grow again in 2010, with a<br />
growth rate of almost 5% worldwide. This was weaker<br />
in developed countries (2% to 3%) and significantly<br />
higher in emerging economies, particularly South<br />
America and Asia (e.g. +10% in China, +9% in India).<br />
Developed countries (Europe in particular) were<br />
affected by the budget and financial crisis and many<br />
had to adopt measures to reduce their budget deficits.<br />
This led to a decline in investments in infrastructure<br />
(new power plants) and in spending on environmental<br />
protection. In some countries (including Germany and<br />
Belgium) the governments have increased the tax on<br />
electrical utilities. In addition, the consequences of the<br />
2008-2009 crisis continue to have an impact on the<br />
funding of certain projects. In some developed countries<br />
we have seen a new slowdown in growth during<br />
the second half year of 2010.
Part 1 - General presentation of the Group<br />
15<br />
Despite the economic recovery, new orders have been<br />
slow to materialize in our markets in 2010. Customers<br />
are cautious and take longer to decide on major<br />
investment projects. We should mention however than<br />
in this rather sluggish economy, <strong>Hamon</strong> made the best<br />
of a bad situation and took an increasing number of<br />
orders compared to 2009 (see Review of the year<br />
2010). After a slight upturn during the second half year<br />
of 2009, our markets slowed down again in the first half<br />
year of 2010 (“double dip” scenario). Overall, during the<br />
first nine months of 2010 the major engineering<br />
companies saw their orders decrease by approximately<br />
15% compared to the same period in 2009. The<br />
decrease is mostly the result of a reduction in the<br />
number of major projects. However, we experienced an<br />
increase during the second half year of 2010. In<br />
conclusion, the markets remain very volatile and their<br />
evolution is difficult to predict. We should also note that<br />
our markets generally react six to twelve months after<br />
the change in the economy. Lastly, it should be noted<br />
that in contrast to 2009, many major engineering<br />
companies started 2010 with a rather empty order<br />
book, which intensified the competition.<br />
After-sale service is a lot less volatile and less affected<br />
by economic fluctuations. In developed countries, the<br />
market for the repairing of existing units is also relatively<br />
stable and significant in size.<br />
We are noticing more and more that in developed<br />
economies, engineering companies are selling contracts<br />
for repair, replacement or improvement works for<br />
existing units, while in emerging countries it is often<br />
new units that are being built.<br />
The United States is still affected by the absence of an<br />
energy policy and a clear regulatory framework,<br />
following the rejection of the “Energy Bill” by the<br />
American Congress. As the current government has lost<br />
its majority in the House of Representatives, nothing is<br />
likely to change before the end of 2012. However, the<br />
rapidly growing emerging economies have major plans<br />
for the construction of new electrical power stations,<br />
such as China (among others for nuclear power<br />
stations) and India.<br />
Investments linked to the oil, gas and petrochemical<br />
sectors were boosted by the increase in the price of oil,<br />
which rose from USD 80 per barrel at the start of 2010<br />
to approximately USD 90 at the start of 2011. Numerous<br />
projects are underway, particularly in emerging<br />
countries (e.g. Asia, Middle East, Brazil).<br />
The trend is similar in other heavy industries (metals,<br />
cement, glass, etc.); the markets have been strong<br />
particularly in emerging countries, which have seen an<br />
increase in the prices of numerous raw materials and a<br />
high demand from China, among others, which had a<br />
positive influence on investments.<br />
Lastly, we should also note that the U.S. dollar has risen<br />
against the Euro in 2010 (USD/EUR 1,325 against<br />
1,394 on average in 2009), which effectively increases<br />
the numbers from the American market expressed in<br />
Euros. The price of the main raw materials (steel,<br />
aluminum, etc.) also increased in 2010, which consequently<br />
increased the unit price of each plant.<br />
In terms of the market for electrical power plants,<br />
investments in new plants are at a low level in Europe<br />
(moderate in Germany) and in the United States, due to<br />
the stagnation of the demand for electricity. In some<br />
European countries, the development of renewable<br />
energy has more than offset the need for new production<br />
units. However, the development of renewable<br />
energy should slow down as a number of governments<br />
have reduced their funding and grants for this sector.<br />
Eventually, the development of smart grids should also<br />
reduce the needs of new large power plants. We should<br />
also point out that environmental pressures have also<br />
been detrimental to some construction projects for<br />
thermal power stations (especially coal-fired power<br />
stations in Germany). However, projects involving<br />
natural gas have not seen any impact as this fuel has a<br />
high-energy performance (combined cycles) and the<br />
gas supply has significantly increased in some regions<br />
(particularly in the United States: shale gas).
16<br />
<strong>Hamon</strong> Annual Report 2010<br />
<strong>Hamon</strong> DGE team during the <strong>Hamon</strong> event organized at the Shanghai 2010 Exhibition<br />
Corporate Social Responsibility<br />
I. Introduction<br />
In 2010 and as announced in our previous report,<br />
<strong>Hamon</strong> has formalized and further focused its activities<br />
on a sustainable development-based ethos. <strong>Hamon</strong>’s<br />
approach aims to analyze, measure and take its share of<br />
Corporate Social Responsibility. To this end it has<br />
decided to take inspiration from new international<br />
standard, ISO 26000 guidance for Corporate Social<br />
Responsibility, adopted by around 100 countries in<br />
November 2010. The objective is to align <strong>Hamon</strong>’s<br />
strategy on compliance with the principles and fields of<br />
action contained in this guidance. The main subjects<br />
covered by ISO 26000 are:<br />
■ Organizational governance<br />
■ Human rights<br />
■ Labor practices<br />
■ The environment<br />
■ Fair operating practices<br />
■ Consumer issues<br />
■ Community involvement and development<br />
As recommended by ISO 26000, <strong>Hamon</strong> has also<br />
decided to base its approach on the methodology<br />
developed by the Global Reporting Initiative (GRI) in<br />
order to measure and account for its performance on<br />
Corporate Social Responsibility. The aim of the GRI,<br />
an international body based in Amsterdam, is to provide<br />
all organizations of any size, geographic location and<br />
sector with a reliable, credible and standardized<br />
framework for reporting on sustainable development,<br />
following the example of the IAS/IFRS standards in the<br />
financial sector.<br />
The GRI methodology consists of three main elements:<br />
■ Strategy and profile<br />
■ Management approach and commitments<br />
■ Performance indicators<br />
The standardized GRI correspondence grid reproduced<br />
at the end of this report enables readers to find the<br />
information they are looking for using a standard list.<br />
The performance indicators set out by the GRI cover six<br />
main areas:
Part 1 - General presentation of the Group<br />
17<br />
■ Economic performance (much detailed in other parts<br />
of this annual report)<br />
■ Environmental performance<br />
■ Social performance in relation to labor practices<br />
■ Social performance in relation to human rights<br />
■ Society performance and relationship with the<br />
community<br />
■ Performance in relation to the transparency of<br />
information on products<br />
Launching a reporting process in accordance with<br />
the GRI’s recommendations demands a substantial<br />
amount of work. This is why the GRI recommends<br />
that organizations improve their reporting over time,<br />
via different application levels. In this first year, <strong>Hamon</strong><br />
has met the objectives of level C of the GRI (self-declared).<br />
For more information about the GRI, visit:<br />
www.globalreporting.org.<br />
Through this annual report, we want to inform our<br />
stakeholders, in the most transparent way possible, of<br />
our performance and the measures we are gradually<br />
taking to improve. The parameters for each of the<br />
performance indicators are detailed in the section<br />
“Report parameters” at the end of this document. In<br />
order to match our actions with our words, <strong>Hamon</strong> is<br />
introducing action plans so that our performance<br />
improves, as well as internal control mechanisms to<br />
ensure that the subsidiary companies report on the<br />
indicators in an accurate and comprehensive manner.<br />
We also want to systematize our subsidiaries’ external<br />
certification processes, be it in relation to quality (ISO<br />
9001), health and safety (OHSAS 18001), or environment<br />
(ISO 14001).<br />
As our economic performance has generally been<br />
discussed in other parts of this annual report, here is<br />
a summary of <strong>Hamon</strong>’s position in terms of its responsibilities<br />
and performance in social and environmental<br />
areas.<br />
II. Social responsibilities<br />
The men and women who contribute on a daily basis to<br />
the success of <strong>Hamon</strong> are our main resource. They<br />
deserve all our attention. This is why we will dedicate<br />
this section mainly to our internal social responsibilities.<br />
Headcount<br />
The average Group headcount in 2010 was 1 221<br />
employees, which is 81 people more than in 2009<br />
(+7%). In addition to this figure are the temporary<br />
on-site workers; in 2010 this represented around 500<br />
people on average (the number constantly fluctuates).<br />
Average headcount per BU 2010 2009 2008<br />
Cooling Systems 547 482 432<br />
Process Heat Exchangers 161 174 170<br />
Air Pollution Control EMEA/Brazil 220 172 112<br />
Air Pollution Control NAFTA 124 147 175<br />
Chimneys 53 56 63<br />
Corporate & others 116 109 63<br />
Total 1 221 1 140 1 015<br />
■ These figures include the staff from (1) fully consolidated<br />
subsidiaries and (2) subsidiaries consolidated<br />
by proportionate integration on a pro rata basis of the<br />
capital held by <strong>Hamon</strong>.<br />
■ These figures are based on full-time equivalents and<br />
only include staff on open-ended contracts.<br />
■ In addition to these figures, <strong>Hamon</strong> also employs a<br />
few hundred temporary workers (local labor), mainly<br />
at its erection sites. Located around the world,<br />
these projects generally last a few months. In 2010,<br />
approximately 500 people were employed to work at<br />
the sites.<br />
In terms of business units, the main variations come<br />
from:<br />
■ Air Pollution Control EMEA/Brazil, which has seen a<br />
28% increase in the number of staff, as a result of the<br />
acquisition of Enviroserv (Germany) in 2010, the<br />
global consolidation of <strong>Hamon</strong>’s Chinese subsidiaries<br />
DGE and TS Filtration over 12 months in 2010<br />
(compared to only six months in 2009), and the<br />
acquisition of J&C Engineering (South Africa) as of<br />
1 October 2010.<br />
■ Cooling Systems, which has seen a 13% increase in<br />
the number of staff, as a result of the strong growth<br />
of our Indian JV, <strong>Hamon</strong> Shriram Cottrell, and of our<br />
subsidiary <strong>Hamon</strong> UK, as well as the development of<br />
our dry cooling activities, including the opening of a<br />
Chinese subsidiary Research-Cottrell Cooling (Tianjin),<br />
among others.<br />
■ On the other hand, our two North-American BUs have<br />
seen a reduction in their number of staff (5% in<br />
Chimneys and 16% in Air Pollution Control NAFTA),<br />
to compensate for their lower level of activity in 2010.<br />
■ The reduction in relation to the Process Heat<br />
Exchangers BU is a result of Brown Fintube France<br />
leaving the consolidation perimeter from 1 July 2010.<br />
These different variations in the Business Units explain<br />
the net increase in the number of staff working for the<br />
Group.
18<br />
<strong>Hamon</strong> Annual Report 2010<br />
Average headcount per region 2010 2009 2008<br />
Europe 674 647 560<br />
North America 192 209 241<br />
Australia & Asia 275 214 173<br />
Africa 31 24 22<br />
Others Americas 49 46 19<br />
Total 1 221 1 140 1 015<br />
In terms of regions, the number of staff has mainly<br />
increased in:<br />
■ Asia (+29%), due to the developments at <strong>Hamon</strong><br />
Shriram Cottrell, the opening of Research-Cottrell<br />
Cooling (Tianjin) and the consolidation over a<br />
12-month period of <strong>Hamon</strong> DGE and TS Filtration<br />
■ In Africa (+30%), due to the acquisition of J&C<br />
Engineering.<br />
These figures illustrate <strong>Hamon</strong>’s strategy to further<br />
develop our operations outside of Europe and North<br />
America, which has been underway for a few years.<br />
Average headcount<br />
per category 2010 2009 2008<br />
Management 48 46 39<br />
Employees 709 652 582<br />
Workers 464 442 394<br />
Total 1 221 1 140 1 015<br />
Lastly, if we examine the categories of employees,<br />
we can see that the increase has mainly affected<br />
employees, and to a lesser extent workers.<br />
As at 31 December 2010, the total number of staff<br />
(open-ended contracts) came to 1 215 people,<br />
comprising 988 men and 227 women.<br />
Recruitment<br />
<strong>Hamon</strong> prides itself on recruiting high-caliber employees.<br />
In each country where we operate, our policy is aimed<br />
at recruiting local personnel. We also have a very small<br />
number of expatriate executives in relatively new<br />
subsidiaries or those that have grown significantly over<br />
recent years. The aim is to support their development<br />
and to promote <strong>Hamon</strong>’s experience and best practices.<br />
The number of expatriates is marginal – it represents<br />
approximately 0,5% of total employees in the Group<br />
and approximately 6,5% of employees in management<br />
positions.<br />
Training<br />
An important factor in contributing to the development<br />
of our staff and to their satisfaction is to give each<br />
employee the training that he or she needs. Through<br />
different programs we have provided more than 13 000<br />
hours of training in 2010, which is 14 hour/year per<br />
person for the considered perimeter (see Report<br />
parameters). In addition to this formal training (covering<br />
health and safety, the use of our new ERP tool which<br />
is gradually being implemented, technical training<br />
sessions, etc), our employees are also given more<br />
informal training, which is a kind of mentoring or tuition<br />
specific to their role and based on different projects<br />
they are involved in.<br />
Healthy and safety<br />
The health and safety of our staff in the work place<br />
continues to be a priority, be it in factories, offices or<br />
on-site. On-site work presents specific risks that are<br />
difficult to fully overcome. <strong>Hamon</strong> is adopting measures<br />
to improve the situation.<br />
For more information, see the section detailing the key<br />
performance indicators for Health and safety and<br />
Environment in the annexures.<br />
We are also working towards OHSAS 18001 certification<br />
for health and safety. At present, four subsidiaries have<br />
attained OHSAS 18001 certification, one is SCC<br />
certified (“SHE Checklist Contractor”) and one is<br />
NOSA certified in South Africa (out of the 19 main<br />
subsidiaries considered). The process is underway in<br />
other subsidiaries.<br />
It is also of note that our American subsidiary <strong>Hamon</strong><br />
Custodis was given an award for excellence (Certificate<br />
of Achievement for Construction Safety Excellence)<br />
from its customer Southern Company for projects<br />
carried out in 2010. <strong>Hamon</strong> Research-Cottrell USA also<br />
received an award in 2010, the “Lifetime Achievement<br />
Award” from the American Lung Association, for its<br />
great contribution to improving the air quality in the<br />
United States.<br />
Ethics<br />
Founded on respect for values and with family traditions<br />
having contributed to its history and development,<br />
<strong>Hamon</strong> continues to promote its code of ethics at the
Part 1 - General presentation of the Group<br />
19<br />
Workers installing the electrodes of an ESP in an Eskom power plant, South Africa<br />
heart of its working relations. In this regard, 2010 was<br />
marked by several specific initiatives:<br />
■ Commitment to respect the Universal Declaration of<br />
Human Rights. In January 2011, the 19 subsidiaries<br />
included in the parameter in the section “Report<br />
parameters” comply with this Declaration (in so far as<br />
the legislation in place in the respective countries<br />
allows them to).<br />
■ Commitment to not employ children (the definition of<br />
the term child depends on the country and sometimes<br />
the type of activity). The areas identified as presenting<br />
the biggest risks concerning child labor are our<br />
factories in India (Umbergaon) and in China (Jiaxing,<br />
Shanghai and Wuqing from 2011). For <strong>Hamon</strong>, in early<br />
2011, none of the 19 subsidiaries included employed<br />
people under the age of 18.<br />
■ Distribution of the <strong>Hamon</strong> Code of Ethics to all of our<br />
managers and employees. A summary of this Code is<br />
available on our website: www.hamon.com.<br />
Over time these commitments are gradually incorporated<br />
into the Group’s working methods and shared with all<br />
<strong>Hamon</strong>’s subsidiaries. We also want to establish<br />
adequate internal control measures. It should be noted<br />
that within the framework of a sustainable procurement<br />
policy, we are working to ensure that our commitments<br />
are passed on to our suppliers. Therefore, through<br />
our general purchasing conditions, we ask that they<br />
respect the social regulations in force and do not<br />
employ children.<br />
Other initiatives carried out in 2010<br />
Among a number of initiatives carried out in 2010 was<br />
an extensive staff satisfaction survey in the United<br />
States. The results of the survey were analyzed in detail<br />
in order to address the main concerns and to devise<br />
appropriate action plans. The main points that came to<br />
light are:<br />
■ <strong>Hamon</strong> U.S. is recognized as a reputable employer;<br />
it pays its staff well and clearly defines and<br />
communicates its strategy and responsibilities.<br />
■ Areas for improvement are the training and management<br />
of individual performances; the management is<br />
working to address this.<br />
Other projects also underway among some subsidiaries<br />
of the Group include:<br />
■ An analysis of the competitiveness of our pay<br />
packages in comparison to the market practices.<br />
■ Classification of roles.
20<br />
<strong>Hamon</strong> Annual Report 2010<br />
<strong>Hamon</strong> Shriram Cottrell managers and stand at the Power Gen India exhibition<br />
■ Improvement of our systems for annual performance<br />
reviews.<br />
These projects will continue to be developed in 2011.<br />
Community relations - donations<br />
In their relationships with local communities, some of<br />
our subsidiaries have made donations in 2010, in order<br />
to support sporting, cultural or charitable organizations.<br />
The donations made by the main subsidiaries (1) of the<br />
<strong>Hamon</strong> Group came to EUR 54 thousand. This includes:<br />
■ A donation to the Henry Ford Museum (USA);<br />
■ A donation to the Louvain-la-Neuve Volley Ball Club<br />
(Belgium);<br />
■ A donation to the Heart of Hope project (USA).<br />
(1) The Group’s 19 main subsidiaries considered in the Corporate Social<br />
Responsibilities section (see Report Parameters)<br />
III. Environmental responsibilities<br />
Our priorities for protecting the environment are as<br />
follows:<br />
■ To reduce the environmental impact of our activities,<br />
particularly that of our factories;<br />
■ To continue to develop new, even more efficient<br />
products to enable our customers to reduce the<br />
impact of their operations on the environment<br />
(this particularly concerns our Air Pollution Control<br />
activities);<br />
■ To reduce the impact of our installations on the<br />
environment (e.g. noise and visual pollution, plume<br />
from our natural draft cooling towers, etc.).<br />
Regarding the first point, our activities affect the<br />
environment in a number of ways:<br />
■ Energy consumption (and consequently, direct and<br />
indirect greenhouse gas emissions).<br />
■ Consumption of other natural resources such as steel,<br />
aluminum, concrete, plastic, etc.<br />
■ Water consumption<br />
■ Solid and liquid waste<br />
For more information, see the section detailing the key<br />
performance indicators for Health and safety and<br />
environment in the annexures.<br />
Some initiatives have been implemented to reduce the<br />
impact of our units and our factories on the environment:
Part 1 - General presentation of the Group<br />
21<br />
■ Cooling systems: reduction of noise, steam plume,<br />
electrical consumption, water consumption (introduction<br />
of air-cooled condensers), visual impact (fanassisted<br />
natural draft cooling towers), use of recycled<br />
plastic for exchange surfaces, use of heat-sealing for<br />
sheets instead of glue, waste recycling.<br />
■ Process Heat Exchangers: oil recovery system to<br />
protect tubes and adequate storage to prevent any<br />
contamination; implementation of a closed circuit<br />
cooling water system for high frequency welding<br />
machines to reduce water consumption.<br />
■ Air Pollution Control systems: reduction of electrical<br />
consumption, noise, recycling of off cuts or waste,<br />
recycling of used fuel from factories.<br />
■ Chimneys: noise reduction.<br />
Lastly, we should point out that we have established an<br />
environmental certification program for our main<br />
entities. Early in 2011, one subsidiary was awarded ISO<br />
14001 certification and one was awarded SCC certification<br />
(“SHE Checklist Contractors”) out of the 19<br />
included in the perimeter of our analysis.<br />
We encourage our suppliers to incorporate our environmental<br />
objectives. This is why we ask them, via our<br />
general purchasing conditions, to commit to respecting<br />
all the environmental regulations in force.
22<br />
<strong>Hamon</strong> Annual Report 2010<br />
Members of the Executive Committee; from<br />
left to right: Bernard Vuylsteke, Bernard Van<br />
Diest, René Robert, Rodica Exner, Francis<br />
Lambilliotte, William Dillon, Philippe Delvaux,<br />
Michèle Vrebos<br />
Statement of corporate governance<br />
I. Corporate governance<br />
1. General Considerations<br />
1.1 Reference code<br />
<strong>Hamon</strong> adopted the 2009 Belgian Code of Corporate<br />
Governance as a reference, in line with the provisions of<br />
(1) the 6 April 2010 law whose purpose is to reinforce<br />
corporate governance in listed companies and (2) the<br />
Royal Decree of 6 June 2010 related to the designation<br />
of the Corporate Governance Code to be respected by<br />
listed companies. This Code is available on the website<br />
of the Corporate Governance Committee<br />
www.corporategovernancecommittee.be<br />
The <strong>Hamon</strong> Corporate Governance Charter describes<br />
in a detailed way the governance structure of our<br />
Company as well as policies and procedures related<br />
thereto. This Charter is available on our website<br />
www.hamon.com or is also available for review on simple<br />
request at the head office of the Company.<br />
The present Statement of corporate governance gives<br />
information on the corporate governance events which<br />
took place in 2010.<br />
1.2 Derogation to the 2009 Belgian Code of<br />
Corporate Governance<br />
<strong>Hamon</strong> derogates to the following sections of the Code,<br />
as of 31 December 2010:<br />
■ The duration of the mandates of three directors,<br />
renewed in 2008, is of six years. Every new mandate<br />
or mandate renewal will be for a maximum duration of<br />
four years from now on.<br />
■ Half of the members of the Audit, Remuneration and<br />
Appointment Committees were independent directors<br />
as of 31 December 2010. As from 1st January 2011,<br />
these Committees are staffed with a majority of<br />
independent directors following the resignation of<br />
Sogepa from these Committees.<br />
■ During the fiscal year 2010, the Audit Committee<br />
met three times to analyze the annual and half-year
Part 1 - General presentation of the Group<br />
23<br />
financial statements of the Group and the regulations<br />
in terms of corporate governance. In accordance with<br />
the Code requirements, the Audit Committee will meet<br />
four times per year from 2011 if needed.<br />
■ Regarding the remunerations and perks of the<br />
directors and members of the Executive Committee,<br />
<strong>Hamon</strong> has decided not to anticipate on the provisions<br />
of the 6 April 2010 law given the fact that they will<br />
become effective from the next fiscal year only.<br />
<strong>Hamon</strong> will comply with the abovementioned law by<br />
then.<br />
■ There is no formal assessment procedure for the<br />
Board of Directors and the specialized Committees.<br />
The Board will put it in place during the year 2011 and<br />
will disclose its characteristics in the annual report<br />
related to the fiscal year 2011.<br />
2. Governance structure<br />
<strong>Hamon</strong> is governed by a Board of Directors which, in<br />
accordance with Article 14 of the Articles of Association,<br />
has extensive power. The Board of Directors is a collegial<br />
body whose actions must be presented in the annual<br />
report to the general shareholders meeting.<br />
The executive directors communicate all the information<br />
relating to the business and finance of the Company that<br />
is required to ensure the smooth running of the Board of<br />
Directors.<br />
The non-executive directors discuss in an analytical and<br />
constructive manner the strategy and the key policies<br />
put forward by the executive management and help to<br />
develop them. They then carry out a thorough evaluation<br />
of the performance of the executive management in<br />
meeting the agreed objectives.<br />
In June 2005 the Board of Directors set up and took<br />
responsibility for specialized committees to help in some<br />
specific areas: Audit, Remuneration and Appointment<br />
Committees.<br />
The Board of Directors has granted the day-to-day<br />
management of the company to the Managing Director,<br />
who is assisted in his functions by members of the<br />
Executive Committee. The company has not set up a<br />
Management Committee within the meaning of Article<br />
524 of the Company Code.<br />
<strong>Hamon</strong> is divided into operational Business Units, each<br />
one being represented in the Executive Committee.<br />
The general shareholders meeting exercises powers<br />
which are assigned to it by law and the articles of<br />
association. The working methods of the different<br />
aforementioned bodies are contained in the Corporate<br />
Governance Charter; the Charter is available on <strong>Hamon</strong>’s<br />
website.<br />
The structure of the Company’s shareholding is presented<br />
in the section “Relations with our shareholders and other<br />
stakeholders” below.<br />
3. Board of Directors<br />
3.1 Composition<br />
3.1.1 Appointments<br />
Article 14 of the articles of association stipulate that the<br />
Board of Directors must have at least five directors of<br />
which at least the half must be non-executive and at least<br />
two must be independent.<br />
The Corporate Governance Charter goes further<br />
and stipulates that at least three directors must be<br />
independent.<br />
The members of the Board of Directors are nominated<br />
at the Annual General Meeting of shareholders. If it<br />
becomes necessary to replace one of the directors, the<br />
new director will be chosen from candidates presented by<br />
the shareholder having proposed the outgoing director.<br />
The directors whose mandate is at an end will stay in<br />
place until such time as the Annual General Meeting has<br />
approved a replacement. The Annual General Meeting<br />
has the power to dismiss a director at any time. Note<br />
too, that outgoing directors are re-electable under the<br />
restriction of article 526 ter of the Company Code which<br />
foresees that independent directors cannot be appointed<br />
for more than three consecutive mandates and that the<br />
total duration of appointment cannot exceed twelve years.<br />
There is no age limit to be a director.<br />
3.1.2 Composition<br />
Currently, the Board of Directors is composed of eight<br />
members, seven of whom are non-executive directors,<br />
and three are independent directors according to the<br />
definition of article 526 ter of the Company Code. Four of<br />
them are proposed by Sopal International S.A.<br />
The mandates of the majority of them were renewed<br />
at the Annual General Meeting of 27 May 2008.<br />
Five mandates will expire at the next Annual General<br />
Shareholders Meeting on 26 April 2011. In accordance<br />
with the Company Code, the mandates of the directors<br />
appointed or renewed by the next Annual General<br />
Shareholders Meeting will be for a maximum duration of<br />
four years.
24<br />
<strong>Hamon</strong> Annual Report 2010<br />
Baron Philippe Bodson, Messrs Pierre Meyers and<br />
Martin Gonzalez del Valle are independent directors<br />
according to the abovementioned article 526 ter of<br />
the Company Code.<br />
Sogepa SA, represented by Mrs. Sabine Colson,<br />
represents the interests of the Walloon Region on<br />
the Board of Directors.<br />
Name Position start End<br />
Baron Philippe Bodson Chairman, Independent Director 27.05.08 26.04.11<br />
Mr. Jacques Lambilliotte Honorary Chairman, Director 27.05.08 26.04.11<br />
Mr. Francis Lambilliotte(1) Managing Director 28.04.09 28.04.15<br />
Mr. Jean <strong>Hamon</strong> Director 27.05.08 26.04.11<br />
Mr. Bernard Lambilliotte Director 28.04.09 22.04.14<br />
Sogepa SA represented by<br />
Ms. Sabine Colson Director 27.05.08 26.04.11<br />
Mr. Pierre Meyers Independent Director 27.05.08 26.04.11<br />
Mr. Martin Gonzalez del Valle Independent Director 27.05.08 22.04.14<br />
(1) Executive director (the other directors are non-executive).<br />
Baron Philippe Bodson<br />
Chairman of the Board of Directors of <strong>Hamon</strong> & Cie<br />
and independent director since May 2008. He has an<br />
engineering degree (University of Liège) and holds an<br />
MBA (INSEAD - Fontaibebleau - France). After having<br />
held executive positions in a number of companies<br />
(e.g. Glaverbel, Tractebel), and chairmanship of the<br />
FEB, Baron Bodson is currently chairman of the Board<br />
of Directors of Exmar, Floridienne and the investment<br />
management firm Be Capital. He also sits on the boards<br />
of Aei (USA) and Cobepa.<br />
Francis Lambilliotte<br />
Managing Director since 1987, he joined the Company<br />
after having worked at Cobepa for several years. He is<br />
a commercial engineer (Solvay Business School).<br />
Jacques Lambilliotte<br />
Director, was the Managing Director, Chairman of the<br />
Board of Directors and Managing Director of Laminoirs<br />
de Longtain from 1953 to 1983. He has an engineering<br />
degree.<br />
Jean <strong>Hamon</strong><br />
Director, was the Director of the finance department<br />
of <strong>Hamon</strong> Paris from 1965 to 2000. He has degrees<br />
in engineering and in mathematics.<br />
Bernard Lambilliotte<br />
Director, he is a commercial engineer (Solvay Business<br />
School) and holds an MBA (INSEAD-Fontainebleau-<br />
France). He is currently Chief Investment Officer at<br />
Ecofin, an investment management firm (based in<br />
London), which he founded. He is also Director of<br />
Kapitol S.A. Previously, he held several finance positions<br />
at Pictet & Cie, Swiss Bank Corporation, and Drexel<br />
Burnham Lambert.<br />
Sabine Colson, representing Sogepa<br />
Director since June 2005. She has a degree in<br />
business and finance (HEC). She held several positions<br />
at PriceWaterhouseCoopers in Luxembourg and in<br />
Brussels from September 1990 to the end of June<br />
1996. She was an advisor to Sogepa from July 1996<br />
to December 2010 and as such has held a number of<br />
positions as observer and director for companies having<br />
their registered office in the Walloon Region. Since<br />
1 January 2011, she has acted as General Adviser of<br />
SRIW Environnement.<br />
Pierre Meyers<br />
Independent Director since June 2005, he his currently<br />
the managing director of Euremis Holding, a company<br />
holding 81% of the capital of CMI, and director of various<br />
companies including CMI, CHRYSOS, AURIS FINANCE,<br />
INTEGRALE, Herstal Group (FN), AEIP and AGM. He<br />
was financial director and a member of the Executive<br />
Committee of Cockerill Sambre and then Usinor<br />
(1994-2000), and financial director at Herstal Group (FN)<br />
(1979-1993). He has a degree in business administration<br />
and holds a CRB Graduate Fellow diploma from Harvard<br />
University.
Part 1 - General presentation of the Group<br />
25<br />
Martin Gonzalez del Valle,<br />
Independent Director since June 2005; co-founder and<br />
partner of Realza Capital, one of the largest private equity<br />
firms in Spain. For 12 years he worked in the private<br />
equity sector as partner and CFO of Investindustrial<br />
Partners Spain and as senior director and member of<br />
the Executive Committee of Mercapital. He was deputy<br />
general manager of Crédit Agricole Indosuez in Madrid,<br />
and held several positions in household and sanitary<br />
goods. He is currently chairman of the board of directors<br />
of Esindus (non-executive office), and director of the<br />
Spanish companies Socelec and Iberpapel SA. He has a<br />
degree in law from the University of Madrid and holds an<br />
MBA (Insead-Fontaibebleau-France).<br />
3.2 Functioning<br />
The Board of Directors met five times in 2010. The main<br />
subjects discussed were:<br />
■ the approval of the results of the Group, the reviews<br />
of forecasts, annual budgets and the strategic business<br />
plan,<br />
■ the monitoring of the business and the financial<br />
situation of the Group and some of its subsidiaries,<br />
■ the review of some development and investment<br />
projects in the frame of the development strategy<br />
of the Group,<br />
■ the overview of the new regulation related to corporate<br />
governance and the approval of the changes made to<br />
the Corporate Governance Charter.<br />
All the directors attended every board meeting, except<br />
Mr. Bernard Lambilliotte who could not attend the 27<br />
April 2010 board meeting.<br />
4. Committees<br />
Under its own responsibility, the Board of Directors set<br />
up Audit, Remuneration and Appointment Committees in<br />
June 2005. The composition of these Committees was<br />
reviewed on 27 May 2008, when the new Chairman of<br />
the Board of Directors was appointed.<br />
The mandates of some members of these Committees<br />
expire this year; they will be renewed in function of the<br />
renewal of the mandates of these members of the Board<br />
of Directors.<br />
4.1 Audit Committee<br />
During the fiscal year 2010, the four members of the<br />
Audit Committee were non-executive directors; out of<br />
them two are independent directors.<br />
Members<br />
of the Audit Committee Function End of term<br />
Sogepa SA represented by<br />
Ms. Sabine Colson Chairman 26.04.11<br />
Mr. Pierre Meyers (*) Member 26.04.11<br />
Mr. Martin Gonzalez del Valle (*) Member 26.04.11<br />
Mr. Bernard Lambilliotte Member 22.04.14<br />
(*) independent director<br />
As from 1st January 2011, the members of the Audit<br />
Committee are:<br />
Members<br />
of the Audit Committee Function End of term<br />
Mr. Pierre Meyers (*) Chairman 26.04.11<br />
Mr. Martin Gonzalez del Valle (*) Member 26.04.11<br />
Mr. Bernard Lambilliotte Member 22.04.14<br />
(*) independent director<br />
The Audit Committee met three times during the fiscal<br />
year 2010, together with the auditor.<br />
The subjects discussed by the Audit Committee<br />
referred to:<br />
■ the closing of the financial statements as<br />
of 31 December 2009;<br />
■ the closing of the financial statements as<br />
of 30 June 2010;<br />
■ the analysis of the new Corporate Governance<br />
regulation.<br />
Sabine Colson and Pierre Meyers attended all the<br />
meetings of the Audit Committee; Martin Gonzalez del<br />
Valle could not attend the 22 February meeting; Bernard<br />
Lambilliotte did not attend any meeting.<br />
4.2 Remuneration Committee<br />
During the fiscal year 2010, the four members of<br />
the Remuneration Committee were all non-executive<br />
directors; out of them two are independent directors.
26<br />
<strong>Hamon</strong> Annual Report 2010<br />
Members of Function End of term<br />
the Remuneration Committee<br />
Members of Function End of term<br />
the Appointment Committee<br />
Baron Philippe Bodson (*) Chairman 26.04.11<br />
Mr. Jacques Lambilliotte Member 26.04.11<br />
Sogepa SA represented by<br />
Ms. Sabine Colson Member 26.04.11<br />
Mr. Pierre Meyers (*) Member 26.04.11<br />
(*) independent director<br />
Baron Philippe Bodson (*) Chairman 26.04.11<br />
Mr. Jacques Lambilliotte Member 26.04.11<br />
Sogepa SA represented by<br />
Ms. Sabine Colson Member 26.04.11<br />
Mr. Martin Gonzalez del Valle (*) Member 22.04.14<br />
(*) independent director<br />
As from 1st January 2011, the three members of the<br />
Remuneration Committee are non-executive directors; out<br />
of them at least two are independent directors:<br />
As from 1st January 2011, the three members of the<br />
Appointment Committee are non-executive directors; out<br />
of them at least two are independent directors:<br />
Members of Function End of term<br />
the Remuneration Committee<br />
Members of Function End of term<br />
the Appointment Committee<br />
Baron Philippe Bodson (*) Chairman 26.04.11<br />
M. Jacques Lambilliotte Member 26.04.11<br />
M. Pierre Meyers (*) Member 26.04.11<br />
(*) independent director<br />
Baron Philippe Bodson (*) Chairman 26.04.11<br />
M. Jacques Lambilliotte Member 26.04.11<br />
M. Martin Gonzalez del Valle (*) Member 22.04.14<br />
(*) independent director<br />
The members of the Remuneration Committee have the<br />
required expertise in terms of remuneration policy as<br />
shown by their curriculum vitae given hereabove.<br />
The Managing Director attends the meetings of<br />
the Remuneration Committee which are related to<br />
the remuneration of the members of the Executive<br />
Committee and other top managers.<br />
The Remuneration Committee met three times in 2010,<br />
all its members attended every meeting.<br />
The subjects discussed by the Remuneration Committee<br />
were mainly:<br />
■ remuneration package for the members of the<br />
Executive Committee and other top managers;<br />
■ complementary pension plan in some countries;<br />
■ fixing of the top managers variable remunerations;<br />
■ content of the remuneration report;<br />
■ remuneration package for William Dillon, the new<br />
U.S. CEO.<br />
4.3 Appointment Committee<br />
During the fiscal year 2010, the four members of the<br />
Appointment Committee were all non-executive directors;<br />
out of them two are independent directors.<br />
There was no meeting of the Appointment Committee<br />
in 2010.<br />
5. Executive Committee<br />
The Board of Directors has appointed an Executive<br />
Committee most notably to assist the Managing Director<br />
in his functions.<br />
The members of the Executive Committee are the<br />
following as of today:<br />
■ Francis Lambilliotte<br />
Managing Director, Chairman of the Executive<br />
Committee<br />
■ Rodica Exner<br />
General Manager of the Cooling Systems BU;<br />
Vice Chairman of the Executive Committee<br />
■ William Dillon<br />
General Manager Americas<br />
■ Philippe Delvaux<br />
General Manager of the Air Pollution Control EMEA /<br />
Brazil BU<br />
■ René Robert<br />
General Manager of the Process Heat<br />
Exchangers BU<br />
■ Bernard Van Diest<br />
Group Financial Director
Part 1 - General presentation of the Group<br />
27<br />
■ Michèle Vrebos<br />
Group Legal Director and Secretary General<br />
■ Bernard Vuylsteke<br />
Group Human Resources Director<br />
■ Aart Nobel<br />
Advisor to the Chairman<br />
Mr. Francis Lambilliotte, as the Company’s Managing<br />
Director, performs the day-to-day management function<br />
of the Company.<br />
6. Remuneration report<br />
In accordance with the recommendations of the<br />
2009 Corporate Governance code, the Remuneration<br />
Committee has established a remuneration report as<br />
follows:<br />
“Procedure<br />
The procedure adopted by the Remuneration Committee,<br />
in consultation with the CEO, (i) to remunerate the<br />
directors and members of the <strong>Hamon</strong> & Cie Executive<br />
Committee and (ii) to fix the individual remuneration of<br />
the abovementioned people, was to appoint an external<br />
HR consultant specialized in this area. This consultant<br />
prepared a report to the Executive Committee on<br />
the going market rates in the areas of the Group for<br />
companies of similar sizes both in Belgium and abroad,<br />
given the international character of the composition of the<br />
Executive Committee of the Group.<br />
Market practice is reviewed annually and each time<br />
discussed in the Committee, decisions from which could<br />
lead to the revision of certain elements.<br />
Remuneration policies<br />
The remuneration of non-executive directors is subject<br />
to a proposal by the Board of Directors to the Annual<br />
General Meeting of shareholders. It was reviewed<br />
during the Annual General Meeting of 27 April 2010 for<br />
the last time.<br />
The remuneration of directors equates to a fixed sum<br />
and a variable amount per meeting in which they<br />
are present. The Chairman also receives a higher<br />
annual lump sum in compensation for his advice and<br />
experience. The directors, except the Managing Director,<br />
did not receive any stock options. The mandate of the<br />
Managing Director, regarding this function stricto sensu,<br />
is exercised free of charge.<br />
The remuneration of the members of the Executive<br />
Committee is made up of a fixed sum and a variable<br />
amount.<br />
The fixed sum corresponds to the international market<br />
practices for the various functions involved.<br />
The purpose of the variable remuneration is to ensure<br />
Executive Committee members are paid according to<br />
the Group’s performance on the one hand and their<br />
individual performance on the other hand. Variable<br />
remuneration is linked to the results of the Business<br />
Units and the Group and the achievement of personal<br />
goals; the percentage representing the variable<br />
compensation depends on the degree of importance<br />
and the contribution made by that function to the results<br />
of the Business Units and the Group. This percentage<br />
can amount up to 200% of the fixed remuneration.<br />
The individual performance of the concerned persons is<br />
subject to an annual appraisal by the Managing Director<br />
who takes into account how far the objectives mutually<br />
agreed during the previous year with the Board of<br />
Directors have been met.<br />
This performance analysis of the members of the<br />
Executive Committee and top managers is then<br />
discussed by the Managing Director with the<br />
Remuneration Committee.<br />
Among the long-term incentives, the members of<br />
the Executive Committee and the Managing Director<br />
received stock options during the year 2008. Details of<br />
the 22 500 options, attributed in 2008, can be found<br />
in note 33 of the 2010 annual report (Part 3. Financial<br />
statements). There was no allocation of stock options in<br />
2009 or in 2010. The stock option plan was submitted<br />
to the approval of the Annual General Meeting of the<br />
Company on 27 May 2008.<br />
There was no important change to the remunerations<br />
compared to the previous fiscal year.<br />
For the Remuneration Committee, the Chairman.”<br />
As mentioned hereabove, this report will comply with the<br />
legal requirements in this area as soon as they become<br />
applicable, namely from the fiscal year 2011.<br />
7. Remuneration and perks of the Board of<br />
Directors and Executive Committee<br />
7.1. Directors’ Remuneration<br />
All the directors are remunerated for their directorship<br />
with the exception of Francis Lambilliotte, in accordance<br />
with the decision of the General Shareholders Meeting.<br />
In 2010, the directors remuneration amounted to EUR<br />
240 000.<br />
The Annual General Meeting of 27 April 2010 had<br />
decided to allocate, with effect from 1st January 2009<br />
onwards, a remuneration (lump sum + per meeting) for<br />
the directors, for their functions as directors, of up to a<br />
maximum of EUR 240 000 per year (to be indexed on
28<br />
<strong>Hamon</strong> Annual Report 2010<br />
the retail price index every January against the level in<br />
January 2008), to be divided up annually amongst its<br />
members by the Board of Directors. The non-executive<br />
directors are not entitled to any stock option plan nor to<br />
any bonus linked to the results of the Group.<br />
7.2. Remuneration of the members<br />
of the Executive Committee<br />
On top of their fixed remuneration, the members of the<br />
Executive Committee got a variable remuneration for<br />
the year 2010. This remuneration was given to them<br />
according to criteria based on (i) the Group results, (ii)<br />
the performances of their business units and (iii) personal<br />
objectives agreed upon with the Managing Director.<br />
7.3. Total remuneration of the directors<br />
and the members of the Executive Committee<br />
In 2010, the total remunerations and perks of the<br />
directors and members of the Executive Committee of<br />
the Company for their function within the Company, its<br />
subsidiaries or related companies, amounted to EUR<br />
6,899 million. For more details, see note 44 of the<br />
consolidated financial statements.<br />
8. Auditors<br />
The Company accounts and consolidated accounts<br />
of the fiscal year ending on 31 December 2010 were<br />
audited by Deloitte, Reviseurs d’Entreprises, SC s.f.d.<br />
SCRL, Berkenlaan 8B, 1831 Diegem, represented by Mr.<br />
Laurent Boxus.<br />
The appointment of the auditor by the Annual General<br />
Meeting of 27 May 2008 expires during the next<br />
Annual General Meeting of 26 April 2011. The Board<br />
will propose to the Annual General Meeting to renew<br />
the mandate of the auditor for three years. From that<br />
moment, the auditor will be represented by Mr. Pierre-<br />
Hugues Bonnefoy. Indeed, Mr. Laurent Boxus, who was<br />
representing the auditor, has reached the limit of six years<br />
recommended by the Auditor Institute in relation with<br />
some aspects of the auditor independence.<br />
9. Appropriation of profits<br />
On 9 September 2010, the Company paid an advance<br />
dividend for the results of 2010 of EUR 0,25 per share.<br />
The Board of Directors proposes to the 26 April 2011<br />
General Shareholders Meeting to distribute a complement<br />
to this dividend of EUR 0,35 per share for the result of<br />
2010, payable on 10 May 2011. The total dividend for the<br />
fiscal year 2010 will amount to EUR 0,60 per share.<br />
The dividend policy aims to make a payout of around<br />
25% of the result of the year, which it is felt will correctly<br />
remunerate shareholders while still keeping the required<br />
funds necessary for continued growth within the Group.<br />
10. Code of good behavior<br />
The Group has developed a Code of Ethics for all<br />
its employees covering various aspects including (i)<br />
compliance with the law on insider trading, (ii) the<br />
prevention of conflicts of interest with the Group, (iii)<br />
respect of confidentiality as part of the exercise of<br />
their function, (iv) correct and proper conduct in the<br />
management of the business.<br />
This Code aims to educate employees to the need to<br />
respect a code of good behavior when exercising their<br />
professional duties and ensure that all staff members<br />
carry out their activities with respect to the ethical<br />
and legal laws of each country. This Code reflects the<br />
determination of the Group to maintain a relationship of<br />
trust and professionalism with all its stakeholders.<br />
The Corporate Governance Charter published on the<br />
<strong>Hamon</strong> website has a specific section relating to insider<br />
trading.<br />
11. Conflicts of interest<br />
The procedure of article 523 of the Company Code related<br />
to conflicts of interest has been activated twice during the<br />
fiscal year 2010, on the one hand for the sale by <strong>Hamon</strong><br />
& Cie of its subsidiary Brown Fintube France SA to AIT<br />
and on the other hand for the creation of a joint venture<br />
between <strong>Hamon</strong> & Cie and Esindus. These elements are<br />
described in the <strong>Hamon</strong> & Cie management report.<br />
The Board has not been informed of any other conflict of<br />
interest apart from those abovementioned and related to<br />
article 523.<br />
12. Compliance with the rules on market abuses<br />
The Board of Directors has prepared a set of rules<br />
regarding the transactions and the publicity around<br />
such transactions on the Company shares or derivative<br />
instruments or other financial instruments related to these<br />
shares. The transaction rules specify which information<br />
related to such transactions must be disclosed to the<br />
market. The transaction rules are described in the<br />
Corporate Governance Charter.
Part 1 - General presentation of the Group<br />
29<br />
13. Important aspects in case of a public offer<br />
of purchase<br />
Article 5 of the articles of association of <strong>Hamon</strong> &<br />
Cie states that the Board of Directors is authorized to<br />
increase the capital one (or more times) up to EUR<br />
2 157 441,60. This authorization is limited to 5 years;<br />
it can however be renewed once or several times for<br />
a further 5 years, by the Annual General Meeting. The<br />
increase in capital as decided by this authorization,<br />
whether made in kind or in cash, can be made by using<br />
available or unavailable reserves or share premium, with<br />
or without the creation of new shares, preferential or<br />
not, with or without voting rights, and with or without<br />
subscription rights.<br />
Within the authorization given to it by the articles of<br />
association, the Board may decide to issue bonds,<br />
subscription rights, or the right to options just as it can<br />
also cancel or limit the preference rights of existing<br />
shareholders if it is in the interest of the Company and<br />
within the legal framework to do so and including to<br />
the benefit of one or more persons or members of the<br />
Company’s personnel, or related companies.<br />
The Extraordinary General Shareholders Meeting of<br />
<strong>Hamon</strong> & Cie has also given clear authority to the<br />
Board of Directors, in case there is a public offer on the<br />
shares of the Company, to increase the capital either in<br />
nature or in kind, by limiting or canceling, as the case<br />
may be, the preference rights of shareholders including<br />
those favoring one or more particular persons.<br />
The articles of association of <strong>Hamon</strong> & Cie also foresee<br />
that the Company is authorized to buy its own share on<br />
the stock market without necessarily making an offer<br />
to shareholders. The Board of Directors is authorized<br />
to dispose of shares of the Company through the stock<br />
market or in any other way that is foreseen by the law,<br />
without prior authorization of the Annual General Meeting.<br />
The Board is authorized to acquire or dispose of shares in<br />
the Company to ward off any serious or imminent danger<br />
to the Company, as is possible within the law.<br />
Note too that the shareholder agreement signed in<br />
June 2005 by both Sopal International and the Walloon<br />
Region, represented by Sogepa, and amended on 28<br />
August 2007, provides that the two groups mutually<br />
inform each other if there is intent to reduce or increase<br />
their participation in <strong>Hamon</strong> & Cie. The agreement also<br />
authorizes the existence of a pre-emptive right in favor<br />
of one of the two groups, and a right to buy in favor of<br />
Sogepa if Sopal International should decide to sell its<br />
shares. The agreement also provides for a put option for<br />
the Walloon Region and a call option in favor of Sopal<br />
International.<br />
II. Internal control and risk<br />
management systems associated<br />
with the process of drawing up<br />
financial information<br />
1. Introduction<br />
The law of 6 April 2010 on the strengthening of<br />
corporate governance provides, within the framework<br />
of the transposition of a European directive, that the<br />
declaration on corporate governance must contain a<br />
description of the main characteristics of the internal<br />
control and risk management systems associated with the<br />
process of drawing up financial information.<br />
In compliance with the recommendations of the Code,<br />
<strong>Hamon</strong>’s Board of Directors has agreed, at the instigation<br />
of the Audit Committee, to use as an initial reference<br />
the proposal drafted by the working group set up by the<br />
Corporate Governance Commission of the FEB, made up<br />
of representatives of listed companies, of the Institut des<br />
Réviseurs d’Entreprises and of the Institute of Internal<br />
Auditors Belgium (IIABel).<br />
The Board of Directors has also asked the<br />
Audit Committee to report to it biannually on the<br />
implementation of this frame of reference and on the<br />
improvements to be made.<br />
<strong>Hamon</strong> has established its internal control and Company’s<br />
risks management by defining the environment in which it<br />
acts (the general framework), identifying and classifying<br />
the risks associated with it, analyzing its level of control<br />
over these risks and setting up “control of the control”<br />
systems. The company also focuses on the quality of the<br />
reporting process and of the financial information.<br />
2. The environment subject to control<br />
The company’s role and values<br />
A Sustainable Development Charter – included in our<br />
annual Report – covers the axes on which <strong>Hamon</strong><br />
aims to develop its business, based on respect for the<br />
environment, human rights, the local communities in<br />
which it operates and its staff. It fosters values such<br />
as professionalism, corporate culture, cultural diversity,<br />
team spirit and a “do it right the first time” approach.<br />
See also the section Vision – Mission – Values in the<br />
Group profile section of this report.<br />
A Corporate Governance Charter – available on the<br />
website – was drawn up and approved by the Board<br />
of Directors. This Charter clearly defines the different
30<br />
<strong>Hamon</strong> Annual Report 2010<br />
management bodies, their working methods and their<br />
composition.<br />
A Code of Ethics, written for all the employees, is<br />
detailed in point 10 on page 28.<br />
Risk culture<br />
<strong>Hamon</strong> takes a wise approach. The Company manages<br />
large projects in different fields of activity, providing<br />
innovative systems which boast cutting-edge technology<br />
and effectively meet customers’ needs, together with<br />
strict cost control. As from the bidding phase, projects<br />
undergo an in-depth risk analysis to ensure these projects<br />
will continue to add value in the long term.<br />
Clear missions<br />
■ The structure of <strong>Hamon</strong> is based on its BUs, which<br />
have a clear role in terms of product portfolio,<br />
organization and results.<br />
■ The internal organization is set out in flow charts and<br />
each employee has a description of his or her role and<br />
of the procedures for delegating authority.<br />
■ The Group also provides support functions for the<br />
BUs through different departments – IT, Legal,<br />
Corporate Finance, Treasury and Human Resources –<br />
of the parent company.<br />
■ Measures of control: Compliance is carried out by the<br />
Secretary General. The CFO is responsible for risk<br />
management and directly supervises the Controlling<br />
Team, which has management control of the Group.<br />
The BU managers are responsible for monitoring the<br />
industrial risks.<br />
Competent teams<br />
■ The directors: they were appointed for their<br />
experience and have the necessary competencies<br />
and qualifications to undertake their responsibilities,<br />
in particular with regard to technology, finance,<br />
accounting, investment and remuneration policies.<br />
■ Management and employees: <strong>Hamon</strong>’s employees<br />
underwent a recruitment process that was adapted to<br />
the profiles required. They also benefit from suitable<br />
training, in accordance with the job specifications.<br />
3. Risk analysis<br />
The Group is faced with a number of risks associated with<br />
its activities and the size and type of markets in which it<br />
operates. <strong>Hamon</strong> regularly performs an audit to identify<br />
and evaluate these risks. The most recent took place on<br />
10 December 2010. The risks that the Company faces<br />
were mapped out. Those for which the control level has<br />
been deemed to be insufficient will be subject to a formal<br />
action plan. The implementation of this action plan will be<br />
monitored by the Audit Committee.<br />
The main risks are as follows:<br />
Strategic risks<br />
■ Risks associated with the economic, contractual,<br />
commercial and market environment.<br />
■ Uncertainties related to new environmental<br />
regulations and their time of entry into force<br />
(significant impact on Air Pollution Control activities).<br />
■ Risks related to acquisitions, partnerships, and<br />
activities in emerging countries, including political<br />
risks.<br />
Risks associated with the Group’s activities<br />
■ Supplier risks; this may include unsatisfactory<br />
products, which do not meet the specifications<br />
of the contract, or delays in delivery.<br />
■ Technical risks, related to the design or smooth<br />
implementation of certain projects.<br />
■ Risks related to guarantees on projects undertaken.<br />
■ Risks related to the environment, for example on<br />
<strong>Hamon</strong>’s worksites or in its factories.<br />
■ Industrial risks (accidents), human risks, or those<br />
linked to occupational illnesses.<br />
■ Monetary risks, such as fluctuation in the exchange<br />
rate of the U.S. dollar.<br />
Internal risks<br />
■ Human resources risks, namely the Company’s<br />
capacity to provide the necessary capabilities and<br />
resources to ensure the completion of projects.<br />
■ IT risks, related to the availability and safeguarding of<br />
IT facilities and data that are essential to the delivery<br />
of the Group’s objectives.<br />
■ Risks related to disputes the Group is involved in,
Part 1 - General presentation of the Group<br />
31<br />
to the liquidation of <strong>Hamon</strong> Research Cottrell Italia,<br />
or to guarantees issued in the framework of assets<br />
disposal.<br />
■ Possible realization of deferred tax assets.<br />
■ Reductions of value (impairment test) on the book<br />
value of certain assets.<br />
4. Control measures put in place<br />
<strong>Hamon</strong> takes measures in order to manage the risks<br />
in the best way, with a suitable risk management policy<br />
based on the nature of its activities:<br />
■ Implementation of an adequate internal control process<br />
at the Group level.<br />
■ Analysis of technical, financial and execution risks,<br />
based on a check list that is tailored to the different<br />
Business Units; this analysis is a preliminary condition<br />
for the provision of quotations to our customers and<br />
is based on a system of delegation of power.<br />
■ Monthly monitoring, through business meetings, of the<br />
progress of the different projects within the Group.<br />
■ Monthly and quarterly reporting on management,<br />
disputes and treasury.<br />
■ Setting up of a robust control system for the Group<br />
to monitor the progress of projects and activities in the<br />
Group and issues a warning or an alert if there is<br />
a mistake.<br />
■ Quarterly review by the Executive Committee of the<br />
state of business, disputes and risks.<br />
In terms of covering of financial risks, <strong>Hamon</strong>s has<br />
adopted a risk management policy for interest rates,<br />
exchange rates and counter party risks:<br />
■ Interest rate risks: they are managed through the use<br />
of interest rate swaps (IRS) when the long-term rates<br />
exceed some limits set by the Group.<br />
■ Exchange rate risks: our positions in foreign currencies<br />
resulting from the execution of our construction<br />
contracts are covered by derivative instruments (forward<br />
exchange rates, swaps, NDF) when they exceed the<br />
limits set by the Group.<br />
■ Counter party risks: short-term deposits and<br />
investments must comply with safety and liquidity<br />
criteria and only thereafter with return criteria.<br />
The monetary risk management policy is set by the CFO<br />
of the Group and reviewed on a regular basis.<br />
5. Financial information and communication<br />
The gathering of financial information is carried out<br />
as follows:<br />
■ Reverse planning highlights the tasks which have<br />
to be performed in the framework of the Company’s<br />
monthly, quarterly, half-year and annual closures and<br />
those of its subsidiaries, as well as their deadlines.<br />
The Group has a check list of actions to be monitored<br />
by the financial department, while each subsidiary<br />
draws up its own check list, enabling it to meet its<br />
specific needs.<br />
■ Under the supervision of the financial managers at<br />
the subsidiaries, the local teams produce the books<br />
of accounts. The accounts are kept either using the<br />
ERP of the Group – JD Edwards – or, depending on<br />
the roll out program or the size of the subsidiary, using<br />
software packages purchased locally and subject to<br />
suitable support contracts, or for the smallest entities,<br />
through external providers. It should be noted that<br />
<strong>Hamon</strong> has a “disaster recovery” and a “business<br />
continuity” plan which have been validated by auditors<br />
in IT safety.<br />
■ The Controlling Team of the subsidiary checks the<br />
accuracy of the figures and makes the reporting. The<br />
figures are checked using the following procedures:<br />
■ Coherence tests via comparisons with past figures<br />
or those contained in the budget;<br />
■ Spot-checks of transactions and other checks<br />
depending on their materiality.<br />
■ At central level, the consolidation is performed<br />
with the help of a software package – SAFRAN –<br />
through which the input is submitted locally by the<br />
subsidiaries. The consolidation and reporting team<br />
prepares the accounts and uses random checks<br />
and coherence tests to verify the basic financial<br />
information. This central Controlling Team takes an<br />
active part, at least twice a year, in the business<br />
reviews of each of the subsidiaries of the Business<br />
Units for which it is responsible.<br />
■ Communication with the members of staff and<br />
different <strong>Hamon</strong> employees is adapted to the size<br />
of the Company. It is mainly based on different
32<br />
<strong>Hamon</strong> Annual Report 2010<br />
press releases and the sending of internal messages<br />
via email, business meetings or even verbal<br />
communications between the management and<br />
the staff.<br />
■ To ensure rapid communication and the equal<br />
treatment of shareholders, <strong>Hamon</strong> publishes the<br />
agenda and the minutes of general shareholders<br />
meetings, half-year and annual financial results,<br />
press releases, articles of association, the Corporate<br />
Governance Charter and the annual report, on<br />
its website.<br />
6. Parties involved in the monitoring and<br />
evaluation of internal control<br />
The quality of the internal control procedures is measured<br />
in the course of the exercise:<br />
■ By the Group’s control management, in the framework<br />
of its quarterly reviews of each of the Business Units and<br />
regular audits carried out in the subsidiaries during which<br />
all the activities and key internal control measures relating<br />
to contracts are reviewed.<br />
■ By the Audit Committee. During the fiscal year, the<br />
Audit Committee undertook a review of the half year<br />
closures and specific accounting treatments. It carried<br />
out a review of the disputes and asked all the questions<br />
it considered pertinent to the Auditor and the Group<br />
Controller or the Company top management.<br />
■ By the Auditor, in the framework of his review of the<br />
half year and annual accounts. During the fiscal year,<br />
the Statutory Auditor set out his recommendations<br />
concerning the account keeping.<br />
■ Occasionally by the Commission bancaire, financière et<br />
des assurances.<br />
■ The Board of Directors oversees the execution of tasks<br />
of the Audit Committee, mainly through the reporting<br />
undertaken by the Committee.<br />
The Group’s Management – with the agreement of the<br />
Audit Committee – does not believe it necessary to<br />
create a specific internal audit function, given, on one<br />
hand, <strong>Hamon</strong>’s project based work, and on the other,<br />
the management control procedures put in place to<br />
specifically cover these risks. If the nature and the size<br />
of the Group’s activities should change, the management<br />
and the Audit Committee will re-examine the need to<br />
create an internal audit function.
Part 1 - General presentation of the Group<br />
33<br />
III. Relations with our shareholders and other stakeholders<br />
1. Shareholder relations<br />
<strong>Hamon</strong> shares<br />
<strong>Hamon</strong> shares are listed on the regulated market Euronext Brussels, on a continuous market, in trading group A1.<br />
The main data relating to <strong>Hamon</strong> shares are set out below:<br />
in EUR/share 2010 2009 2008<br />
Average closing price 28,00 23,76 29,79<br />
Maximum closing price 32,07 29,50 46,74<br />
Minimum closing price 24,56 17,41 15,85<br />
Closing price on 31 December 26,87 27,40 19,50<br />
Average daily trading volume (number shares / day) 3 087 4 777 4 879<br />
Total number of shares on 31 December 7 191 472 7 191 472 7 191 472<br />
Mean total number of shares 7 191 472 7 191 472 7 191 472<br />
Average market capitalization during the year (EUR million) 201,4 170,9 214,2<br />
<strong>Hamon</strong>’s share price fell slightly in 2010, by -1,9%, while the BEL 20 index climbed modestly by 2,7% over the same<br />
period. However, the average price of <strong>Hamon</strong> shares (average annual closing price) rose by 18% in 2010 compared<br />
to 2009.<br />
As illustrated in the graph, from the lowest point early in September 2010, <strong>Hamon</strong>’s share price has noticeably risen<br />
(+9,4%), while over the last four months of 2010 the BEL 20 index has not. This trend is confirmed in the first few<br />
months of 2011.<br />
Evolution of the <strong>Hamon</strong> share price relative to the BEL20 index<br />
120<br />
115<br />
31 December 2009 = 100<br />
110<br />
105<br />
100<br />
95<br />
90<br />
<strong>Hamon</strong> share<br />
BEL20 index<br />
85<br />
80<br />
31.12.2009<br />
31.01.2010<br />
28.02.2010<br />
31.03.2010<br />
30.04.2010<br />
31.05.2010<br />
30.06.2010<br />
31.07.2010<br />
31.08.2010<br />
30.09.2010<br />
31.10.2010<br />
30.11.2010<br />
31.12.2010
34<br />
<strong>Hamon</strong> Annual Report 2010<br />
In accordance with the law of 14 December 2005 on<br />
the abolition of bearer securities and the requirements<br />
contained under Article 96 of the law of 25 April 2007,<br />
the dematerialized form of <strong>Hamon</strong> shares was adopted<br />
by the Board of Directors at its meeting of 17 December<br />
2007 and the Company’s articles of association were<br />
subsequently amended. This process of de-materialization<br />
of shares runs from 1 January 2008 until 31 December<br />
2013.<br />
Since 1 January 2008, <strong>Hamon</strong> shares have been<br />
recorded either by an inscription in the Company’s<br />
shareholder register or via a share account at a financial<br />
institution. This means that shareholders with physical<br />
shares who wish to participate in the next Annual<br />
General Meeting (26 April 2011) should convert their<br />
physical shares into dematerialized shares. Additionally,<br />
those who have physical shares should deposit their<br />
shares in a share account in order to receive a dividend<br />
directly in their bank account.<br />
The granting of share options<br />
There were no share options granted to the employees<br />
in 2010.<br />
Shareholding structure of <strong>Hamon</strong> & Cie<br />
Under the terms of Article 9 of <strong>Hamon</strong> & Cie’s<br />
(International) articles of association, as modified on<br />
27 May 2008, shareholders whose shares are in excess<br />
of 2%, 3%, 4%, 5%, 7,5%, 10% and then every<br />
multiple of 5% thereafter, are required to inform the<br />
Company and the banking, finance and insurance<br />
Commission, in accordance with the legal requirements.<br />
Under the terms of the Royal Decree of 14 February<br />
2008 relating to the communication on significant<br />
participation, <strong>Hamon</strong> has received the following notices<br />
of participation, which show the shareholding structure<br />
as at 31 December 2010:<br />
Shareholder 31/12/2010 31/12/2010 31/12/2009 31/12/2009<br />
shares in % shares in %<br />
Sopal International SA (1) 4 598 155 63,94% 4 548 155 63,24%<br />
Esindus S.A. 303 506 4,22% 303 506 4,22%<br />
Walloon Region, represented by the Société<br />
Wallonne de Gestion et de Participation SA 100 000 1,39% 150 000 2,09%<br />
Fortis Investment Management SA 175 106 2,43% 175 106 2,43%<br />
Baillie Gifford & Co 148 469 2,06% 148 469 2,06%<br />
Kempen Capital Management NV 144 415 2,01% 0 0%<br />
Other public 1 721 821 23,94% 1 866 236 25,95%<br />
Total 7 191 472 100% 7 191 472 100%<br />
(1)<br />
acting in concert with the Walloon Region<br />
36 000 warrants were also issued in 2008, as part of<br />
the stock options plan. On 16 August 2010 Sopal<br />
International acquired 50 000 shares in <strong>Hamon</strong> from<br />
Sopega, by the exercise of a purchase option on 30<br />
June 2010, in accordance with the shareholders<br />
agreement of June 2005, amended in 2007. This sale<br />
did not affect the free float shares.<br />
Fortis Investment Management, Baillie Gifford and<br />
Kempen Capital Management are institutional investors<br />
who have purchased shares in <strong>Hamon</strong> for their investment<br />
funds.<br />
Financial calendar<br />
The statutory date of the annual general shareholders<br />
meeting was changed at the extraordinary general<br />
meeting of 27 May 2008; from this date on, it will take<br />
place on the fourth Tuesday of April<br />
Annual general shareholders meeting of 2011 26.04.2011<br />
Publication of the quarterly Trading Update T1 2011 26.04.2011<br />
Publication of the results of the 1st half year 2011 31.08.2011<br />
Annual general shareholders meeting of 2012 24.04.2012
Part 1 - General presentation of the Group<br />
35<br />
Investor relations and financial information<br />
Bernard Van Diest, Group Financial Director<br />
Telephone : +32 10 39.04.22<br />
Fax : +32 10 39.04.16<br />
Email: bernard.vandiest@hamon.com<br />
All financial information, including annual reports and<br />
press releases, are also available on our website:<br />
www.hamon.com<br />
2. Relations with our other stakeholders<br />
Our development depends on our customers. We want<br />
them to be fully satisfied, as per our Corporate Governance<br />
Charter (see section Vision, Mission and Values<br />
in the Group Profile section). We are always interested<br />
in hearing from them, be it via our sales people, our<br />
project managers, those working on-site, or day-to-day,<br />
via our participation in sectoral meetings, our website or<br />
our other means of communication. We pay particular<br />
attention to their pre-selection criteria in order to meet<br />
their demands as privileged suppliers: criteria relating to<br />
finance, quality, certification, heath, safety, and the<br />
environment.<br />
We must be attentive to our customers in order to<br />
promote their effective practices across the whole value<br />
chain of our products and services, by passing them on<br />
to our suppliers.<br />
Lastly, the financial community helps us to achieve<br />
growth:<br />
■ banks for our financial needs (bank loans and<br />
guarantees, and other commercial banking tools)<br />
■ financial analysts who measure our performance.<br />
Several times a year, we organize meetings in order to<br />
give them an overview of the Group’s evolution and<br />
enable them to interact directly with us.<br />
<strong>Hamon</strong> is aware that the contribution of each stakeholder<br />
adds to its success and performance.<br />
Establishing a permanent dialogue in order to improve<br />
our understanding of their expectations is the first step<br />
towards corporate social responsibility. For this reason,<br />
we welcome comments, aspirations and other views<br />
from all our stakeholders.<br />
■ Our staff can raise their comments with the personnel<br />
department, enterprise committee (for the largest subsidiaries),<br />
senior members of staff or the Compliance<br />
Officer, for example.<br />
■ Other stakeholders can offer their comments via their<br />
contacts at <strong>Hamon</strong>, our website www.hamon.com or<br />
via the contacts mentioned in the General Information<br />
section at the end of this report.<br />
We would like to thank all our stakeholders for their<br />
active contribution to <strong>Hamon</strong>’s success.<br />
Our employees are the heart of our business. They<br />
represent our most precious resource. It is thanks to<br />
their commitment, their know-how, their experience, and<br />
their professional and human values that <strong>Hamon</strong> attains<br />
added value. The section “Corporate Social Responsibility”<br />
in this report details our commitments in this area.<br />
Our suppliers feed our added value chain. Over time,<br />
we are building privileged relationships with some of<br />
these suppliers. We want to ensure a global sourcing for<br />
the whole Group. This strategy enables us to develop<br />
stable relationships with our suppliers around the world,<br />
by providing guaranteed quality at a competitive price.<br />
On an annual basis, we organize audits of several<br />
suppliers. As well as an audit in the strictest sense of<br />
the word, it is the opportunity to exchange points of<br />
view and to have an in-depth and constructive dialogue<br />
with these suppliers.
36<br />
<strong>Hamon</strong> Annual Report 2010<br />
Construction of the Research-Cottrell Cooling (Tianjin) factory in China<br />
Review of the year 2010<br />
Rebound in new order bookings and backlog representing<br />
close to 18 months of revenue<br />
■ New orders at EUR 449,7 million<br />
■ Backlog at EUR 490,3 million<br />
Full year consolidated profit of EUR 13,2 million<br />
(EUR 11,7 million Group share)<br />
■ EBIT margin at 7,6% of revenue, because of decreased<br />
volume.<br />
■ Sharp decrease in net finance costs thanks to the<br />
Group’s improved financial position, its December 2009<br />
refinancing and lower interest rates.<br />
■ Reduction of average tax rate due thanks to<br />
implementation of effective tax management.<br />
Continuous build up for the future<br />
■ Restart of the Dry Cooling activities with strong R&D<br />
and commercial developments, which have negatively<br />
impacted the Business Unit EBIT.<br />
■ Extension of the Heat Exchangers – Air Finned<br />
Coolers – to the Korean EPC market through a joint<br />
venture with BHI and disposal of non-core BFT French<br />
activities.<br />
■ Take over control of our Indian joint venture to be able<br />
to realize the full potential of this buoying market.<br />
■ Development of the APC network in Central Europe,<br />
China, Brazil and development of the Product Portfolio<br />
through acquisition (Enviroserv), licensing and R&D.<br />
■ Using the Chimneys expertise to execute natural draft<br />
cooling towers.<br />
■ Strong presence in emerging markets is pushing our<br />
bookings upwards.<br />
Strong balance sheet structure<br />
■ Equity position at EUR 86,1 million.<br />
■ Net debt at EUR 12,9 million.<br />
■ Net working capital at EUR 0,6 million, under<br />
continuous monitoring.<br />
Final dividend (unchanged) of EUR 0,60 per share<br />
■ Advance payment on dividend has been paid on 9<br />
September 2010 for EUR 0,25 per share.<br />
■ Final dividend to be paid on 10 May 2011 for EUR 0,35<br />
per share.
Part 1 - General presentation of the Group<br />
37<br />
Main events of the year 2010<br />
February<br />
The Shaw group awards to <strong>Hamon</strong> an order amounting<br />
to USD 95 million to build two natural draft cooling<br />
towers for Plant Vogtle in Waynesboro, GA, USA.<br />
This order concerns the nuclear power units 3 and 4<br />
of Plant Vogtle which will be the first one to be built in<br />
the United States in more than 30 years. This illustrates<br />
the successful reentry of <strong>Hamon</strong> on the North<br />
American cooling market.<br />
April<br />
<strong>Hamon</strong> acquires 100% of Enviroserv GmbH, located<br />
in Essen, Germany. Enviroserv is a technological leader<br />
in Air Pollution Control (APC), particularly in flue gas<br />
desulfurization.<br />
Enviroserv is active in Germany and in Eastern Europe<br />
mainly. Its main markets are thermal power plants<br />
and heavy industries. This acquisition will create<br />
significant value for the <strong>Hamon</strong>’s APC activities, among<br />
others thanks to the good product and process complementarity.<br />
June<br />
<strong>Hamon</strong> creates a new subsidiary in China, Research-<br />
Cottrell Cooling (Tianjin) Co. Ltd. The main purpose of<br />
this company is to develop our dry cooling activities in<br />
China, including the manufacturing of finned tube<br />
bundles in its new plant. It also has offices in Beijing<br />
for its technical and commercial activities.<br />
October<br />
<strong>Hamon</strong> acquires 60% of the South African company<br />
J&C Engineering, based near Johannesburg. J&C<br />
Engineering is a well-known player in Air Pollution<br />
Control, more specifically in electrostatic precipitators.<br />
The teaming up of our subsidiary <strong>Hamon</strong> South Africa<br />
with <strong>Hamon</strong> J&C Engineering should allow developing<br />
our APC activities in South Africa significantly, thanks<br />
to excellent complementarities and a mass effect.<br />
November - December<br />
Booking of a large order for cooling systems for several<br />
coal-fired and gas-fired units for Reliance in India.<br />
This order includes the engineering, the supply and the<br />
construction of FRP cooling systems which will be the<br />
largest in the world.<br />
From top to bottom:<br />
Signature of the J&C Engineering acquisition agreements<br />
(South Africa)<br />
Dinner organised by <strong>Hamon</strong> during the Shanghai 2010 Exhibition<br />
<strong>Hamon</strong> sells its subsidiary Brown Fintube France to<br />
the French company Air Industrie Thermique (AIT).<br />
Brown Fintube France did not belong to the core<br />
business of <strong>Hamon</strong>’s business unit “Process Heat<br />
Exchangers”. The transaction price is paid in cash for<br />
a part and in AIT shares for another part.<br />
July<br />
<strong>Hamon</strong> and the South Korean company BHI create a<br />
joint venture in Korea, named <strong>Hamon</strong> D’Hondt BHI.<br />
This JV will be active in air finned coolers for the Oil &<br />
Gas industries. It will focus on the South Korean market<br />
and will sell to South Korean engineering & contractors<br />
(EPC) for the export market. These EPC companies<br />
have seen a sharp growth of their activities these last<br />
few years.<br />
August<br />
<strong>Hamon</strong> Thermal Europe opens a branch in Saint<br />
Petersburg (Russia) to develop the cooling activities<br />
of the Group there.
38<br />
<strong>Hamon</strong> Annual Report 2010<br />
Overview of the main changes of the year<br />
1. Commercial activities<br />
Group<br />
in EUR million 2010 2009<br />
New order bookings 449,7 301,5<br />
Backlog at closing date 490,3 339,2<br />
Bookings totaled EUR 449,7 million for 2010, a high<br />
figure compared to previous years and a sign of the<br />
successes of the Group in re-entering the US wet<br />
cooling markets, emerging markets and also of<br />
increased activity during the second part of the year<br />
in the APC and Chimneys markets.<br />
The backlog, at EUR 490,3 million, is at a new height<br />
and represents close to 18 months of revenues.<br />
New orders and backlog shown above exclude intersegment<br />
activities.<br />
2. Summarized consolidated income statement<br />
in EUR million 2010 2009<br />
Revenue 345,5 379,8<br />
REBITDA 28,1 42,8<br />
Operating profit before non-recurring items (REBIT) 23,5 39,2<br />
Non-recurring gains and losses 2,6 -0,4<br />
Operating profit (EBIT) 26,1 38,8<br />
EBIT/Revenue 7,6% 10,2%<br />
Net finance costs -5,2 -7,2<br />
Result before tax (continued operations) 20,9 31,6<br />
Income tax expenses -7,7 -13,3<br />
Net result from continued operations 13,2 18,3<br />
Net result of discontinued operations 0,0 -0,2<br />
Net result for the period 13,2 18,0<br />
Share of the Group in the net result 11,7 17,4<br />
Results in EUR per share<br />
Average number of shares 7 191 472 7 191 472<br />
REBITDA per share 3,91 5,95<br />
Earnings per Share (EPS) 1,62 2,42<br />
Sales decreased by 9% compared to 2009 while gross<br />
margin was maintained at a similar level of around 23%.<br />
The decrease in volume and the increase in operating<br />
expenses committed as a result of the expected volume<br />
growth and extended perimeter had a scissor effect on<br />
the REBIT margin which decreased to 7% of sales.<br />
REBIT was also impacted by impairment losses of EUR<br />
0,9 million on contracts with Austrian Energy (AE&E)<br />
following the bankruptcy proceedings of this customer<br />
and exchange losses EUR 0,3 million (2009: exchange<br />
gains of EUR 1,4 million).<br />
Non-recurring gains and losses include the gain on<br />
disposal of BFT for EUR 1,8 million, impairment losses<br />
on goodwill and available for sales of EUR 1,3 million<br />
and a EUR 2,3 million gain on the acquisition of the<br />
control of our Indian activities <strong>Hamon</strong> Shriram Cottrell.<br />
Detailed explanations of the activities during this year<br />
are available in the analysis by BU section.<br />
<strong>Hamon</strong> has benefitted from its refinancing end 2009<br />
and from lower interest rates to significantly reduce its<br />
interest costs compared to previous years.<br />
The effective tax rate has decreased from 42% to 37%.<br />
<strong>Hamon</strong> has benefited from tax credits obtained as a result<br />
of our R&D activities in the USA and France. Additionally,<br />
the various deferred tax assets have been reviewed in the<br />
light of up-to-date business plans and resulted in a net<br />
recognition of deferred tax assets for EUR 1,7 million.
Part 1 - General presentation of the Group<br />
39<br />
3. Summarized consolidated balance sheet<br />
Consolidated balance sheet in EUR million 31/12/2010 31/12/2009<br />
Non-current assets 110,5 88,4<br />
Current assets excl. cash 158,3 135,3<br />
Cash & equivalent 68,1 83,3<br />
Total assets 336,9 306,9<br />
Equity 86,1 65,8<br />
Group share 79,6 64,7<br />
Non-controlling interests 6,5 1,1<br />
Non-current liabilities, ex. borrowings 12,1 14,3<br />
Non-current borrowings 62,4 57,4<br />
Current liabilities, excl. borrowings 157,7 151,7<br />
Current borrowings 18,5 17,6<br />
Total equity and liabilities 336,9 306,9<br />
Net debt / (cash) position 12,9 -8,2<br />
Net working capital 0,6 -16,4<br />
The <strong>Hamon</strong> Group balance sheet structure keeps on<br />
improving with equity in excess of EUR 86 million.<br />
The net debt position at EUR 12,9 million reflects good<br />
control on working capital. <strong>Hamon</strong> wants to keep<br />
operating at low working capital, knowing however that<br />
the nature of its business, with significant individual<br />
payments, can generate significant swings from one<br />
day to the other.<br />
Non-current assets increase primarily because of<br />
the exchange rate effect on the assets located outside<br />
of the Euro zone, acquisitions of subsidiaries and<br />
operating capex.<br />
Events after the balance sheet date<br />
None.<br />
Prospects<br />
In view of the general economic environment, <strong>Hamon</strong><br />
does not release any guidance on its future results.<br />
However the Group looks confidently at 2011 given its<br />
excellent backlog and its strong financial structure.
40<br />
<strong>Hamon</strong> Annual Report 2010<br />
Part 2
Part 1 - General presentation of the Group<br />
41<br />
Review by Business Unit
42<br />
<strong>Hamon</strong> Annual Report 2010<br />
The exhaust gas duct is put in place inside of a natural<br />
draft cooling tower in Germany<br />
Air cooled condenser built by Research-Cottrell in Turkey<br />
Cooling Systems<br />
The Cooling Systems business unit offers equipment<br />
and services intended to cool water through<br />
contact with air and to condense steam resulting<br />
from the production processes of power stations<br />
and heavy industry most notably chemicals,<br />
petrochemicals, iron and steel, paper making, and<br />
sugar refining.<br />
or ‘wet-dry’ or ‘humid-dry’ system. Dry cooling systems<br />
(air cooled condensers or indirect systems) allow the<br />
cooling of the steam in closed circuits, without water<br />
consumption and without release of plume. They are<br />
therefore the solution to cooling problems in areas<br />
where water is scarce, for example in parts of<br />
continental China, South Africa or the Middle East.<br />
Products and services<br />
<strong>Hamon</strong> delivers technical solutions adapted to the<br />
needs and requirements of its customers: electric<br />
power plants, engineering companies of international<br />
renown and industries.<br />
The evaporative cooling systems are differentiated by<br />
their method of air flow generation: natural draft in the<br />
case of a chimney or induced draft when fans are used<br />
and whether they include or not a system reducing or<br />
eliminating the visibility of the plume: so-called ‘hybrid’<br />
Contribution to our society<br />
For users which are producers of electricity, the social<br />
contribution of the cooling systems is to facilitate the<br />
production of more electricity for a given consumption<br />
of primary energy. If the cooling water from the cooling<br />
system is two degrees Celsius colder, the output of a<br />
steam turbine increases by approximately 0,6%, which<br />
corresponds to an increase of more than one percent<br />
in the electricity output. For a same production of<br />
electricity, it allows to consume less primary energy<br />
(coal, gas, etc.) and therefore to release less CO 2<br />
into<br />
the atmosphere.
Part 2 - Review by Business Unit<br />
43<br />
In other cases, the use of a cooling system (closed<br />
circuit) prevents the heating of sea or river water (used<br />
in open circuit) and the loss of marine life.<br />
Organization<br />
The business unit’s center of expertise is located in<br />
Mont-St-Guibert (Belgium), while its R&D center is<br />
situated near Drogenbos (Belgium). The unit has<br />
offices in several countries: Australia, Bahrain, Brazil,<br />
China, England, France, Germany, India, Indonesia,<br />
Russia, South Africa, South Korea, Thailand, United<br />
Arab Emirates, United States of America as well as a<br />
network of independent agents.<br />
Key components are manufactured in factories of the<br />
Group in France, India and China as well as in the<br />
United States of America.<br />
Research & development<br />
In 2010, the main R&D programs of the business unit<br />
were in the following areas:<br />
■ Development of new thermal exchange surfaces<br />
(wet cooling).<br />
■ Development of new software and of a new kind<br />
of finned tube for air cooled condensers.<br />
■ Thermal optimization of finned tubes sold under the<br />
CTEC brand name (dry cooling).<br />
Key figures<br />
covering the engineering, supply and erection of FRP<br />
cooling towers, the biggest FRP cooling systems in<br />
the world;<br />
■ the construction of a 800 MW dry/wet fan-assisted<br />
natural draft cooling tower (first tower of this type in<br />
the world) in Hamburg-Moorburg coal-fired power<br />
plant (a Vattenfall Germany plant);<br />
■ the engineering and supply of a natural draft cooling<br />
tower for a second nuclear power plant in China;<br />
■ the refurbishment of a natural draft cooling tower in<br />
the Far East;<br />
■ the supply of concrete cells for the extension of a<br />
refinery in Asia;<br />
■ new cooling towers awarded by RWE Power and<br />
Basell Polyolefine in Germany;<br />
■ the revamping and improvement of the performances<br />
of natural draft cooling towers for EDF, France.<br />
Thanks to its good commercial performance, the<br />
backlog of the business unit is at its highest level ever.<br />
Revenue, at EUR 128,5 million, is lower than last year<br />
due to the timing of execution of our contracts.<br />
EBIT is impacted by EUR 3,9 million because of the<br />
higher operating costs linked to the re-launch of our<br />
Dry activities worldwide. Excluding that effect, the EBIT<br />
margin would have been in line with the one of the<br />
previous year.<br />
The business unit maintains a high level of R&D<br />
activities to keep and strengthen its position as technology<br />
leader in the market.<br />
in EUR million 2010 2009<br />
New order bookings 263,0 110,1<br />
Revenue 128,5 143,8<br />
Backlog on 31/12 268,0 104,3<br />
EBIT 9,2 12,5<br />
EBIT / revenue 7,2% 8,7 %<br />
Average headcount (1) 547 482<br />
(1)<br />
excluding temporary workers for on-site construction<br />
Prospects for 2011<br />
The business unit activities should remain at a good<br />
level during 2011 thanks to its high backlog, with the<br />
Dry cooling developments coming as an add up.<br />
2010 results<br />
The new orders booked by the Cooling systems in 2010<br />
amount to EUR 263,0 million, including, amongst the<br />
biggest ones:<br />
■ the construction of 2 natural draft cooling towers for<br />
the nuclear power plant Vogtle in the USA;<br />
■ 3 contracts signed with Reliance Power in India,
44<br />
<strong>Hamon</strong> Annual Report 2010<br />
From left to right :<br />
Workers inspecting air cooler flange welding<br />
Stud being welded on pipes<br />
Process Heat Exchangers<br />
The Process Heat Exchangers business unit offers<br />
various systems intended to cool or heat, often at<br />
high pressure, more or less corrosive liquids or gases<br />
resulting mainly from petrochemical processes.<br />
It operates either directly with its industrial clients<br />
like Aramco, BASF, ExxonMobil, Gazprom, GDF,<br />
Sabic, Shell and Total, or indirectly via engineering<br />
companies of international renown like Fluor, Foster<br />
Wheeler, Jacobs, Mitsubishi, Saipem, Tecnicas<br />
Réunidas, Technip, Linde, CBI, SNC Lavalin, ...<br />
Products and services<br />
This unit delivers design, manufacturing and assistance<br />
with the assembly of thermal equipment – mainly air<br />
coolers, as well as FRP components like ducts for flue<br />
gas exhaust or acid-proof storage tanks. It also offers<br />
integrated aftermarket sales services including maintenance,<br />
rehabilitation and the sale of spare parts.<br />
Contribution to our society<br />
Process heat exchangers contribute to society by<br />
enabling oil and gas industries to run more effectively,<br />
by obtaining the right temperature for the fluids that<br />
they process. For example, in the compression streams<br />
of natural gas used for its liquefaction, the gas is<br />
heated during the adiabatic compression. The heat<br />
exchangers, located between the different compression<br />
stages, facilitate the gradual extraction of heat from the<br />
compression process. Without this, the liquefaction of<br />
the gas and its shipment in a liquefied form would be<br />
impossible. Our exchangers are therefore an essential<br />
link in the liquefaction process of the gas and therefore<br />
also in the diversification of the energy supply.<br />
Organization<br />
The Process Heat Exchangers business consists of one<br />
company established in France, one in Belgium as well<br />
as a joint venture in Saudi Arabia and a new joint<br />
venture in South Korea.
Part 2 - Review by Business Unit<br />
45<br />
■ <strong>Hamon</strong> D’Hondt, located near Valenciennes (France)<br />
represents the major part of the activities of this<br />
business unit. It is in charge of the design, marketing<br />
& promotion, manufacturing, and after-sales service of<br />
air coolers as well as the manufacturing of welded<br />
steel finned tubes. <strong>Hamon</strong> D’Hondt also owns 40%<br />
of a joint venture in Jubail in Saudi Arabia, <strong>Hamon</strong><br />
D’Hondt Middle East, specializing in the manufacturing<br />
of air coolers for the Persian Gulf market.<br />
■ ACS Anti Corrosion Structure, located in Seneffe<br />
(Belgium). This subsidiary manufactures FRP components<br />
(Fiberglass Reinforced Polyester) like ducts for<br />
flue gas exhaust or acid-proof storage tanks, both in<br />
its plant and on-site. This subsidiary was integrated to<br />
this business unit end of 2010.<br />
■ <strong>Hamon</strong> D’Hondt BHI, the new joint venture created<br />
mid-2010 with the Korean company BHI. It will focus<br />
on aircoolers for South Korean engineering companies<br />
active in South Korea and on the export market.<br />
Let us mention that Brown Fintube France, which was<br />
part of this business unit, was sold end of June 2010<br />
(see section Review of the year 2010).<br />
The creation of the joint venture with BHI (South Korea)<br />
should allow <strong>Hamon</strong> to benefit from the successes of<br />
the Korean EPC contractors in the Gulf markets.<br />
Good performance in projects management generated<br />
an EBIT of EUR 2,9 million. This EBIT excludes the<br />
profit on the disposal of BFT, reported under the<br />
unallocated segment, but includes the result from<br />
operations of BFT up to 30 June 2010.<br />
With effect on 31 December 2010, ACS, a small<br />
manufacturing activity based in Seneffe (Belgium) has<br />
been incorporated in the Process Heat Exchangers BU<br />
(previously unallocated).<br />
Prospects for 2011<br />
The activities of this business unit should remain at a<br />
good level in 2011 thanks to its well filled backlog as of<br />
end 2010, to its strong commercial activities early 2011<br />
and to its developments in Korea.<br />
Key figures<br />
in EUR million 2010 2009<br />
New order bookings 43,1 55,6<br />
Revenue 41,9 54,4<br />
Backlog on 31/12 50,7 38,4<br />
EBIT 2,9 5,3<br />
EBIT / revenue 6,9% 9,7%<br />
Average headcount 161 174<br />
Note: the 2010 figures include BFT only till 30 June, date at<br />
which it was sold.<br />
2010 results<br />
New bookings and sales reflect lower material cost<br />
passed through to customers and slow pace of capex<br />
of the Oil & Gas companies during the first half year of<br />
2010.<br />
Among the main new orders let us mention the one<br />
for seven air coolers in Brazil, for the Itaborai new<br />
petrochemical plant. <strong>Hamon</strong> D’Hondt steps into the<br />
Brazilian market; this market offers very promising<br />
prospects thanks to the important development of its<br />
oil& gas and petrochemical industries.
46<br />
<strong>Hamon</strong> Annual Report 2010<br />
From left to right :<br />
Flue gas desulphurization unit installed in a power plant by our<br />
new German subsidiary Enviroserv<br />
Flue gas treatment unit built for the Mulhouse waste<br />
incineration unit (France)<br />
Air Pollution Control EMEA / Brazil<br />
The objective of the Air Pollution Control EMEA/<br />
Brazil business unit is to provide industries with the<br />
means to control the impact of their businesses on the<br />
environment. Other than providing an integrated<br />
service, this unit also designs, makes and installs air<br />
pollution control systems for different kinds of<br />
pollutants, thus ensuring strict conformity to the air<br />
protection regulations in force.<br />
Products and services<br />
The business unit offers, on its own or in partnership,<br />
turnkey solutions for the environmental problems faced<br />
by its customers.<br />
The market is segmented between:<br />
■ power stations and energy production in general;<br />
■ heavy industry such as iron and steel, cement,<br />
glassmaking and petrochemicals;<br />
■ biomass energy producers utilizing household, industrial<br />
and hospital wastes, and water purification sludge.<br />
The internationally renowned technologies that make up<br />
its product portfolio can be divided into two groups: one<br />
is a physical kind, de-dusting, while the other is physicochemical:<br />
neutralization of acid gases, deSOx, deNOx,<br />
elimination of heavy metals. The acquisition of new<br />
technologies has allowed <strong>Hamon</strong> to adapt and progressively<br />
complete its product range so that it can now<br />
deliver to every specific need in the market.<br />
The BU activity is divided into two parts. On the one<br />
hand is the design and installation of new equipment for<br />
new plants or to retrofit existing ones; and on the other<br />
is after-sales services including among other things<br />
maintenance and the supply of spare parts.<br />
Air Pollution Control is a complex business. Mitigating<br />
the technological risks requires know-how and solid<br />
experience, as well as an excellent knowledge of the<br />
customers’ processes. This is the case of <strong>Hamon</strong>
Part 2 - Review by Business Unit<br />
47<br />
Research-Cottrell, also known as <strong>Hamon</strong> Environmental.<br />
The BU enjoys an excellent reputation in its target<br />
markets; energy, glassmaking, cement, waste-to-energy<br />
facilities, steel and the petrochemical industry. <strong>Hamon</strong><br />
is one of the leaders in Western Europe in upgrading<br />
waste incinerators to present air quality standards.<br />
Contribution to our society<br />
The contribution to society of the air pollution control<br />
facilities is particularly real for the inhabitants of<br />
neighboring regions. They dramatically reduce the<br />
quantity of dust, acid gases and other pollutants<br />
released into the atmosphere by heavy industries.<br />
Organization<br />
The business unit kept going with its development in<br />
2010, with the acquisitions of Enviroserv (Germany) and<br />
J&C Engineering (South Africa). For more details,<br />
please refer to the section Review of the year 2010.<br />
The business unit covers the entire world outside North<br />
America, the latter region being under the responsibility<br />
of the North American business unit (see following<br />
pages).<br />
This BU has subsidiaries located in Belgium, France,<br />
Germany, India, China, Brazil, South Africa and South<br />
Korea, also with a branch in Italy, plus a network of<br />
agents.<br />
Research & development<br />
The main R&D programs on which the business unit<br />
was active in 2010 were the following:<br />
■ Development of a software to make plans for<br />
electrostatic precipitators in a more automated way.<br />
■ Optimization of electrostatic precipitators sizing.<br />
■ Improvement of the desulfurization process based on<br />
seawater.<br />
■ Optimization of circulating fluidized bed (CFB) process<br />
for waste incineration.<br />
Key figures<br />
in EUR million 2010 2009<br />
New order bookings 65,2 67,3<br />
Revenue 71,9 39,1<br />
Backlog on 31/12 90,0 85,6<br />
EBIT 0,9 0,0<br />
EBIT / revenue 1,2% -0,1%<br />
Average headcount 220 172<br />
2010 results<br />
Bookings in 2010, at EUR 65,2 million, include mainly<br />
contracts in Brazil, Spain, China and France.<br />
Revenue, at EUR 71,9 million, is significantly higher as<br />
a result of the first positive developments of the<br />
Business Unit on its new markets in Germany, Eastern<br />
Europe, China, South Africa and Brazil. Excellent<br />
prospects on these markets bode well for the future of<br />
these investments.<br />
Nevertheless, the increase in revenue in 2010 was not<br />
high enough to compensate for the increasing overhead<br />
costs due to the development strategy described<br />
hereabove.<br />
Additional average headcount is coming from the<br />
acquisitions made during 2009 and 2010 and from the<br />
investments being made in establishing a team responsible<br />
for Central & Eastern Europe and China.<br />
Prospects for 2011<br />
The prospects remain good for this business unit in<br />
2011. It should benefit from the investments made<br />
these last few years in high growth markets (India,<br />
Brazil, China, South Africa, etc.).
48<br />
<strong>Hamon</strong> Annual Report 2010<br />
From left to right :<br />
Wet gas scrubber built in a U.S. refinery<br />
Heat recuperator built by TTC (USA)<br />
Air Pollution Control NAFTA<br />
The business unit’s objectives are to provide industry<br />
with the means to control and limit the environmental<br />
impact of its processes, while helping to reduce its energy<br />
consumption. Tailor-made solutions are proposed to<br />
each customer, using leading- edge technologies. The<br />
business unit designs and supplies (and in some cases<br />
installs) Air Pollution Control systems and provides<br />
strong aftermarket service. Products supplied are<br />
designed to control various types of air pollutants in<br />
accordance with the stringent environmental regulations<br />
in the NAFTA region. The business unit also<br />
designs and supplies heat recovery systems.<br />
Products and services<br />
Air pollution control technologies are divided into two<br />
groups:<br />
■ Physical – de-dusting<br />
■ Chemical – neutralization of acid gases, deSOx,<br />
deNOx, and elimination of heavy metals.<br />
The business unit presently markets seven main air<br />
pollution control technologies:<br />
1. De-dusting by means of electrostatic precipitators.<br />
2. De-dusting by means of fabric filters, including the<br />
industry-leading low-pressure pulsejet design.<br />
3. Wet gas scrubbing (an “ExxonMobil” process), used<br />
in the petrochemical industry; it is a deSOx and<br />
particulate removal system for gases emitted by<br />
catalytic cracking plants. It has been complemented<br />
by a deNOx process, with the combined offering<br />
called WGS+.<br />
4. Dry flue-gas desulphurization (a “Marsulex” process),<br />
used for desulfurizing the gases emitted by coal-fired<br />
and biomass-fired power stations.<br />
5. U2A process to transform urea into ammonia,<br />
a difficult to handle reagent used in SCR deNOx<br />
systems.<br />
6. SNCR DeNOx systems (Exxon Mobil process) used<br />
for the capture of NOx.<br />
7. ReACT (J-Power EnTech process) used for the<br />
simultaneous capture of SOx, NOx, particulates and<br />
mercury without any use of water.
Part 2 - Review by Business Unit<br />
49<br />
The Heat Recovery product line includes recuperators,<br />
economizers, and gas-to-gas heat exchangers.<br />
Key figures<br />
Contribution to our society<br />
The contribution to the society of these units is the<br />
following:<br />
■ For APC units, the contribution is very perceptible for<br />
the inhabitants of the surrounding areas : these units<br />
drastically reduce the amounts of dust, acid gases<br />
and other pollutants released into the atmosphere by<br />
heavy industries.<br />
■ For heat recovery units, they allow industrials to<br />
reduce their energy consumption by recuperating the<br />
heat carried by some fluids; lower amounts of fuel<br />
burnt means less greenhouse effect gases released<br />
into the atmosphere.<br />
Organization<br />
The business unit consists of three subsidiaries:<br />
■ <strong>Hamon</strong> Research-Cottrell U.S. (HRCUS), specializing<br />
in the design and supply of new air pollution control<br />
units and Heat Transfer Fluid systems (HTF) for solar<br />
steam generation systems (SSGS) on solar thermal<br />
power plants.<br />
■ <strong>Hamon</strong> Custodis Cottrell Canada, supporting both<br />
HRCUS and <strong>Hamon</strong> Custodis activities in Canada.<br />
■ Thermal Transfer Corporation (TTC), specializing in<br />
the manufacturing of heat recovery systems, electrodes<br />
for electrostatic precipitators and finned tube<br />
bundles for Air Cooled Steam Condensers. TTC also<br />
serves as a logistics base for HRCUS.<br />
Research & development<br />
The main R&D programs on which the business unit<br />
worked in 2010 are the following:<br />
• Solar Steam-Generating Systems (SSG): HRCUS has<br />
continued to develop complete HTF systems to accept<br />
hot oil originating in a solar field. This development<br />
includes all expansion and storage systems, oil<br />
purification or ullage systems as well as associated<br />
controls. Current development is for 50 to 125 MW<br />
units.<br />
• ReACT Multipollutant Control System. HRCUS<br />
adapted this process, licensed by J-Power Entech to<br />
HRCUS, to suit the US market including standardization<br />
of key components.<br />
in EUR million 2010 2009<br />
New order bookings 41,2 34,4<br />
Revenue 46,4 68,0<br />
Backlog on 31/12 27,5 30,8<br />
EBIT 8,0 11,7<br />
EBIT / revenue 17,3% 17,2 %<br />
Average headcount 124 147<br />
2010 results<br />
Strong 4th quarter bookings overcame the recessioninduced<br />
stagnant market in the first part of the year<br />
2010. Full year bookings increased by approximately<br />
20% from 2009 levels. With the advent of stricter<br />
emission standards the NAFTA air pollution control<br />
market began to show signs of recovery. The Business<br />
Unit has been awarded limited notices to proceed on<br />
projects that are expected to yield bookings of over<br />
EUR 20 million in the first half of 2011.<br />
Revenue fell, due to the timing of new orders which<br />
impacted EBIT, but close attention to staffing and<br />
project execution maintained the EBIT percentage<br />
from year to year. A strict monitoring of headcounts and<br />
an outstanding project execution allowed maintaining<br />
the EBIT margin at a very high level (17%) from year<br />
to year.<br />
Outlook for 2011<br />
It is difficult to make forecasts for this business unit.<br />
Like in 2010, it might be penalized by a lack of clear<br />
energy policy and regulation in the United States.<br />
However the existing coal-fired power plants must be<br />
maintained, via some refurbishing of equipment, which<br />
is good for <strong>Hamon</strong>.
50<br />
<strong>Hamon</strong> Annual Report 2010<br />
2<br />
From left to right :<br />
Successive steps installing the exhaust gas duct elbow for a chimney in the USA<br />
(pictures 1, 2 and 3)<br />
Chimneys<br />
This business unit offers systems designed to vent to the<br />
atmosphere flue gas generated by power plant boilers<br />
and other various industries like incinerators, steel mills,<br />
pulp & paper facilities, cement factories, glass factories.<br />
These systems include the chimney and its auxiliaries<br />
(linings, electrical systems, silencers and access provisions);<br />
they are custom designed and adapted to the customer’s<br />
various needs and constraints.<br />
The design and construction of high chimneys require<br />
specialized expertise, equipment, labor, and other<br />
resources that only a few companies possess, creating<br />
a competitive advantage for <strong>Hamon</strong>. These barriers to<br />
market entry explain the limited number of competitors in<br />
this market in the US. <strong>Hamon</strong> Custodis also has a complete<br />
aftermarket team which provides regional customer<br />
service to the repair and maintenance markets.<br />
Contribution to our society<br />
Products and services<br />
<strong>Hamon</strong> Custodis designs and constructs tall chimneys;<br />
they can be more than 200 meters tall. The shell is<br />
typically made in concrete, they include a flue liner, which<br />
depending on the nature of the waste gases, are fabricated<br />
of steel, brick, fiberglass-reinforced plastic and special<br />
alloys or linings to handle corrosive gases.<br />
The contribution of these tall chimneys to society is to<br />
provide better dispersion of flue gases (produced by heavy<br />
industries) into the atmosphere, to preclude exposing the<br />
adjacent community to poor air quality when atmospheric<br />
conditions are unfavorable. Chimneys have become an<br />
integral part of pollution control systems, in particular flue<br />
gas desulphurization (FGD) systems.
Part 2 - Review by Business Unit<br />
51<br />
3<br />
Key figures<br />
in EUR million 2010 2009<br />
New order bookings 68,3 19,7<br />
Revenue 51,6 72,8<br />
Backlog on 31/12 83,9 62,0<br />
EBIT 8,5 12,7<br />
EBIT / revenue 16,4% 17,4 %<br />
Average headcount 53 56<br />
1<br />
2010 Results<br />
Chimneys continued their record of strong performance.<br />
Orders were up substantially for new chimneys and<br />
aftermarket. The Business Unit also booked an intercompany<br />
subcontract for the civil construction work on the<br />
cooling towers for the Vogtle Nuclear Power Plant.<br />
Synergies between these subsidiaries helped maintain the<br />
excellent EBIT rate.<br />
Revenue fell versus the prior year due to the timing of new<br />
orders and the long-term nature of the cooling tower<br />
subcontract. Close control of overheads and strong project<br />
execution helped maintain the EBIT rate at close to the<br />
previous year’s record level.<br />
Outlook for 2011<br />
Organization<br />
The prospects are good for the year 2011, as the business<br />
unit starts the year with a well filled backlog.<br />
In North America, <strong>Hamon</strong> is active in the chimney market<br />
through its subsidiary companies <strong>Hamon</strong> Custodis, based<br />
in the United States, and <strong>Hamon</strong> Custodis Cottrell Canada,<br />
located in Ontario, Canada. Moreover, <strong>Hamon</strong> Custodis<br />
operates three regional offices strategically located in the<br />
contiguous United States, which offer mainly aftermarket<br />
sales services (maintenance and repair).<br />
The market segments in which the business unit is involved<br />
consist mainly of end-users, in large part fossil fuel power<br />
generating stations.<br />
Research & Development<br />
<strong>Hamon</strong> Custodis continues to be an innovator in design<br />
and construction methods for tall concrete chimneys and<br />
has recently developed a new methodology and applied<br />
for a patent that will streamline the placement of concrete<br />
during the erection of tall structures like chimneys.
Part 3
Financial Statements
54<br />
<strong>Hamon</strong> Annual Report 2010<br />
financial statements - TABLE of content<br />
56 Consolidated income statement<br />
56 Consolidated statement<br />
of comprehensive income<br />
57 Consolidated balance sheet<br />
58 Consolidated cash flow statement<br />
59 Consolidated statement<br />
of changes in equity<br />
60 Notes to the consolidated<br />
financial statements<br />
60 General information<br />
60 Declaration of compliance and responsibility<br />
60 Principal accounting standards<br />
69 Key assumptions and estimates<br />
70 Consolidated entities<br />
71 Exchange rates used by the Group<br />
71 Information by segment<br />
75 Revenue<br />
75 Operating expenses<br />
76 Other operating income/(expenses)<br />
76 Non-recurring income (expenses)<br />
77 Net finance costs<br />
78 Income tax<br />
78 Discontinued operations<br />
79 Changes of scope<br />
80 Earnings per share<br />
81 Cash flow from operating activities<br />
81 Cash flow from investing activities<br />
81 Cash flow from financing activities<br />
81 Cash flow from discontinued activities<br />
81 Intangible assets<br />
83 Goodwill<br />
84 Property, Plant & Equipment<br />
85 Available-for-sale financial assets<br />
87 Deferred tax<br />
87 Inventories<br />
87 Constructions contracts
Part 3 - Financial Statements<br />
55<br />
88 Trade and other receivables<br />
88 Cash and cash equivalents<br />
89 Share capital<br />
90 Provisions for other liabilities and charges<br />
90 Provisions for pensions<br />
94 Share-based compensation (stock options)<br />
95 Financial liabilities<br />
96 Trade and other payables<br />
97 Derivative instruments<br />
98 Financial instruments<br />
99 Risk management policies<br />
103 Guarantees on the Group’s assets<br />
104 Finance and operating lease agreements<br />
105 Commitments<br />
106 Contingent liabilities<br />
106 Related parties<br />
108 Management compensation<br />
109 Staff<br />
109 Significant grants and state aids received<br />
109 Events after the balance sheet date<br />
109 Auditor’s fees<br />
110 Statutory auditor’s report<br />
on the consolidated financial statements<br />
for the year ended 31 December 2010<br />
to the shareholders’ meeting<br />
112 Statutory accounts of <strong>Hamon</strong> & Cie<br />
(International) SA
56<br />
<strong>Hamon</strong> Annual Report 2010<br />
1. Consolidated income statement<br />
in EUR ‘000’ note 2010 2009 2008<br />
Revenue 8 345 533 379 777 366 679<br />
Cost of sales (264 706) (289 976) (279 240)<br />
Gross profit 80 827 89 801 87 439<br />
Sales & marketing costs 9 (10 499) (10 776) (8 697)<br />
General & administrative costs 9 (43 870) (39 922) (34 018)<br />
Research & development costs 9 (1 705) (817) (663)<br />
Other operating income / (expenses) 10 (1 210) 905 (1 094)<br />
Operating profit before non-recurring items (REBIT) 23 543 39 191 42 967<br />
Restructuring costs 11 (308) (390) (132)<br />
Impact of Changes in consolidation scope 11 4 055 828<br />
Impairment / reversal of impairment on non-current assets 11 (1 173)<br />
Other non-recurring items 11 - (16) 56<br />
Operating profit (EBIT) 26 117 38 785 43 719<br />
Interest income 12 332 323 1 255<br />
Interest charges 12 (5 561) (7 521) (9 904)<br />
Result before tax 20 888 31 587 35 070<br />
Income taxes 13 (7 709) (13 332) (14 411)<br />
Net result from continued operations 13 179 18 255 20 659<br />
Net result of discontinued operations 14 (22) (243) (1 788)<br />
Net result 13 157 18 012 18 871<br />
Equity holders of the Company 11 631 17 369 18 505<br />
Non controlling interests 1 526 643 366<br />
Earnings per share 16<br />
Continued and discontinued operations<br />
Basic earnings per share (EUR) 1,62 2,42 2,57<br />
Diluted earnings per share (EUR) 1,62 2,42 2,57<br />
Based on their strike price, the stock options granted<br />
to Group employees have no dilutive impact at period(s) end.<br />
Continued operations<br />
Basic earnings per share (EUR) 1,62 2,45 2,82<br />
Diluted earnings per share (EUR) 1,62 2,45 2,82<br />
2. Consolidated statement of comprehensive income<br />
in EUR ‘000’ 2010 2009 2008<br />
Net result 13 157 18 012 18 871<br />
Change in fair value of available-for-sale financial assets 2 029 294 (26)<br />
Change in fair value of hedging instruments 0 711 (693)<br />
Changes in currency translation reserve 7 118 572 (1 162)<br />
Comprehensive income 22 304 19 589 16 990<br />
Equity holders of the Company 19 901 18 980 16 734<br />
Non controlling interests 2 403 609 256
Part 3 - Financial Statements<br />
57<br />
3. Consolidated balance sheet<br />
in EUR ‘000’ note 31/12/10 31/12/09 31/12/08<br />
ASSETS<br />
Non-current assets<br />
Intangible assets 21 9 321 5 176 3 832<br />
Goodwill 22 49 118 41 647 29 589<br />
Property, plant & equipment 23 34 303 30 231 23 374<br />
Deferred tax assets 25 8 410 6 170 5 975<br />
Available-for-sale financial assets 24 6 625 2 416 1 383<br />
Trade and other receivables 28 2 735 2 756 2 602<br />
Derivative financial assets 36 - - -<br />
110 512 88 396 66 755<br />
Current assets<br />
Inventories 26 14 181 9 695 8 892<br />
Amount due from customers for contract work 27 33 247 32 526 37 877<br />
Trade and other receivables 28 103 544 88 176 108 583<br />
Derivative financial assets 36 94 444 434<br />
Cash and cash equivalents 29 68 077 83 253 59 089<br />
Current tax assets 7 194 4 407 3 756<br />
Available-for-sale financial assets 24 7 5 244<br />
226 344 218 506 218 875<br />
Total assets 336 856 306 902 285 630<br />
EQUITY 30<br />
Share capital 1 892 1 892 1 892<br />
Reserves 19 189 10 874 9 200<br />
Retained earnings 58 519 51 922 37 566<br />
Equity attributable to the equity holders of the Company 79 600 64 688 48 658<br />
Non controlling interests 6 538 1 115 711<br />
Total equity 86 138 65 803 49 369<br />
LIABILITIES<br />
Non-current liabilities<br />
Financial liabilities 34 61 737 57 447 40 252<br />
Provisions for pensions 32 3 521 2 938 2 603<br />
Provisions for other liabilities and charges 31 931 2 093 1 280<br />
Deferred tax liabilities 25 3 183 2 523 3 273<br />
Other non-current liabilities 4 456 6 786 2 146<br />
73 828 71 787 49 554<br />
Current liabilities<br />
Financial liabilities 34 19 216 17 618 29 606<br />
Amount due to customers for contract work 27 58 182 64 230 69 403<br />
Trade and other payables 35 89 728 75 459 79 788<br />
Current tax liabilities 4 192 6 352 2 817<br />
Derivative financial liabilities 36 34 59 1 597<br />
Provisions for other liabilities and charges 31 5 538 5 594 3 496<br />
176 890 169 312 186 707<br />
Total liabilities 250 718 241 099 236 261<br />
Total equity and liabilities 336 856 306 902 285 630
58<br />
<strong>Hamon</strong> Annual Report 2010<br />
4. Consolidated cash flow Statement<br />
in EUR ‘000’ note 2010 2009 2008<br />
Cash flows from operating activities 17<br />
Cash received from customers 332 273 392 784 426 820<br />
Cash paid to suppliers and employees (321 231) (333 510) (374 953)<br />
Cash generated from operations before taxes 11 042 59 274 51 867<br />
Other financial expenses and income (paid)/received (394) (591) (325)<br />
Income taxes paid (12 678) (11 249) (17 214)<br />
Other cash received / (paid) - (71) -<br />
Net cash from operating activities (2 030) 47 363 34 328<br />
Restructuring costs (678) (176) (302)<br />
Net cash from operations after restructuring (2 708) 47 187 34 026<br />
Cash flows from investing activities 18<br />
Dividends received 194 79 43<br />
Proceeds on disposal of subsidiaries (net of cash disposed) 1 825 - -<br />
Proceeds on disposal of PP&E 416 123 587<br />
Proceeds/(Purchase) of available for sale financial assets (975) (437) 1 032<br />
Acquisition of Subsidiaries (net of cash acquired) 15 (4 961) (3 154) (1 528)<br />
Acquisition of PP&E (5 816) (9 104) (3 362)<br />
Disposal/(purchase) of other intangible assets (844) (970) (2 152)<br />
Capitalized development costs (2 937) (1 298) (548)<br />
Net cash from investing activities (13 098) (14 761) (5 928)<br />
Cash flows from financing activities 19<br />
Dividends paid to shareholders (5 171) (2 117) (2 130)<br />
Dividends paid to non controlling interests (223) (12) (5)<br />
Proceeds from issuance of shares to non controlling interests 516 55 198<br />
Interest received 305 322 1 489<br />
Interest paid (3 969) (5 304) (6 448)<br />
Proceeds from new bank borrowings 11 158 67 574 24 386<br />
Repayment of borrowings (7 644) (67 800) (22 586)<br />
Net cash from financing activities (5 028) (7 282) (5 096)<br />
Other cash flow mouvements<br />
Other variations from discontinued operations 14,20 (22) (242) (441)<br />
Other net cash flows (22) (242) (441)<br />
Net variation of cash and cash equivalents (20 856) 24 902 22 561<br />
Cash and cash equivalents at beginning of period 83 253 59 089 35 658<br />
Impact of translation differences 5 680 (738) 870<br />
Cash and cash equivalents at end of period 68 077 83 253 59 089<br />
Net variation of cash and cash equivalents (20 856) 24 902 22 561
Part 3 - Financial Statements<br />
59<br />
5. Consolidated statement of changes in equity<br />
in EUR ‘000’ Share Legal Share Retained AFS Share- Hedging Currency Equity Non Total<br />
capital reserve premium earnings reserve based reserve translation Attribuable to controlling equity<br />
payments reserves equity holders interests<br />
of the parent<br />
Balance at 1 January 2008 1 892 671 18 858 16 906 - - (18) (4 215) 34 094 268 34 362<br />
Capital increases - -<br />
Comprehensive income 18 505 (26) (674) (1 071) 16 734 256 16 990<br />
Dividends paid<br />
to shareholders (2 157) (2 157) (5) (2 162)<br />
Recognition of<br />
share-based payments (17) (17) (17)<br />
Other movements (4 308) 4 312 4 192 196<br />
Balance at 31 December 2008 1 892 671 14 550 37 566 (26) (17) (692) (5 286) 48 658 711 49 369<br />
Balance at 1 January 2009 1 892 671 14 550 37 566 (26) (17) (692) (5 286) 48 658 711 49 369<br />
Capital increases<br />
Comprehensive income 17 369 291 693 627 18 980 609 19 589<br />
Dividends paid<br />
to shareholders (3 021) (3 021) (12) (3 033)<br />
Change in share based<br />
payments reserve 63 63 63<br />
Other movements 8 17 (17) 8 (193) (185<br />
Balance at 31 December 2009 1 892 671 14 550 51 922 265 63 (16) (4 659) 64 688 1 115 65 803<br />
Balance at 1 January 2010 1 892 671 14 550 51 922 265 63 (16) (4 659) 64 688 1 115 65 803<br />
Capital increases 516 516<br />
Comprehensive income 11 631 2 010 6 260 19 901 2 403 22 304<br />
Dividends paid<br />
to shareholders (5 034) (5 034) (223) (5 257)<br />
Change in share based<br />
payments reserve 45 45 45<br />
Other movements 2 727 2 727<br />
Balance at 31 December 2010 1 892 671 14 550 58 519 2 275 108 (16) 1 601 79 600 6 538 86 138<br />
The line « Other movements » in non controlling interests of EUR 2.727 thousand mostly (EUR 2.708 thousand)<br />
comes from the changes in consolidation scope of HSC and J&C.
60<br />
<strong>Hamon</strong> Annual Report 2010<br />
6. Notes to the consolidated financial statements<br />
1. General information<br />
<strong>Hamon</strong> & Cie (International) SA (hereafter called<br />
‘<strong>Hamon</strong>’ or ‘the Company’) is a limited liability company<br />
under Belgian law. Its registered office is Axisparc, rue<br />
Emile Francqui 2, B-1435 Mont-St-Guibert, Belgium;<br />
telephone: 32 10 39 04 00.<br />
The principal activities of <strong>Hamon</strong> and the various<br />
subsidiaries of the Group are described in the first part<br />
of this annual report.<br />
The legislation governing the activities of <strong>Hamon</strong> & Cie<br />
(International) is Belgian law or the law of the countries<br />
in which its subsidiaries are established. The country of<br />
origin of the Company is Belgium.<br />
The Company’s financial year begins on the 1st January<br />
and closes on the 31 December of each year.<br />
The Company was founded on 31 December 1927 for<br />
an unlimited period.<br />
The Company registration number is 0402.960.467.<br />
2. Declaration of compliance<br />
and responsibility<br />
The consolidated financial statements were approved by<br />
the Board of Directors on 28 February 2011.<br />
We declare that to our knowledge:<br />
■ The consolidated financial statements have been<br />
prepared according to the International Financial<br />
Reporting Standards (IFRS) as approved by the<br />
European Union.<br />
■ The financial statements are an accurate view of the<br />
assets, the financial situation and results of the Group.<br />
■ The Management report is an accurate review of the<br />
ongoing business, the results and the situation of the<br />
Group and it includes a description of the main risks<br />
and uncertainties which the Group is facing.<br />
28 February 2011.<br />
Francis Lambilliotte, Managing Director<br />
Bernard Van Diest, CFO<br />
3. Principal accounting standards<br />
Principal accounting standards<br />
These consolidated financial statements have been<br />
prepared in accordance with International Financial<br />
Reporting Standards.<br />
They have been prepared on the basis of the historical<br />
cost convention except for some financial instruments<br />
measured at fair value in conformity with IAS 39.<br />
The financial statements are presented in thousands of<br />
Euros, rounded to the nearest thousand.<br />
Standards and Interpretations that became applicable<br />
in 2010<br />
This year, the Group has adopted new interpretations<br />
and amendments to the following Standards applicable<br />
for accounting years beginning on 1st January 2010:<br />
■ IFRS 3 Business Combinations (revised in 2008)<br />
(applicable to business combinations for which the<br />
acquisition date is on or after the beginning of the first<br />
annual period beginning on 1 January 2010).<br />
■ Improvements to IFRS (2008-2009) (normally<br />
applicable for the annual period beginning on 1<br />
January 2010).<br />
■ Amendment to IFRS 2 Share-based Payment<br />
(applicable for the annual period beginning on<br />
1 January 2010).<br />
■ Amendment to IAS 27 Consolidated and Separate<br />
Financial Statements (revised in 2008) (applicable<br />
for the annual period beginning on 1 January 2010).<br />
■ Amendments to IAS 39 Financial Instruments:<br />
Recognition and Measurement – Eligible Hedged<br />
Items (applicable for the annual period beginning<br />
on 1 January 2010).<br />
■ IFRIC 12 Service Concession Arrangements<br />
(applicable for the annual period beginning on<br />
1 January 2010).<br />
■ IFRIC 15 Agreements for the construction of real<br />
estate (applicable for the annual period beginning<br />
on 1 January 2010).<br />
■ IFRIC 16 Hedge of a net investment in a foreign<br />
operation (applicable for the annual period beginning<br />
on 1 January 2010).<br />
■ IFRIC 17 Distribution of Non-cash Assets to Owners<br />
(applicable for the annual period beginning on<br />
1 January 2010).<br />
■ IFRIC 18 Transfers of Assets from Customers<br />
(applicable for the annual period beginning on<br />
1 January 2010).
Part 3 - Financial Statements<br />
61<br />
Except for IFRS 3 revised (see notes 11 and 15), the<br />
adoption of those new standards and interpretations did<br />
not cause any material impact on the consolidated<br />
financial statements.<br />
Early application of standards and interpretations<br />
The Group has decided not to anticipate the application<br />
of standards and interpretations.<br />
At the approval date of the financial statements,<br />
the following interpretations were published but not yet<br />
applicable:<br />
■ IFRS 9 Financial Instruments (applicable for the<br />
annual period beginning on 1 January 2013).<br />
■ Improvements to IFRS (2009-2010) (normally<br />
applicable for the annual period beginning on 1<br />
January 2011).<br />
■ Amendment to IFRS 7 Financial Instruments:<br />
Disclosures – Derecognition (applicable for the<br />
annual period beginning on 1 January 2012).<br />
■ Amendment to IAS 12 Income Taxes – Deferred Tax:<br />
Recovery of Underlying Assets (applicable for the<br />
annual period beginning on 1 January 2012).<br />
■ Amendment to IAS 24 Related Party Disclosures<br />
(applicable for the annual period beginning on<br />
1 January 2011). This Standard supersedes IAS 24<br />
Related Party Disclosures as issued in 2003.<br />
■ Amendments to IAS 32 Financial Instruments:<br />
Presentation – Classification of Rights Issues<br />
(applicable for the annual period beginning on<br />
1 January 2011).<br />
■ IFRIC 19 Extinguishing Financial Liabilities with<br />
Equity Instruments (applicable for the annual period<br />
beginning on 1 January 2011).<br />
■ Amendment to IFRIC 14 IAS 19 – The Limit on a<br />
Defined Benefit Asset, Minimum Funding Requirements<br />
and their Interaction – Prepayments of a<br />
Minimum Funding Requirement (applicable for the<br />
annual period beginning on 1 January 2011).<br />
Adoption of these new standards and interpretations in<br />
subsequent years will not cause any material impact on<br />
the consolidated financial statements.<br />
The financial statements also include the information<br />
prescribed by the 4th and the 7th European directive.<br />
Con<strong>version</strong> of Foreign Currencies Operations<br />
Foreign currency transactions (i.e. in a currency other<br />
than the functional currency of the entity) are recorded<br />
at the spot exchange rate on the date of the transaction.<br />
At each closing date, monetary assets and liabilities<br />
denominated in foreign currencies are translated using<br />
the closing rate. Gains and losses arising from the<br />
settlement of foreign currency monetary items or on<br />
their re-evaluation at the closing date are recognized in<br />
the Income statement in the ‘Other operating income/<br />
(expenses)’; and in net finance costs for gains/losses<br />
related to the financial debt.<br />
The assets and liabilities of the Group activities whose<br />
working currency is not the Euro are converted into<br />
Euros at the financial year’s closing rate. Income and<br />
charges are converted at the average rate of the period<br />
except if the exchange rates have been subject to major<br />
fluctuations. Resulting exchange gains and losses are<br />
accounted for as a distinct component of the equity.<br />
At the time of the disposal of an activity whose working<br />
currency is not the Euro, the accumulated deferred<br />
exchange gains and losses recorded under the<br />
‘Translation reserve’ heading are reversed in the income<br />
statement.<br />
Goodwill and other adjustments of the fair value<br />
resulting from the acquisition of an activity whose<br />
working currency is not the Euro are treated as assets<br />
and liabilities of the activity and posted in accordance<br />
with the preceding paragraph.<br />
Consolidation Principles<br />
The consolidated financial statements include the<br />
financial statements of all subsidiaries; joint ventures<br />
consolidated according to the proportionate method<br />
and associated companies accounted for using the<br />
equity method. The consolidated financial statements<br />
are prepared using uniform accounting policies<br />
for transactions and events occurring in similar<br />
circumstances. All intra-group balances and<br />
transactions including income, dividends and expenses<br />
are eliminated in the consolidation.
62<br />
<strong>Hamon</strong> Annual Report 2010<br />
Subsidiaries<br />
Subsidiaries are companies that are directly or indirectly<br />
controlled. Control is deemed to exist as soon as the<br />
parent owns, directly or indirectly through subsidiaries,<br />
more than half of the voting power of an entity but as well<br />
as soon as it has the power to govern the entity’s financial<br />
and operating policies in order to obtain benefits from its<br />
activities. Consolidation of the subsidiary companies<br />
starts as of the moment when <strong>Hamon</strong> controls the entity<br />
until the date on which that control ceases.<br />
Joint Ventures<br />
Entities for which the Group contractually shares control<br />
with one or more co-contractor(s) qualify as joint ventures.<br />
Contractual agreements of this kind ensure that strategic<br />
financial and operating decisions require the unanimous<br />
consent of all the co-contractors. Proportional consolidation<br />
of the jointly controlled entities starts as of the moment joint<br />
control is established until the date on which it ceases.<br />
Associated Companies<br />
Associated companies are the entities over which<br />
<strong>Hamon</strong> exerts a significant influence by taking part in<br />
the entity’s decisions, without holding control or joint<br />
control. The significant influence is deemed to exist as<br />
soon as the parent owns, directly or indirectly through<br />
subsidiaries, more than twenty percent of the voting<br />
power of an entity. Consolidation of the associated<br />
companies is accounted for using the equity method<br />
until the date on which the significant influence ceases.<br />
Business combinations and changes<br />
in ownership interests<br />
Business combinations carried out prior to 1 January<br />
2010 have been accounted for in accordance with<br />
IFRS 3 prior to the revision effective 1 January 2010.<br />
In accordance with IFRS 3 revised, these business<br />
combinations have not been restated.<br />
The Group applies the purchase method as defined in<br />
IFRS 3 revised, which consists in recognizing the<br />
identifiable assets acquired and liabilities assumed at<br />
their fair values at the acquisition date, as well as any<br />
non-controlling interest in the acquiree.<br />
The main changes that have an impact on the Group’s<br />
consolidated financial statements are as follows:<br />
■ costs related to acquisitions of controlling interests<br />
are expensed;<br />
■ in the event of a business combination achieved in<br />
stages, previously held equity interest in the acquiree<br />
is re-measured at its acquisition-date fair value and<br />
the resulting gain or loss, if any, is recognized in profit<br />
or loss;<br />
■ for each business combination, any non-controlling<br />
interest in the acquiree is measured either at fair value<br />
or at the proportionate share of the acquiree’s<br />
identifiable net assets. Previously, only the latter<br />
option was authorized. The Group will determine on a<br />
case-by-case basis which option it will apply to<br />
recognize non-controlling interests;<br />
■ transactions (purchases or sales) of non-controlling<br />
interests that do not result in a change of control are<br />
recognized as transactions between shareholders.<br />
Consequently, any difference between the fair value<br />
of consideration paid or received and the carrying<br />
amount corresponding to the non-controlling interest<br />
is recognized directly in equity;<br />
Changes introduced by this new standard led the Group<br />
to create an “Impact of changes in consolidation scope”<br />
line in the income statement which is presented as a<br />
non-recurring item.<br />
Put options on non controlling interests<br />
Other non-current liabilities primarily include put<br />
options granted by the Group to non controlling<br />
interests. As no specific guidance is provided by IFRS,<br />
the Group has adopted the following accounting<br />
treatment for these commitments:<br />
■ when the put option is initially granted, the present<br />
value of the strike price is recognized as a non-current<br />
liability, with a corresponding increase of goodwill;<br />
■ at each balance sheet date, the amount of the<br />
non-current liability is revised and any changes in the<br />
amount are recorded with a corresponding adjustment<br />
to goodwill;<br />
■ payments of dividends to non controlling interests<br />
result in an increase in goodwill;<br />
■ in the consolidated income statement, non-controlling<br />
interests are allocated their share in income. In the<br />
consolidated balance sheet, the share in income<br />
allocated to non controlling interests increases the<br />
other non-current liability.<br />
In the case of a fixed-price put, the liability corresponds<br />
to the present value of the strike price.<br />
In the case of a fair value or variable-price put, the<br />
liability is measured based on estimates of the fair value<br />
at the consolidated balance sheet date or contractual<br />
conditions applicable to the exercise price based on the<br />
latest available information.
Part 3 - Financial Statements<br />
63<br />
Balance Sheet Elements<br />
Intangible Assets<br />
Intangible assets are recognized if it is probable that the<br />
future economic benefits attributable to the asset will<br />
flow to the Group and if their costs can be measured<br />
reliably. After initial recognition, an intangible asset shall<br />
be carried at its cost less any accumulated amortization<br />
and impairments.<br />
Patents, Trademarks and Similar Rights<br />
Patents and trademarks are initially measured at cost<br />
and are amortized on a straight-line basis over the<br />
shorter of their useful lives or their contractual period.<br />
Development Costs<br />
In-house development costs are capitalized as intangible<br />
assets only if all following conditions are met:<br />
■ An identifiable asset has been created (such as<br />
software and new processes);<br />
■ It is probable that the asset will generate future<br />
economic benefits; and<br />
■ The asset’s development costs can be measured<br />
reliably.<br />
The development phase starts when the new products,<br />
processes or software programs (‘Identifiable Asset’)<br />
are defined. The objective consists of developing an<br />
Identifiable Asset, which fulfils the customers’ technical<br />
and qualitative requirements or enables the customers’<br />
requirements to be met at a lower cost for the Company.<br />
The development activities are based on the results<br />
obtained from industrial research or from existing<br />
knowhow and are generating profit. This condition is<br />
reviewed each year in order to determine the project’s<br />
profitability potential. Development costs are amortized<br />
over a maximum period of 5 (five) years. When the<br />
above recognition criteria are not met, the development<br />
expenditure is charged to expenses.<br />
Other internally generated intangible assets<br />
Except for development costs meeting the above<br />
conditions, costs linked to any other internally generated<br />
intangible element such as brands, customer lists,<br />
goodwill, research are charged to expenses and are not<br />
capitalized.<br />
a. Business combinations carried out prior<br />
to 1 January 2010<br />
Goodwill recognized during a business combination is<br />
accounted for as an asset, being the excess of the cost<br />
of a business combination over the Group’s interest in<br />
the fair value of the acquiree’s identifiable assets,<br />
liabilities and contingent liabilities recognized.<br />
b. Events/transactions occurring after 1 January 2010<br />
concerning business combinations carried out prior<br />
to 1 January 2010<br />
The initial accounting for business combinations is not<br />
restated.<br />
Any adjustments to the consideration transferred in<br />
these business combinations changes their initial<br />
accounting and leads to a matching adjustment to<br />
goodwill.<br />
c. Business combinations carried out<br />
after 1 January 2010<br />
Goodwill is measured as the excess of the aggregate of:<br />
(i) the consideration transferred;<br />
(ii) the amount of any non-controlling interests in the<br />
acquiree; and<br />
(iii) in a business combination achieved in stages, the<br />
acquisition-date fair value of the previously held equity<br />
interest in the acquiree;<br />
over the net of the acquisition-date fair values of the<br />
identifiable assets acquired and the liabilities assumed.<br />
Goodwill recognized on the acquisition date is not<br />
subsequently adjusted.<br />
Measurement of goodwill<br />
Goodwill is not depreciated but it is tested for<br />
impairment at least once a year. Any impairment loss<br />
is charged to the income statement. An impairment<br />
loss accounted for on goodwill cannot be reversed<br />
at a later date.<br />
At the time of the sale of a subsidiary or a jointly<br />
controlled entity, the relevant goodwill is included in<br />
the determination of the result of the sale. Goodwill on<br />
associated companies is presented under ‘Investments<br />
In Associated Companies’.<br />
Goodwill<br />
Recognition of goodwill<br />
Application of IFRS 3 revised as of 1 January 2010,<br />
leads the Group to separately identify business combinations<br />
carried out before and after this date.
64<br />
<strong>Hamon</strong> Annual Report 2010<br />
Tangible Assets<br />
An item of property, plant and equipment is recognized<br />
as a tangible asset if it is probable that the future<br />
economic benefits attributable to the asset will flow to<br />
the Group and if their costs can be measured reliably.<br />
After the initial accounting, all tangible assets are<br />
stated at cost less the accumulated depreciation and<br />
impairment losses. The cost includes all the costs<br />
directly attributable to bringing the asset to the location<br />
and condition necessary for it to be capable of operating<br />
in the intended manner.<br />
Repair and maintenance costs and other subsequent<br />
expenditures linked to an asset are charged as<br />
expenses in the income statement of the financial year<br />
during which they are incurred.<br />
The depreciable amount of an asset is allocated<br />
systematically over its useful life using the straight-line<br />
method.<br />
The depreciation of an asset begins when it is available<br />
for use. The estimated useful lives of the most significant<br />
elements of tangible assets are as follows:<br />
Description<br />
Land<br />
Administrative buildings<br />
Industrial buildings<br />
Machines<br />
EDP equipment<br />
Other equipment<br />
Leasehold Improvements<br />
Tools<br />
Furniture<br />
Vehicles<br />
Useful life<br />
No depreciation<br />
33 years<br />
33 years<br />
10 years<br />
4 years<br />
10 years<br />
10 years<br />
4 years<br />
10 years<br />
4 years<br />
Depreciation charges are posted to operating expenses<br />
by reference to the function of the underlying assets<br />
(cost of sales, selling & marketing expenses, general and<br />
administration costs, research and development costs).<br />
Gains or losses arising from the sale or disposal of<br />
tangible assets are determined as the difference<br />
between the sale proceeds and the carrying amount of<br />
the asset and are charged to the income statement<br />
under ‘Other Operating Income / (Expenses)’.<br />
The Group has elected to use the cost model for the<br />
measurement of property, plant and equipment. Therefore<br />
items of property plant and equipment may not be<br />
carried at a re-valued amount after their initial recognition.<br />
Impairment of Tangible and Intangible Assets<br />
Except for intangible assets in progress that are tested<br />
for impairment annually, tangible and intangible assets<br />
are subject to an impairment test only when there is an<br />
indication that their carrying amount exceeds their<br />
recoverable amount.<br />
If an asset does not generate cash flows independently<br />
of those of other assets, the Group makes an estimate<br />
of the recoverable value of the cash-generating unit to<br />
which the asset belongs. The recoverable value is the<br />
highest value between the fair value less costs to sell<br />
and the value in use. If the recoverable value of an asset<br />
(cash flow generating unit) is lower than its carrying<br />
amount, an impairment loss is immediately recognized<br />
as an expense in the income statement.<br />
When an impairment is reversed at a later date, the<br />
carrying amount of the asset (cash flow generating unit)<br />
is increased to the revised estimate of its recoverable<br />
value, without however being higher than the carrying<br />
amount which would have been determined if no<br />
impairment had been recognized for this asset (cash<br />
flow generating unit) during previous periods.<br />
Lease Agreements<br />
Capital Leases<br />
A lease is classified as a finance lease if it substantially<br />
transfers the entire risks and rewards incidental to<br />
ownership to the lessee. The other lease agreements<br />
are classified as operating leases.<br />
At the commencement of the lease term, the Group<br />
recognizes finance leases as assets and liabilities in its<br />
balance sheet at amounts equal to the lower of fair<br />
value of the leased property or the present value of<br />
the minimum lease payments, each determined at the<br />
inception of the lease. The corresponding liability is<br />
posted in the obligations under finance leases.<br />
The minimum lease payments are apportioned between<br />
the finance charge and the reduction of the outstanding<br />
liability. The finance charge is allocated to each period<br />
during the lease term so as to obtain a constant<br />
periodic interest rate on the remaining balance of<br />
the liability. Leased assets are depreciated over their<br />
estimated useful live consistently with the method<br />
applicable to similar depreciable assets owned by<br />
the Group.<br />
Operating Leases<br />
Lease agreements that do not substantially transfer the<br />
entire risks and rewards incidental to ownership to the<br />
lessee are classified as operating leases. The lease<br />
payments are recognized as an expense on a straight-line<br />
basis over the period of the rental agreement.
Part 3 - Financial Statements<br />
65<br />
Financial Assets and Liabilities<br />
Financial assets or liabilities are recognized on the<br />
balance sheet at the date of the transaction, which<br />
corresponds to the date on which the entity contractually<br />
commits to buy or sell an asset.<br />
When a financial asset or financial liability is recognized<br />
initially, it is measured at its fair value plus (in case of<br />
financial asset) or minus (in case of financial liability)<br />
transaction costs except for financial assets at fair value<br />
through income statement.<br />
Fair value is defined as the amount for which an asset<br />
could be exchanged or a liability settled between<br />
knowledgeable willing parties in an arm’s length<br />
transaction. Fair value of a financial liability will be for<br />
instance, the cash received from the lenders when the<br />
liability is issued.<br />
There are four categories of financial assets:<br />
■ Financial assets at fair value through profit or loss<br />
(designated by the entity or classified as held for<br />
trading);<br />
■ Held-to-maturity investments;<br />
■ Loans and receivables;<br />
■ Available-for-sale financial assets.<br />
There are two categories of financial liabilities:<br />
■ Financial liabilities at fair value through profit or loss;<br />
■ Other financial liabilities measured at amortized cost.<br />
Subsequently,<br />
the fair value changes in financial assets and liabilities<br />
at fair value through profit or loss are recognized<br />
through the income statement.<br />
the fair value changes in available-for-sale-assets are<br />
recognized directly in the equity until the asset is sold<br />
or is identified as impaired. Then the cumulative gain/<br />
loss that had been recognized in equity shall be<br />
removed and recognized in income statement.<br />
investments in equity instruments that are not quoted<br />
in an active market and whose fair value cannot be<br />
reliably measured by an alternative pricing method are<br />
evaluated at cost.<br />
loans and receivables, held-to-maturity Investments<br />
and other financial liabilities are measured at amortized<br />
cost using the effective interest rate method, except<br />
for fixed term/time deposits, which are valued at cost.<br />
The effective interest rate is the rate that exactly<br />
discounts estimated future net cash settlements or<br />
receipts through the expected life of the financial asset<br />
or liability to its net carrying amount.<br />
Trade and Other Receivables (Payables)<br />
Receivables and payables are recognized using the<br />
amortized cost method i.e. the discounted value of the<br />
receivable. Appropriate impairment losses are recognized<br />
on receivables in case of expected default of payments.<br />
Cash and Cash Equivalents<br />
Cash and cash equivalents comprise cash on hand and<br />
demand deposits together with short-term, highly liquid<br />
investments, that are readily convertible into a known<br />
amount of cash, that have a maturity of three months<br />
or less, and that are subject to an insignificant risk of<br />
change in value. These elements are taken into the<br />
Balance Sheet at their nominal value. Bank overdrafts<br />
are included in the current financial liabilities.<br />
Equity Instruments<br />
Any contract that evidences a residual interest in the<br />
assets of an entity after deducting all of its liabilities is<br />
an equity instrument. Equity instruments issued by the<br />
Company are measured at their fair value net of<br />
issuance costs.<br />
Loans & borrowings<br />
Loans and borrowings are initially recognized at fair<br />
value, plus or minus transaction costs. They are<br />
subsequently measured at amortized cost using the<br />
effective interest method. Any subsequent change in<br />
value between the fair value and the settlement value<br />
(including the redemption premium to be received or<br />
paid) is recognized in the income statement over the<br />
period of the borrowing (effective interest rate method).<br />
The borrowing issuance costs related to mixed facilities<br />
including debt and bank guarantee lines agreement<br />
are prorated between the different lines and presented<br />
in deduction of the financial liabilities on the balance<br />
sheet.<br />
Amounts borrowed as part of the “Credit Revolving<br />
Facility” are accounted for under ‘Non-current Financial<br />
Liabilities’ when the maturity of those borrowing are<br />
above one year and the Group has the possibility to<br />
roll-over them at its discretion.<br />
Derivative Financial Instruments<br />
The Group enters into derivative financial instruments to<br />
manage its exposure to interest rate risks arising from<br />
financing activities and foreign exchange rate risks<br />
arising from operational activities (cash flow hedges).<br />
The Group’s policy is not to enter into speculative<br />
transactions nor issue or hold financial instruments for<br />
negotiation purposes.
66<br />
<strong>Hamon</strong> Annual Report 2010<br />
Derivative financial instruments are initially recognized at<br />
their fair value and are subsequently revaluated to their<br />
fair value at each reporting date.<br />
a)Derivatives qualifying for cash flow hedge<br />
The effective portion of changes in the fair value<br />
of derivatives qualifying as cash flow hedges are<br />
immediately deferred in equity. The gain or loss<br />
relating to the ineffective portion is recognized<br />
immediately in the income statement.<br />
When the forecast transaction that is hedged results<br />
in the recognition of a non-financial asset or liability,<br />
then the gains or losses previously deferred in the<br />
equity are transferred from equity and included in<br />
the initial measurement of the cost of the asset or<br />
liability.<br />
When the forecast transaction that is hedged results<br />
in the recognition of a financial asset or liability, then<br />
the gains or losses previously deferred in the equity<br />
are recycled in the income statement in the periods<br />
when the hedged item is recognized in the income<br />
statement. However if it is likely that a portion or the<br />
whole cumulative loss posted in equity will not be<br />
offset in the future periods, the (portion of the) loss<br />
unlikely to be offset is recognized in the income<br />
statement.<br />
When the forecast transaction that is hedged does<br />
not result in the recognition of an asset or liability,<br />
then the gains or losses previously deferred in the<br />
equity are recycled in the income statement in the<br />
periods when the hedged item is recognized in the<br />
income statement.<br />
b)Derivatives which do not qualify for hedging<br />
The changes of fair value of financial instruments that<br />
do not qualify for hedge accounting are immediately<br />
posted in the income statement.<br />
Stock options<br />
Share options are measured at their fair value at the<br />
date of grant. This fair value is assessed using the<br />
Black - Scholes option pricing model and is expensed<br />
on a straight-line basis over the vesting period of these<br />
rights, taking into account an estimate of the number of<br />
options that will eventually vest.<br />
Inventory<br />
Inventory is carried at the balance sheet at the lower<br />
of cost and net realizable value. The cost of inventory<br />
includes the cost of purchase of direct materials, the<br />
cost of con<strong>version</strong> (including manufacturing costs) and<br />
other costs incurred in bringing the inventory to their<br />
present location and condition. The cost of interchangeable<br />
inventory items is determined using the weighted<br />
average cost method. The net realizable value is the<br />
estimated selling price less the estimated costs of<br />
completion and the estimated distribution, selling and<br />
marketing costs.<br />
Pensions and other Employee Benefits<br />
In accordance with the local legislation and practices,<br />
the Group’s subsidiaries subscribe to post-employment<br />
defined contribution or defined benefit plans.<br />
Defined Contribution Plans<br />
Contributions that are payable for defined contribution<br />
plans in exchange for services rendered by employees<br />
during the period are charged to the income statement<br />
as incurred.<br />
Defined Benefit Plans<br />
For defined benefit plans, the amount recognized in the<br />
balance sheet is the present value of the defined benefit<br />
obligation, as adjusted for unrecognized actuarial gains<br />
and losses and unrecognized past service cost, and<br />
reduced by the fair value of plan assets at the balance<br />
sheet date. If the calculation of the balance sheet amount<br />
as set out above results in an asset, the amount recognized<br />
should be limited to the net total of unrecognized<br />
actuarial losses and past service cost, plus the present<br />
value of available refunds and reductions in future<br />
contributions to the plan.<br />
In the income statement, the current service cost, the past<br />
service cost and the amortization of actuarial gains/<br />
losses are posted as cost of sales, sale and marketing<br />
costs or general and administrative costs, research and<br />
development costs, while the interest costs and the<br />
expected return on the plan assets are charged to the<br />
‘other financial charges’.<br />
The present value of the defined benefit obligation is<br />
determined using the Projected Unit Credit Method.<br />
The discount rate is determined annually by reference to<br />
market yields at the balance sheet date on high quality<br />
corporate bonds with a term similar to the weighted<br />
average payment term of the obligation.<br />
Actuarial gains/losses resulting from the effects of the<br />
differences between the previous actuarial assumptions<br />
and the actuals and from the effects of the changes in<br />
actuarial assumptions are calculated separately for each<br />
‘defined benefit plan’. When the accumulated actuarial<br />
gains/losses exceed 10% of the greater of the defined<br />
benefit obligation or the fair value of the plan assets
Part 3 - Financial Statements<br />
67<br />
(corridor), the portion in excess is recognized in the<br />
income statement through its amortization over the<br />
average remaining working lives of the employees.<br />
Past service costs due to changes in benefits under the<br />
plan are amortized on a straight-line basis over the<br />
average period until the amended benefits become vested.<br />
Early Retirement Plan<br />
Early retirement plans are treated as post-employment<br />
defined benefit plans.<br />
Provisions for Liabilities and Charges<br />
Provisions are recognized if and only if the Group has a<br />
present obligation (legal or constructive) arising from a<br />
past event, which will probably result in an outgoing<br />
payment for which the amount can be reliably estimated.<br />
Provisions for guarantee are recognized upon the sale<br />
of the product, on basis of the best estimate of the<br />
expenditure necessary for the extinction of the Group’s<br />
obligation. Provisions for restructuring are recognized<br />
only after the Group has adopted a detailed formal plan<br />
that has been publicly announced to the parties involved<br />
before the closing date.<br />
Provisions are measured at their present value where<br />
the effect of the time value of money is material.<br />
Income Statement Elements<br />
Income<br />
Income is recognized when it is probable that the future<br />
economic benefits attributable to a transaction will flow<br />
to the Group and if its amount can be measured reliably.<br />
Revenues are measured at the fair value of the counterpart<br />
received or to be received and represent amounts<br />
to be received following the supply of goods or the<br />
rendering of services in the course of the ordinary<br />
activities of the Group.<br />
■ Sales revenue are recognized once the delivery has<br />
been made and when the transfer of the risks and<br />
benefits has been completed.<br />
■ Construction revenue are recognized in accordance<br />
with the Group’s accounting methods relating to<br />
construction contracts (see below).<br />
■ Interest revenue are computed based on the time<br />
passed, the outstanding liability and the effective<br />
interest rate, which is the rate that exactly discounts<br />
future cash flows through the expected life of the<br />
financial asset to its net carrying amount.<br />
■ Dividends are recognized when the shareholder’s right<br />
to receive the payment is established.<br />
Construction Contracts<br />
When the outcome of a construction contract can be<br />
estimated reliably, the contract’s revenues and costs are<br />
recognized in proportion to the stage of completion of<br />
the contract activity at the closing date. The contract<br />
stage of completion is determined by dividing the actual<br />
costs incurred at closing date by the total expected<br />
costs to complete the contract.<br />
When the outcome of a construction contract cannot be<br />
estimated reliably, the revenue is recognized only to the<br />
extent that contract costs incurred are expected to be<br />
recoverable. The costs of the contracts are recognized<br />
in the income statement during the period in which they<br />
are incurred.<br />
An expected loss on a construction contract is<br />
immediately recognized as an expense as soon as such<br />
loss is probable.<br />
Contract revenues include the initial agreed amount of<br />
the contract, the agreed change orders as well as<br />
forecasted incentive payments and forecasted claims<br />
only when it is probable that the incentives/claims are<br />
accepted and when their amounts can be measured<br />
reliably.<br />
Contract costs include the direct costs attributable to<br />
the contracts and the costs relating to the general<br />
contracting activity to the extent that they can reasonably<br />
be allocated to the contract (indirect costs). Tender<br />
costs are included in contract costs only if they can be<br />
identified separately and measured reliably, and if it is<br />
probable that the contract will be obtained.<br />
The amounts included under the ‘Amounts Due<br />
From Customers For Contract Work’ correspond to<br />
the costs incurred plus the margin (less the losses)<br />
recognized on contracts in excess of the advances<br />
billed to the customers for contracts for which this<br />
difference is positive. While the amounts included<br />
under the ‘Amounts Due To Customers For Contract<br />
Work’ correspond to the advances billed to the<br />
customers in excess of the costs incurred plus the<br />
margin (less the losses) recognized on contracts<br />
for other contracts.<br />
Operating profit before non-recurring items<br />
(REBIT)<br />
The operating profit before non-recurring items (new<br />
indicator in the income statement) is a management<br />
result allowing a better understanding of the recurring<br />
performance of the Group by excluding unusual or<br />
infrequent items.
68<br />
<strong>Hamon</strong> Annual Report 2010<br />
For the Group, those items are:<br />
■ restructuring costs;<br />
■ net impairment losses on non-current assets ;<br />
■ changes in consolidation scope and;<br />
■ other non-recurring items such as gains/losses on<br />
the sale of available-for-sale financial assets.<br />
Government Grants<br />
Government grants related to staff costs are recognized<br />
as income over the periods necessary to match them<br />
with the related costs which they are intended to<br />
compensate on a systematic basis.<br />
Government grants related to tangible assets are<br />
presented in deduction of the property, plant and<br />
equipment’s carrying amounts. These grants are<br />
recognized as income over the life of the depreciable<br />
assets.<br />
Repayable government grant are transferred to financial<br />
liabilities.<br />
Income Taxes<br />
Income taxes include both current and deferred taxes.<br />
They are recognized in the income statement except if<br />
they relate to elements recognized directly in the equity,<br />
in which case they are posted to equity.<br />
The current tax is the amount of income tax payable/<br />
recoverable in respect of the taxable profit/loss for<br />
a period.<br />
Current income taxes for current and prior periods are<br />
calculated based on the tax rates that have been enacted<br />
or substantively enacted by the balance sheet date.<br />
Reforms to French business taxes were enacted on<br />
31 December 2009 and apply as from 1 January 2010.<br />
The new tax, the CET (“Contribution Economique<br />
Territoriale”), has two components: the CFE (“Cotisation<br />
Fonciere des Entreprises”) and the CVAE (« Cotisation<br />
sur la Valeur Ajoutée des Entreprises »). The second<br />
component is determined by applying a rate to the<br />
amount of value added generated by the business<br />
during the year.<br />
Given that the CVAE component is calculated as the<br />
amount by which certain revenues exceed certain<br />
expenses, the Group regards the CVAE component as<br />
meeting the definition of income taxes specified in<br />
IAS 12§2 - Taxes which are based on taxable profits - and<br />
has classified all amounts accounted for in the French<br />
subsidiaries of the Group as from 2010 under the line<br />
‘Income taxes’ in the income statement. This decision is<br />
compliant with French practices.<br />
Deferred taxes originate from temporary differences i.e.<br />
differences between the carrying amounts of assets<br />
and liabilities in the balance sheet and their tax base.<br />
Deferred taxes are measured at the tax rates that are<br />
expected to apply to the period when the asset is<br />
realized or the liability is settled based on tax rates that<br />
have been enacted or substantively enacted by the<br />
balance sheet date.<br />
Deferred tax liabilities related to financial assets in<br />
subsidiaries are not recognized since the Group does<br />
not expect that the timing difference will be reversed in<br />
the foreseeable future.<br />
Deferred tax assets are recognized for the deductible<br />
temporary differences as well for the carry forward of<br />
unused tax losses and credits to the extent that it is<br />
probable that future taxable profits will be available<br />
against which the deductible temporary differences and<br />
the unused tax losses and credits could be utilized.<br />
The carrying value of the deferred tax assets is reviewed<br />
at each closing date. They are impaired when it<br />
becomes unlikely that the deferred tax assets will be<br />
utilized against future taxable profits.<br />
Discontinued Business<br />
A discontinued operation is a portion of an entity that<br />
either is being or has been sold or disposed by the<br />
Group.<br />
This portion of the entity represents a significant<br />
separate major line of business or geographical area of<br />
operations and can be distinguished on the operational<br />
field and for the communication of financial information.<br />
Besides general information detailing the discontinued<br />
operations, financial statements disclose the amounts<br />
of assets and liabilities, and the profit or loss and the<br />
tax charge as well as the net cash flows attributable to<br />
the operating, investing, and financing activities of<br />
discontinued operations.<br />
Assets classified in discontinued operations or held for<br />
sale are measured at the lower of their carrying amount<br />
and their fair value less costs to sell. They are not<br />
depreciated anymore but they are considered for<br />
impairment upon any indication of a decrease of their<br />
net realizable value.<br />
Borrowing costs<br />
Borrowing costs directly attributable to the acquisition,<br />
construction or production of qualifying assets, which<br />
are assets that necessarily take a substantial period of<br />
time to get ready for their intended use or sale, are
Part 3 - Financial Statements<br />
69<br />
added to the cost of those assets, until such time as<br />
the assets are substantially ready for their intended use<br />
or sale.<br />
All other borrowing costs are recognized in profit or loss<br />
in the period in which they are incurred.<br />
4. Key assumptions and estimates<br />
Within the framework of preparation of its consolidated<br />
financial statements, the Group must, on certain<br />
occasions, formulate assumptions and/or carry out<br />
estimates affecting the balance sheet and/or the<br />
income statement.<br />
Management bases its estimates on its previous<br />
experience and formulates certain assumptions that<br />
seem reasonable taking into account the circumstances.<br />
The actual results can differ from these estimates.<br />
Estimates are used in the assessment of impairment<br />
losses/write-offs on current and non-current assets, in<br />
the estimate of the result and percentage of completion<br />
of construction contracts in progress, in the assessment<br />
of the residual lifetime of tangible and intangible fixed<br />
assets except for the goodwill, in the provisions for<br />
pensions, restructuring and potential litigations, in the<br />
estimate of stock option plans as well as in the assessment<br />
of the recoverability of the deferred tax assets.<br />
Accounting estimates and their key assumptions are<br />
reexamined regularly and the effects of their revisions<br />
are reflected in the financial statements in the corresponding<br />
period.<br />
When such assumptions and estimates have been<br />
made, they are explained in the notes relating to the<br />
elements to which they refer.
70<br />
<strong>Hamon</strong> Annual Report 2010<br />
5. Consolidated entities<br />
As of 31 December 2010, the Group has the following subsidiaries:<br />
Subsidiary Country % Group interest % Group interest<br />
2010 2009<br />
1. Subsidiaries consolidated by full integration method<br />
<strong>Hamon</strong> & Cie (International) SA Belgium Parent company Parent company<br />
<strong>Hamon</strong> Thermal Europe SA Belgium 100% 100%<br />
<strong>Hamon</strong> Research-Cottrell SA Belgium 99,98% 99,98%<br />
ACS Anti Corrosion Structure SA Belgium 100% 80,11%<br />
Compagnie Financière <strong>Hamon</strong> S.A. France 99,10% 99,10%<br />
<strong>Hamon</strong> Thermal Europe (France) S.A. France 99,10% 99,10%<br />
<strong>Hamon</strong> D’Hondt S.A. France 99,10% 99,10%<br />
<strong>Hamon</strong> Environmental S.A.R.L. France 99,98% 99,98%<br />
Hacom Energiesparsysteme GmbH Germany 100% 100%<br />
<strong>Hamon</strong> Thermal Germany GmbH Germany 100% 100%<br />
<strong>Hamon</strong> Environmental GmbH Germany 100% 100%<br />
<strong>Hamon</strong> Enviroserv GmbH Germany 100% -<br />
<strong>Hamon</strong> Polska Sp.Zo.O Poland 100% 100%<br />
<strong>Hamon</strong> UK Ltd. Great Britain 100% 100%<br />
<strong>Hamon</strong> Dormant Co. Ltd Great Britain 100% 100%<br />
<strong>Hamon</strong> (Nederland) B.V. Netherlands 100% 100%<br />
Heat Transfer Ré Services S.A. Luxemburg 100% 100%<br />
<strong>Hamon</strong> Corporation United States 100% 100%<br />
<strong>Hamon</strong> Custodis Inc. United States 100% 100%<br />
<strong>Hamon</strong> Research-Cottrell Inc. United States 100% 100%<br />
Thermal Transfer Corporation United States 100% 100%<br />
Research-Cottrell Cooling Inc. United States 100% 100%<br />
Research-Cottrell Dry Cooling Inc. United States 100% 100%<br />
<strong>Hamon</strong> Holdings Corporation United States 100% -<br />
<strong>Hamon</strong> Custodis Cottrell (Canada) Inc. Canada 100% 100%<br />
<strong>Hamon</strong> Australia (Pty) Ltd. Australia 100% 100%<br />
<strong>Hamon</strong> (South Africa) (Pty) Ltd. South Africa 70% 70%<br />
<strong>Hamon</strong> J&C Engineering (Pty) Ltd South Africa 42,0% -<br />
<strong>Hamon</strong> Korea Co Ltd. South Korea 89,73% 89,73%<br />
<strong>Hamon</strong> Korea Youngnam Ltd. South Korea 45,76% 45,76%<br />
<strong>Hamon</strong> D’Hondt BHI Co. Ltd South Korea 49,6% -<br />
<strong>Hamon</strong> - B.Grimm Ltd. Thailand 49,20% 49,20%<br />
<strong>Hamon</strong> Shriram Cottrell PVT Ltd India 50% -<br />
<strong>Hamon</strong> India PVT Ltd. India 100% 100%<br />
P.T. <strong>Hamon</strong> Indonesia Indonesia 89,73% 89,73%<br />
<strong>Hamon</strong> Malaysia SDN. BHD. Malaysia 100% 100%<br />
<strong>Hamon</strong> Asia-Pacific Ltd Hong Kong 100% -<br />
<strong>Hamon</strong> DGE (HK) Ltd. Hong Kong 60% 60%<br />
Research-Cottrell Cooling (Tianjin) Co. Ltd China 100% -<br />
<strong>Hamon</strong> DGE (Shanghai) Co., Ltd China 60% 60%<br />
TS Filtration Environmental Protection Products (Shanghai) Co. Ltd China 60% 60%<br />
<strong>Hamon</strong> Thermal & Environmental Technology (Jiaxing) Co. Ltd China 65,9% 65,9%<br />
<strong>Hamon</strong> Trading (Jiaxing) Co.,Ltd. China 62,8% 62,8%<br />
<strong>Hamon</strong> Research-Cottrell do Brazil Brazil 100% 100%<br />
<strong>Hamon</strong> Do Brazil Ltda. Brazil 100% 100%
Part 3 - Financial Statements<br />
71<br />
Subsidiary Country % Group interest % Group interest<br />
2010 2009<br />
2. Subsidiaries consolidated by proportional integration<br />
<strong>Hamon</strong> Shriram Cottrell PVT Ltd India - 50%<br />
<strong>Hamon</strong> D’Hondt Middle East Company Ltd Saudi Arabia 39,64% 39,64%<br />
<strong>Hamon</strong> Cooling Towers Company FZCo United Arab Emirates 50% 50%<br />
6. EXCHANGE RATES USED BY THE GROUP<br />
Exchange rates for 1 EUR Period-end rate Average rate<br />
2010 2009 2008 2010 2009 2008<br />
UAE Dirham AED 4,9075 5,2849 5,1057 4,8692 5,1230 5,4172<br />
Australian Dollar AUD 1,3136 1,6008 2,0274 1,4514 1,7834 1,7342<br />
Brazilian Real BRL 2,2177 2,5113 3,2436 2,3336 2,7876 2,6366<br />
Canadian Dollar CAD 1,3322 1,5128 1,6998 1,3723 1,5897 1,5581<br />
Chinese Yuan CNY 8,8220 9,8350 9,4956 8,9757 9,5229 10,2787<br />
Pound Sterling GBP 0,8608 0,8881 0,9525 0,8576 0,8927 0,7934<br />
Hong-Kong Dollar HKD 10,3856 11,1709 10,7858 10,2962 10,8073 11,5200<br />
Indonesian Rupiah (100) IDR 120,0214 136,2613 152,3912 120,5061 145,1034 141,7556<br />
Indian Rupee INR 59,7580 67,0400 67,7232 60,5824 67,1449 63,7679<br />
South Korean Won (100) KRW 14,9906 16,6697 18,3913 15,3614 17,7722 16,0640<br />
Malaysian Ringgit MYR 4,0950 4,9326 4,8048 4,2739 4,9050 4,9106<br />
Polish Zloty PLZ 3,9750 4,1045 4,1535 4,0047 4,3490 3,5018<br />
Saudi Riyal SAR 5,0108 5,3897 5,2170 4,9716 5,2310 5,5326<br />
Thai Baht THB 40,1700 47,9860 48,2850 42,1378 47,8563 48,6770<br />
U.S. Dollar USD 1,3362 1,4406 1,3917 1,3254 1,3943 1,4604<br />
South African Rand ZAR 8,8625 10,6660 13,0667 9,7243 11,6207 11,9545<br />
7. Information by segment<br />
The Group is organized in five Business Units: Cooling<br />
Systems, Process Heat Exchangers, Air Pollution<br />
Control EMEA/Brazil, Air Pollution Control NAFTA and<br />
Chimneys. Additional Business Unit information is<br />
presented in the first part of this annual report.<br />
The results of a segment and its assets and liabilities<br />
include all the elements that are directly attributable to<br />
it as well as the elements of the income, expenses,<br />
assets and liabilities that can reasonably be allocated to<br />
a segment. Segment profit represents the profit earned<br />
by each segment after allocation of central administration<br />
costs and management salaries, share of profits of<br />
associates and investment revenues, to the extent that<br />
they can be allocated to a segment, but before finance<br />
costs. This is the measure regularly presented to the<br />
chief operating decision maker for the purposes of<br />
resources allocation and assessment of segment<br />
performances.<br />
The accounting policies of the reportable segments are<br />
the same as the Group’s accounting policies described<br />
in note 3.
72<br />
<strong>Hamon</strong> Annual Report 2010<br />
in EUR ‘000’ Cooling Process All Pollution Air Pollution Chimneys non Elimination Total<br />
systems Heat Control Control allocated<br />
exchangers EMEA/Brazil NAFTA<br />
For the period ended 31 December 2008<br />
Revenue third party 109 312 48 758 37 493 76 709 91 461 2 946 - 366 679<br />
Inter-segment revenue 47 114 150 50 - 930 (1 291) -<br />
Total revenue 109 359 48 872 37 643 76 759 91 461 3 876 (1 291) 366 679<br />
Operating profit before<br />
non-recurring items (REBIT) 9 601 4 731 3 096 17 135 9 144 (740) - 42 967<br />
Non-recurring items 51 (127) - - - 828 - 752<br />
Operating profit (EBIT) 9 652 4 604 3 096 17 135 9 144 88 - 43 719<br />
Interest income 1 255 - 1 255<br />
Interest charges (9 904) - (9 904)<br />
Result before tax 35 070<br />
Income taxes (14 411) (14 411)<br />
Net result from<br />
continued operations 20 659<br />
in EUR ‘000’ Cooling Process All Pollution Air Pollution Chimneys non Elimination Total<br />
systems Heat Control Control allocated<br />
exchangers EMEA/Brazil NAFTA<br />
For the period ended 31 December 2009<br />
Revenue third party 143 434 53 306 39 024 67 873 72 771 3 369 - 379 777<br />
Inter-segment revenue 391 1 121 104 175 16 734 (2 541) -<br />
Total revenue 143 825 54 427 39 128 68 048 72 787 4 103 (2 541) 379 777<br />
Operating profit before<br />
non-recurring items (REBIT) 12 514 5 322 (29) 11 731 12 697 (3 044) 39 191<br />
Non-recurring items (37) (23) - - - (346) (406)<br />
Operating profit (EBIT) 12 477 5 299 (29) 11 731 12 697 (3 390) 38 785<br />
Interest income 323 323<br />
Interest charges (7 521) (7 521)<br />
Result before tax 31 587<br />
Income taxes (13 332) (13 332)<br />
Net result from<br />
continued operations 18 255
Part 3 - Financial Statements<br />
73<br />
in EUR ‘000’ Cooling Process All Pollution Air Pollution Chimneys non Elimination Total<br />
systems Heat Control Control allocated<br />
exchangers EMEA/Brazil NAFTA<br />
For the period ended 31 December 2010<br />
Revenue third party 128 096 41 919 71 917 45 135 51 576 6 890 - 345 533<br />
Inter-segment revenue 446 - - 1 311 6 607 (2 370) -<br />
Total revenue 128 542 41 919 71 917 46 446 51 582 7 497 (2 370) 345 533<br />
Operating profit before<br />
non-recurring items (REBIT) 7 370 3 064 865 8 021 8 485 (4 262) 23 543<br />
Non-recurring items 1 873 (188) - - - 889 2 574<br />
Operating profit (EBIT) 9 243 2 876 865 8 021 8 485 (3 373) 26 117<br />
Interest income 332 332<br />
Interest charges (5 561) (5 561)<br />
Result before tax 20 888<br />
IIncome taxes (7 709) (7 709)<br />
Net result from<br />
continued operations 13 179<br />
Other elements of the income statement<br />
in EUR ‘000’ Cooling Process All Pollution Air Pollution Chimneys non Total<br />
systems Heat Control Control allocated<br />
exchangers EMEA/Brazil NAFTA<br />
For the period ended 31 December 2008<br />
Depreciation and amortization (596) (827) (109) (345) (322) (544) (2 743)<br />
Impairment of goodwill - - - - - - -<br />
(Impairment) / reversal of impairment on inventory 14 (159) (6) - - - (151)<br />
(Impairment) / reversal<br />
of impairment on trade receivables 347 (14) (101) (33) - - 199<br />
(Increase) / decrease in provisions 128 (79) (258) (658) (178) 476 (569)<br />
For the period ended 31 December 2009<br />
Depreciation and amortization (998) (827) (180) (386) (356) (867) (3 614)<br />
Impairment of goodwill - - - - - - -<br />
(Impairment) / reversal of impairment on inventory (4) 9 2 - - - 7<br />
(Impairment) / reversal<br />
of impairment on trade receivables (83) 15 (490) (15) - - (573)<br />
(Increase) / decrease in provisions (347) (231) (737) 2 (1 445) (557) (3 315)<br />
For the period ended 31 December 2010<br />
Depreciation and amortization (1 459) (1 092) (381) (627) (317) (696) (4 572)<br />
Impairment of goodwill - - - - - (892) (892)<br />
(Impairment) / reversal of impairment on inventory - (14) - - - - (14)<br />
(Impairment) / reversal of<br />
impairment on trade receivables (323) (200) - - - (567) (1 090)<br />
(Increase) / decrease in provisions 486 160 325 400 (1 360) - 11
74<br />
<strong>Hamon</strong> Annual Report 2010<br />
Balance sheet information<br />
in EUR ‘000’ Cooling Process All Pollution Air Pollution Chimneys non Total<br />
systems Heat Control Control allocated<br />
exchangers EMEA/Brazil NAFTA<br />
As of 31 December 2008<br />
Assets 40 975 22 433 37 318 34 536 17 224 133 144 285 630<br />
Investments in associates - - - - - - -<br />
Total assets 40 975 22 433 37 318 34 536 17 224 133 144 285 630<br />
Total liabilities 59 620 14 142 21 234 26 040 30 574 84 651 236 261<br />
Capital expenditures 3 508 899 200 272 217 966 6 062<br />
As of 31 December 2009<br />
Assets 43 281 32 928 41 389 22 044 4 499 162 761 306 902<br />
Investments in associates - - - - - - -<br />
Total assets 43 281 32 928 41 389 22 044 4 499 162 761 306 902<br />
Total liabilities 52 141 18 230 33 136 20 115 23 061 94 416 241 099<br />
Capital expenditures 5 264 1 424 302 3 654 125 1 358 12 127<br />
As of 31 December 2010<br />
Assets 47 586 38 724 59 560 24 960 10 278 155 748 336 856<br />
Investments in associates - - - - - - -<br />
Total assets 47 586 38 724 59 560 24 960 10 278 155 748 336 856<br />
Total liabilities 59 130 19 359 40 651 16 077 21 292 94 209 250 718<br />
Capital expenditures 5 228 1 979 896 724 719 850 10 396<br />
All assets and liabilities (except for cash and cash<br />
equivalent, financial debts and current/deferred tax<br />
assets and liabilities) are allocated to reportable<br />
segments.<br />
The analysis of Group’s revenue per type of activities is<br />
detailed in note 8.<br />
The split of revenue and non-current assets by main<br />
countries is as follows:<br />
in EUR ‘000’ 2010 2009 2008<br />
Revenues<br />
Belgium 7 518 6 056 10 733<br />
Germany 21 428 16 040 15 168<br />
Saudi Arabia 6 148 7 309 11 101<br />
Brazil 19 305 3 422 7 958<br />
China 5 215 10 298 11 120<br />
South Korea 6 837 6 134 9 789<br />
United Arab Emirates 5 735 5 243 7 504<br />
United States 89 796 138 672 164 650<br />
France 36 473 42 008 49 115<br />
India 16 264 5 638 5 859<br />
United Kingdom 12 567 34 775 9 832<br />
Russia 21 779 7 683 -<br />
Others 96 468 96 499 63 849<br />
Total 345 533 379 777 366 678<br />
Non current assets (*)<br />
Belgium 18 448 16 836 15 199<br />
Brazil 14 281 12 558 10 447<br />
China 12 898 10 315 309<br />
South Korea 5 862 4 910 1 598<br />
United States 13 869 12 243 10 585<br />
France 13 282 14 288 13 880<br />
India 5 103 1 474 1 332<br />
Others 8 999 4 430 3 445<br />
Total 92 742 77 054 56 795<br />
(*) Excluding financial and deferred tax assets
Part 3 - Financial Statements<br />
75<br />
8. revenue<br />
Group’s revenue (excluding discontinued operations) has<br />
decreased by 9% compared to 2009 (-6% compared to<br />
2008); the growth of our activities in emerging countries<br />
(36% in 2010 compared to 27% in 2009) has not been<br />
able to fully compensate the temporary decrease of our<br />
traditional markets (Europe and NAFTA).<br />
The long term nature of several contracts in our opening<br />
backlog and the timing of orders booked during the year<br />
have also contributed to this situation. The improvement<br />
of the US dollar parity has contributed to EUR 4,8<br />
million of the revenue.<br />
The breakdown by type of activities is as follows:<br />
in EUR ‘000’ 2010 2009 2008<br />
Construction contracts 324 482 348 528 347 229<br />
Manufacturing 13 110 21 375 11 048<br />
Spare parts 3 815 4 956 4 476<br />
Services 3 615 4 433 3 735<br />
Royalties 511 485 191<br />
Total 345 533 379 777 366 679<br />
9. Operating expenses<br />
in EUR ‘000’ 2010 2009 2008<br />
Gross renumeration 65 208 55 596 51 131<br />
Employer’s contribution for social security 10 598 11 964 10 826<br />
Other personnel costs 2 002 1 960 2 127<br />
Charges/costs of the personnel 77 808 69 520 64 084<br />
Depreciation & amortization 4 572 3 614 2 743<br />
Other operating expenses 29 920 26 571 26 030<br />
Total gross operating expenses 112 300 99 705 92 857<br />
Costs allocation (1) (56 226) (48 190) (49 479)<br />
Total net operating expenses 56 074 51 515 43 378<br />
Sales & marketing costs 10 499 10 776 8 697<br />
General & administrative costs 43 870 39 922 34 018<br />
Research & development costs 1 705 817 663<br />
Total net operating expenses 56 074 51 515 43 378<br />
Average Headcount 1 221 1 140 1 015<br />
(1)<br />
Costs of time spent by employes on development projects and customer contracts<br />
The increase in gross operating expenses of the Group is<br />
mainly due to the following factors:<br />
■ changes in consolidation scope of the Group:<br />
+ EUR 3,0 million;<br />
■ the appreciation of the US dollar in 2010:<br />
+ EUR 1,4 million;<br />
■ the significant development of our activities in<br />
air-cooled condensers;<br />
■ the international development of our activities in<br />
air pollution control (China, India, Brazil, Central and<br />
Eastern Europe);<br />
■ and commitments taken to cope with the expected<br />
growth of the Group activities.<br />
The growth of allocations (+17% compared to 2009) on<br />
proposals, contract and development projects (mainly for<br />
the Cooling Systems BU) has not been able to fully<br />
compensate this increase. As a result, total net operating<br />
expenses are almost 9% higher than in 2009.
76<br />
<strong>Hamon</strong> Annual Report 2010<br />
10. Other operating income (expenses)<br />
The operating income and expenses are broken down as follows:<br />
in EUR ‘000’ 2010 2009 2008<br />
Dividends and financial income 194 79 61<br />
Profit/(loss) on disposals of assets 115 (223) 227<br />
Exchange differences, net (327) 1 445 (1 506)<br />
Impairment of current assets (1 104) (478) (406)<br />
Other miscellaneous operating income (expenses) (88) 82 530<br />
Total (1 210) 905 (1 094)<br />
As explained under page 68 of note 3, the presentation<br />
of the other operating income and expenses has been<br />
modified in order to increase the readability and<br />
presentation of the income statement.<br />
The main variations compared to 2009 come from:<br />
■ the (negative) variation of exchange differences;<br />
■ the increase of impairment of current assets<br />
mostly due to the bankruptcy of Austrian Energy<br />
(EUR 0,9 million).<br />
Other miscellaneous operating income and expenses<br />
mainly include, on one hand, insurance products and<br />
sub-letting of installations and on the other hand,<br />
banking charges and fees not directly attributable to<br />
construction contracts.<br />
11. Non-recurring income (expenses)<br />
in EUR ‘000’ 2010 2009 2008<br />
Restructuring costs (308) (390) (132)<br />
Sale of BFT (France) 1 781<br />
Acquisition of the control of HSC (India) 2 274<br />
Sale of shares of GEI (India) 828<br />
Impact of Changes in consolidation scope 4 055 - 828<br />
Impairment loss on goodwill (892)<br />
(Impairment) / reversal of impairment on other non-current assets (281)<br />
Impairment / reversal of impairment on non-current assets (1 173) - -<br />
Other non-recurring items - (16) 56<br />
Total 2 574 (406) 752
Part 3 - Financial Statements<br />
77<br />
Restructuring costs, amounting to EUR 308 thousand,<br />
are stable compared to 2009.<br />
The income of EUR 4 055 thousand related to the<br />
change in consolidation scope comes from the sale of<br />
Brown Fintube (France) in June and the take over<br />
control of our Indian subsidiary <strong>Hamon</strong> Shriram Cottrell.<br />
For more information on those transactions, refer to<br />
note 15 related to changes of scope.<br />
As a reminder, the gain of EUR 828 thousand, accounted<br />
for in 2008, was relating to the capital gain on the<br />
sale of 2 500 000 out of the 2 995 000 shares (or an<br />
ownership of 20,8%) the Group owned in GEI Industrial<br />
Systems Ltd.<br />
The impairment on goodwill is related to our Belgian<br />
subsidiary ACS (see note 22).<br />
Other impairment charges (EUR 281 thousand)<br />
consist in two adjustments accounted for on non<br />
controlling interests owned by the Group and classified<br />
in “Available-for-sale financial assets”<br />
12. net Finance costs<br />
The detail of net finance costs is as follows:<br />
in EUR ‘000’ 2010 2009 2008<br />
Interest charges (3 909) (5 232) (6 523)<br />
Costs related to anticipated reimbursement - (690)<br />
Other borrowing costs (1 652) (1 599) (3 381)<br />
Finance costs (5 561) (7 521) (9 904)<br />
Interest income 332 323 1 255<br />
Interest income 332 323 1 255<br />
Total (5 229) (7 198) (8 649)<br />
Interest charges on the debt of the Group have been<br />
reduced in 2010 (EUR 3 909 thousand) compared to<br />
2009 (EUR 5 232 thousand) thanks to our new<br />
syndicated credit facility signed at the end of 2009 and<br />
the strong decrease of interest rates during the first<br />
semester. We were able to benefit from this decrease of<br />
short term rates on the entire average amount of the<br />
debt in 2010 as we did not have any interest rate swap<br />
(IRS).<br />
The average cost of the debt was 4,68% for 2010,<br />
(6,92% for 2009) or 5,77% (8,67% in 2009) if the<br />
amortized refinancing costs of the credit lines are<br />
included in the analysis.<br />
Interest incomes in 2010 are stable versus those<br />
obtained in 2009.<br />
The section “Other borrowing costs” includes, among<br />
other, the amortization of refinancing costs of our new<br />
syndicated credit facility signed on 17 December 2009<br />
for EUR 942 thousand and commitment fees for EUR<br />
283 thousand.
78<br />
<strong>Hamon</strong> Annual Report 2010<br />
13. Income tax<br />
in EUR ‘000’ 2010 2009 2008<br />
Components of tax (expense)/income (7 709) (13 332) (14 411)<br />
Current tax (8 904) (14 036) (15 769)<br />
Related to current year (8 790) (13 787) (15 010)<br />
Related to past years (114) (249) (759)<br />
Deferred tax 1 194 704 1 358<br />
Related to current year 1 424 998 1 358<br />
Related to past years (229) (294) -<br />
Reconciliation of Group income tax charge<br />
Result before tax 20 888 31 587 35 070<br />
Share of the profit (loss) of associates - - -<br />
Result before tax and before share<br />
of the profit (loss) of associates 20 888 31 587 35 070<br />
Domestic income tax rate 33,99% 33,99% 33,99%<br />
Group theoretical income tax charge (7 100) -33,99% (10 736) -33,99% (11 920) -33,99%<br />
Utilisation of tax losses not previously recognised 324 1,55% 0,00% 0,00%<br />
Effect of different tax rates of<br />
subsidiaries operating in other juridictions (182) -0,87% (1 032) -3,27% (904) -2,58%<br />
Withholding tax on intra group dividend distribuition (19) -0,09% - 0,00% - 0,00%<br />
Deferred tax assets not recognised (1 669) -7,99% (2 484) -7,86% (1 459) -4,16%<br />
Transactions exempt from taxes 1 361 6,52% 0,00% 281 0,80%<br />
CVAE (*) (488) -2,34% 0,00% 0,00%<br />
R&D tax credits 407 1,95% 0,00% 0,00%<br />
Other movements (0) 0,00% 1 463 4,63% 350 1,00%<br />
Income tax expense related to current year (7 366) -35,26% (12 789) -40,49% (13 652) -38,93%<br />
(*) Income tax expense related to current year<br />
Thanks to the implementation of an active tax management<br />
policy, the Group income tax rate for 2010,<br />
amounting to 35,3%, dropped compared to the previous<br />
period (40,5% in 2009).<br />
This good performance mainly comes from:<br />
■ tax credits obtained for R&D activities in France and<br />
in the United States;<br />
■ the reduction of the average tax rate on the profit of<br />
our US activities from 39,0% to 36,4%;<br />
■ the reduction of losses realized by subsidiaries with<br />
no corresponding recognition of deferred tax assets;<br />
■ untaxed capital gains on the sale of BFT and the take<br />
over control of HSC;<br />
■ all of this is partly compensated by the classification<br />
as current taxes of the CVAE accounted for in 2010<br />
for the Group’s French subsidiaries.<br />
14. DISCONTINUED OPERATIONS<br />
The results of discontinued operations are as follows:<br />
in EUR ‘000’ 2010 2009 2008<br />
Miscellaneous expenses FBM & HRCI (47)<br />
Dry & Wet NAFTA cooling activities sold to SPX (22) (15) (1 715)<br />
Others (228) (26)<br />
Total (22) (243) (1 788)
Part 3 - Financial Statements<br />
79<br />
As a reminder, the costs supported by the Group on<br />
discontinued operations during the last years consisted<br />
for the most part of:<br />
■ various costs coming from the sale at the end of 2005<br />
of our Italian subsidiary FBM to KNM Group Berhad<br />
and the liquidation, at the beginning of 2005, of the<br />
remaining Italian activities carried out through one<br />
subsidiary – <strong>Hamon</strong> Research Cottrell Italia Srl;<br />
■ cost of the transactional agreement concluded<br />
between <strong>Hamon</strong> and SPX in December 2008<br />
regarding the Holdback Transaction of EUR 5 million<br />
related to the sale, in December 2003, of the global<br />
Dry and Wet NAFTA Cooling activities;<br />
■ post disposal costs of Air Industrie Thermique-Loreatt.<br />
The impact of discontinued activities on the result and<br />
on the cash flow of the Group amounts, for the 2010<br />
financial year, to EUR -22 thousand (EUR -242 thousand<br />
and EUR -441 thousand for the 2009 and 2008<br />
financial years) (see note 20).<br />
As of 31 December 2010, 2009 and 2008, assets and<br />
liabilities of discontinued activities amount to zero.<br />
15. Changes of scope<br />
Acquisition of control of subsidiaries<br />
in EUR ‘000’ HSC(*) J&C(*) Enviroserv 2010<br />
Non-current assets 1 196 230 1 595 3 021<br />
Property, Plant & Equipment 1 000 230 59 1 288<br />
Intangible assets 0 0 1 488 1 488<br />
Other non-current assets 196 0 48 244<br />
Current assets 5 410 1 013 1 550 7 973<br />
Trade and Other Receivables 4 702 785 919 6 406<br />
Cash and Cash Equivalents 264 184 575 1 022<br />
Other Current Assets 445 44 56 545<br />
Non-current liabilities 452 0 451 904<br />
Deferred Tax Liabilities 95 0 451 546<br />
Other non-current liabilities 357 0 0 357<br />
Current Liabilities 4 845 512 1 478 6 835<br />
Trade and Other payable 2 777 453 1 115 4 345<br />
Other current liabilities 2 068 58 363 2 490<br />
Net assets acquired 1 308 731 1 216 3 255<br />
Group’s share in net assets acquired 0 307 1 216 1 523<br />
Goodwill 2 274 958 1 647 4 879<br />
Purchase price -2 274 -1 265 -2 862 -6 401<br />
Deferred Payment 0 0 0 0<br />
Revaluation of interests previously held 2 274 0 0 2 274<br />
Purchase price in cash 0 -1 265 -2 862 -4 127<br />
Net cash & cash equivalents acquired 264 184 575 1 023<br />
Net cash outflow 264 -1 081 -2 287 -3 104<br />
(*) The Group has chosen to measure non-controlling interests of its business combination at their proportionate interests in the net identifiable assets of those companies<br />
On 1 April 2010, <strong>Hamon</strong> acquired 100% of Enviroserv<br />
GmbH (a German company located in Essen) that is a<br />
technological leader in air pollution control, particularly in<br />
desulphurization (FGD) such as Circulating Fluidized Bed<br />
(CFB), Wet/limestone and Seawater FGD technologies.<br />
Enviroserv is mostly active in Germany and Central<br />
Europe. Its main markets are fossil-fuel power plants and<br />
other heavy industries.<br />
On 21 October 2010, <strong>Hamon</strong> acquired an ownership<br />
of 60% in J&C Engineering Pty Ltd, a South-African<br />
company active in air pollution control (mainly electrostatic<br />
precipitators). J&C is located near Johannesburg<br />
and sells its equipment to various heavy industries in<br />
South Africa and neighboring countries. Its activities<br />
include the sale, the design and the manufacture of<br />
several metallic components in its workshop, project<br />
management, construction on site, start-up and aftersales<br />
service.
80<br />
<strong>Hamon</strong> Annual Report 2010<br />
The Group also acquired (effective as of 1 October 2010),<br />
the exclusive control of <strong>Hamon</strong> Shriram Cottrell (HSC)<br />
by purchasing from the local partner the shares<br />
necessary to obtain the majority of voting rights. Direct<br />
consequence of this acquisition of control, HSC,<br />
previously consolidated according to proportionate<br />
method, is since 1st October 2010, consolidated<br />
according to the global method.<br />
In accordance with IFRS 3 revised, the Group has<br />
recognized in the income statement the gain related to<br />
the acquisition of control (EUR 2.274 thousand accounted<br />
for as ‘impact of changes in consolidation scope’).<br />
IFRS 3 revised indeed states that in case of acquisition<br />
of control of a non controlling interest previously held,<br />
its book value is re-measured to fair value at the take<br />
over control date.<br />
According to IFRS 3 revised, direct costs related to the<br />
acquisition of those companies, amounting to EUR 159<br />
thousand, have been expensed in the income statement.<br />
Since their acquisition of control, these entities have<br />
contributed EUR 6.931 thousand to the consolidated<br />
turnover of the Group and generated an EBIT of EUR<br />
1.044 thousand.<br />
The goodwill related to those acquisitions is primarily<br />
attributable, for Enviroserv, to expected synergies, to<br />
the increased penetration of the Central and Eastern<br />
Europe markets and to the know-how and advanced<br />
technologies, particularly in specific technologies of<br />
desulphurization; for J&C to the significant added value<br />
for our air pollution control activities in South-Africa,<br />
thanks to the good complementarities with our subsidiary<br />
<strong>Hamon</strong> South Africa and for HSC to the important share<br />
taken of the Indian cooling towers market.<br />
Those goodwill have been provisionally allocated to the<br />
identifiable assets and liabilities without necessarily<br />
recognizing other assets, liabilities or eventual liabilities.<br />
This allocation is not final and is subject to revision<br />
during the course of the year.<br />
Finally, <strong>Hamon</strong> has finalized its purchase price allocation<br />
on the acquisition of DGE and TS (China) in order to<br />
reflect the finalization of the cash compensation, the<br />
review of the contingent payment portion and the update<br />
of the value of the put option granted to the non controlling<br />
shareholders.<br />
Sale/loss of control<br />
<strong>Hamon</strong> has disposed with effect on 30 June 2010<br />
of its shareholding in Brown Fintube France (BFT) to<br />
Air Industrie Thermique (AIT), a French related party.<br />
<strong>Hamon</strong> recorded a gain on disposal of EUR 1,781 million<br />
in “impact of change in consolidation scope”. The<br />
consideration was received during the month of July<br />
2010 partly in cash and for 44% (EUR 1,476 million) in<br />
the form of shares of AIT, that were issued to <strong>Hamon</strong> on<br />
12 July 2010. The transaction was made with normal<br />
reps and warranties by both parties. In addition, the<br />
contract includes an agreement by which AIT would pay<br />
a minimum dividend during the next two years and, after<br />
such period, there are put and calls on the AIT shares<br />
received as consideration. Following this transaction,<br />
the ownership owned in AIT by the Group, classified<br />
under ‘Available-For-Sales Financial Assets’ increased<br />
from 10 to 19%.<br />
16. Earnings per share<br />
Continued and discontinued operations<br />
The basic earnings per share coming from the<br />
continued and discontinued operations are calculated<br />
by dividing the net result for the year attributable to<br />
the equity holders of the Company by the weighted<br />
average number of ordinary shares in circulation during<br />
the fiscal year:<br />
in EUR ‘000’ 2010 2009 2008<br />
Net result (equity holders of the Company) 11 631 17 369 18 505<br />
Weighted average number of<br />
ordinary shares during the year 7 191 472 7 191 472 7 191 472<br />
Basic earnings per share (EUR/share) 1,62 2,42 2,57
Part 3 - Financial Statements<br />
81<br />
The weighted average number of shares is calculated<br />
based on the numbers in note 30.<br />
The basic earnings per share are identical to the diluted<br />
earnings per shares. Indeed, given their strike price, the<br />
stock options granted to Group employees have no<br />
diluting impact as of 31 December 2008, 2009 and<br />
2010 (see note 33).<br />
Continued operations<br />
The basic earnings per share from continued operations<br />
is calculated by dividing the net result from the continued<br />
operations of the year attributable to the equity holders<br />
of the Company by the weighted average number of<br />
ordinary shares in<br />
circulation during the fiscal year. The number of shares<br />
representing the share capital has not changed during<br />
the three last years. It amounts to 7.191.472 shares.<br />
Discontinued operations<br />
Basic and diluted earnings per share for discontinued<br />
operations amounted to EUR 0,00 per share on<br />
31 December 2010 (EUR -0,03 and EUR -0,25 per<br />
share on the 31 December 2009 and 2008), calculated<br />
on the basis of the net result of the discontinued operations<br />
of EUR -22 thousand in 2010 (EUR -243 thousand<br />
and EUR -1.788 thousand in 2009 and 2008) and of the<br />
denominators detailed above.<br />
17. Cash flow from operating activities<br />
Cash generated from operations before taxes, at EUR<br />
11.042 thousand is significantly lower than the last two<br />
periods. This situation mainly comes from the projects<br />
execution cycle.<br />
18. Cash flow from investing activities<br />
Net cash flow from investments amounts to<br />
EUR -13.098 thousand. The investments of the year are<br />
mainly related to:<br />
■ the payment of the acquisition of Enviroserv (Germany)<br />
and J&C (South-Africa) and part of the balance due for<br />
the acquisition of DG Environmental and TS Filtration<br />
acquired in 2009 (see note 15);<br />
■ the payment of an available-for-sale financial asset in<br />
the company OHL Technologies (Germany);<br />
■ the sale proceeds from our subsidiary Brown Fintube<br />
France (received in July 2010);<br />
■ major investments in internal development projects;<br />
■ the development of our production capacity of air-cooled<br />
condensers in China;<br />
■ the acquisitions and/or leasehold improvements of<br />
buildings in Belgium, Korea, China and India following<br />
the strong increase of our activities in those countries;<br />
and<br />
■ the investments for recurring replacements.<br />
19. Cash flow from financing activities<br />
The cash flow from financing activities amounts to EUR<br />
-5.028 thousand in 2010.<br />
‘Proceeds from new bank borrowings’, at EUR 11.158<br />
thousand mainly come from additional draw downs of<br />
our revolving credit facility (see note 34).<br />
‘Reimbursement of bank borrowings’ of EUR 7.644<br />
thousand result from the contractual reimbursement,<br />
in December 2010, of the first part of EUR 5.000<br />
thousand of our term loan facility (see note 34).<br />
‘Dividend paid to shareholders’ results from the payment,<br />
on 15 May 2010, of the final dividend for the year<br />
2009 for EUR 3.236 thousand, or EUR 0,45 per share,<br />
and the payment, on 9 September 2010, of the advance<br />
dividend for the year 2010 of EUR 1.798 thousand, or<br />
EUR 0,25 per share.<br />
We invite you to consult note 12 for the information on<br />
interests received and paid during the year 2010.<br />
20. Cash flow from discontinued activities<br />
Not significant in 2010 (EUR -22 thousand).
82<br />
<strong>Hamon</strong> Annual Report 2010<br />
21. Intangible assets<br />
in EUR ‘000’ Patents and Development Total<br />
trade marks<br />
costs<br />
As of 31 December 2007<br />
Cost 7 883 4 205 12 088<br />
Accumulated amortization and impairment (7 132) (3 716) (10 848)<br />
Net carrying amount 751 489 1 240<br />
For the year ended 31 December 2008<br />
Exchange difference 21 137 158<br />
Additions 2 152 548 2 700<br />
Amortization charge for the year (254) (12) (266)<br />
Net carrying amount at closing date 2 670 1 162 3 832<br />
As of 31 December 2008<br />
Cost 10 054 4 891 14 945<br />
Accumulated amortization and impairment (7 384) (3 729) (11 113)<br />
Net carrying amount 2 670 1 162 3 832<br />
For the year ended 31 December 2009<br />
Exchange difference (5) (89) (94)<br />
Additions 970 1 298 2 268<br />
Amortization charge for the year (477) (353) (830)<br />
Net carrying amount at closing date 3 158 2 018 5 176<br />
As of 31 December 2009<br />
Cost 10 991 6 099 17 090<br />
Accumulated amortization and impairment (7 833) (4 081) (11 914)<br />
Net carrying amount 3 158 2 018 5 176<br />
For the year ended 31 December 2010<br />
Exchange difference 24 195 219<br />
Additions 844 2 937 3 781<br />
Amortization charge for the year (779) (547) (1 326)<br />
Entry / changes in consolidation scope 1 415 73 1 488<br />
Derecognized on disposal of a subsidiary (17) - (17)<br />
Net carrying amount at closing date 4 645 4 676 9 321<br />
As of 31 December 2010<br />
Cost 13 257 9 304 22 561<br />
Accumulated amortization and impairment (8 612) (4 628) (13 240)<br />
Net carrying amount 4 645 4 676 9 321<br />
All intangible assets have a finite utility period on which<br />
the assets are amortized. The amortization charge is<br />
included either under “General & administration costs”<br />
or “Research & development costs”.<br />
The trademarks and licenses are predominantly<br />
composed of software licenses, the name ‘Clean Flow’<br />
and also, since the acquisition of Enviroserv, of patents<br />
and license agreements for the intellectual property<br />
owned by this company.
Part 3 - Financial Statements<br />
83<br />
22. GOODWILL<br />
in EUR ‘000’<br />
As of 31 December 2007<br />
Cost 17 956<br />
Accumulated amortization and impairment (639)<br />
Net carrying amount 17 317<br />
For the year ended 31 December 2008<br />
Exchange difference (231)<br />
Entry / changes in consolidation scope 12 503<br />
Net carrying amount at closing date 29 589<br />
As of 31 December 2009<br />
Cost 42 286<br />
Accumulated amortization and impairment (639)<br />
Net carrying amount 41 647<br />
For the year ended 31 December 2010<br />
Exchange difference 3 484<br />
Impairment charge (892)<br />
Entry / changes in consolidation scope 4 879<br />
Net carrying amount at closing date 49 118<br />
As of 31 December 2008<br />
Cost 30 228<br />
Accumulated amortization and impairment (639)<br />
Net carrying amount 29 589<br />
As of 31 December 2010<br />
Cost 50 649<br />
Accumulated amortization and impairment (1 531)<br />
Net carrying amount 49 118<br />
For the year ended 31 December 2009<br />
Exchange difference 2 576<br />
Entry / changes in consolidation scope 9 482<br />
Net carrying amount at closing date 41 647<br />
During 2010, <strong>Hamon</strong> proceeded with the acquisition of<br />
Enviroserv GmbH and of J&C Engineering (Pty) (see<br />
note 15). The goodwill generated by these acquisitions<br />
of EUR 2.605 thousand, were allocated to the Cash<br />
Generating Unit (CGU) APC EMEA/Brazil.<br />
Other movements of the heading “Entry / changes in<br />
consolidation scope” are related to 1. the update of<br />
purchase price of DGE and TS (China) in order to<br />
reflect the finalization of the cash compensation, the<br />
review of the contingent payment portion and the<br />
update of the value of the put option granted to the non<br />
controlling shareholders and 2. the goodwill generated<br />
on the acquisition of control of <strong>Hamon</strong> Shriram Cottrell<br />
Pvt Ltd (India) that has been allocated to the CGU<br />
Cooling Systems.<br />
The balance of the goodwill generated on the acquisition<br />
of ACS (EUR 892 thousand) and previously not<br />
allocated, has been integrated, effective December 31<br />
2010, to CGU Process Heat Exchangers.<br />
The Group annually performs an impairment test of<br />
goodwill in conformity with the accounting principles<br />
under note 3. The recoverable value of cash generating<br />
units was determined on the basis of their fair value<br />
decreased by the sale expenses related to those cash<br />
generating units.<br />
The fair value of cash generating units is estimated on<br />
the basis of:<br />
■ Current and future EBITDAs as derived from the budgets<br />
of the Group, approved by the Board of Directors;<br />
■ Usual market multiples for similar activities;<br />
■ Corrections due to non-operational assets and liabilities<br />
of which the value is not reflected by the EBITDAs.<br />
Market multiples were researched by referring to a number<br />
of other quoted companies in our sector and compared with<br />
recent transactions, principally on the American markets.<br />
This analysis confirmed the prudent nature of the adopted<br />
multiples. The fair value obtained was, thereafter, compared<br />
to the net book value, including goodwill, of the activity<br />
evaluated.<br />
Moreover, assessments on basis of “discounted cash flows”<br />
have been carried out for the BU APC EMEA/Brazil<br />
(projection period: 3 years, growth rate: 3%, discount rate:<br />
12%), BU APC NAFTA, BU Chimneys and on ACS.<br />
Based of the tests carried out, an impairment loss<br />
(EUR 892 thousand) was deemed necessary on ACS<br />
goodwill. As its goodwill was not allocated when the<br />
impairment tests were performed, the impairment loss<br />
has not been charged to the goodwill of a Business Unit.<br />
No other impairment loss was deemed necessary in 2010.
84<br />
<strong>Hamon</strong> Annual Report 2010<br />
On 31 December 2010 the allocation of the net book<br />
value of the goodwill between the cash generating units<br />
is as follows:<br />
in EUR ‘000’ 2010 2009 2008<br />
Cooling Systems 7 324 4 798 4 543<br />
Process Heat Exchangers 1 743 851 851<br />
Air Pollution Control EMEA/Brazil 35 476 29 871 18 226<br />
Air Pollution Control NAFTA 4 211 4 008 4 099<br />
Chimneys 364 335 341<br />
Others 0 1 784 1 529<br />
Total 49 118 41 647 29 589<br />
23. Property, Plant & Equipment<br />
in EUR ‘000’ Land and Furniture and Plant, other Assets under Total<br />
buildings vehicles machinery and tangible construction<br />
equipment assets and advance<br />
As of 31 December 2007<br />
Cost 17 267 4 559 18 753 1 171 409 42 159<br />
Accumulated depreciation (7 188) (3 159) (12 361) (373) 1 (23 080)<br />
Net carrying amount 10 079 1 400 6 392 798 410 19 079<br />
For the year ended 31 December 2008<br />
Exchange difference (229) (23) 65 (9) (38) (234)<br />
Additions 900 418 1 432 104 508 3 362<br />
Disposals (135) (19) (68) (2) (24) (248)<br />
Depreciation charge for the year (755) (432) (1 117) (173) - (2 477)<br />
Entry / changes in consolidation scope 2 738 116 629 149 260 3 892<br />
Transferred from an account to another 17 - 266 - (283) -<br />
Net carrying amount at closing date 12 615 1 460 7 599 867 833 23 374<br />
As of 31 December 2008<br />
Cost 22 308 5 172 25 303 1 468 832 55 083<br />
Accumulated depreciation (9 693) (3 712) (17 704) (601) 1 (31 709)<br />
Net carrying amount 12 615 1 460 7 599 867 833 23 374<br />
For the year ended 31 December 2009<br />
Exchange difference 188 37 (83) 7 3 152<br />
Additions 5 333 329 3 807 35 355 9 859<br />
Disposals - (56) (77) (3) (399) (535)<br />
Depreciation charge for the year (637) (498) (1 448) (201) - (2 784)<br />
Entry / changes in consolidation scope - 37 128 - - 165<br />
Transferred from an account to another 30 - 466 - (496) -<br />
Net carrying amount at closing date 17 529 1 309 10 392 705 296 30 231
Part 3 - Financial Statements<br />
85<br />
in EUR ‘000’ Land and Furniture and Plant, other Assets under Total<br />
buildings vehicles machinery and tangible construction<br />
equipment assets and advance<br />
As of 31 December 2009<br />
Cost 27 859 5 519 29 544 1 507 295 64 724<br />
Accumulated depreciation (10 330) (4 210) (19 152) (802) 1 (34 493)<br />
Net carrying amount 17 529 1 309 10 392 705 296 30 231<br />
For the year ended 31 December 2010<br />
Exchange difference 1 013 106 427 8 21 1 575<br />
Additions 1 336 514 2 499 33 2 178 6 560<br />
Disposals (177) (50) (652) - (45) (924)<br />
Depreciation charge for the year (851) (480) (1 718) (196) (1) (3 246)<br />
Derecognized on disposal of a subsidiary (902) (40) (144) - - (1 086)<br />
Entry / changes in consolidation scope 697 148 337 1 20 1 193<br />
Transferred from an account to another 46 (5) 13 (54) - -<br />
Net carrying amount at closing date 18 691 1 492 11 154 497 2 469 34 303<br />
As of 31 December 2010<br />
Cost 25 241 5 241 33 793 1 484 2 469 68 228<br />
Accumulated depreciation (6 550) (3 749) (22 639) (987) - (33 925)<br />
Net carrying amount 18 691 1 492 11 154 497 2 469 34 303<br />
The amount included under the ‘Land and buildings’ heading includes a net amount of EUR 7.418 thousand for<br />
assets under finance lease on 31 December 2010 (EUR 8.373 thousand on 31 December 2009).<br />
24. Available-for-sale financial assets<br />
in EUR ‘000’ non-current Current<br />
For the year ended as of 31 December 2008<br />
Balance at opening date 1 001 9<br />
Additions 669 -<br />
Disposals (113) -<br />
Transfer from one caption to another - 263<br />
Fair value adjustment - (26)<br />
Exchange difference (174) (2)<br />
Balance at closing date 1 383 244<br />
For the year ended as of 31 December 2009<br />
Balance at opening date 1 383 244<br />
Additions 560 -<br />
Disposals (138) (2)<br />
Transfer from one caption to another 237 (237)<br />
Fair value adjustment 294<br />
Exchange difference 80 0<br />
Balance at closing date 2 416 5
86<br />
<strong>Hamon</strong> Annual Report 2010<br />
in EUR ‘000’ non-current Current<br />
For the year ended 31 December 2010<br />
Balance at opening date 2 416 5<br />
Additions 2 451 -<br />
Impairment charge (281) -<br />
Fair value adjustment 2 029 -<br />
Other variations - 1<br />
Exchange difference 10 1<br />
Balance at closing date 6 625 7<br />
Non-current available-for-sale financial assets are<br />
investments in companies in which the Group holds no<br />
notable influence.<br />
The increase during 2010 mainly comes from:<br />
■ the capital increase in Xylowatt, a Belgian company<br />
active in the design, manufacturing, sale and exploitation<br />
of gasification units of biomass;<br />
■ a non controlling interest of 19% in Ohl Technologies,<br />
acquired end of March 2010. Ohl is a manufacturer of<br />
heat exchangers for power plants (among other solar<br />
thermals) located in Lumburg, Germany;<br />
■ additional acquisition of non controlling interest in AIT<br />
following the disposal of BFT;<br />
■ and the revaluation of available-for-sale assets to their<br />
fair value.<br />
25. Deferred taxes<br />
Deferred tax per category Assets Liabilities<br />
in EUR ‘000’ 31/12/10 31/12/09 31/12/08 31/12/10 31/12/09 31/12/08<br />
Temporary differences<br />
Intangible assets and goodwill - - - (1 457) (921) (751)<br />
Property, plant & equipment 50 24 16 (182) (209) (387)<br />
Construction contracts 969 529 439 (1 847) (2 488) (2 092)<br />
Provisions 847 756 326 (431) (360) (269)<br />
Finance lease contracts - 18 56 (812) (982) (892)<br />
Others 1 818 2 165 2 085 (301) (244) (1 294)<br />
Total temporary differences 3 684 3 492 2 922 (5 030) (5 204) (5 685)<br />
Tax losses and other tax credits 6 573 5 359 5 465<br />
Total deferred tax assets/liabilities 10 257 8 851 8 387 (5 030) (5 204) (5 685)<br />
Compensation of assets and liabilities per tax entity (1 847) (2 681) (2 412) 1 847 2 681 2 412<br />
Total, net 8 410 6 170 5 975 (3 183) (2 523) (3 273)
Part 3 - Financial Statements<br />
87<br />
Table of variation of deferred taxes<br />
in EUR ‘000’ 2010 2009 2008<br />
Net deferred taxes as of 1st January 3 647 2 702 2 181<br />
Deferred tax income / (expense) 1 194 704 1 358<br />
Exchange difference 269 191 (838)<br />
Others 117 50 1<br />
Net deferred taxes as of 31 December 5 227 3 647 2 702<br />
Deferred tax assets are recognized only if their use is probable,<br />
that is to say if sufficient taxable benefit is expected<br />
in the future years. These assets are only recognized, after<br />
extensive review of the business plans for the next five<br />
years by the Board of Directors, if it can be considered that<br />
there is a high probability these amounts would be used<br />
due to the positive markets in which the Group is involved,<br />
the Group’s strong performance in those markets and the<br />
growing profitability of its operations.<br />
Following this review, a net deferred tax asset of EUR<br />
1.592 thousand, excluding currency translation effect, has<br />
been recognized in 2010 in the Group financial statements.<br />
The Group did not recognize deferred tax assets for a total<br />
amount of EUR 28.752 thousand as of 31 December 2010<br />
(respectively EUR 26.660 thousand and EUR 24.176<br />
thousand on 31 December 2009 and 2008) and will<br />
review this situation during later financial years according to<br />
the profitability of the various tax entities. Those unrecognized<br />
deferred tax assets mainly come from tax losses<br />
carried forward for which the use is not limited in time.<br />
26. Inventories<br />
in EUR ‘000’ 31/12/10 31/12/09 31/12/08<br />
Raw materials & consumables 5 820 4 347 4 191<br />
Inventories and WIP - not related to construction contracts 3 036 2 805 2 330<br />
Finished goods 5 325 2 543 2 371<br />
Total 14 181 9 695 8 892<br />
As of 31 December 2010, write-offs accounted for on<br />
stocks amounted to EUR 1.020 thousand (respectively EUR<br />
1.045 thousand and EUR 1.056 thousand at 31 December<br />
2009 and 2008).<br />
The net book value of the pledged inventories amounts<br />
to EUR 310 thousand (null as of 31 December 2009<br />
and 2008).<br />
27. Construction contracts<br />
in EUR ‘000’ 31/12/10 31/12/09 31/12/08<br />
Contract costs incurred and recognised profits<br />
(less recognised losses to date) 294 924 387 515 279 447<br />
Progress billings (319 859) (419 219) (310 973)<br />
Total (24 935) (31 704) (31 526)<br />
Amount due from customers for contract work 33 247 32 526 37 877<br />
Amount due to customers for contract work (58 182) (64 230) (69 403)<br />
Total (24 935) (31 704) (31 526)
88<br />
<strong>Hamon</strong> Annual Report 2010<br />
Contracts in progress, i.e. those for which the guarantee<br />
period has not yet started, are maintained in the<br />
balance sheet. The variation of both costs incurred and<br />
advances billed to clients, is thus linked to the timing of<br />
acceptance of orders by our customer rather than the<br />
growth of our activities.<br />
Retentions held by our customers on progress billings<br />
and which, in conformity with contractual conditions,<br />
will be paid to <strong>Hamon</strong> on the final acceptance of<br />
considered projects, stand at EUR 4.212 thousand as of<br />
31 December 2010 (respectively EUR 1.295 thousand<br />
and EUR 1.390 thousand on 31 December 2009<br />
and 2008).<br />
28. Trade and other receivables<br />
in EUR ‘000’ 31/12/10 31/12/09 31/12/08<br />
Trade receivables 85 213 76 571 89 461<br />
less : impairment of doubtful receivables (3 358) (2 299) (2 227)<br />
Trade receivables - net 81 855 74 272 87 234<br />
Retentions 4 212 1 295 1 390<br />
Prepayments 6 556 2 574 3 649<br />
Cash deposits and guarantees paid 767 845 560<br />
Receivables on related parties 1 372 1 062 4 980<br />
Other receivables 11 517 10 884 13 372<br />
Total 106 279 90 932 111 185<br />
Non-current Trade and other receivables<br />
Receivables on related parties - - 706<br />
Cash deposits and guarantees paid 623 756 560<br />
Other non-current receivables 2 112 2 000 1 336<br />
Less: non-current receivables (2 735) (2 756) (2 602)<br />
Trade and other receivables - current 103 544 88 176 108 583<br />
On 31 December 2010, the amount of receivables<br />
assigned without recourse to financial organizations and<br />
that are deducted from the section ‘Trade receivables’ is<br />
EUR 3.188 thousand (EUR 0 thousand on 31 December<br />
2009).<br />
Local practice sometimes requires that clients retain a<br />
percentage on payments (called retention) until the final<br />
acceptance of the contract. This percentage is generally<br />
limited to 10%.<br />
29. Cash and cash equivalents<br />
in EUR ‘000’ 31/12/10 31/12/09 31/12/08<br />
Credit Institutions 25 740 34 920 16 078<br />
Cash in hand 838 133 47<br />
Fixed income securities 37 422 46 171 40 846<br />
Short term cash deposits 4 077 2 029 2 118<br />
Cash and cash equivalents 68 077 83 253 59 089
Part 3 - Financial Statements<br />
89<br />
On 31 December 2010, the amount of cash and cash<br />
equivalents that the Group cannot dispose of freely<br />
stands at EUR 3.798 thousand against EUR 2.654<br />
thousand on 31 December 2009 and EUR 2.931 on<br />
31 December 2008.<br />
Fixed income securities (EUR 37.422 thousand) are<br />
mostly composed of placements in two Money Market<br />
Funds invested in American Treasury bonds and<br />
guaranteed bonds of the US Department of Treasury.<br />
The sum placed in such funds as of 31 December 2009<br />
was EUR 46.171 thousand.<br />
30. Share capital<br />
The share capital and number of shares stand as follows:<br />
31/12/10 31/12/09 31/12/08<br />
Number of shares as of closing date 7 191 472 7 191 472 7 191 472<br />
Share capital (in EUR) 2 157 442 2 157 442 2 157 442<br />
Face value per share (in EUR/share) 0,30 0,30 0,30<br />
Shareholders:<br />
Shareholder shares 31/12/10 %<br />
Sopal International SA 4 598 155 63,9%<br />
Esindus S.A. 303 506 4,2%<br />
Walloon Region, represented by the Société Wallonne de Gestion et de Participation S.A. 100 000 1,4%<br />
Fortis Investment Management S.A. 175 106 2,4%<br />
Baillie Gifford 148 469 2,1%<br />
Kempen Capital Management 144 415 2,0%<br />
Other public 1 721 821 24,0%<br />
Total 7 191 472 100%<br />
On 31 December 2010 the share capital amounts to<br />
EUR 2.157.442 made up of 7.191.472 shares with no<br />
stated value. None of the Company’ shares are held by<br />
the Group.<br />
Dividends:<br />
On 9 September 2010, the Group paid and advance<br />
dividend of EUR 0,25 per share for the year 2010.<br />
The Group proposes to distribute an additional dividend<br />
of EUR 0,35 per share, or a total of EUR 0,60 per share,<br />
for the year 2010 (to a similar level than 2009).<br />
This supplement, pending approval by the Annual<br />
General Assembly of Shareholders on 26 April 2011, will<br />
be paid on 10 May 2011.
90<br />
<strong>Hamon</strong> Annual Report 2010<br />
31. Provisions for other liabilities and charges<br />
Provisions for restructuring, warranty, losses on contract<br />
and others are accounted for and estimated on the<br />
basis of the probability of future cash-out payments as<br />
well as historical information based on facts and<br />
circumstances known at the closing date. The actual<br />
charge may differ from the amounts accounted for.<br />
‘Provisions for restructuring’ relate to entities located in<br />
Belgium, the related cash-out being spread out in time.<br />
The main movement during the year is related to the<br />
increase of provisions for warranty due to the completion<br />
of several contracts in the United States.<br />
The Board of Directors considers that these amounts<br />
constitute the best current estimate and that the Group<br />
will not have to bear any additional charge.<br />
in EUR ‘000’ restructuring Warranty Losses on other Total<br />
contracts provisions<br />
Balance as of 1st January 2008 905 1 213 739 2 120 4 977<br />
Additions - 864 299 94 1 257<br />
Reversals - - - (905) (905)<br />
Use of provision (170) (70) (23) (898) (1 161)<br />
Exchange difference - 97 24 (4) 117<br />
Entry / changes in consolidation scope - - 367 124 491<br />
Other movements - - - - -<br />
Balance as of 31 December 2008 735 2 104 1 406 531 4 776<br />
Additions 400 1 948 932 1 130 4 410<br />
Reversals - (707) (151) (237) (1 095)<br />
Use of provision (186) (203) - (176) (565)<br />
Exchange difference - (94) 95 160 161<br />
Entry / changes in consolidation scope - - - - -<br />
Other movements (226) (30) (688) 944 -<br />
Balance as of 31 December 2009 723 3 018 1 594 2 352 7 687<br />
Additions - 1 793 56 231 2 080<br />
Reversals - (580) (731) (780) (2 091)<br />
Use of provision (371) (705) - (806) (1 882)<br />
Exchange difference - 231 37 160 428<br />
Entry / changes in consolidation scope - 129 - 118 247<br />
Other movements 13 100 (672) 559 -<br />
Balance as of 31 December 2010 365 3 986 284 1 834 6 469<br />
Of which non-current provisions 255 326 85 265 931<br />
Of which current provisions 110 3 660 199 1 569 5 538<br />
32. Provisions for pensions<br />
The provisions for pension benefits amount to EUR 3.521 thousand at the end of 2010. They are primarily made up of<br />
post-employment benefits in line with local practices.
Part 3 - Financial Statements<br />
91<br />
Retirement and other long term Personnel Benefits<br />
in EUR ‘000’ Provisions for Provisions for other long TOTAL<br />
pension plan retirement term benefits<br />
lump sum<br />
As of 1st January 2008 2 134 60 90 2 284<br />
Additions 458 13 9 480<br />
Reversals (3) - - (3)<br />
Utilization (219) (6) (12) (237)<br />
Entry / changes in consolidation scope 297 - - 297<br />
Exchange difference (189) (1) (28) (218)<br />
As of 31 December 2008 2 478 66 59 2 603<br />
Additions 453 4 - 457<br />
Reversals - - (36) (36)<br />
Utilization (117) (7) (4) (128)<br />
Entry / changes in consolidation scope - - - -<br />
Exchange difference 35 - 7 42<br />
As of 31 December 2009 2 849 63 26 2 938<br />
Additions 737 10 4 751<br />
Reversals - - - -<br />
Utilization (305) (6) 1 (310)<br />
Entry / changes in consolidation scope 121 - - 121<br />
Exchange difference 114 - 5 119<br />
Disposals (98) - - (98)<br />
As of 31 December 2010 3 418 67 36 3 521<br />
Of which defined benefit plan obligation 3 418 67 - 3 485<br />
Retirement Obligations<br />
The post-employment benefits are categorized as either<br />
defined contribution plans or defined benefit plans.<br />
The retirement plans based on defined contributions are<br />
plans for which the organization pays determined<br />
contributions to a separate entity in accordance with<br />
the plan’s provisions. The Group has no obligation<br />
beyond these contribution payments. The contributions<br />
paid for these plans amounted respectively to EUR 988<br />
thousand in 2010, EUR 847 thousand in 2009 and EUR<br />
696 thousand in 2008. These plans are primarily<br />
offered by Belgian, British and South African companies<br />
within the <strong>Hamon</strong> Group.<br />
The defined benefit plans require the accounting for the<br />
obligations of the Company towards its employees in its<br />
financial statements. These benefits are granted by<br />
some Belgian, German, French, Indian, Indonesian and<br />
Korean companies. The net obligations resulting from<br />
these plans and their changes are subject to a yearly<br />
actuarial review. The amounts accounted for in these<br />
plans are for the three last years as well as a forecast<br />
for the following year are:<br />
in EUR ‘000’ 31/12/10 31/12/09 31/12/08<br />
Service cost: employer 381 266 236<br />
Interest cost 237 224 213<br />
Expected return on plan asset (43) (40) (40)<br />
Amortisation of actuarial net losses/(gains) 18 7 16<br />
Past service cost recognised this year 154 - 42<br />
Losses/(gains) on curtailments/settlements - - -<br />
Net expense recognised - Defined benefit plans 747 457 467<br />
The cost is recorded under ‘Cost of sales’, ‘General and<br />
Administration’ costs and ‘Financial Expenses’. It has<br />
significantly increased this year, mainly due to the past<br />
service costs of EUR 154 thousand for the German and
92<br />
<strong>Hamon</strong> Annual Report 2010<br />
Indian plans. The increase of service costs is mainly<br />
linked to companies in Korea (proximity to the<br />
retirement age of key executives) and in India<br />
(personnel + 32% and effect of change in consolidation<br />
scope).<br />
The balance sheet amounts for the defined benefit plans are as follows:<br />
Funding Status<br />
in EUR ‘000’ 31/12/10 31/12/09 31/12/08<br />
Funded plans - defined benefit obligations 1 403 1 277 1 039<br />
Fair value of plan assets (1 218) (1 031) (898)<br />
Deficit of funded plans 185 246 141<br />
Unfunded plans - defined benefit obligations 3 971 3 308 2 789<br />
Deficit 4 156 3 554 2 930<br />
Unrecognised actuarial gain/(losses) (521) (642) (386)<br />
Unrecognised past service cost (150) - -<br />
Net liability/(asset) in the balance sheet 3 485 2 912 2 544<br />
Liability recognised in the balance sheet 3 485 2 912 2 544<br />
Asset recognised in the balance sheet - - -<br />
Un-recognized past service costs mainly come from the French subsidiary <strong>Hamon</strong> D’Hondt due to a change of the<br />
French Metallurgy Convention impacting the calculation of pension benefits.<br />
The obligations are financed in part by assets that have evolved during the year as such:<br />
Changes in plan assets<br />
in EUR ‘000’ 2010 2009 2009<br />
Fair value of plan assets at beginning of period 1 031 898 753<br />
Actual return on plan assets 67 40 40<br />
Actual Employer contributions 243 119 116<br />
Actual Employee contributions 29 28 28<br />
Actual Benefits paid (148) (57) (41)<br />
Others (4) 3 2<br />
Fair value of plan assets at end of period 1 218 1 031 898<br />
The movement of net obligations in 2010 is as follows:<br />
Change in net liability/asset<br />
in EUR ‘000’ 2010 2009 2009<br />
Net amount at beginning of period 2 912 2 544 2 194<br />
Net expense - defined benefit plan 747 457 467<br />
Company contributions and direct benefit payments (311) (124) (225)<br />
Changes in consolidation scope 23 - 8<br />
Others 114 35 100<br />
Net amount at end of period 3 485 2 912 2 544
Part 3 - Financial Statements<br />
93<br />
The increase of the net obligation comes from the<br />
subsidiaries in India (EUR 230 thousand) and in Korea<br />
(EUR 176 thousand). The increase of the Indian provision<br />
comes from the change in consolidation scope as well as<br />
from the important increase of employees of this subsidiary<br />
(+32 %) compared to last year. The increase of Korean<br />
provision results from the significant decrease of discount<br />
rate compared to 2009, an important increase on salaries<br />
and the proximity of retirement age of some executives.<br />
Pension provisions in the French subsidiaries have also<br />
increased due to the pension reform in France changing<br />
the minimum age for retirement.<br />
Finally, the depreciation of EUR compared to all other<br />
currencies has also had a positive impact on the net<br />
consolidated amount of provisions denominated in local<br />
currencies.<br />
The changes in gross obligations during the year are presented below:<br />
in EUR ‘000’ 2010 2009 2009<br />
Defined Benefit Obligation at beginning of period 4 585 3 828 3 355<br />
Service cost: employer 381 266 236<br />
Interest cost 237 224 213<br />
Actual employee Contribution 29 28 28<br />
Plan Amendment 191 - 27<br />
Acquisitions/(Disposals) (25) - -<br />
Actuarial loss (gain) 99 249 (69)<br />
Actual Benefits paid (311) (124) (225)<br />
Others 188 114 263<br />
Defined Benefit Obligation at end of period 5 374 4 585 3 828<br />
The heading ‘Plan amendment’ mostly comes from an<br />
amendment in the French Metallurgy Convention<br />
impacting the calculation of pension benefits of <strong>Hamon</strong><br />
D’Hondt for EUR 151 thousand. The actuarial loss of<br />
EUR 99 thousand in 2010 is composed of a loss of EUR<br />
85 thousand coming from the evolution of rates used for<br />
the computation as well as a loss of EUR 14 thousand<br />
coming from the experience.<br />
Finally, the important currency translation difference<br />
comes from the depreciation of the EUR this year.<br />
The actuarial assumptions used for the valuation of the obligations and their movements give the following weighted<br />
average rates:<br />
Actuarial assumptions 2010 2009 2009<br />
Discount rate 3,3-10% 5,31% 5,50%<br />
Expected future salary increase rate 2,5-15% 3,73% 3,47%<br />
Underlying inflation rate 2-7% 2,51% 3,00%<br />
Expected return rate on plan assets 3,90% 4,15% 4,25%<br />
The interest rates used to discount the obligations have<br />
slightly decreased this year compared to previous years<br />
following market rate fluctuations.<br />
The number of employees covered by the plans in 2010<br />
amounts to 503 (of which 10 are inactive) in comparison<br />
to 478 (of which 8 are inactive) in 2009 and 461 (of<br />
which 7 are inactive) in 2008. It has increased every<br />
year, mainly due to the headcount increase of our Indian<br />
subsidiary.
94<br />
<strong>Hamon</strong> Annual Report 2010<br />
33. Share-based compensation (stock options)<br />
The Board of Directors, with the approval of the Extraordinary<br />
General shareholders meeting of 27 May 2008,<br />
decided to grant a stock option plan to the managers of<br />
the Group (around 40 persons) with the goal of focusing<br />
them on the long-term development of the Group.<br />
The details of these plans are as follows:<br />
Stock option plans granted by the company<br />
Plan Beneficiaries Grant date End date Exercise exercice Outstanding options at<br />
Price Periods 31/12/2010 31/12/2009 31/12/2008<br />
ESOP 2008 (B+G) Belgium and 27/05/08 26/05/15 33,58 From 2012 to 2015, 17 050 17 050 17 050<br />
Germany from 15 March till 31<br />
May and from 15 Sept.<br />
to 15 November<br />
ESOP 2008 (F) France 6/10/08 26/05/15 29,71 In 2012 from 6 October 5 500 5 500 5 500<br />
to 15 November; from<br />
2013 to 2015 from 15<br />
March to 31 May and<br />
from 15 September<br />
to 15 November<br />
Total 22 550 22 550 22 550<br />
Each option is a right to buy a <strong>Hamon</strong> share at the price<br />
and dates indicated. This right can only be exercised if<br />
the beneficiary is still working for the Group at the date<br />
of the exercise period. The American management of<br />
the Group benefit from ‘Phantom stock options’ under<br />
the same conditions as the French Management. These<br />
phantom options are thus a plan of which the settlement<br />
is made through payment and not shares.<br />
Stock Option Plan<br />
2010 2009 2008<br />
Number of Average Number of Average Number of Average<br />
share options exercise price share options exercise price share options exercise price<br />
Number of stock options as of 1st January 22 550 32,64 22 550 32,64 0<br />
Stock options granted 0 0,00 0 0,00 22 550 32,64<br />
Forfeitures of rights & options expired 0 0,00 0 0,00 0 0,00<br />
Stock options exercised 0 0,00 0 0,00 0 0,00<br />
Stock options expired 0 0,00 0 0,00 0 0,00<br />
Number of stock options as of 31 December 22 550 32,64 22 550 32,64 22 550 32,64<br />
Stock options exercisable as of 31 December 0 0,00 0 0,00 0 0,00
Part 3 - Financial Statements<br />
95<br />
Valuation of options granted during the year 2010 2009 2008<br />
niLL NILL niLL NILL ESOP 2008 ESOP 2008<br />
(B+G) (F)<br />
Number of stock options granted - - - - 17 050 5 500<br />
Valuation model - - - - Black & Scholes<br />
Assumed volatility (% pa) - - - - 50,00% 50,00%<br />
Risk free interest rate (% pa) - - - - 2,27% 2,27%<br />
Dividend yields - - - - 1,56% 1,56%<br />
Rate of pre-vesting forfeiture (% pa) - - - - 0,00% 0,00%<br />
Rate of post-vesting forfeiture (% pa) - - - - 0,00% 0,00%<br />
Proportion who exercise given minimum gain achieved (% pa) - - - - 100,00% 100,00%<br />
Fair Value per granted instrument at the Grant date (€) - - - - 7,42 4,97<br />
Total fair value of the options granted (EUR thousands) - - - - 127 27<br />
Total 154<br />
Volatility is estimated on the basis of historical volatilities<br />
on 50 and 500 days.<br />
The cumulative impact of the stock option plan represents<br />
a cost of EUR 45 thousand (EUR 63 thousand in<br />
2009) calculated according to the Black & Scholes<br />
model and was charged to the income statement.<br />
34. FINANCIAL LIABILITIES<br />
Detail of financial liabilities<br />
in Eur ‘000’ 31/12/10 31/12/09 31/12/08<br />
Bank borrowings 72 856 65 873 62 105<br />
Bank overdrafts 1 746 3 889 4 301<br />
Sub-total bank borrowings 74 602 69 762 66 406<br />
Obligations under finance lease 4 480 4 568 2 351<br />
Treasury notes 1 000 - -<br />
Other financial commitments 871 735 1 101<br />
Sub-total other borrowings 6 351 5 303 3 452<br />
Total 80 953 75 065 69 858<br />
Of which:<br />
sub-total current (due for settlement within the year) 19 216 17 618 29 606<br />
Amount due for settlement in the 2nd year 4 401 5 613 10 014<br />
Amount due for settlement in the 3rd year 54 374 5 085 28 378<br />
Amount due for settlement in the 4th year 579 44 005 355<br />
Amount due for settlement in the 5th year and after 2 383 2 744 1 505<br />
Sub-total non-current: 61 737 57 447 40 252<br />
Total 80 953 75 065 69 858<br />
Borrowings due for settlement within the year in<br />
EUR 8 451 9 945 19 372<br />
USD 155 135 7 631<br />
Others 10 610 7 538 2 603<br />
Non-current borrowings in<br />
EUR 60 249 56 135 30 638<br />
USD 1 042 1 110 9 007<br />
Others 446 202 607
96<br />
<strong>Hamon</strong> Annual Report 2010<br />
Group bank borrowings as of 31 December 2010<br />
(EUR 74 602) are mainly related to the syndicated<br />
credit facility of 17 December 2009 which stands as<br />
follows as of 31 December 2010:<br />
Maturities<br />
in EUR ‘000’ original Available Margin vs 1 year 2 years 3 years<br />
amount amount EURIBOR<br />
Revolving credit facility 55 000 55 000 2,15% 55 000<br />
Term loan facility 20 000 15 000 1,90% 5 000 5 000 5 000<br />
Total 75 000 70 000 5 000 5 000 60 000<br />
At the signing date of this credit agreement, obtaining<br />
such credit lines with a maturity at 4 years was the result<br />
of an excellent negotiation with the bank syndicate<br />
compared to what was practiced at the time. The same<br />
can be said in terms of financing margins that to this day<br />
remain very competitive. Standard securities and<br />
undertakings have been granted to the bank syndicate<br />
as follow:<br />
■ The implementation of pledges on stock held in the<br />
main subsidiaries of the Group;<br />
■ The absence of pledges on assets to the profit of third<br />
parties;<br />
■ The absence of major investment and divestment;<br />
■ The disclosure of regular financial information;<br />
■ Non-occurrence of ‘MAC’ – material adverse changes<br />
or elements with a significant negative influence; and<br />
■ The limitation of payment of dividends to maximum<br />
33% of the distributable profit.<br />
Concerning financial covenants, this new syndicated<br />
credit facility (1) requires the compliance with the<br />
following ratios: Net Debt/EBITDA, Net Debt/Net Cash<br />
Interest Payable, Total Debt/Book Equity; a minimum<br />
contribution margin on new orders and (2) limits the<br />
amount of capital expenditures.<br />
The financing margins are subject to an increase if the<br />
Net Debt/EBITDA ratio is above 1 or 1,5.<br />
All those ratios are largely achieved by the Group.<br />
A Belgian treasury notes program has been signed on<br />
30 August 2010 with a first dealer. A second dealer<br />
joined him on 10 February 2011.<br />
The average cost of the debt was 4,68% for 2010,<br />
(6,92% for 2009) or 5,77% (8,67% in 2009) if the<br />
amortized refinancing costs of the credit lines are<br />
included in the analysis.<br />
The debt of the <strong>Hamon</strong> Group – with the exception of<br />
leasing debts – is using variable interest rate references.<br />
35. Trade and other payables<br />
in EUR ‘000’ 31/12/10 31/12/09 31/12/08<br />
Trade payables 55 183 44 787 49 425<br />
Amounts due to related parties 1 909 532 3 750<br />
Other advances received 2 760 1 732 298<br />
Social security and other payables 13 394 13 169 10 891<br />
Other (non income) tax payable 10 389 8 467 8 017<br />
Other current liabilities 2 530 3 046 2 124<br />
Accruals and deferred income 3 563 3 726 5 282<br />
Total 89 728 75 459 79 788<br />
Companies of the Group receive on average between 30 and 60 days of credit from their suppliers.
Part 3 - Financial Statements<br />
97<br />
36. Derivative instruments<br />
Derivative financial instruments designated as “cash flow hedge”<br />
Notional or Contractual amount<br />
Fair Value<br />
in EUR ‘000’ 31/12/10 31/12/09 31/12/08 31/12/10 31/12/09 31/12/08<br />
Forward currency contracts sales Assets 4 341 9 232 1 940 59 157<br />
Liabilities 748 (11) (241)<br />
Forward currency contracts purchases Assets<br />
Liabilities<br />
Interests rate swaps 35 000 (470)<br />
Options<br />
Embedded derivatives<br />
Total fair values 48 157 (711)<br />
Fair values recognized<br />
in the hedging reserves in Equity (16) (16) (692)<br />
The part of profit or loss on the hedging instrument that<br />
qualifies as an effective cash flow hedge is booked<br />
directly in equity, via the hedging reserves. The gain or<br />
loss relating to the ineffective portion is recognized in<br />
the income statement.<br />
The <strong>Hamon</strong> Group had negotiated, at the end of<br />
September 2007, two interest rate swaps (IRS) for a<br />
total sum of EUR 35.000 thousand. Those IRS hedged<br />
our Euro debt until 22 September 2009.<br />
As of 31 December 2010, the fair values of forward<br />
currency contracts designated as ‘cash flow hedge’<br />
have positive and negative fair values amounting<br />
respectively to EUR 59 thousand and EUR -11<br />
thousand. Those are hedges against the Korean<br />
Won (KRW) for a collection of USD 6.800 thousand<br />
(equivalent to EUR 5.089 thousand).<br />
Derivative financial instruments designated as “held for trading”<br />
notional or Contractual amount<br />
Fair Value<br />
in EUR ‘000’ 31/12/10 31/12/09 31/12/08 31/12/10 31/12/09 31/12/08<br />
Forward currency contracts sales Assets 240 2 461 21 669 34 287 422<br />
Liabilities 10 576 (23) (694)<br />
Forward currency contracts purchases Assets 230 2 171 3 843 1 12<br />
Liabilities (59) (192)<br />
Fair values recognized in the income statement<br />
under “Unrealized exchange gains” 35 287 434<br />
under “Unrealized exchange losses” (23) (59) (886)
98<br />
<strong>Hamon</strong> Annual Report 2010<br />
Forward currency contracts used to hedge the transactional<br />
risks on currencies are accounted as if they were held<br />
for trading.<br />
However, such forward currency contracts are only used<br />
to hedge existing transactions and commitments and are<br />
therefore not speculative by nature.<br />
The fair values were directly recognized in the income<br />
statement in unrealized exchange gains or losses.<br />
37. FINANCIAL INSTRUMENTS<br />
Financial Assets and Liabilities<br />
in EUR ‘000’ 31/12/10 31/12/09 31/12/08 Hierarchy of<br />
fair values<br />
Financial Assets<br />
Cash and cash equivalents 68 077 83 253 59 089 Niveau 1<br />
Available-for-sale financial assets 6 632 2 421 1 627 Niveau 2<br />
Loans and receivables 97 632 83 681 102 888 Niveau 2<br />
Derivative financial assets 16 230 14 309 62 886 Niveau 1<br />
188 571 183 664 226 490<br />
Financial Liabilities<br />
Borrowings at amortized cost 80 953 75 065 69 858 Niveau 1<br />
Other payables 66 551 56 569 58 181 Niveau 2<br />
Derivative financial liabilities 16 101 13 924 64 049 Niveau 1<br />
163 605 145 558 192 088<br />
Fair value and book value<br />
In order to show the importance of data’s used for the<br />
valuations of fair values, the Group classifies these<br />
valuations according to a hierarchy that includes the<br />
following levels:<br />
■ Level 1 fair value measurements are those derived<br />
from quoted prices (unadjusted) in active markets for<br />
identical assets or liabilities;<br />
■ Level 2 fair value measurements are those derived<br />
from inputs other than quoted prices included within<br />
Level 1 that are observable for the asset or liability,<br />
either directly (i.e. as prices) or indirectly (i.e. derived<br />
from prices); and<br />
■ Level 3 fair value measurements are those derived<br />
from valuation techniques that include inputs for the<br />
asset or liability that are not based on observable<br />
market data (unobservable inputs).<br />
Financial assets are mostly current. Their fair value thus<br />
does not differ from their book value. Their book value<br />
already takes into account possible provisions when the<br />
collection seems compromised. Available-for-sale<br />
financial assets are made on the one hand, of our share<br />
in GEI, valued at stock market price on 31 December,<br />
and on the other hand of investments in various small<br />
companies not quoted on the stock market and valued<br />
at their acquisition value. Their fair value is higher than<br />
their acquisition value but given the fact that the impact<br />
is minimal, no correction has been accounted for.<br />
Non-current financial liabilities were evaluated at<br />
amortized cost; which is net of transaction costs.<br />
Borrowings principally include the syndicated debt for<br />
which the fair value is comparable to the value in the<br />
accounts. “Other payables” are mainly trade payables<br />
for which the fair value does not differ from the book<br />
value due to its current nature.<br />
Financial instruments indicated in the table include<br />
Interest Rate Swaps (IRS) in 2008, and forward currency<br />
contracts. These last ones are included in this note on<br />
the asset and liability sides for their notional amount<br />
corrected by their fair value at the asset and liability<br />
side depending whether they are positive or negative.
Part 3 - Financial Statements<br />
99<br />
38. Risk management policies<br />
Management of foreign exchange risk<br />
Operations and international transactions of the Group,<br />
and in particular the construction contracts carried out<br />
in distant countries, are creating exposures to foreign<br />
exchange risks in the day-to-day management of its<br />
business. Foreign exchange risks can be defined as<br />
the risk of fluctuation in fair values of future cash flows<br />
due to the fluctuations in foreign currencies. The most<br />
significant foreign exchange risks of the Group are<br />
related to transactions in US dollars and <strong>English</strong><br />
pounds.<br />
Con<strong>version</strong> impacts for subsidiaries located outside of<br />
the Euro zone<br />
The accounts of entities located outside the Euro zone are<br />
converted into Euro in order to be incorporated in the<br />
consolidated accounts of the Group. The effects of the<br />
fluctuations in foreign currencies on the con<strong>version</strong> of net<br />
assets of those entities are recognized in the consolidated<br />
equity of the Group. For the calculation of the exposure to<br />
foreign exchange risks, the assumption has been made<br />
that the investments in the operational entities located<br />
outside the Euro zone are permanent and the reinvestment<br />
in these entities is continuous.<br />
Foreign exchange risk on financial assets and liabilities<br />
The Group uses different strategies to reduce its foreign<br />
exchange rate risk exposure, in particular:<br />
■ By trying to match its sale and purchases<br />
commitments in the same currencies;<br />
■ By strictly limiting the invoicing in currencies different<br />
from the functional currency of the entity;<br />
■ By reporting the foreign exchange rate risk exposures<br />
to the Corporate department, which after consolidation<br />
decides to hedge the net consolidated exposures with<br />
adequate financial instruments, in particular forward<br />
currency contracts.<br />
The following table presents for all the subsidiaries of<br />
the Group the consolidated financial assets and liabilities<br />
in currencies other than their functional currency as well<br />
as firm commitments in other currencies (contracts to<br />
be invoiced, signed orders) and finally, forward currency<br />
contracts that they have made to reduce their exposure<br />
to these currencies:<br />
31/12/10 31/12/09 31/12/08<br />
in EUR ‘000’ USD GBP Other TOTAL USD GBP Other TOTAL USD GBP Other TOTAL<br />
currencies currencies currencies<br />
Gross balance sheet exposure 45 961 6 615 1 958 54 534 414 121 1 152 1 687 (13 726) 1 217 4 233 (8 276)<br />
thereof financial assets 56 855 6 775 4 041 67 671 5 744 515 2 202 8 461 6 672 2 829 5 338 14 839<br />
thereof financial liabilities (10 894) (160) (2 083) (13 137) (5 330) (394) (1 050) (6 774) (20 398) (1 612) (1 105) (23 115)<br />
Gross exposure<br />
from firm commitments 28 038 - 10 867 38 905 7 494 - (838) 6 656 15 997 - 5 161 21 158<br />
Derivative<br />
financial instruments (7 531) - (8 604) (16 135) (10 540) - (1 021) (11 561) (14 532) - (5 234) (19 766)<br />
Net exposure 66 468 6 615 4 221 77 304 (2 632) 121 (707) (3 218) (12 261) 1 217 4 160 (6 884)<br />
+ for incoming flow / ( ) for outgoing flow<br />
The amount of financial assets in US dollar in 2010 has<br />
significantly increased compared to 2009 as the Group<br />
has made a legal reorganization in the United States.<br />
The main part of the derivatives that hedges the foreign<br />
exchange rate on US dollar are forward contracts,<br />
designated as ‘cash flow hedge’ (see note 36).
100<br />
<strong>Hamon</strong> Annual Report 2010<br />
in EUR ‘000’ 31/12/10 31/12/09 31/12/08<br />
Sensitivity to market rates<br />
% variation EUR 10% 10% 10%<br />
Impact on current year P&L 5 453 169 828<br />
Impact on future cash flows 7 730 17 812<br />
Compared to its closing rate, an appreciation/<br />
depreciation of the Euro of 10% against all currencies<br />
used by the Group would result in a positive/negative<br />
impact of EUR 5.453 thousand (before income taxes)<br />
on the income statement of the current year and EUR<br />
7.730 thousand on future financial flows after hedging.<br />
This calculation obviously refers to 31 December<br />
balance sheet items only.<br />
The impact of the EUR/USD exchange rate fluctuations<br />
on the 2010 results of the Group is explained in “year<br />
2010 review” (impact on revenues EUR +4.800<br />
thousand and on EBIT EUR +800 thousand).<br />
Management of interest rate risk<br />
Interest rate risk comes from the exposure of the Group to<br />
the fluctuations of interest rates and their possible impact<br />
on the cost of financing. Most of the cost of the Group’s<br />
debt is based on EURIBOR-3 months. It is the policy of the<br />
Group to limit its exposure to the interest rates volatility by<br />
using financial instruments which swap a variable interest<br />
rate into a fixed rate, in particular interest rate Swaps (IRS).<br />
The Group follows very closely the evolution of interest rates<br />
in order to continue to benefit from low short term rates<br />
without taking inconsiderate risks.<br />
The following table shows the debts of the Group (excluding<br />
refinancing costs) with a fixed interest rate and those with a<br />
variable interest rate:<br />
31/12/10 31/12/09 31/12/08<br />
in EUR ‘000’ Average rate Principal Average rate Principal Average rate Principal<br />
Fixed Rate Instrument<br />
Financial liabilities 7,02% 1 712 5,85% 2 137 6,82% 2 666<br />
Variable Rate Instrument<br />
Financial liabilities 4,63% 80 893 6,95% 74 527 8,99% 70 247<br />
4,68% 82 605 6,92% 76 664 8,91% 72 913<br />
in EUR ‘000’ 2010 2009 2008<br />
Sensitivity to market rate<br />
Change (in basis point) 30 220 180<br />
Impact on P&L 243 1 640 1 190<br />
IRS hedging effect (774)<br />
Net Profit or (loss) 243 1 640 416
Part 3 - Financial Statements<br />
101<br />
Calculation of the markets interest rate sensitivity is based<br />
on a hypothetical variation of 30 basis points on the<br />
reference market interest rate (comparable with the<br />
variation of the EURIBOR- 3 month over the year 2010).<br />
In the event of an increase or decrease of the market<br />
interest rates by 30 basis points, the gross impact on<br />
income would be EUR 243 thousand. The simulation done<br />
at the end of 2008 took into account interest rate swaps<br />
(see note 37).<br />
The finance costs of the Group are presented as follows<br />
(for more detail, see note 12):<br />
in EUR ‘000’ 31/12/10 31/12/09 31/12/08<br />
Interest on loans and bank overdrafts (3 720) (5 048) (6 384)<br />
Interest on finance leases (189) (184) (139)<br />
Total interest expenses (3 909) (5 232) (6 523)<br />
Costs related to anticipated reimbursement (690)<br />
Credit facilities transaction costs (amortized cost treatment under IFRS) (1 192) (1 362) (1 102)<br />
Foreign exchange losses on management of US debts (2 099)<br />
Other financing costs (460) (237) (180)<br />
Total other finance costs (1 652) (2 289) (3 381)<br />
Total (5 561) (7 521) (9 904)<br />
Financial assets as well as trade payables of the<br />
Group have generated negligible interest due to very<br />
low market interest rates.<br />
Management of credit risk<br />
Due to its construction activities, the Group is exposed to<br />
credit risks. However, credit risk is lesser than the one of<br />
more traditional constructions companies, as credit rating<br />
of most of the Group customers is very high since they<br />
are mainly large international Engineering & Contracting<br />
(EPC) groups or energy producers.<br />
Despite this positive situation, the Group has suffered<br />
from the bankruptcy of AE&E, resulting in a loss of EUR<br />
909 thousand.<br />
The customer risk materializes in the accounts as<br />
non-payment by a customer could lead to a write-off of<br />
the underlying receivable. When a receivable becomes<br />
doubtful, following suspension of payment or bankruptcy<br />
of a customer, the Group books a provision for doubtful<br />
receivable. If, thereafter, the receivable becomes uncollectible,<br />
a corresponding write-off is accounted for.<br />
The Group does not have significant concentration of<br />
credit risk since this risk is distributed over a large<br />
number of customers and counterparts around the world.<br />
The most important customer is a financially very strong<br />
American customer and accounts for 5% of the total<br />
trade receivables. When finalizing important contracts,<br />
the finance department carries out a credit analysis of<br />
the customer based on credit reports obtained from<br />
external companies.<br />
According to the financial risk profile of the customer,<br />
the Group will decide to cover or not its credit risk.<br />
Moreover, the Group takes particular measures for<br />
customers located in countries where the risk is<br />
significant. As credit risk solutions, the Group can,<br />
among others, requests the payment prior to delivery,<br />
irrevocable and confirmed (by our banks) letters of<br />
credits as well as credit insurance policies covering the<br />
residual risks (political, embargo...) and the risks of unfair<br />
calls on the bank guarantees.<br />
The following table presents an analysis of the<br />
financial receivables of the Group. They include the trade<br />
receivables and other receivables of the Group, with the<br />
exception of the non-financial receivables like tax assets.<br />
The amounts presented in the following table are the<br />
gross values of the receivables before any write-off for<br />
doubtful receivables.
102<br />
<strong>Hamon</strong> Annual Report 2010<br />
Monitoring of financial receivables<br />
in EUR ‘000’ TOTAL Due over Due Due Current Not due<br />
3 months 2-3 months 1-2 months<br />
As of 31 December 2010 97 632 8 940 3 083 8 972 44 171 32 465<br />
As of 31 December 2009 83 681 10 627 2 317 6 029 34 929 29 779<br />
As of 31 December 2008 103 801 14 429 3 399 7 506 45 375 33 092<br />
Payment terms with our customers are usually between 30<br />
and 60 days.<br />
Trade receivables with terms that have been renegotiated<br />
are not significant. The Group does not hold guarantees or<br />
other forms of credit enhancement on its receivables.<br />
Provisions for doubtful receivables have evolved, during the<br />
years 2010, 2009 and 2008, as follows<br />
in EUR ‘000’ 31/12/10 31/12/09 31/12/08<br />
Balance at beginning of the year (2 299) (2 227) (3 229)<br />
Amounts written off during the year (1 138) (629) (162)<br />
Amounts recovered during the year 49 58 483<br />
Other (forex, transfer,…) 30 499 681<br />
Balance at end of the year (3 358) (2 299) (2 227)<br />
Net impairment on receivable in P&L (1 090) (573) 199<br />
Liquidity Risk Management<br />
The Group’s liquidity risk is related to the capacity of the Group to respect its obligations with regard to its financial<br />
liabilities.<br />
in EUR ‘000’ 31/12/10 31/12/09 31/12/08<br />
Cash and cash equivalents 68 077 83 253 59 089<br />
Total liquidity 68 077 83 253 59 089<br />
Short term financial debt & current portion<br />
of long term financial debt (19 216) (17 618) (29 606)<br />
Long term financial debt (61 737) (57 447) (40 252)<br />
Total financial debt (80 953) (75 065) (69 858)<br />
Net liquidity (12 876) 8 188 (10 769)<br />
The Group has a revolving credit line with its bank pool<br />
in order to address possible short term treasury needs<br />
(see note 34). The following tables present the contractual<br />
due dates of the consolidated liabilities of the Group:
Part 3 - Financial Statements<br />
103<br />
Liquidity Risk Management 31/12/10<br />
in EUR ‘000’ TOTAL Due before De 6-12 Due 1-2 Due 2-5 Due over<br />
6 months months years years 5 years<br />
Bonds and treasury notes 1 000 1 000 - - - -<br />
Loans from banks 74 602 - 12 985 4 282 55 909 1 427<br />
Obligations under finance leases 4 480 406 330 440 1 367 1 937<br />
Other financial liabilities 871 - 411 205 255 -<br />
Trade and other Payables 66 551 64 387 2 080 73 10 -<br />
Derivative financial liabilities 34 - 34 - - -<br />
Total 147 538 65 793 15 840 5 000 57 541 3 364<br />
Liquidity Risk Management 31/12/09<br />
in EUR ‘000’ TOTAL Due before De 6-12 Due 1-2 Due 2-5 Due over<br />
6 months months years years 5 years<br />
Bonds and treasury notes - - - - - -<br />
Loans from banks 69 762 - 16 273 5 164 47 956 369<br />
Obligations under finance leases 4 568 487 487 402 992 2 200<br />
Other financial liabilities 735 - 371 47 142 175<br />
Trade and other Payables 56 569 49 989 305 1 284 4 991 -<br />
Instruments financiers dérivés 59 - 59 - - -<br />
Total 131 693 50 476 17 495 6 897 54 081 2 744<br />
Liquidity Risk Management 31/12/08<br />
in EUR ‘000’ TOTAL Due before De 6-12 Due 1-2 Due 2-5 Due over<br />
6 months months years years 5 years<br />
Bonds and treasury notes - - - - - -<br />
Loans from banks 66 406 1 808 27 133 9 368 28 097 -<br />
Obligations under finance leases 2 351 263 280 458 678 672<br />
Other financial liabilities 1 101 - 122 188 336 456<br />
Trade and other Payables 51 497 48 937 414 2 136 10 -<br />
Instruments financiers dérivés 1 163 - 1 163 - - -<br />
Total 122 519 51 008 29 112 12 150 29 121 1 128<br />
39. Guarantees on the Group’s assets<br />
The following table shows the Group’s assets which have guarantees attached.<br />
The guaranteed financial assets are principally restricted bank accounts and buildings located in Korea and several<br />
guarantees on the assets of our Indian subsidiary <strong>Hamon</strong> Shriram Cottrell. The Group now consolidates according<br />
to the global method, all guarantees provided to this subsidiary (see note 15).<br />
in EUR ‘000’ 31/12/10 31/12/09 31/12/08<br />
Inventories 310 - -<br />
Intangible assets - - -<br />
Property, plant & equipment 7 753 6 023 979<br />
Financial Assets 15 378 2 654 2 931<br />
Total 23 441 8 678 3 910
104<br />
<strong>Hamon</strong> Annual Report 2010<br />
In the framework of the new syndicated credit facility<br />
signed in December 2009, pledges on the shares held<br />
in the main subsidiaries of the Group have been granted<br />
to the bank syndicate, as for the previous credit facility<br />
(see note 35).<br />
40. Finance and operating lease agreements<br />
Finance lease agreements<br />
The main finance lease contracts relate to land and<br />
buildings in Belgium, France and North America and<br />
denominated respectively in Euros and US dollars.<br />
During the year 2010, <strong>Hamon</strong> has concluded additional<br />
“sales and lease back” agreements on machinery and<br />
equipment for an amount of EUR 649 million and for a<br />
length of 5 years.<br />
Less significant leases are in place for vehicles and office<br />
equipment.<br />
The commitments of the Group in terms of finance lease for<br />
the years to come can be resumed as follows:<br />
in EUR ‘000’ minimum lease payments Present value of minimum lease payments<br />
31/12/10 31/12/09 31/12/08 31/12/10 31/12/09 31/12/08<br />
Amounts due for finance leases<br />
within one year 898 926 641 736 974 543<br />
in the second to fifth years inclusive 2 673 2 699 1 429 2 249 1 394 1 136<br />
after more than 5 years 1 697 1 823 715 1 495 2 200 672<br />
Sub-total 5 268 5 448 2 785 4 480 4 568 2 351<br />
Less: future finance charges (788) (880) (434) N/A N/A N/A<br />
Present value of lease obligations 4 480 4 568 2 351 4 480 4 568 2 351<br />
Less: Amounts due for settlement<br />
within one year (736) (974) (543)<br />
Non-current finance leases debts 3 744 3 594 1 808<br />
The average lease term for the obligations on finance lease is 9,1 years. The average interest rate is 6,14%. The fair value<br />
of these finance leases is close to its nominal value.<br />
Operating lease agreements<br />
The commitments taken by the Group for operating leases for future years are as follows:<br />
in EUR ‘000’ 31/12/10 31/12/09 31/12/08<br />
Minimum lease payments under operating<br />
leases recognized as an expense during the year 4 551 3 793 3 831<br />
Minimum lease payments due for operating leases<br />
within one year 4 613 2 914 2 885<br />
in the second to fifth years inclusive 9 747 8 105 8 744<br />
after more than five years 210 211 1 099<br />
Total 14 570 11 230 12 728<br />
Operating leases mainly relate to offices and to a lesser extent, vehicles, machines and office equipment.
Part 3 - Financial Statements<br />
105<br />
The increase in commitments compared to last year is<br />
mainly explained by:<br />
■ the lease of a new building located next to the Group<br />
headquarter in Mont-Saint-Guibert for our Belgian<br />
Subsidiary <strong>Hamon</strong> Research Cottrell, representing a<br />
commitment of EUR 732 thousand;<br />
■ the roll over of a lease contract for the French subsidiary<br />
<strong>Hamon</strong> D’Hondt for a commitment of EUR 1.200<br />
thousand as its finance lease agreement for the building<br />
was coming to an end;<br />
■ the lease commitments for new Chinese, German and<br />
South-African subsidiaries amounting to EUR 1 400;<br />
■ the depreciation of the Euro during the past year resulting<br />
in an increase of commitments taken in other currencies.<br />
41. Commitments<br />
As part of its business, the Group is often required to<br />
issue guarantees in favor of customers for the reimbursement<br />
of advance payments, the correct execution<br />
of contracts or obligations of technical guarantees.<br />
Some of these commitments require bank guarantees<br />
or insurance bonds to be provided by the Group:<br />
in EUR ‘000’ 31/12/10 31/12/09 31/12/08<br />
Documentary credit / SBLC import 3 370 - -<br />
Bank guarantees 89 291 91 942 69 843<br />
Insurance bonds 39 851 35 843 2 479<br />
Total 132 512 127 786 72 328<br />
The total amount of outstanding bank guarantees is<br />
relatively stable as of 31 December 2010 compared to<br />
31 December 2009. The volume of bank guarantees<br />
issued is logically closely linked to the Group activity.<br />
The line available for letters of credit and bank guarantees<br />
under the syndicated credit line amounts to EUR<br />
200.000 thousand. Moreover, the Group also has at its<br />
disposal a “U.S. bonds” line of USD 50.000 thousand.<br />
The Group has also opened documentary credits and<br />
SBLC Import in order to improve payment conditions with<br />
some of its suppliers (total commitments for EUR 3.370<br />
thousand as of 31 December 2010).<br />
The Group has also endorsed commitments relating to<br />
companies sold (FBM, BFT), bankrupt (HRCI) or<br />
associated companies (OHL) as follows:<br />
in EUR ‘000’ 31/12/10 31/12/09 31/12/08<br />
Commitment of good project execution 482 - 8 685<br />
Comfort letters to banks 3 070 2 110 2 110<br />
Comfort letters to suppliers 4 080 4 080 4 080<br />
Total 7 632 6 190 14 876<br />
The commitments for which payment is probable are recorded as liabilities.
106<br />
<strong>Hamon</strong> Annual Report 2010<br />
42. Contingent liabilities<br />
No new significant litigation occurred in 2010.<br />
Bankruptcy of <strong>Hamon</strong> Research-Cottrell Italia (HRCI)<br />
The General Assembly of HRCI decided to put this<br />
company into voluntary liquidation in April 2005. In June<br />
2005, the liquidator filed the books at the commercial<br />
court of Milan. An agreement was signed between<br />
<strong>Hamon</strong> and the bankruptcy administrator of HRCI in<br />
July 2008.<br />
FBM Hudson Italiana<br />
The Italian company FBM Hudson Italiana Spa, sold<br />
by <strong>Hamon</strong> Group in December 2005, has initiated<br />
proceedings against its former directors. That company<br />
claimed indemnities for an amount of approximately EUR<br />
14 million for an alleged overstatement of the net assets.<br />
<strong>Hamon</strong> considers this complaint to be unfounded<br />
because of the absence of any prejudice for the<br />
company and given the fact that the annual accounts<br />
of the company had been approved by the shareholders’<br />
meeting composed by the new shareholders of the<br />
company.<br />
Asbestos<br />
The Group is involved in various proceedings for<br />
physical injuries related to asbestos. These litigations<br />
relate to a period prior to the acquisition by the Group in<br />
1998 of the assets of Research Cottrell, Inc. Asbestos<br />
is not used in the operations of <strong>Hamon</strong> in the USA. In<br />
the acquisition agreements of 1998, the seller committed<br />
itself to compensate the Group for all damages<br />
sustained because of such proceedings. The costs of<br />
these proceedings are, until now, exclusively handled by<br />
the seller. Insofar as these proceedings go back to a<br />
period prior to the acquisition of the US subsidiaries of<br />
the Group and taking into account the compensation<br />
clause, <strong>Hamon</strong>’s management thinks that these do not<br />
present risks of significant liability for the Group.<br />
Other litigations<br />
The nature of the Group’s activities leads us to file/<br />
receive complaints about/from our suppliers and our<br />
customers. The complaints are covered by specific<br />
provisions from the moment that payouts are probable<br />
and where their amount can be reliably estimated.<br />
The Group believes that these complaints will not have<br />
globally a significant impact on <strong>Hamon</strong>’s financial<br />
situation.<br />
43. Related parties<br />
The ultimate mother company of the Group is Sopal<br />
International SA. See note 30 for detailed structure<br />
of the shareholders of the Group.<br />
The transactions between the Company and its<br />
subsidiaries, which are related parties of the Company,<br />
have been eliminated from the consolidated accounts<br />
and are not considered in this note.
Part 3 - Financial Statements<br />
107<br />
Details of the transactions between the Company and the other related parties are detailed below:<br />
Income statement as of 31/12/10<br />
in EUR ‘000’ Purchases Revenue<br />
of goods of services lease management of goods of services royalties Capital<br />
of assets fees gains<br />
Controlling shareholder and<br />
other entities directly and indirectly<br />
controlled by the controlling shareholder 51 - 55 94 317 - - 1 781<br />
Other shareholders with significant influence - - - 19 94 - 452 -<br />
Associate - 163 - - - 21 - -<br />
Other related parties - - - - - - - -<br />
Balance sheet as of 31/12/10<br />
in EUR ‘000’ Non-current assets Current assets Non-current liabilities Current liabilities<br />
Controlling shareholder and<br />
other entities directly and indirectly<br />
controlled by the controlling shareholder - 654 - 893<br />
Other shareholders with significant influence - 410 - 470<br />
Associates - 687 119 1 239<br />
Other related parties - - - -<br />
Income statement as of 31/12/09<br />
in EUR ‘000’ Purchases Revenue<br />
of goods of services lease management of goods of services royalties Capital<br />
of assets fees gains<br />
Controlling shareholder and<br />
other entities directly and indirectly<br />
controlled by the controlling shareholder 99 - 82 75 710 8 - -<br />
Other shareholders with significant influence 5 - - 10 50 350 -<br />
Associates - 36 - - - 25 - -<br />
Other related parties - - - - - - - -<br />
Balance sheet as of 31/12/09<br />
in EUR ‘000’ Non-current assets Current assets Non-current liabilities Current liabilities<br />
Controlling shareholder and<br />
other entities directly and indirectly<br />
controlled by the controlling shareholder - 267 - 257<br />
Other shareholders with significant influence - 677 - 13<br />
Associates - 118 - 262<br />
Other related parties - - - -
108<br />
<strong>Hamon</strong> Annual Report 2010<br />
During the last two years, no write-off was accounted<br />
for on receivables with the related parties. The other<br />
entities directly or indirectly controlled by the controlling<br />
shareholder are the following companies:<br />
■ Gefimco SA;<br />
■ Cogim NV;<br />
■ Promo Services (Belgium) SA;<br />
■ Cofragim;<br />
■ AIT;<br />
■ BFT – since 1 July 2010.<br />
The 2010 income statement include a capital gain of<br />
EUR 1.781 thousands made on the sale of BFT to AIT.<br />
The Group has not issued any guarantees or off balance<br />
sheet commitments to related parties other than<br />
commitments towards associates, as described in note<br />
34. The sales and purchase of goods with those related<br />
parties are made under the standard terms and conditions<br />
of the Group.<br />
Relations with related parties mostly include commercial<br />
relations (purchase/sale of goods and services, payment<br />
of management fees to shareholders, office space rental).<br />
44. Management compensation<br />
The table below details the remuneration (cumulative<br />
and including charges) of the Managing Director and<br />
the management team, who should be regarded as the<br />
‘key executives’ in the sense of the IAS 24 definition<br />
(these amounts include the social security charges born<br />
by the employer).<br />
in EUR ‘000’ 2010 (3) 2009 (2) 2008 (1)<br />
Short term benefits<br />
Fixed remuneration 3 477 3 051 3 006<br />
Variable remuneration 2 842 3 150 2 954<br />
Subtotal 6 319 6 201 5 960<br />
Long term benefits 340 361 310<br />
Total 6 659 6 562 6 270<br />
(1) In July 2008, the Executive Committe was reduced to 8 members (retirement of Jean Gilbert); a 9th member joined it in December (René Robert);<br />
this corresponded to 8.6 full-time equvalents<br />
(2) Full time quivalent of 8 persons in 2009<br />
(3) Full time quivalent of 8,25 persons in 2010<br />
The total of gross emoluments granted to the non<br />
executive directors during the year 2010 amounts to<br />
EUR 240 thousand (EUR 238 thousand during the<br />
previous year). These emoluments are dependant<br />
of the approval of the Annual General Assembly of<br />
Shareholders. There was no profit sharing allocation<br />
and the Company has not made any loans to the<br />
directors. The directors have also not made any special<br />
or unusual transactions with the Company.
Part 3 - Financial Statements<br />
109<br />
45. Staff<br />
Charges and costs of the personnel are presented under note 9.<br />
The distribution of personnel within the Group by segment is as follows:<br />
Average headcount per BU 2010 2009 2008<br />
Cooling Systems 547 482 432<br />
Process Heat Exchangers 161 174 170<br />
Air Pollution Control EMEA/Brazil 220 172 112<br />
Air Pollution Control NAFTA 124 147 175<br />
Chimneys 53 56 63<br />
Corporate & Others 116 109 63<br />
Total 1 221 1 140 1 015<br />
The main variations are coming from the following<br />
Business Units:<br />
■ Cooling Systems, following the increase of our site/<br />
field teams in England (+ 13 people), the strong<br />
growth of our activities in Asia (mainly in India) and<br />
the development of our Dry Cooling team in Europe<br />
and China.<br />
■ Process Heat Exchangers, due to the disposal of our<br />
subsidiary BFT at the end of June 2010.<br />
■ Air Pollution Control EMEA/Brazil, as a result of<br />
the acquisition of Enviroserv (Germany) and J&C<br />
(South Africa) in April and October 2010 (+30<br />
people) and the consolidation of our activity in China<br />
for a full year (6 months in 2009).<br />
■ Air Pollution Control NAFTA mainly in TTC;<br />
consequence of the temporary slow down of our<br />
activities in North America.<br />
46. Significant grants and State aids received<br />
Significant grants and State aids received by the main<br />
subsidiaries of the Group in 2010 amounts to EUR 883<br />
thousands. They include:<br />
■ Research tax credits (“Crédit d’impôt recherche” - CIR)<br />
obtained in 2010 by subsidiaries in France and the<br />
United States; included in “income taxes’ in the income<br />
statement (note 13).<br />
■ A reduction of tax withheld on salaries for two<br />
subsidiaries due to their R&D activities, accounted for<br />
as a reduction of research & development costs.<br />
■ A financial aid from the Walloon Region in the start-up<br />
and operating costs (1st year) of a representative office<br />
of <strong>Hamon</strong> & Cie in Bahrain, allowing to reduce general<br />
and administrative costs.<br />
47. Events after the balance sheet date<br />
Nihil<br />
48. Auditor’s fees<br />
For the entire consolidated Group, the fees paid to the<br />
auditor and its network (Deloitte) for 2010 amounted to<br />
EUR 1 018 212 and are broken down as follows:<br />
EUR<br />
■ Fees linked to financial statements audit : 820.150<br />
■ Other certication missions : 7.500<br />
■ Legal missions : 4.300<br />
■ Tax assistance missions : 145.861<br />
■ Other assistance : 40.401<br />
1.018.212
110<br />
<strong>Hamon</strong> Annual Report 2010<br />
7. Statutory auditor’s report on the consolidated financial statements<br />
for the year ended 31 December 2010 to the shareholders’ meeting<br />
To the shareholders<br />
As required by law and the company’s articles of<br />
association, we are pleased to report to you on the<br />
audit assignment which you have entrusted to us.<br />
This report includes our opinion on the consolidated<br />
financial statements together with the required<br />
additional comment.<br />
Unqualified audit opinion on the consolidated<br />
financial statements<br />
We have audited the accompanying consolidated<br />
financial statements of <strong>Hamon</strong> & Cie (International) SA<br />
(the “company”) and its subsidiaries (jointly the “group”),<br />
prepared in accordance with International Financial<br />
Reporting Standards as adopted by the European<br />
Union and with the legal and regulatory requirements<br />
applicable in Belgium. Those consolidated financial<br />
statements comprise the consolidated balance sheet<br />
as at 31 December 2010, the consolidated income<br />
statement, the consolidated statement of<br />
comprehensive income, the consolidated statement<br />
of changes in equity and the consolidated cash flow<br />
statement for the year then ended, as well as the<br />
summary of significant accounting policies and other<br />
explanatory notes. The consolidated balance sheet<br />
shows total assets of 336.856 (000) EUR and the<br />
consolidated income statement shows a consolidated<br />
profit (group share) for the year then ended of<br />
11.631 (000) EUR.<br />
The board of directors of the company is responsible<br />
for the preparation of the consolidated financial<br />
statements. This responsibility includes among other<br />
things: designing, implementing and maintaining<br />
internal control relevant to the preparation and fair<br />
presentation of consolidated financial statements that<br />
are free from material misstatement, whether due to<br />
fraud or error, selecting and applying appropriate<br />
accounting policies, and making accounting estimates<br />
that are reasonable in the circumstances.<br />
Our responsibility is to express an opinion on these<br />
consolidated financial statements based on our audit.<br />
We conducted our audit in accordance with legal<br />
requirements and auditing standards applicable in<br />
Belgium, as issued by the “Institut des Réviseurs<br />
d’Entreprises/Instituut van de Bedrijfsrevisoren”. Those<br />
standards require that we plan and perform the audit to<br />
obtain reasonable assurance whether the consolidated<br />
financial statements are free from material misstatement.<br />
In accordance with these standards, we have performed<br />
procedures to obtain audit evidence about the amounts<br />
and disclosures in the consolidated financial statements.<br />
The procedures selected depend on our judgment,<br />
including the assessment of the risks of material<br />
misstatement of the consolidated financial statements,<br />
whether due to fraud or error. In making those risk<br />
assessments, we have considered internal control<br />
relevant to the group’s preparation and fair presentation<br />
of the consolidated financial statements in order to
Part 3 - Financial Statements<br />
111<br />
design audit procedures that are appropriate in the<br />
circumstances but not for the purpose of expressing an<br />
opinion on the effectiveness of the group’s internal<br />
control. We have assessed the basis of the accounting<br />
policies used, the reasonableness of accounting<br />
estimates made by the company and the presentation<br />
of the consolidated financial statements, taken as a<br />
whole. Finally, the board of directors and responsible<br />
officers of the company have replied to all our requests<br />
for explanations and information. We believe that the<br />
audit evidence we have obtained provides a reasonable<br />
basis for our opinion.<br />
In our opinion, the consolidated financial statements<br />
give a true and fair view of the group’s financial position<br />
as of 31 December 2010, and of its results and its cash<br />
flows for the year then ended, in accordance with<br />
International Financial Reporting Standards as adopted<br />
by the EU and with the legal and regulatory requirements<br />
applicable in Belgium.<br />
additional comment which does not change the scope<br />
of our audit opinion on the consolidated financial<br />
statements:<br />
The directors’ report on the consolidated financial<br />
statements includes the information required by law<br />
and is in agreement with the consolidated financial<br />
statements. However, we are unable to express an<br />
opinion on the description of the principal risks and<br />
uncertainties confronting the group, or on the status,<br />
future evolution, or significant influence of certain<br />
factors on its future development. We can, nevertheless,<br />
confirm that the information given is not in obvious<br />
contradiction with any information obtained in the<br />
context of our appointment.<br />
Diegem, 1 March 2011<br />
The statutory auditor<br />
Additional comment<br />
The preparation and the assessment of the information<br />
that should be included in the directors’ report on the<br />
consolidated financial statements are the responsibility<br />
of the board of directors.<br />
Our responsibility is to include in our report the following<br />
DELOITTE Bedrijfsrevisoren / Reviseurs d’Entreprises<br />
BV o.v.v.e. CVBA / SC s.f.d. SCRL<br />
Represented by Laurent Boxus
112<br />
<strong>Hamon</strong> Annual Report 2010<br />
8. Statutory accounts of <strong>Hamon</strong> & Cie (International) SA<br />
Summarized balance sheet as of 31 December, after appropriation<br />
The statutory accounts of the parent company, <strong>Hamon</strong><br />
& Cie (International) S.A., are presented below in a<br />
summarized form. The Management Report and<br />
statutory accounts of <strong>Hamon</strong> & Cie (International) S.A.,<br />
as well as the Audit Report, will be filed at the National<br />
Bank of Belgium once approved by the Annual General<br />
Meeting of shareholders of 26 April 2011, in accordance<br />
with Clauses 98, 100, 101 and 102 of the Companies<br />
Code published on 6 August 1999.<br />
These reports are available, on request,<br />
at the Company’s address:<br />
Rue Emile Francqui 2<br />
1435 Mont-St-Guibert<br />
Belgium.<br />
The Auditor has issued an unqualified opinion on the<br />
2010 annual accounts of <strong>Hamon</strong> & Cie (International) SA.<br />
in EUR ‘000’ 31/12/10 31/12/09 31/12/08<br />
Fixed assets 190 266 95 131 91 173<br />
I. Formation expenses 2 826 3 931 3 587<br />
II. Intangible assets 1 572 1 163 642<br />
III. Tangible assets 375 517 678<br />
IV. Financial assets 185 493 89 520 86 266<br />
Current assets 17 716 14 291 26 061<br />
VI. Stock and contracts in progress 0 0 3 542<br />
VII. Amounts receivable within one year 17 407 13 546 21 990<br />
VIII. Short term deposits 0 0 0<br />
IX. Cash at bank and in hands 87 498 139<br />
X. Deferred charges and accrued income 222 247 389<br />
Total assets 207 982 109 422 117 234<br />
Equity 139 465 41 263 40 209<br />
I. Capital 2 157 2 157 2 157<br />
II. Share premium account 15 360 15 360 15 360<br />
IV. Reserves 11 569 11 569 11 569<br />
V. Profit carried forward 110 378 12 176 11 122<br />
Provisions and deferred taxes 0 0 5<br />
Amounts payable 68 517 68 159 77 020<br />
VIII. Amounts payable after more than one year 50 657 41 736 30 934<br />
IX. Amounts payable within one year 17 738 26 197 45 644<br />
X. Accrued charges and deferred income 122 226 442<br />
Total liabilities and equity 207 982 109 422 117 234
Part 3 - Financial Statements<br />
113<br />
Summarized income STATEMENT AS OF 31 DECEMBER<br />
in EUR ‘000’ 2010 2009 2008<br />
I. Operating revenues 10 278 10 720 10 742<br />
A. Turnover 10 264 10 567 10 416<br />
D. Other operating revenues 14 153 326<br />
II. Operating expenses (-) 11 538 10 476 9 881<br />
A. Cost of materials 0 0 522<br />
B. Services and other goods 5 438 4 873 4 515<br />
C. Remuneration, social security and pension costs 4 202 3 525 3 138<br />
D. Depreciation and amortization 1 680 1 972 1 578<br />
F. Increase (decrease) in provisions for liabilities & charges 0 (5) (13)<br />
G. Other operating expenses 218 111 141<br />
III. Operating income (1 260) 244 861<br />
IV. Financial income 24 534 11 587 16 779<br />
V. Financial expenses (5 687) (6 266) (7 487)<br />
VI. Net operating income before taxes 17 587 5 565 10 153<br />
VII. Extraordinary income 87 905 2 900 4 929<br />
VIII. Extraordinary expenses (2 975) (3 095) (139)<br />
IX. Net income before taxes 102 517 5 370 15 221<br />
X. Income taxes 0 0 (0)<br />
XI. Net income 102 517 5 370 15 221
114<br />
<strong>Hamon</strong> Annual Report 2010<br />
Annexures<br />
Key performance indicators<br />
(Health & Safety and Environment)<br />
Health and safety<br />
For the first time, this issue of our annual report<br />
contains information on the frequency and severity of<br />
accidents, etc. In the absence of previous references,<br />
we have set out the parameters according to the<br />
geographical zones. The members of staff of the<br />
companies in the perimeter under examination (see<br />
Report parameters at the end of this annual report) are<br />
the same as those accounted for in the breakdown of<br />
staff numbers (see Staff section).<br />
Frequency rates of occupational accidents<br />
by region in 2010 (no. accidents / million<br />
working hours)<br />
In 2010, there was a total of 22 occupational accidents<br />
in the 17 subsidiaries examined, none of which were<br />
fatal. The high incidence rates in Europe and Africa<br />
were due to the fact that the subsidiaries examined are<br />
responsible for more industrial and worksite activities,<br />
where there is more risk of accidents.<br />
The frequency rates of occupational accidents in 2010<br />
were as follows:<br />
■ Europe: 17,8<br />
■ USA: 12,3<br />
■ Asia: 1,3<br />
■ Africa: 31,0<br />
■ Group average: 11,0<br />
Rate of severity of occupational accidents<br />
by region in 2010 (no. days lost / thousand<br />
working hours)<br />
The rates of severity of occupational accidents by<br />
region in 2010 were as follows:<br />
■ Europe: 0,31<br />
■ USA: 0<br />
■ Asia: 0<br />
■ Africa: 0<br />
■ Group average: 0,10
Annexures<br />
115<br />
In total, 209 days of work were lost because of occupational<br />
accidents. The high figure in Europe is due,<br />
among other things, to one accident which involved 114<br />
days of leave.<br />
Rate of occupational illness by region in 2010<br />
(no. days lost / thousand working hours)<br />
The rates of occupational illnesses by region in 2010<br />
were as follows:<br />
■ Europe: 0,73<br />
■ USA: 0<br />
■ Asia: 0<br />
■ Africa: 0<br />
■ Group average: 0,25<br />
In total, 493 days of work were lost because of occupational<br />
illnesses, in our factory in the north of France.<br />
This is mainly due to the fact that some illnesses, such<br />
as muscular pains, are considered to be occupational<br />
illnesses, which would not necessarily be the case in<br />
other countries.<br />
Number of days of work lost due to occupational<br />
accidents and illnesses in 2010<br />
The number of days of work lost due to occupational<br />
accidents and illnesses in 2010 was as follows:<br />
■ Europe: 700<br />
■ USA: 1<br />
■ Asia: 1<br />
■ Africa: 0<br />
In total, 702 days of work were lost because of occupational<br />
accidents and illnesses, the majority of which<br />
were in our European factories.<br />
Rate of absenteeism in 2010<br />
The rates of absenteeism in 2010 were:<br />
■ Europe: 5,7%<br />
■ USA: 1,6%<br />
■ Asia: 0%<br />
■ Africa: 0,8%<br />
■ Group average: 3,1%<br />
Note: the rate of absenteeism also includes occupational<br />
accidents and illnesses (see exact definitions of Health<br />
& Safety data in the Report parameters section).<br />
In addition to the days lost due to occupational accidents<br />
and illnesses, 6 156 working days were lost due<br />
to other illnesses. The majority of these days (5 434)<br />
were lost in the European subsidiaries examined, due<br />
among others to several people on long-term sick leave.<br />
The figure stands at zero in the Asian subsidiaries<br />
examined as the staff holidays include a certain quota<br />
for potential sick leave. Providing that this quota is not<br />
exceeded, the sick days are not included in the<br />
statistics, which means that the figures are not always<br />
comparable from one region to another.<br />
We intend to improve the study of the causes of these<br />
accidents, illnesses, and absences and to take the<br />
necessary measures to reduce them.<br />
Environment<br />
As a first step, we decided to measure some of the<br />
parameters, which we consider to be the most pertinent<br />
for the seven (out of eight) factories and workshops of<br />
the Group that we analyzed (see the section Report<br />
parameters).<br />
Direct energy consumption by source and<br />
electricity consumption in 2010<br />
Energy consumption in 2010 was as follows:<br />
■ Electricity: 32 035 GJ/yr<br />
■ Natural gas: 15 653 GJ/yr<br />
■ Oil: 436 GJ/yr<br />
■ Propane: 146 GJ/yr<br />
■ Total: 48 270 GJ/yr<br />
This energy was mainly used in our production<br />
processes: thermoforming of exchange surfaces<br />
and extruding of certain compounds for our cooling<br />
systems, etc.<br />
Total volume of water extracted by source<br />
in 2010<br />
The total volume of water extracted by source in 2010<br />
was as follows:<br />
■ City water: 14 207 m³<br />
■ Other sources: 0 m³<br />
Water is mainly used for purposes related to personal<br />
use; in some cases, water is also used to cool production<br />
machines.<br />
At a later date, we aim to:<br />
■ Undertake a more in-depth analysis of consumption<br />
levels, to establish ratios for the volume of activity.<br />
■ Establish an internal benchmarking system to bring<br />
the performance levels of the less efficient sites in<br />
line with those of the better performing sites.<br />
■ Extend the list of performance indicators and the list<br />
of entities analyzed to include the main offices.
116<br />
<strong>Hamon</strong> Annual Report 2010<br />
Report parameters<br />
For the first year, our annual report contains a section<br />
on Corporate Social Responsibility, including some key<br />
performance indicators recommended by the G3<br />
directives of the GRI. This section provides more<br />
information on which basis this work was carried out.<br />
Scope and frequency of the report<br />
This annual report covers the 2010 fiscal year, namely the<br />
period from 1 January to 31 December 2010. By way of<br />
comparison, many of the tables provide the information for<br />
the previous fiscal year. This report is published on an<br />
annual basis. The previous report published was the 2009<br />
annual report. <strong>Hamon</strong>’s recent annual reports are available<br />
on our website, see www.hamon.com.<br />
Perimeter<br />
For the section on Corporate Social Responsibility, the<br />
majority of the key indicators cover the Group’s 19 main<br />
subsidiaries (based on the number of staff), taken at 100%<br />
and over the twelve months of the 2010 fiscal year.<br />
Together, these 19 subsidiaries represent 82% of the<br />
average workforce within the Group in 2010.<br />
In the section on Environmental Responsibilities we cover<br />
the subsidiaries with the greatest impact on the environment,<br />
namely those with a factory or a workshop.<br />
Seven factories and workshops are included, which is all<br />
those belonging to the Group with the exception of ACS in<br />
Belgium. It was not possible to source information from this<br />
subsidiary as it is undergoing some restructuring.<br />
For more information, see the table below detailing the<br />
subsidiaries examined for each key indicator in the<br />
Corporate Social Responsibility section.<br />
For financial information, see the list of consolidated<br />
entities in note 5 of the financial section.<br />
Subsidiary included in Country Kind Hours of Injury Injury Disease No of Absenteeism Energy . Water . Ethics<br />
the perimeter (CSR) training frequency gravity gravity days rate consump- consumprate<br />
rate rate lost tion (1) tion (1)<br />
<strong>Hamon</strong> & Cie (International) SA Belgium Offices x x x x x x x<br />
<strong>Hamon</strong> Custodis Inc. USA Offices x x x x x x x<br />
<strong>Hamon</strong> DGE (Shanghai) Co. Ltd China Offices x x x x x x x<br />
<strong>Hamon</strong> D’Hondt SA France Plant x x x x x x x x x<br />
<strong>Hamon</strong> Environmental GmbH Germany Offices x x x x x x x<br />
<strong>Hamon</strong> Enviroserv GmbH Germany Offices x x x x x x x<br />
<strong>Hamon</strong> J&C Engineering Pty Ltd South Africa Workshop x x x x x x x x x<br />
<strong>Hamon</strong> Research-Cottrell SA Belgium Offices x x x x x x x<br />
<strong>Hamon</strong> Research-Cottrell do Brasil Brazil Offices x<br />
<strong>Hamon</strong> Research-Cottrell Inc. USA Offices x x x x x x x<br />
<strong>Hamon</strong> (South Africa) (Pty) Ltd South Africa Offices x x x x x x x<br />
<strong>Hamon</strong> Thermal Europe SA Belgium Offices x x x x x x x<br />
<strong>Hamon</strong> Thermal Europe (France) SA France Offices + plant x x x x x x x x x<br />
<strong>Hamon</strong> Thermal Germany GmbH Germany Offices x x x x x x x<br />
<strong>Hamon</strong> Shriram Cottrell PVT Ltd India Offices + plant x x x x x x x x x<br />
<strong>Hamon</strong> Thermal & Environmental<br />
Technology (Jiaxing) Co. Ltd China Plant x x x x x x x x x<br />
<strong>Hamon</strong> UK Ltd Great-Britain Offices x<br />
TS Filtration (Shanghai) Co. Ltd China Workshop x x x x x x x x x<br />
Thermal Transfer Corporation USA Plant x x x x x x x x x<br />
x = included in the analyzed perimeter<br />
(1) Plants and workshops only
Annexures<br />
117<br />
Changes to the scope of the report<br />
Compared to the previous fiscal year, there were some<br />
changes to the scope of financial consolidation in the<br />
report (see notes 5 and15 of the financial section).<br />
As the impact of these changes is limited, we do not<br />
have “pro forma” accounts for the previous fiscal years<br />
based on the same perimeter of consolidation as in 2010.<br />
It should also be pointed out that some entities which<br />
entered into or left the consolidation perimeter in 2010<br />
are consolidated for only a part of the fiscal year 2010.<br />
For the entities added to the consolidation perimeter<br />
in 2010, their impact is detailed in note 15. Changes<br />
of scope.<br />
Compilation of the report<br />
The content of the report is based on:<br />
■ Legal requirements concerning financial information<br />
(IAS/IFRS standards), set by our auditors.<br />
■ The requirements of the Global Reporting Initiative (GRI),<br />
level C.<br />
■ Relevance: information which is not relevant or does not<br />
have a significant impact on the Group is not included.<br />
■ The stakeholders to whom the report is addressed and<br />
their expectations, namely our clients, staff (current<br />
employees or applicants), suppliers, shareholders, banks,<br />
financial analysts.<br />
The report also aims to present the information as clearly<br />
and transparently as possible.<br />
Information on the key performance indicators<br />
Total number of staff by job type<br />
As noted in the section on Corporate Social Responsibilities,<br />
these figures are based on:<br />
■ Employees from fully consolidated subsidiaries and<br />
subsidiaries consolidated by proportionate integration,<br />
on a pro rata basis of the capital held by <strong>Hamon</strong>.<br />
■ Full-time equivalent and only staff on open-ended<br />
contracts. In the light of our extensive activities on<br />
worksites, the number of employees on short-term<br />
contracts constantly varies; for some, the length of the<br />
contract is limited to short periods. In some cases, we use<br />
external temporary recruitment agencies or union shops.<br />
■ The average for the year. If a subsidiary is only<br />
consolidated for one part of the fiscal year, a pro rata<br />
amount is calculated (for example, if a subsidiary is only<br />
consolidated for six months, the average staff numbers<br />
for this entity over the six months will only be taken at<br />
50%).<br />
For the four key indicators which follow, see the perimeter<br />
used for each in the table provided earlier in this section.<br />
Rate of frequency of occupational accidents by region<br />
in 2010 (no. accidents / million working hours)<br />
The rate frequency is the ratio between:<br />
■ The number of occupational accidents (fatal and non<br />
fatal, including those on the way to work),<br />
■ The number of effective hours of work (in million)<br />
Rate of severity of occupational accidents by region in<br />
2010 (no. days lost / thousand working hours)<br />
The rate of severity is the ratio between:<br />
■ The number of working days lost because of an<br />
occupational accident.<br />
■ The number of effective hours of work (in thousand)<br />
The number of days lost are working days (not calendar<br />
days).<br />
The starting point for the calculation is the day of the<br />
sickness or occupational accident, except in some Asian<br />
subsidiaries where the starting point is the day that<br />
exceeds the annual quota for the sick leave (and holiday).<br />
If a person has already been on sick leave, it is the<br />
number of days already accrued for illness which is taken<br />
into account. The annual quota depends on each of the<br />
subsidiaries. This also applies to the two key indicators<br />
below.<br />
Rate of occupational illness by region in 2010 (no. days<br />
lost / thousand working hours)<br />
The rate is the ratio between:<br />
■ The number of working days lost due to occupational<br />
illnesses (depression, inhaling of toxic gases, etc.)<br />
■ Number of effective hours of work (in thousand)<br />
Rate of absenteeism in 2010<br />
This rate is the ratio between:<br />
■ The number of working days lost due to occupational<br />
accidents, occupational illnesses and other illnesses<br />
(flu, etc.) or unexplained absences; planned leaves<br />
such as holiday and statutory leave are not included.<br />
■ The theoretical number of working days aside from<br />
statutory leave and holiday.<br />
Other key indicators<br />
As the other key indicators used are more familiar, a<br />
short definition is given below only if necessary:<br />
■ Direct economic value created and distributed: this<br />
includes the turnover, the gross margin, labor costs,<br />
financial fees paid to banks, paid taxes, dividends paid<br />
out to shareholders, retained profits, donations.<br />
■ Provisions for pensions with defined benefit plans: see<br />
detailed explanation in note 32 of the financial section,<br />
which covers this key indicator.<br />
■ Significant grants and public funding received.
118<br />
<strong>Hamon</strong> Annual Report 2010<br />
■ Local recruitment practices and proportion of managers<br />
hired locally.<br />
■ Direct energy consumption by primary energy source.<br />
■ Total volume of water extracted, by source.<br />
■ Initiatives to reduce the environmental impact of<br />
products and services.<br />
■ Average number of hours of training per year.<br />
■ Activities identified as presenting a significant risk of<br />
accidents involving children and the measures taken.<br />
■ Total number of lawsuits related to anti-competitive<br />
behavior, violations of antitrust laws and monopolistic<br />
practices; results.<br />
GRI correspondence grid<br />
For our first annual report based on the Global Reporting Initiative (GRI) guidelines, we estimate that we reach a<br />
C level (self-declared). Here is the correspondence grid allowing to find in this annual report the various sections<br />
covered by the GRI canvas.<br />
Ref. Indicator reported Page<br />
Part I - Profile disclosure<br />
1 Strategy and analysis<br />
1.1 Statement from the most senior decision-maker of the organization Fully 8 to 11<br />
2 Organizational profile<br />
2.1 Name of the organization Fully 60<br />
2.2 Primary brands, products, and/or services Fully 42 to 51<br />
2.3 Operational structure of the organization, including main divisions,<br />
operating companies, subsidiaries, and joint ventures Fully 12-13; 70<br />
2.4 Location of organization’s headquarters Fully 60<br />
2.5 Number and names of countries where the organization operates Fully 12-13; 70<br />
2.6 Nature of ownership and legal form Fully 60; 89<br />
2.7 Markets served (including geographic breakdown,<br />
sectors served, and types of customers/beneficiaries) Fully 12-13; 74<br />
2.8 Scale of the reporting organization Fully 7; 17-18<br />
2.9 Significant changes during the reporting period regarding size, structure, or ownership Fully 36 to 39<br />
2.10 Awards received in the reporting period Fully 18<br />
3 Report parameters<br />
3.1 Reporting period for information provided Fully 60; 116<br />
3.2 Date of most recent previous report Fully 116<br />
3.3 Reporting cycle Fully 116<br />
3.4 Contact point for questions regarding the report or its contents Fully 121<br />
3.5 Process for defining report content Fully 117<br />
3.6 Boundary of the report Fully 116; 70<br />
3.7 State any specific limitations on the scope or boundary of the report Fully 116-117<br />
3.8 Basis for reporting on joint ventures, subsidiaries, leased facilities,<br />
outsourced operations, and other entities that can significantly affect comparability<br />
from period to period and/or between organizations Fully 62<br />
3.10 Explanation of the effect of any re-statements of information provided in earlier reports Fully 117
Annexures<br />
119<br />
Ref. Indicator reported Page<br />
3.11 Significant changes from previous reporting periods in the scope,<br />
boundary, or measurement methods applied in the report Fully 79<br />
3.12 Table identifying the location of the Standard Disclosures in the report Fully 118-119<br />
4 Governance, commitments, and engagement<br />
4.1 Governance structure of the organization Fully 22 to 29<br />
4.2 Indicate whether the Chairman of the highest governance body is also an executive officer Fully 24<br />
4.3 Number of members of the board of directors who are independent and/or non-executive members. Fully 24<br />
4.4 Mechanisms for shareholders and employees to provide recommendations<br />
or direction to the highest governance body Fully 35<br />
4.14 List of stakeholder groups engaged by the organization Fully 33 to 35<br />
4.15 Basis for identification and selection of stakeholders with whom to engage dialogue Partly 33 to 35<br />
Part III - Performance indicators<br />
Economic indicators<br />
EC 1 Direct economic value generated and distributed Fully 54 to 113; 20<br />
EC 3 Coverage of the organization’s defined benefit plan obligations Fully 90 to 93<br />
EC 4 Significant financial assistance received from government Fully 109<br />
EC 7 Procedures for local hiring and proportion of senior management hired<br />
from the local community at significant locations of operation Fully 18<br />
Environmental indicators<br />
EN 3 Direct energy consumption by primary energy source (+ indirect power consumption) Fully 115<br />
EN 8 Total water withdrawal by source Fully 115<br />
EN 26 Initiatives to mitigate environmental impacts of products and services, and extent of impact mitigation Fully 21<br />
Social - Labor Practices and Decent Work<br />
LA 1 Total workforce by employment type, employment contract, and region Fully 17-18<br />
LA 7 Rates of injury, occupational diseases, lost days, and absenteeism,<br />
and number of work-related fatalities by region Fully 114-115<br />
LA 10 Average hours of training per year per employee Fully 18<br />
HR 6<br />
SO 7<br />
Social - Human rights<br />
Operations identified as having significant risk for incidents of child labor,<br />
and measures taken to contribute to the elimination of child labor Fully 19<br />
Social - Society<br />
Total number of legal actions for anti-competitive behavior,<br />
anti-trust, and monopoly practices and their outcomes Fully Nihil<br />
Section 4.15 is partly reported because <strong>Hamon</strong> has not established yet a formal process to select its key stakeholders<br />
and launch discussions with them (e.g. via discussion panels). <strong>Hamon</strong> has just identified the key stakeholders which<br />
seem the most important as groups.<br />
For section S 07: there has been no legal action against <strong>Hamon</strong> for anti-competitive behavior, anti-trust or monopoly<br />
practices in 2010.<br />
Please note that our annual report also includes many pieces of information not listed in the GRI grid.
120<br />
<strong>Hamon</strong> Annual Report 2010<br />
surface condenser thanks to the indirect contact between<br />
the steam and cold water running through the cooling<br />
circuit. This water is then sent to a cooling system,<br />
before it is re-injected into the cooling circuitry again.<br />
deNOx:<br />
Elimination of Nitrogen oxides, NOx in short form, from<br />
waste gases.<br />
deSOx:<br />
Elimination of Sulfur oxides, SOx in short form, from<br />
waste gases.<br />
Dry cooling system or air condenser:<br />
Used in the production of electricity, this system directly<br />
condenses steam at the exit of the steam turbine, in<br />
finned tube bundles cooled by the surrounding air.<br />
EBIT:<br />
Earnings before interest and tax, and after any<br />
non-recurring costs.<br />
EBITDA:<br />
Earnings before interest, taxes, depreciation and<br />
amortization.<br />
Glossary<br />
EMEA:<br />
Europe, Middle East and Africa.<br />
ESP:<br />
Electrostatic Precipitator, an electrostatic filter that<br />
eliminates particles from the waste gases.<br />
Air Cooler (or AFC):<br />
Heat exchanger in which an often corrosive liquid or<br />
gas, under high pressure and high temperature, passes<br />
through special alloy finned tubes and is cooled by air<br />
from a ventilator. Used mainly in petrochemicals, and<br />
the Oil & Gas industry, but also in the cooling of<br />
auxiliaries, for example water in the steel industry.<br />
Bank Guarantees:<br />
Guarantees given by a bank for a certain amount and<br />
over a fixed period, when contracts are made (sold) and<br />
executed. Principal categories: advance payment bond,<br />
performance bond, and warranty bond.<br />
Cooling System when referred to in the context of<br />
electricity generation:<br />
In a traditional electricity generating power plant, water<br />
is heated and transformed into high pressure steam.<br />
This turns a steam turbine connected to an alternator,<br />
which converts mechanical energy to electrical energy.<br />
At the exit of the turbine, the steam is cooled in a<br />
FRP:<br />
Fiberglass-Reinforced Polyester, used for example for<br />
exhaust gas ducts in chimneys.<br />
GRI:<br />
Global Reporting Initiative: international body whose<br />
mission (at worldwide level) is to provide to organizations<br />
of any size, any place and any area a reliable,<br />
credible and standardized framework for their reporting<br />
in sustainable development.<br />
Group or <strong>Hamon</strong> Group:<br />
The name for <strong>Hamon</strong> and its subsidiaries in the sense<br />
of the Company Code, article 6, 2°.<br />
<strong>Hamon</strong>:<br />
The name of the limited company (under Belgian law)<br />
<strong>Hamon</strong> & Cie (International) SA, with its head office at<br />
Axis Parc, rue Emile Francqui 2, 1435 Mont-St-Guibert,<br />
Belgium.
Annexures<br />
Hybrid cooling system:<br />
Combination of a wet cooling system and finned tube<br />
bundles that slightly heats the saturated humid air, in<br />
order to reduce the plumes of steam.<br />
NAFTA:<br />
North American Free Trade Agreement = territory<br />
regrouping the United States of America, Canada and<br />
Mexico.<br />
North America:<br />
The territory regrouping the United States of America,<br />
Canada and Mexico.<br />
Wet cooling system:<br />
A system that cools the water from 30-40° C to 20-30°<br />
C. The cooling happens via direct contact between the<br />
water and the air on surface streaming, with evaporation<br />
of a part of the water.<br />
General information<br />
<strong>Hamon</strong> & Cie (International) S.A.<br />
Axisparc, Rue Emile Francqui 2<br />
B-1435 Mont-Saint-Guibert, Belgium<br />
Telephone : + 32 10 39.04.00<br />
Fax : + 32 10 39.04.01<br />
E-mail: corporate@hamon.com<br />
Website: www.hamon.com<br />
VAT: BE 402.960.467<br />
Company number: 0402.960.467<br />
Relations with investors<br />
and financial communication<br />
Bernard Van Diest, Group Financial Director<br />
Telephone : + 32 10 39.04.22<br />
Fax : + 32 10 39.04.16<br />
E-mail bernard.vandiest@hamon.com<br />
Any comment on this annual report <br />
Please send them to Sebastien van Ypersele<br />
Email: sebastien.vanypersele@hamon.com<br />
Responsible editors<br />
Francis Lambilliotte - Bernard Van Diest<br />
Ce rapport annuel est également disponible en français.
Integrated solutions Integrated for solutions a clean environment<br />
for a clean environment www.hamon.com<br />
HAMON Rue Emile Francqui 2 B-1435 Mont-St-Guibert, Belgium T + 32 10 39 04 00 F + 32 10 39 04 01 corporate@hamon.com