Brain scanning techniques (CT, MRI, fMRI, PET, SPECT ... - Cerebra
Brain scanning techniques (CT, MRI, fMRI, PET, SPECT ... - Cerebra
Brain scanning techniques (CT, MRI, fMRI, PET, SPECT ... - Cerebra

Create successful ePaper yourself
Turn your PDF publications into a flip-book with our unique Google optimized e-Paper software.
© <strong>Cerebra</strong> 2009<br />
<strong>Brain</strong> <strong>scanning</strong> <strong>techniques</strong> (<strong>CT</strong>, <strong>MRI</strong>, f<strong>MRI</strong>, <strong>PET</strong>, SPE<strong>CT</strong>, DTI, DOT)<br />
Background<br />
Anthea Wright<br />
<strong>Brain</strong> imaging has greatly advanced in the last 20 years, due to better<br />
understanding of the electromagnetic spectrum and radiofrequency waves,<br />
in relation to protons in individual molecules within the cells of the brain.<br />
New technologies allow non-invasive spatial mapping, (morphology), and<br />
observations of processes within the brain during set tasks. By sequencing<br />
scanned sections of the brain, activity between neurons in different parts of the<br />
brain can be observed and monitored. More recent technologies using a higher<br />
frequency resolution can identify the distribution of individual metabolites<br />
(large complex molecules), and pharmaceutical drugs. There are a range of<br />
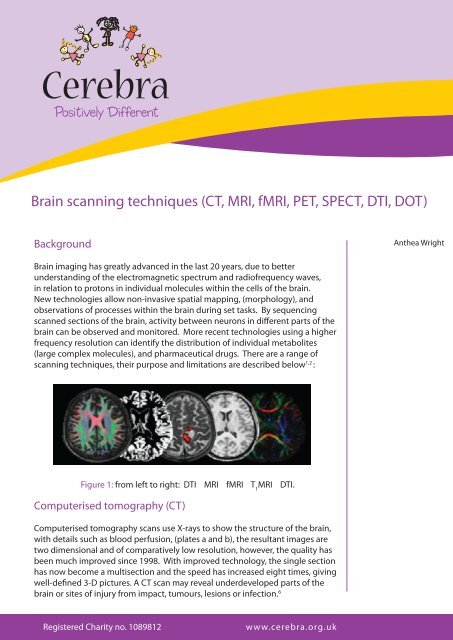
<strong>scanning</strong> <strong>techniques</strong>, their purpose and limitations are described below 1,2 :<br />
Figure 1: from left to right: DTI <strong>MRI</strong> f<strong>MRI</strong> T 1<br />
<strong>MRI</strong> DTI.<br />
Computerised tomography (<strong>CT</strong>)<br />
Computerised tomography scans use X-rays to show the structure of the brain,<br />
with details such as blood perfusion, (plates a and b), the resultant images are<br />
two dimensional and of comparatively low resolution, however, the quality has<br />
been much improved since 1998. With improved technology, the single section<br />
has now become a multisection and the speed has increased eight times, giving<br />
well-defined 3-D pictures. A <strong>CT</strong> scan may reveal underdeveloped parts of the<br />
brain or sites of injury from impact, tumours, lesions or infection. 6<br />
Registered Charity no. 1089812<br />
www.cerebra.org.uk
© <strong>Cerebra</strong> 2010<br />
Before a <strong>CT</strong><br />
scan, the patient<br />
may drink but is<br />
asked not to eat<br />
for four hours<br />
beforehand,<br />
and not to<br />
take strenuous<br />
exercise. A <strong>CT</strong><br />
brain scan will<br />
take about 30<br />
minutes and the<br />
patient must<br />
lie still for the<br />
duration.<br />
Figure 2: Oblique view of a <strong>CT</strong> gantry with an X-ray tube, an X-ray fan,<br />
and detectors for a single-section scanner and a multisection scanner<br />
(foursection system shown).<br />
Figure 3:<br />
i) The blue colour shows total blood perfusion throughout the brain.<br />
ii) The red colour shows blood perfusion to the left side of the brain only.<br />
Before a <strong>CT</strong> scan, the patient may drink but is asked not to eat for four<br />
hours beforehand, and not to take strenuous exercise. A <strong>CT</strong> brain scan will<br />
take about 30 minutes and the patient must lie still for the duration. An<br />
EEG may be attached to monitor heart rate, and for some investigations, a<br />
2<br />
Registered Charity no. 1089812
tracer injection (iodinated contrast fluid), may be required to highlight blood<br />
vessels, sometimes leaving a ‘taste’ at the back of the throat for a short time<br />
afterwards. The radiologist needs to know if the patient is diabetic, pregnant<br />
or on medication. The procedure is painless, but does involve exposure to<br />
radiation at a very low level. 7<br />
Magnetic resonance imaging (<strong>MRI</strong>)<br />
Figure 4: Digitally enhanced <strong>MRI</strong> images of the brain.<br />
An <strong>MRI</strong> scanner uses a strong magnetic field and radio waves to create pictures<br />
of the tissues and other structures inside the brain, on a computer. The<br />
magnetic field aligns the protons (positively charged particles) in hydrogen<br />
atoms, like tiny magnets. Short bursts of radio waves are then sent to knock<br />
the protons out of position, and as they realign, (relaxation time), they emit<br />
radio signals which are detected by a receiving device in the scanner. The<br />
signals emitted from different tissues vary, and can, therefore, be distinguished<br />
in the computer picture. 1<br />
An <strong>MRI</strong> scanner<br />
can create clear,<br />
detailed pictures<br />
of the structure<br />
of the brain and<br />
can detect any<br />
abnormalities<br />
or tumours.<br />
Sometimes<br />
a dye, or<br />
tracer, such as<br />
gadolinium may<br />
be introduced<br />
via a vein in the<br />
arm, to improve<br />
contrast in the<br />
image.<br />
An <strong>MRI</strong> scanner can create clear detailed pictures of the structure of the brain<br />
and detect any abnormalities or tumours. Sometimes a dye, or tracer, such as<br />
gadolinium may be introduced via a vein in the arm, to improve contrast in the<br />
image. Images can be enhanced by differences in the strength of the nuclear<br />
magnetic resonance signal recovered from different locations in the brain. The<br />
relaxation times, T 1<br />
, T 2<br />
, and T 2*<br />
are measured after the scanner’s pulse sequence,<br />
and can be chosen to look at specific tissue within the brain. 9,10 For example,<br />
at a T 2<br />
setting, water and fluid containing tissue appears bright, whilst fat<br />
containing tissue is dark, and this can be used to distinguish damaged tissue<br />
from normal tissue. A T 1<br />
setting gives a clear image for the contrast between<br />
www.cerebra.org.uk 3
© <strong>Cerebra</strong> 2010<br />
The process of<br />
having a scan<br />
is painless and<br />
safe, there is<br />
no exposure to<br />
radiation but<br />
occasionally,<br />
a patient may<br />
have a reaction<br />
to the tracer<br />
dye. Pregnant<br />
mothers are not<br />
recommended<br />
to undertake<br />
the procedure<br />
unless there is no<br />
alternative, since<br />
it is not known<br />
whether the<br />
effects of a strong<br />
magnetic field<br />
may affect the<br />
developing baby.<br />
white and grey matter in the brain. T 2*<br />
imaging uses a marker, eg. gadolinium,<br />
to measure cerebral blood volume and flow. It may be seen that by selecting<br />
different relaxation times and manipulating radio frequencies, specific brain<br />
tissue can be highlighted for examination by the physician.<br />
The process of having a scan is painless and safe, there is no exposure to radiation,<br />
but occasionally, a patient may have a reaction to the tracer dye. Pregnant<br />
mothers are not recommended to undertake the procedure unless there is no<br />
alternative, since it is not known whether the effects of a strong magnetic field<br />
may affect the developing baby. 3<br />
The scanner is a large tunnel surrounded by a circular magnet; the patient lies<br />
on a couch which slides into the tunnel. It is quite noisy so the patient is given<br />
headphones with music of their choice, and has to keep still for 15 to 40 minutes<br />
as the tiny radio wave signals are picked up by the computer. It is entirely<br />
painless, but children may require a general anaesthetic to keep them still for long<br />
enough. The radiographer will need to know if the patient has any metal in their<br />
body such as a metal skull plate, inner ear implants, pacemaker, artificial joints,<br />
or screws or pins holding bone fracture repairs. The patient may resume normal<br />
activities immediately after the scan, and the radiologist studies the pictures and<br />
sends a report to the doctor. 3<br />
Figure 5: A 3 tesla clinical <strong>MRI</strong> scanner.<br />
4<br />
Registered Charity no. 1089812
Functional magnetic resonance imaging (f<strong>MRI</strong>)<br />
Functional magnetic resonance imaging can show which part of the brain<br />
is active, or functioning, in response to the patient performing a given task,<br />
by recording the movement of blood flow. All atoms and molecules have<br />
magnetic resonance, emitting tiny radio wave signals with movement,<br />
because they contain protons. Different molecules have different magnetic<br />
resonance and two components of blood are tracked to observe brain<br />
activity.<br />
Haemoglobin in the blood carries oxygen; oxyhaemoglobin, around the<br />
brain and when it is used up, it becomes desoxyhaemoglobin. Where the<br />
oxygen is being ‘used up’ shows the site of activity in the brain. The picture<br />
is made by monitoring the ratio of the tiny wave frequencies between these<br />
two states whilst the patient carries out a task, eg. tapping a finger, which<br />
highlights the area of the brain functioning to carry out this task. 4<br />
Figure 6: An f<strong>MRI</strong> scan showing regions of activation, including the<br />
primary visual cortex.<br />
Functional<br />
magnetic<br />
resonance imaging<br />
can show which<br />
part of the brain<br />
is active, or<br />
functioning, in<br />
response to the<br />
patient performing<br />
a given task,<br />
by recording<br />
the movement<br />
of blood flow.<br />
All atoms and<br />
molecules<br />
have magnetic<br />
resonance,<br />
emitting tiny<br />
radio wave signals<br />
with movement,<br />
because they<br />
contain protons.<br />
An f<strong>MRI</strong> scan is painless and harmless and can, therefore, be carried out at<br />
regular intervals to monitor the progress of a patient under treatment.<br />
www.cerebra.org.uk<br />
5
© <strong>Cerebra</strong> 2010<br />
The areas of<br />
the brain that<br />
command the<br />
greater volumes<br />
of blood produce<br />
the most gammarays,<br />
and it is<br />
these areas that<br />
are computed<br />
and displayed by<br />
the <strong>PET</strong> scan. As<br />
the tracer decays,<br />
there is a point<br />
when gamma<br />
photons are<br />
emitted almost<br />
opposite to each<br />
other.<br />
Positron emission tomography (<strong>PET</strong>)<br />
Positron emission tomography <strong>scanning</strong> produces a three-dimensional image<br />
of functional processes in the brain, (not just the structure). <strong>PET</strong> is a nuclear<br />
medicine imaging technique which requires the patient to receive a small<br />
injection of radio-active material (a sugar tracer; fluorodeoxyglucose), into the<br />
bloodstream. The radio-active material causes the production of gamma-rays,<br />
these are a form of electromagnetic radiation like X-rays, but of higher energy.<br />
The radio-active material is transported around the body and into the brain. A<br />
ring of detectors outside the head is used to detect pairs of gamma rays emitted<br />
indirectly by the positron-emitting radionuclide (tracer), in each part of the<br />
brain under examination. 8<br />
The areas of the brain that command the greater volumes of blood produce<br />
the most gamma-rays, and it is these areas that are computed and displayed<br />
by the <strong>PET</strong> scan. As the tracer decays, there is a point when gamma photons<br />
are emitted almost opposite to each other, (‘annihilation’ in the Figure (7)), the<br />
timing of this event is detected and will ultimately improve the detail of the<br />
image. This system not only identifies the activated area of the brain, but also<br />
measures the degree of activity. 8<br />
Figure 7: Schematic view of the <strong>PET</strong> process.<br />
6<br />
Registered Charity no. 1089812
A patient may only have one <strong>PET</strong> scan, due to radiation dosage regulations.<br />
<strong>PET</strong> has proved to be particularly useful in monitoring visual problems,<br />
tumours and metabolic processes. 5<br />
Single photon emission computed tomography (SPE<strong>CT</strong>)<br />
The patient will not<br />
have to fast before<br />
the procedure, but<br />
will have to remain<br />
absolutely still for<br />
15 to 20 minutes<br />
in a scanner. The<br />
amount of radiation<br />
the patient will be<br />
exposed to is very<br />
small, about 1 to 3<br />
times normal human<br />
annual exposure<br />
to background<br />
radiation.<br />
Figure 8: SPE<strong>CT</strong> scan showing blood perfusion.<br />
The single photon emission computed tomography records the signals from<br />
gamma rays, (singly, rather than when the emissions are opposite at 180º),<br />
using two or more synchronised gamma cameras, and the multiple 2-D<br />
images are computed, tomographically reconstructed, to 3-D. A section may<br />
be examined from several angles, but is slightly less clear than a <strong>PET</strong> image.<br />
A SPE<strong>CT</strong> scanner is less expensive than a <strong>PET</strong> scanner and uses longer-lived,<br />
more easily obtained radioisotopes. Tracing blood flow within the brain<br />
identifies where metabolic activity is occurring, enabling assessment of<br />
brain functions. 11<br />
The patient will not have to fast before the procedure, but will have to<br />
remain absolutely still for 15 to 20 minutes in a scanner, similar to the <strong>MRI</strong><br />
example in Figure (5). A radiopharmaceutical (tracer) will be injected via a<br />
catheter in the arm. The amount of radiation the patient will be exposed<br />
to is very small, about 1 to 3 times normal human annual exposure to<br />
background radiation. The procedure is painless and the patient may<br />
www.cerebra.org.uk 7
© <strong>Cerebra</strong> 2010<br />
Diffusion tensor<br />
imaging is a type<br />
of diffusion <strong>MRI</strong><br />
used so that<br />
functions in the<br />
brain may be<br />
observed as they<br />
occur, (in vivo).<br />
The restricted<br />
diffusion of water<br />
through the brain<br />
tissue under<br />
examination is<br />
measured; it is<br />
often used to<br />
image white<br />
matter.<br />
resume normal activities immediately afterwards. 12<br />
Diffusion tensor imaging (DTI)<br />
Figure 9: DTI image of neuronal tracts.<br />
Diffusion tensor imaging is a type of diffusion <strong>MRI</strong> used so that functions in<br />
the brain may be observed as they occur, (in vivo). The restricted diffusion of<br />
water through the brain tissue under examination is measured; it is often used<br />
to image white matter. The direction in which the neuronal axon bundles are<br />
oriented determines how water flows, for example, parallel bundles of nerve<br />
axons and their associated myelin sheaths, (the insulating layer of cells around<br />
each nerve), facilitate diffusion of water molecules along their main direction.<br />
The magnetic field variations of the <strong>MRI</strong> magnet are applied in at least six<br />
different directions, which makes it possible to calculate for each pixel, (a tensor<br />
that describes this diffusion anisotropy {direction of movement}). 13<br />
The image can be colour-coded at different wavelengths to illustrate tract<br />
position, direction and movement in 3-D.<br />
8<br />
Registered Charity no. 1089812
Figure 10: Colour-coded diffusion tensor image.<br />
The DTI can track the neural impulses along the pathways as information<br />
travels through the brain, and down the spinal cord to peripheral nerves. A<br />
DTI scanner can image white matter lesions, which would not show up on<br />
any other <strong>MRI</strong> <strong>techniques</strong>. Not only can DTI be used to identify tumours<br />
but also to study the way information is processed to control muscles and<br />
development during childhood. Areas of abnormality in the brain can be<br />
identified in relation to epilepsy, where surgery is considered. 14,15<br />
Undertaking this procedure is painless and harmless, but the patient will<br />
have to remain still for about half an hour, whilst the images are processed.<br />
Diffusion tensor imaging is a relatively new technique and consequently,<br />
there are very few scanners in the UK at this time.<br />
A DTI scanner can<br />
image white matter<br />
lesions, which<br />
would not show up<br />
on any other <strong>MRI</strong><br />
<strong>techniques</strong>. Not only<br />
can DTI be used to<br />
identify tumours<br />
but also to study<br />
the way information<br />
is processed to<br />
control muscles and<br />
development during<br />
childhood.<br />
Diffuse optical tomography (DOT)<br />
Diffuse optical tomography (DOT), is a non-invasive imaging technique in<br />
which near-infrared light is used to probe the interior of the brain to record<br />
oxygenation and other physiological changes, which may have occurred<br />
after a stroke, seizure or haemorrhage. Although the spatial resolution is<br />
limited compared to <strong>MRI</strong>, the advantage of DOT is its simplicity and speed<br />
of measurements; the instruments are compact and portable, about the<br />
size of a small suitcase and a laptop, and can therefore, easily be taken to<br />
the bedside for constant monitoring of brain activity. The DOT analysis<br />
involves spectroscopy to monitor haemoglobin involved in oxygenation and<br />
therefore, this system also enables the identification of other metabolites<br />
such as proteins. Applications include diagnostic imaging of joints and<br />
limbs and mammography.<br />
www.cerebra.org.uk 9
© <strong>Cerebra</strong> 2010<br />
DOT systems<br />
uses frequencies,<br />
continuous wave<br />
measurements,<br />
and timeresolutions<br />
such as timecorrelated<br />
photon counting.<br />
Measurements<br />
are mostly made<br />
at wavelengths<br />
between 750 nm<br />
and 1000 nm.<br />
A major challenge in optical imaging of biological tissue is the strong<br />
scattering of visible and infrared light by tissue. Unlike X-rays, low-energy<br />
photons do not travel through the body in a straight line, but instead<br />
propagate in a diffuse manner and thus, carry little spatial information<br />
about the volume.<br />
DOT systems use detectors to sample as much reflected light as possible<br />
over a surface area, processing the information with statistical models of<br />
photon transport to generate cross-sectional or 3-D images of the tissue.<br />
In addition to structural data, these images provide functional information<br />
about the tissue, such as the typical absorption spectra of specific<br />
molecular species, such as oxyhaemoglobin and deoxyhaemoglobin.<br />
DOT systems uses frequencies, continuous wave measurements, and time<br />
resolutions such as time-correlated photon counting. Measurements are<br />
mostly made at wavelengths between 750 nm and 1000 nm. Typically,<br />
detectors placed close to the light source will detect light scattered from<br />
tissue just below the surface, while detectors placed further away will<br />
detect light from deeper tissue, where the signal is very weak. Imaging<br />
deeper tissue thus requires detectors with high sensitivity and wide<br />
dynamic range. Detectors should also have excellent time or frequency<br />
response in order to discriminate between surface scattering and deeptissue<br />
scattering. 16<br />
Figure 11: Comparison of optical and functional magnetic<br />
resonance images of motor cortex activation.<br />
10<br />
Registered Charity no. 1089812
An image tomographically reconstructed from an optical scan shows focal areas of hemoglobin<br />
saturation rising more than 2 SD above the mean (yellow), which correspond to motor activation<br />
maps generated in the same subject using functional magnetic resonance imaging (f<strong>MRI</strong>) alone<br />
(left-hand activity, blue; right-hand activity, red; T1-weighted image, grey). The f<strong>MRI</strong> images alone<br />
(A); overlay of left-hand optical image (B); overlay of right-hand optical image (C). There is good<br />
spatial agreement between the two methods, however, the optical image yields quantitative<br />
changes in hemoglobin saturation. 17<br />
This information is not meant to replace the advice of any physician or qualified health<br />
professional. The information provided by <strong>Cerebra</strong> is for information purposes only and is not a<br />
substitute for medical advice or treatment for any medical condition. You should promptly seek<br />
professional medical assistance if you have concerns regarding any health issue.<br />
www.cerebra.org.uk<br />
11
© <strong>Cerebra</strong> 2010<br />
References<br />
1<br />
Turner R and Jones T, (2003), ‘Techniques for imaging neuroscience’. British Medical Bulletin 65: 3-20<br />
2<br />
Bachert P, Schroder L, (2003), ‘Magnetic resonance imaging spectroscopy’. Radiology. 43(12):1113-26<br />
3<br />
Netdoctor, (2009), <strong>MRI</strong> Scan Advice, [online] Available from: www.netdoctor.co.uk/health_advice<br />
[Accessed 3 June 2009]<br />
4<br />
Dyson M, Banks D, Stewart M, (2006), ‘Exploring the <strong>Brain</strong>’, The Open University, Milton Keynes, 24-27<br />
5<br />
Singh K, (2002), ‘Signals and Perception’, The Open University, Milton Keynes, 165<br />
6<br />
Rydberg J, et al. (2000), ‘Multisection <strong>CT</strong>:Scanning Techniques and Clinical Applications’,<br />
Radiographics, 1787-1806<br />
7<br />
BMI Healthcare, (2009), <strong>CT</strong> Scanning, [online], Available from: http://www.bmihealthcare.co.uk/<br />
treatment [Accessed 3 June 2009]<br />
8<br />
Young H, (1999), ‘Measurement of clinical and subclinical tumour response using [18F]-<br />
fluorodeoxyglucose and positron emission tomography: review and 1999 EORTC recommendations’<br />
European Journal of Cancer, Volume 35, Issue 13, Pages 1773-1782<br />
9<br />
Rosen Y, (2007), ‘The recent advances in magnetic resonance neurospectroscopy’, Neurotherapeutics,<br />
27(3):330-45<br />
10<br />
Chen C, Hoult D, (1998), Biomedical Magnetic Resonance Technology, Taylor and Francis, (Medical<br />
Science Publishers), London<br />
11<br />
Frankle W, et al., (2005), ‘Neuroreceptor Imaging in Psychiatry: Theory and Applications’, International<br />
Review of Neurobiology, 67:385-440<br />
12<br />
Keyword, (2009), <strong>Brain</strong> SPE<strong>CT</strong>, [online]. Available from: http://md.gehealthcare.com [Accessed 3 June<br />
2009]<br />
13<br />
Lazar M, Weinstein DM, Tsuruda JS, et al (2003), ‘White matter tractography using diffusion tensor<br />
deflection’, Human <strong>Brain</strong> Mapping, 18: 306-321<br />
14<br />
Minati L, Aquino D, (2006), ‘Probing neural connectivity through diffusion tensor imaging’,<br />
Cybernetics and Systems, 263-68<br />
12<br />
Registered Charity no. 1089812
15<br />
Le Bihan, et al, (2001), ‘Diffusion Tensor Imaging: Concepts and Applications’, Journal of Magnetic<br />
Resonance Imaging, 13:534-546<br />
16<br />
Medical diagnostics, (2010), http://hamamatsu.com/en/applications [Accessed 7 July, 2010]<br />
17<br />
Benaron D A, Hintz S R, Villringer A, Boas D, Kleinschmidt A, Fraham J, Obrig H, Houten J C, Kermit<br />
E L, Cheong W-F, and Stevenson D K, (2000), ‘Noninvasive Functional Imaging of Human <strong>Brain</strong> Using<br />
Light’, Journal of <strong>Cerebra</strong>l Blood Flow and Metabolism, 20:469-477<br />
Figure references<br />
1<br />
www.sciencelearn.org.nz (Google ‘Report Images’)<br />
2<br />
www.medical-dictionary.thefreedictionary.com/<strong>CT</strong><br />
3<br />
www.medical-dictionary.thefreedictionary.com/<strong>CT</strong><br />
4<br />
http://www.fotosearch.com/photos-images/brain-scan.html<br />
5<br />
http://en.wikipedia.org/wiki/<strong>MRI</strong><br />
6<br />
http://en.wikipedia.org/wiki/Functional<strong>MRI</strong><br />
7<br />
http://encarta.msn.com/encyclopedia<br />
8<br />
www.mayfieldclinic.com<br />
9<br />
www.capersonalinjurycaselawnotes.com<br />
10<br />
http://emedicine.medscape.com (media file 6)<br />
11<br />
http://www.nature.com/jcbfm/journal/v20/n3/fig_tab/9590901f2.html#figure-title<br />
www.cerebra.org.uk<br />
13
Registered Charity no. 1089812<br />
www.cerebra.org.uk<br />
The <strong>Cerebra</strong> In-house Research Team carries out desk-based<br />
research into a number of areas, based upon parent and<br />
professional requests, new scientific evidence and issues raised by<br />
our staff. We aim to provide information that is relevant to parents<br />
and carers of children with disabilities as well as the professionals<br />
who come into contact with them. By empowering parents and<br />
professionals with knowledge, we can help them to improve the<br />
lives of the children they care for and support.<br />
If you require further information or would like to suggest avenues<br />
for further research, please get in touch.<br />
<strong>Cerebra</strong><br />
For <strong>Brain</strong> Injured Children & Young People<br />
Second Floor Offices, The Lyric Building, King Street,<br />
Carmarthen, SA31 1BD.<br />
Telephone: 01267 244200, email: info@cerebra.org.uk<br />
website: www.cerebra.org.uk<br />
The findings of this report are those of the author, not<br />
necessarily those of <strong>Cerebra</strong>.<br />
© <strong>Cerebra</strong> 2009 2010