UBS Life Sciences Conference 2005 - Pall Corporation (PLL)
UBS Life Sciences Conference 2005 - Pall Corporation (PLL)
UBS Life Sciences Conference 2005 - Pall Corporation (PLL)

Create successful ePaper yourself
Turn your PDF publications into a flip-book with our unique Google optimized e-Paper software.
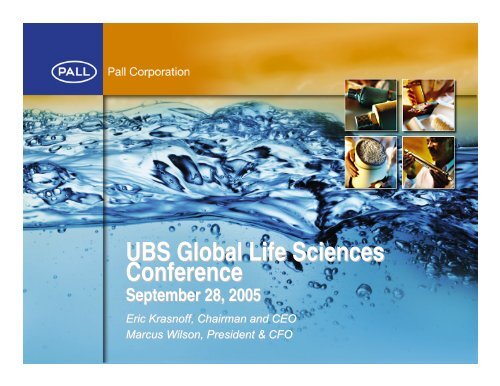
<strong>UBS</strong> Global <strong>Life</strong> <strong>Sciences</strong><br />
<strong>Conference</strong><br />
September 28, <strong>2005</strong><br />
Eric Krasnoff, Chairman and CEO<br />
Marcus Wilson, President & CFO
Forward–Looking Statements<br />
This presentation contains “forward-looking statements” as defined in the Private Securities<br />
Litigation Reform Act of 1995. These statements are based on current Company expectations and<br />
are subject to risks and uncertainties which could cause actual results to differ materially. Such risks<br />
and uncertainties include, but are not limited to: fluctuations in foreign currency exchange rates;<br />
regulatory approval and market acceptance of new technologies; changes in product mix and<br />
product pricing and in interest rates and cost of raw materials; the Company’s success in enforcing<br />
its patents and protecting its proprietary products and manufacturing techniques and its ability to<br />
achieve the savings anticipated from its cost reduction initiatives; global and regional economic<br />
conditions and legislative, regulatory and political developments; and domestic and international<br />
competition in the Company’s global markets. Additional information regarding these and other<br />
factors is available on the Web at www.pall.com and is included in the Company’s reports filed with<br />
U.S. Securities and Exchange Commission. Copies of such reports can be obtained, without charge,<br />
at: www.sec.gov.<br />
Management uses certain non-GAAP measurements to assess <strong>Pall</strong>'s current and future financial<br />
performance. The non-GAAP measurements do not replace the presentation of <strong>Pall</strong>'s GAAP<br />
financial results. These measurements provide supplemental information to assist management in<br />
analyzing <strong>Pall</strong>'s financial position and results of operations. <strong>Pall</strong> has chosen to provide this<br />
information to facilitate meaningful comparisons of past, present and future operating results and as<br />
a means to emphasize the results of on-going operations.<br />
2
Agenda<br />
• Overview of our Business<br />
• Business Strategies<br />
• Initiatives Fueling Growth<br />
• Guidance for FY2006<br />
3
Filtration Is Ubiquitous!<br />
Over 60 million times<br />
each day,<br />
a fluid is processed<br />
by a <strong>Pall</strong> product.<br />
4
A Strong Annuity Business<br />
75% of our annual sales comes from<br />
selling disposable replacements.<br />
5
<strong>Pall</strong> <strong>Corporation</strong> Markets<br />
<strong>Pall</strong> Industrial<br />
<strong>Pall</strong> <strong>Life</strong> <strong>Sciences</strong><br />
Process Technologies:<br />
Water Processing<br />
Fuels & Chemicals<br />
Power Generation<br />
Food & Beverage<br />
Microelectronics<br />
Aeropower:<br />
Aerospace<br />
Machinery & Equipment<br />
BioPharmaceuticals<br />
Medical:<br />
Blood<br />
Critical Care<br />
Bio<strong>Sciences</strong><br />
- Specialty Materials<br />
- Laboratory<br />
6
The Growth Potential for Filtration, Separations &<br />
Purification Equipment<br />
Machinery &<br />
Equipment<br />
$9,000M<br />
26%<br />
Aerospace<br />
$1,000M<br />
3%<br />
Medical<br />
$2,200M<br />
6%<br />
BioPharmaceuticals<br />
$5,800M<br />
17%<br />
Microelectronics<br />
$1,000M<br />
3%<br />
Food & Beverage<br />
$2,200M<br />
6%<br />
Power Generation<br />
$2,300M<br />
6%<br />
Potable Water<br />
$9,000M<br />
26%<br />
Fuels & Chemicals<br />
$2,500M<br />
7%<br />
Amounts In Millions<br />
Industrial Markets Include Water<br />
$35 Billion<br />
7
What Is Driving This Market Growth<br />
Waste<br />
Minimization<br />
Pure Raw<br />
Materials<br />
Government<br />
Regulations<br />
Process<br />
Optimization<br />
Product Quality/<br />
Process Innovation<br />
8
We Are Realizing Our Vision<br />
• Our Total Fluid Management SM strategy is<br />
expanding our footprint in customer facilities<br />
• We’re focusing on high-growth regions,<br />
markets and applications<br />
• We’re using alliances and partnerships to<br />
expand our product offering<br />
One Day All Fluids Will Pass Through <strong>Pall</strong> Products<br />
9
Reducing Corporate and Regional Infrastructure<br />
and Cost<br />
• Completed the consolidation and integration of our<br />
businesses in FY<strong>2005</strong> to:<br />
– Provide even better customer service and support<br />
– Drive resources into customer-focused initiatives<br />
– Eliminate non-value added costs<br />
10
<strong>Pall</strong> Advanced Separations Systems (PASS)<br />
• A world-class systems<br />
engineering company<br />
within <strong>Pall</strong><br />
• Provides:<br />
– Process design<br />
– Project management<br />
– Project engineering<br />
– Procurement<br />
– Commissioning<br />
– Service<br />
11
The Global PASS Organization<br />
Canada<br />
Western US<br />
Northeastern US<br />
UK<br />
Germany<br />
Italy France<br />
China<br />
Southern US<br />
Southeastern US<br />
Spain<br />
Japan<br />
India<br />
Venezuela<br />
Brazil<br />
Australia<br />
ENGINEERING/SYSTEMS SERVICE<br />
MELT POLYMER SYSTEMS<br />
INDUSTRIAL PROCESS SYSTEMS<br />
WATER SYSTEMS<br />
FOOD & BEVERAGE SYSTEMS<br />
BIOPHARMACEUTICAL SYSTEMS<br />
12
<strong>Pall</strong> Systems Help Generate Annuity Business<br />
13
<strong>Pall</strong> System Sales Mix<br />
12.0%<br />
10.0%<br />
8.0%<br />
6.5%<br />
7.8% 8.0%<br />
9.8%<br />
6.0%<br />
4.0%<br />
2.0%<br />
0.0%<br />
FY 2002 FY 2003 FY 2004 FY <strong>2005</strong><br />
14
<strong>Pall</strong> Process Technologies Markets<br />
Market Potential $17 Billion<br />
Total Fluid Management/Cleanliness Control<br />
15
<strong>Pall</strong> Water Sales<br />
Total Water Sales of $350 Million<br />
Municipal<br />
Water<br />
23%<br />
All Other<br />
Water<br />
77%<br />
16
Mobile Water Systems<br />
• Deployed<br />
anywhere to<br />
produce drinking<br />
water from most<br />
any source<br />
17
Expanded <strong>Pall</strong>/GE Alliance<br />
• Expands our access to<br />
customers and markets<br />
• Paves the way for joint<br />
product development<br />
• Market for membranes &<br />
equipment is expected to<br />
increase to $9 billion in<br />
four years<br />
18
Sustained Growth for Fuels & Chemicals<br />
Hydrotreater System<br />
19
TFM for All Food & Beverage Process Fluids<br />
PROFI Diatomaceous Earth (DE)-free<br />
system -- the future in beer filtration<br />
20
Microelectronics Positioned for<br />
Steady Growth in 2006<br />
21
<strong>Pall</strong> Aeropower Markets<br />
Market Potential $10 Billion<br />
22
<strong>Pall</strong> <strong>Life</strong> <strong>Sciences</strong> Markets<br />
BioPharmaceuticals Bio<strong>Sciences</strong> Blood Critical Care<br />
Market Potential $8 Billion<br />
23
New Agreements for <strong>Pall</strong> Leukocyte<br />
Reduction Filters<br />
• 14 Million units of Blood<br />
collected in the US<br />
annually<br />
• New long-term contract<br />
with the American Red<br />
Cross<br />
• New agreement with the<br />
Green Cross <strong>Corporation</strong><br />
in Korea<br />
24
<strong>Pall</strong> Leukotrap ® Affinity Prion Reduction Filter<br />
• Shown to Reduce both<br />
Infectious Prions and<br />
Leukocytes from Blood<br />
• CE marked in May,<br />
<strong>2005</strong><br />
• Market Potential of<br />
>$500 Million<br />
25
Sales of <strong>Pall</strong> Products for Cell Therapy Growing<br />
26
<strong>Pall</strong> Products for Infection Control in the Hospital<br />
27
New <strong>Pall</strong> BioPharmaceuticals Products<br />
For A Rapidly Growing Market<br />
28
<strong>Pall</strong> Emerges as a Key Player in Chromatography<br />
• The chromatography<br />
market is estimated at<br />
40% of the total biotech<br />
industry spend<br />
• Chromatography resins<br />
are typically replaced<br />
once a year<br />
29
<strong>Pall</strong> Products for the Drug Pipeline<br />
Discovery<br />
Syringe filters<br />
Multi-well filter plates<br />
Transfer membranes<br />
Ultrafiltration<br />
Microarrays<br />
Development<br />
Cell culture filtration<br />
Multi-well filter plates<br />
Transfer membranes<br />
Membrane absorbers<br />
Quality control<br />
Micro devices<br />
Syringe filters<br />
Multi-well plates<br />
Production<br />
Capsules<br />
Bioreactors<br />
Cartridges<br />
Membrane absorbers<br />
Chromatography sorbents<br />
Delivery<br />
Blood filters<br />
IV Filtration<br />
Hospital Pharmacy<br />
Anesthesia<br />
Biosensors<br />
30
Marcus Wilson, President and CFO
Fiscal <strong>2005</strong> Fourth Quarter and Full Year Results<br />
For the Quarter<br />
• Sales of $524.5 million, reflecting a 4% increase<br />
• Pro forma EPS of 47¢<br />
For the Full Year<br />
• Sales of $1.9 billion, reflecting a 7½% increase<br />
• Pro forma EPS $1.34<br />
32
Outside Sales and Operating Profit by Geography FY<strong>2005</strong><br />
FY<strong>2005</strong> Full Year Sales<br />
$1,902.3M<br />
Asia<br />
$430.6M<br />
22.7%<br />
Europe<br />
$782.5M<br />
41.1%<br />
WH<br />
$689.2M<br />
36.2%<br />
Operating Profit FY<strong>2005</strong><br />
$ 160.9 WH<br />
100.3 Europe<br />
63.9 Asia<br />
(8.3) Elim<br />
$ 316.8 Total <strong>Pall</strong><br />
33
Outside Sales and Operating Profit by Segment FY<strong>2005</strong><br />
FY<strong>2005</strong> Full Year Sales<br />
$1,902.3M<br />
Medical<br />
$443.2m<br />
BioPharm<br />
$321.5m<br />
MicroE<br />
$219.5m<br />
Aero<br />
$175.1m<br />
Gen Ind<br />
$743.0m<br />
Operating Profit FY<strong>2005</strong><br />
$ 82.3 Medical<br />
76.3 BioPharm<br />
158.6 <strong>Life</strong> Science<br />
82.9 Gen Ind<br />
33.8 Aero<br />
41.5 MicroE<br />
158.2 Industrial<br />
$ 316.8 Total<br />
<strong>Life</strong> <strong>Sciences</strong><br />
$764.7m<br />
40%<br />
Industrial<br />
$1,137.6m<br />
60%<br />
34
Comparative Income Statements (Full Year)<br />
(in millions, except EPS data) FY<strong>2005</strong> % FY2004 %<br />
Net sales $ 1,902<br />
$ 1,771<br />
Cost of sales 979 51.5 899 50.8<br />
Gross profit 923 48.5 872 49.2<br />
SG&A 621 32.7 584 33.0<br />
R&D 56 3.0 57 3.2<br />
Net interest 26 1.4 21 1.2<br />
Restructuring & other<br />
charges, net 39 12<br />
Earnings before taxes 181 9.5 198 11.2<br />
Income taxes 40 24.0 * 46 24.0 *<br />
Net earnings $ 141 7.4 $ 152 8.6<br />
Diluted EPS $ 1.12<br />
$ 1.20<br />
Pro forma diluted EPS $ 1.34<br />
$ 1.26<br />
* Underlying Tax Rate<br />
35
FY<strong>2005</strong> Pro Forma to As Reported Numbers<br />
(in millions, except EPS data)<br />
Pretax<br />
Earnings<br />
Net<br />
Earnings<br />
Diluted<br />
EPS<br />
Pro forma $ 220.7 $ 167.7 $ 1.34<br />
One-time purchase accounting<br />
adjustment, restructuring &<br />
other charges, net (39.6) (26.9) (0.22)<br />
As reported $ 181.1 $ 140.8 $ 1.12<br />
36
Balance Sheet & Cash Flow Data<br />
($ in millions)<br />
Balance Sheet (July 31, <strong>2005</strong>):<br />
Working Capital $ 703<br />
Stockholders' Equity $ 1,140<br />
DSO 84<br />
% of Net Debt/Net Debt + Equity 24.5%<br />
Cash Flow (Full Year):<br />
Capex $ 86<br />
Dividends Paid $ 47<br />
37
"CoRe" Cost Reduction Programs<br />
• Indirect and Direct Expenditure Strategic Sourcing<br />
• Continuous Improvement<br />
• Facilities Rationalization<br />
• Infrastructure Optimization<br />
38
Fiscal 2006 EPS Expectations<br />
• Sales Up mid single digit<br />
• Gross Margin Slight improvement<br />
• SG&A as % of sales Modest improvement<br />
• EPS range $1.31 to $1.46 *<br />
* Gives effect to the adoption of SFAS No. 123R,<br />
“Share-Based Payment”.<br />
39