BRIDGING THE EAGLE'S EYE AND WORM'S VIEW - Collabera
BRIDGING THE EAGLE'S EYE AND WORM'S VIEW - Collabera
BRIDGING THE EAGLE'S EYE AND WORM'S VIEW - Collabera

Create successful ePaper yourself
Turn your PDF publications into a flip-book with our unique Google optimized e-Paper software.
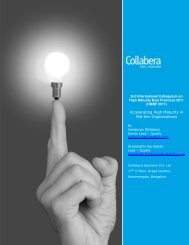
<strong>BRIDGING</strong> <strong>THE</strong> EAGLE’S <strong>EYE</strong><br />
<strong>AND</strong> WORM’S <strong>VIEW</strong><br />
Mosesraj R<br />
Practice Head-Quality<br />
<strong>Collabera</strong> Solutions, Bangalore<br />
<strong>AND</strong><br />
Smitha Thumbikkat<br />
Senior Lead, Quality<br />
<strong>Collabera</strong> Solutions, Bangalore
Abstract<br />
Acquiring clients is the biggest challenge for most mid-tier organizations. Retaining<br />
“clients for life” through consistent delivery is imperative in this competitive<br />
environment. However business goals pursued by management are not directly<br />
linked to delivery goals focussed on continually improving engineering performance.<br />
CMMi V1.3 helps align operational delivery goals with business goals of the<br />
organization. The OPI Council (comprising of Senior Management, Marketing and<br />
Quality heads) at <strong>Collabera</strong> took this challenge of aligning the business strategy<br />
empirically to performance goals like engineering, quality and on time delivery.<br />
Analysis of revenue growth, repeat business and proposal wins showed a significant<br />
correlation between Customer Satisfaction Ratings (CSAT) and these factors. Deeper<br />
analysis showed an interesting correlation between CSAT and engineering maturity:<br />
e.g. less than 2% defect slippage to customer and on time delivery, significantly<br />
improved the CSAT ratings; Greater than 5% defect slippage and greater than 3%<br />
schedule variance led to a poor CSAT rating.<br />
These relationships, along with industry benchmarks, were leveraged to set goals for<br />
the organization. These goals were communicated to the projects and improvement<br />
initiatives were launched on this basis. With over 80% of projects showing<br />
significant improvements vis-à-vis goals, recent CSAT has shown a positive shift.<br />
Introduction<br />
“Where there is no vision people perish” goes the famous saying. Vision and goals<br />
guide an organisation on the path to excellence. These provide the goal post for<br />
individuals and teams in the organization to get a sense of accomplishment.<br />
Organizations drive improvement programs and projects to inculcate a new<br />
behaviour for achieving these goals.<br />
According to an article published in the Wall Street Journal “Where Process-<br />
Improvement Initiatives Go Wrong” (Jan 25, 2010), nearly 60% of all improvement<br />
projects failed to yield desired results. Though there could be multiple reasons, one<br />
clear reason is the way change is imbibed across an organization. A complete<br />
understanding of the end objective through a well-structured goal that cascades<br />
down will help imbibe the new culture and guarantee success.<br />
Bridging the eagle’s eye and worms view
Mature organizations follow a balanced approach in<br />
setting their goals and are not confined to the<br />
profit/revenue syndrome. They set goals that<br />
impact financials, customers, people and operations<br />
to endure and compete in the long run. Though one<br />
would expect the goals to be imbibed naturally by<br />
everyone to the benefit of the organization, a<br />
survey by Franklin Covey shows just the opposite to<br />
be true (refer to figure 1). There is a need for goals<br />
to be communicated so that the workforce is aware,<br />
clearly articulated so that they can be understood<br />
and cascaded as meaningful targets to all levels so<br />
that there is a sense of purpose and achievement<br />
for every individual who contributes to the growth of<br />
the organization.<br />
This paper explores the practice adopted in<br />
<strong>Collabera</strong> and attempts to answer the questions below<br />
• How goals are connected from the<br />
practitioner level right up to the senior<br />
management in a seamless and<br />
meaningful way<br />
• How organisational initiatives are aligned<br />
to achieve specific goals<br />
• How the benefits translate thereof<br />
A Reality Check – Management View Vs<br />
Operational View<br />
A hypothetical, yet commonly confronted<br />
scenario in real life<br />
A highly enthusiastic project manager along with her team wanted to optimise the<br />
design and code of a long running maintenance project through refactoring<br />
mechanisms. Their objective was to help the team improve maintainability and<br />
support the client with faster resolution times for the project. In the initial stages, a<br />
management review wanted the team to focus only on delivery. They believed this<br />
would get them sustained revenue and also get some additional business. The<br />
team’s justification on the need and benefits thereof couldn’t help the cause as the<br />
management couldn’t connect their initiatives to overall goals. As a result, the<br />
initiative stalled and a new initiative to improve client relationship was brought in<br />
place.<br />
The above scenario led to the following results:<br />
• The right initiative being killed as it lacked alignment<br />
• Conflicting goals led to a fall in team motivation<br />
Bridging the eagle’s eye and worms view
The sad truth is that improvements and decisions are based on perception rather than facts.<br />
Figure 2 represents priorities across various levels in an organisation. In this era of<br />
spiralling competition, differing views and lack of alignment only contributes to the<br />
downfall of an organization. The issue of goal alignment is further exemplified in<br />
mid-tier IT organisations. These organizations have smaller immature client bases<br />
that lead to varying expectations and seemingly different priorities. Also these<br />
companies lack sufficient data to correlate the business goals to lower level<br />
processes. In many of these organizations, processes are often seen as constraints<br />
making process improvement more challenging. Thus the expectations like building<br />
trust in the client’s minds and delivery of best of breed high quality solutions remains<br />
a dilemma. However, the strategy of building “Clients for Life” and sustaining a long<br />
term value based relationship is only possible with high engineering maturity.<br />
The subsequent sections explore the approach adopted at <strong>Collabera</strong> to progressively<br />
translate the “Clients for life” vision to the entire organization.<br />
OPI Council<br />
<strong>Collabera</strong> formed a council comprising of senior<br />
business leaders in the organization to<br />
translate the business goals to operational<br />
targets and drive initiatives to achieve them.<br />
The team’s charter is given in figure 3. This<br />
team comprises of the head of delivery and key<br />
representatives from delivery groups, heads of<br />
technology, quality and marketing. This<br />
combination helps bring together views on<br />
industry perspectives, client expectations,<br />
emerging best practices and delivery<br />
challenges. This team considers the business<br />
strategies of the organization, derives and<br />
manages the delivery goals that would in turn<br />
help achieve the business goals of the<br />
organization. Also this team drives initiatives,<br />
meets monthly to review progress of initiatives<br />
and quarterly to review the overall performance<br />
and strategize new initiatives. A central<br />
SharePoint repository is maintained to manage<br />
the assets of the council.<br />
Charter of OPI Council<br />
Set performance goals of the organization<br />
Periodically review the organization level<br />
performance<br />
Compare organization performance with<br />
competition and industry benchmarks<br />
Identify the organization wide change<br />
initiatives to improve performance<br />
Sponsor and monitor the progress of the<br />
improvement initiatives<br />
The approach adopted by the OPI council is<br />
summarized in figure 4. The rest of the case<br />
study explains how these steps align with CMMI<br />
expectations and elaborates each step with<br />
examples.<br />
Bridging the eagle’s eye and worms view
CMMI and Goal alignment<br />
SEI’s model of CMMi ® helps improve engineering maturity and predictability in<br />
delivery. Though this model has been in existence for more than a decade, the<br />
latest version (CMMI® v1.3) strengthens the link between business strategy and<br />
operational performance.<br />
The changes in the latest<br />
version are given in<br />
figure 5. The latest<br />
version introduces a<br />
specific goal that<br />
addresses the following:<br />
• Identifies the correlation<br />
between business<br />
performance indicators<br />
and process performance<br />
• Understands<br />
an<br />
organization’s ability to<br />
achieve business goals<br />
• Identifies improvements to<br />
achieve these business<br />
goals<br />
<strong>Collabera</strong> adopted the CMMi<br />
model and aligned its practices with the new specific goal introduced as part of the latest<br />
version. Subsequent sections will elaborate how the intent of the practice was achieved.<br />
Business Performance Analysis<br />
<strong>Collabera</strong>’s vision is "Building client value for life". <strong>Collabera</strong> believes in being a client<br />
centric organization with long terms relationships and a competitive work force. This<br />
is summarized in our<br />
mission statement:<br />
"We deliver highly<br />
responsive and asset based<br />
business solutions that<br />
bridge our client's<br />
execution gaps through a<br />
culture of collaboration<br />
and shared commitments.<br />
Doing so, we create a<br />
dynamic environment of<br />
growth, advancement and<br />
learning for our employees<br />
and significant return for our stakeholders while accelerating the value delivered to our clients." This<br />
is translated into a three year rolling business plan with yearly targets on dimensions<br />
like financials, customers, people and operations. Every year <strong>Collabera</strong><br />
management conducts a sales meet and delivery offsite to crystalize the strategies<br />
Bridging the eagle’s eye and worms view
and targets for the subsequent year. The<br />
OPI council took these inputs and analysed Highlights of Opportunity Conversion<br />
Analysis<br />
the business performance. With the theme Proposal conversion is about 22% in<br />
“Clients for life” the team wanted to number terms.<br />
Conversion is higher in existing clients<br />
understand the following:<br />
Win% is accounts with high CSAT is twice<br />
1. Does CSAT influence business better than new accounts<br />
parameters like revenue growth and<br />
opportunity conversion<br />
2. What delivery indicators influence CSAT<br />
A positive response to the first question would prove that the organization is on the<br />
right path towards achieving its vision. This would make CSAT an effective indicator<br />
for better business performance which in-turn could be influenced by best in class<br />
engineering solutions and consistent delivery. A positive response to the second<br />
question would lead us to indicators<br />
that could be controlled for better<br />
CSAT. To test these hypotheses<br />
past data was consolidated and<br />
analysed.<br />
CSAT influence on revenue<br />
growth: The first parameter<br />
analysed was the sequential Q-o-Q<br />
growth of revenue along with the<br />
reasons for growth. Revenue<br />
growth in current accounts was<br />
correlated with CSAT performance.<br />
Following are the key findings<br />
• Steady revenue growth was<br />
driven by greater than 85% repeat business across all quarters. Spurt in Q3<br />
was due to the acquisition of a new client<br />
• <strong>Collabera</strong> retained the client base fairly over the period of analysis<br />
• All accounts that contributed to high business growth invariably have good<br />
performance on CSAT<br />
CSAT influence on opportunity conversion: Opportunity conversion is a critical<br />
measure for growth. Analysis showed that existing accounts have better conversion<br />
and accounts with higher CSAT<br />
have quite a high conversion<br />
percentage. Both these key<br />
business goals showed a high<br />
sensitivity to CSAT.<br />
CSAT Influencers: With CSAT<br />
showing a high influence on<br />
business indicators like revenue<br />
and opportunity conversion, the<br />
focus shifted to the identification<br />
of lead indicators that could<br />
Bridging the eagle’s eye and worms view
influence CSAT empirically. This would help set quantitative goals on influencing lead<br />
indicators. The framework for CSAT at <strong>Collabera</strong> for various attributes measured is<br />
shown in the inset figure 9. It is a survey based measure with scores on multiple<br />
dimensions. The survey is done at periodic intervals to understand customer<br />
perception. OPI council decided to identify the factors that influence overall<br />
satisfaction that would help proceed in further analysis.<br />
CSAT Analysis: The two cycles prior to mid-2010 were analysed. As shown in<br />
figure 9, CSAT questionnaire had aspects like requirements, solution, quality, on<br />
time, issue resolution and so on. Analysis was primarily to understand which of these<br />
factors impacts overall satisfaction the most. A simple bar chart with multiple<br />
variable inputs was used as the technique for analysis using minitab. Of the 20+<br />
parameters analysed, overall satisfaction showed high<br />
responsiveness to four parameters – requirements, technical<br />
solution, on time delivery and quality. Refer to the bar<br />
charts above for details – figure 10. The three key factors<br />
that impact CSAT are summarized in the inset figure 11.<br />
With the key factors identified, the team proceeded to<br />
ascertain if the project<br />
performance indicators<br />
like quality and on time<br />
delivery correlates with<br />
CSAT rating. Projects in<br />
different strata of<br />
performance levels<br />
showed demarcation in<br />
CSAT rating. Best in class<br />
and worst performance<br />
had no overlaps while the<br />
mid layer had overlaps.<br />
See the correlation of<br />
CSAT vs. on time delivery<br />
and quality in figure 12.<br />
Hence, the immediate<br />
Key CSAT Impacting lead<br />
parameters<br />
Quality of delivery<br />
On time delivery<br />
Engineering Maturity<br />
Bridging the eagle’s eye and worms view
target of the organization was<br />
to move all projects to perform<br />
at “good” level, while the vision<br />
is to achieve ‘best in class’<br />
performance levels for both on<br />
time and quality. Considering<br />
the engineering maturity<br />
dimension, the focus was on<br />
identifying one metric that<br />
could serve an indicator.<br />
Publication from SEI on defect<br />
detection distribution across<br />
maturity levels gave a view of<br />
such an indicator (see figure<br />
13). At level 5 maturity, pre-system test defect detection would be 85%. The OPI<br />
Council took this as a single indicator for engineering maturity.<br />
This would mean that the SIT and production defects would be quite low. We<br />
noticed from our analysis that high SIT defects led to high post-delivery defects (see<br />
figure 14). This validated the goal chosen for increasing engineering maturity. Thus<br />
the goals of the organization were<br />
• BUSINESS GOAL - Improve CSAT to high<br />
satisfaction levels of 4&5 on a scale of 5<br />
• ENGINEERING MATURITY - Pre-SIT defect<br />
detection levels greater than 85%<br />
• QUALITY - Achieve escaped defects to be less<br />
than 2% of the overall lifecycle defects<br />
• ON TIME DELIVERY - 100% on time<br />
Management members in the OPI<br />
Council conducted multiple road shows<br />
to communicate these goals to each of<br />
the teams. Measurement plans in<br />
projects were upgraded to cascade these goals to next level engineering targets.<br />
These steps ensured that the organization was seamlessly focussed on achieving the<br />
goals.<br />
Translating the organisation goals into engineering targets<br />
CRUX (an in-house process improvement methodology developed in <strong>Collabera</strong>) was<br />
the key vehicle in transforming<br />
organisation level goals to the<br />
next level. The crux of CRUX is<br />
its client centric performance<br />
driven approach, selection of a<br />
homogenous entity for driving<br />
improvements, clarity in<br />
ownership at the delivery group<br />
levels and a set of tools<br />
Bridging the eagle’s eye and worms view
prescribed for each phase.<br />
As these initiatives are driven at a client account level, the cycle time is typically<br />
short. As seen in the representation in<br />
Figure 15, the first and second stages of<br />
the CRUX-‘Critical area to improve’ and<br />
‘Recognise Lead indicators’ were the<br />
catalysts in setting up project goals and<br />
driving them down to the engineering<br />
targets. The first step aligns organisation<br />
goals like high engineering maturity,<br />
quality and on-time delivery to client<br />
account and identifies the critical areas<br />
for improvement. The second step<br />
identifies sub processes that could<br />
become lead indicators for predicting the<br />
goals of step 1. The detailed steps on how<br />
this drill down happens are shown in<br />
figure 16.<br />
The first cut analysis showed that more<br />
than 85% defect detection by unit test<br />
phase leads to less than 2% defects post<br />
delivery. Thus, the team focused on<br />
reducing SIT defects and went on with<br />
the identification of lead indicators and<br />
associated performance models. The process starts with identification of contributing<br />
processes that impact project goals. Then the process performance model (PPM) that<br />
would enable predicting the lag indicators is identified. This PPM could be available at<br />
the organisational level or at the project level depending on the lag indicator<br />
selected. Once this is identified, the associated lead indicators with the appropriate<br />
targets are finalised.<br />
Now, what does this mean to the project<br />
An engineer in the project, now understands and realises that structuring his code in<br />
such a way, by keeping the cyclomatic complexity to certain limits, reduces the<br />
amount of defects in the SIT phase, ultimately leading to the desired escape defect<br />
density which is an organisational goal.<br />
These predictions have been well integrated into the organisational processes. Head<br />
of units perform SPECTRUM reviews on a periodic/milestone basis. Based on current<br />
performance, models are used to predict outcomes and the probability of achieving<br />
the project goals are reviewed. This ensures that there is adequate management<br />
oversight based on facts.<br />
Driving organizational performance improvement initiatives<br />
Now that the goals have been identified, at an organisational level, the OPI council<br />
focussed at improving key processes across the projects in the organization. Inputs<br />
from senior management, CSAT and performance analysis are considered as inputs<br />
and analysed. This analysis helps identify potential areas of improvement for which<br />
Bridging the eagle’s eye and worms view
improvement initiative programs are<br />
identified. Framework elements (refer<br />
figure 17) that lead to identification of<br />
improvement initiatives are outlined below:<br />
o Capability Analysis: This is a direct<br />
comparison of goal vs. actual. Goals<br />
o<br />
o<br />
Framework for identifying initiatives<br />
Capability Analysis<br />
Regression & causal analysis<br />
Enable futuristic plans<br />
Adopting successful industry practices<br />
of the organization are compared with the performance baseline. A gap<br />
between the two would trigger appropriate improvement initiatives. Example:<br />
it was found that a lower percentage of defects were identified in phases<br />
prior to unit test than the goals of the organization. Initiative groups were<br />
identified to improve code reviews and unit tests across the organization. This<br />
initiative led to significant improvements in defects being found prior to the<br />
system test phase helping the organization achieve 2011 targets for pre-SIT<br />
defects<br />
Causal and Regression analysis: Code quality parameters such as<br />
cyclomatic complexity and branch statements made a strong correlation with<br />
SIT defects density. This was identified in the development cluster.<br />
Recognizing the fact that this is a lead indicator to the technical debt in the<br />
application, improving structural code quality is being driven across the<br />
organization. Based on this, objective standards for cyclomatic complexity<br />
and % branch<br />
statements are set<br />
and monitored across<br />
projects. Causal<br />
analysis across<br />
organization pointed<br />
to UI/cross browser<br />
defects formed a<br />
significant<br />
contribution to defect<br />
rates in SIT. This is<br />
being run as an ongoing<br />
initiative<br />
Futuristic: To build a<br />
resilient organization,<br />
initiatives are being<br />
identified to build organizational capabilities for future work. As per the goal<br />
of increasing the geographical footprint, Mobility and SharePoint 2010 were<br />
taken as key focus areas. Initiatives were taken around these technologies to<br />
build processes and methods to handle these projects. SharePoint 2010<br />
methodology has been piloted in the recent projects that helped achieve<br />
>90% defect pre-SIT and on time delivery. Dotnet4.0 has been launched by<br />
Microsoft. A team is working on a framework that would enable reuse and<br />
improve productivity across the organization.<br />
Bridging the eagle’s eye and worms view
o Adopting industry practices: Scanning of industry trends by the quality<br />
team helps study new trends in engineering practices in the industry. As a<br />
result of this, the Orthogonal Defect Classification (ODC) technique was used<br />
to select the right set of test cases. Most of the work in improving code<br />
quality was also inspired by industry research on technical debt.<br />
For each of these initiatives, ROI, resources, deliverables, risks and timelines are<br />
identified. All these are managed and tracked to initiative charters. A sample<br />
snapshot of the overall picture of goals set to their links to key initiatives is given<br />
in figure 18.<br />
Verifying Results<br />
These initiatives have led to a cultural shift in the way delivery is being managed and<br />
overseen across the organization. Results have been very compelling so far.<br />
• Across the organization, over 80% of projects have met engineering targets<br />
(sub process level goals) though they were quite stringent.<br />
• Since the launch of these initiatives, 100% of projects have gone on time<br />
• Pre-SIT goal of 2011 has been 100% achieved across projects.<br />
• Four improvement initiatives were closed with significant results, each of<br />
them improving<br />
baselines. Four other<br />
initiatives are in<br />
progress.<br />
• Interim CSAT figures<br />
show early indicators of<br />
CSAT improvement<br />
across key parameters<br />
of timelines, quality and<br />
overall satisfaction (See<br />
figure 19).<br />
Summary and Benefits<br />
Following are some of the key<br />
benefits we achieved as a<br />
result of the whole exercise.<br />
1. Visibility of progress towards organisational goals is objective, well<br />
implemented and seamlessly understood<br />
2. Because of the business goals connect, there is an obvious motivation across<br />
all levels with a sense of purpose<br />
3. The significant change brought about is that the person on the ground knows<br />
how they impact organisation goals. During a recent CMMI Level 5<br />
assessment, that <strong>Collabera</strong> underwent, this point came out as a strong<br />
contributor for high maturity behaviour.<br />
4. This has also helped build a performance culture in the organisation<br />
Bridging the eagle’s eye and worms view
With the success of this approach, this concept is being extended to other<br />
business goals as well. An initiative is being driven to consolidate all business<br />
indicators that would help build performance models across business dimensions.<br />
The benefits of adopting this approach would be immense!<br />
Author Profiles<br />
Mosesraj R<br />
Head of Quality at <strong>Collabera</strong> Solutions Private Limited<br />
Comes with over 14 years of experience<br />
Previously was associated with Infosys Technologies as Principal – Quality programs<br />
and with MRF Tyres as production officer. He has done his B.Tech in Mechanical<br />
Engineering from Government College of Engineering, Salem and M.S in software<br />
systems from BITS, Pilani. He was a key agent in shifting gears to high maturity<br />
journey in <strong>Collabera</strong>. Manages the quality team in <strong>Collabera</strong> and is the key thinker<br />
for change management initiatives<br />
Smitha Thumbikkat<br />
Senior Lead at <strong>Collabera</strong> Solutions Private Limited<br />
- 9 Years of Experience<br />
She was previously associated with Sobha Renaissance Information Technology as<br />
Quality Manager. She currently anchors strategic change management initiatives in<br />
<strong>Collabera</strong>. She is a B.Tech in Electrical and Electronics Engineering from Government<br />
College of Engineering under University of Calicut. She anchors the CSAT initiative<br />
and her key strengths include program management, managing improvement work<br />
groups, software quality and managing organizational change.<br />
Appendix<br />
• CRUX: In house methodology at <strong>Collabera</strong> to drive performance<br />
improvement.<br />
o C- Critical Area To Improve<br />
o R - Recognise Leading Factors<br />
o U - ensUre Stability<br />
o X - eXcellence<br />
• CSAT – Customer Satisfaction<br />
• OPI – Organisation Performance Improvement<br />
• PPM – Process Performance Model<br />
• SIT – System and Integration Testing<br />
• ODC – orthogonal Defect classification<br />
• ROI – Return On Investment<br />
• SPECTRUM : A comprehensive approach of account/project performance<br />
reviews by management<br />
References<br />
Bridging the eagle’s eye and worms view
• CRUX - <strong>Collabera</strong> methodology for High Maturity.pdf – presented as part of<br />
WoPSEM conference 2010<br />
• Management 9 th edition by Robbins<br />
• Why Six Sigma projects often fail - article on WSJ in January 2010 by Satya<br />
Chakravorty.<br />
Bridging the eagle’s eye and worms view
www.collabera.com<br />
Bridging the eagle’s eye and worms view