download pdf - Utah Geological Survey - Utah.gov
download pdf - Utah Geological Survey - Utah.gov
download pdf - Utah Geological Survey - Utah.gov

Create successful ePaper yourself
Turn your PDF publications into a flip-book with our unique Google optimized e-Paper software.
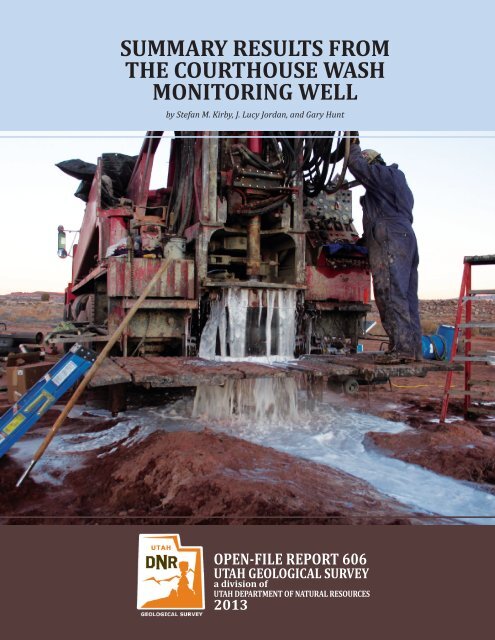
SUMMARY RESULTS FROM<br />
THE COURTHOUSE WASH<br />
MONITORING WELL<br />
by Stefan M. Kirby, J. Lucy Jordan, and Gary Hunt<br />
OPEN-FILE REPORT 606<br />
UTAH GEOLOGICAL SURVEY<br />
a division of<br />
UTAH DEPARTMENT OF NATURAL RESOURCES<br />
2013
SUMMARY RESULTS FROM<br />
THE COURTHOUSE WASH<br />
MONITORING WELL<br />
by Stefan M. Kirby, J. Lucy Jordan, and Gary Hunt<br />
Cover photo: Water flowing from the Courthouse Wash monitoring well borehole drilled<br />
into the Entrada Sandstone. Photo provided by James Harte, National Park Service, Water<br />
Resources Division<br />
OPEN-FILE REPORT 606<br />
UTAH GEOLOGICAL SURVEY<br />
a division of<br />
UTAH DEPARTMENT OF NATURAL RESOURCES<br />
2013
STATE OF UTAH<br />
Gary R. Herbert, Governor<br />
DEPARTMENT OF NATURAL RESOURCES<br />
Michael Styler, Executive Director<br />
UTAH GEOLOGICAL SURVEY<br />
Richard G. Allis, Director<br />
PUBLICATIONS<br />
contact<br />
Natural Resources Map & Bookstore<br />
1594 W. North Temple<br />
Salt Lake City, UT 84116<br />
telephone: 801-537-3320<br />
toll-free: 1-888-UTAH MAP<br />
website: mapstore.utah.<strong>gov</strong><br />
email: geostore@utah.<strong>gov</strong><br />
UTAH GEOLOGICAL SURVEY<br />
contact<br />
1594 W. North Temple, Suite 3110<br />
Salt Lake City, UT 84116<br />
telephone: 801-537-3300<br />
website: geology.utah.<strong>gov</strong><br />
This open-file report makes information available to the public that may not conform to UGS technical, editorial,<br />
or policy standards. Therefore it may be premature for an individual or group to take actions based on its<br />
contents. Although this product represents the work of professional scientists, the <strong>Utah</strong> Department of Natural<br />
Resources, <strong>Utah</strong> <strong>Geological</strong> <strong>Survey</strong>, makes no warranty, expressed or implied regarding its suitability for a<br />
particular use. The <strong>Utah</strong> Department of Natural Resources, <strong>Utah</strong> <strong>Geological</strong> <strong>Survey</strong>, shall not be liable under any<br />
circumstances for any direct, indirect, special, incidental, or consequential damages with respect to claims by<br />
users of this product.
CONTENTS<br />
EXECUTIVE SUMMARY................................................................................................................................................................................................................. 1<br />
INTRODUCTION.............................................................................................................................................................................................................................. 1<br />
WELL DRILLING SUMMARY....................................................................................................................................................................................................... 1<br />
WATER LEVEL DATA...................................................................................................................................................................................................................... 3<br />
GROUNDWATER SAMPLING...................................................................................................................................................................................................... 4<br />
SOLUTE CHEMISTRY RESULTS................................................................................................................................................................................................. 5<br />
ISOTOPIC RESULTS........................................................................................................................................................................................................................ 5<br />
DISSOLVED GAS RESULTS........................................................................................................................................................................................................... 7<br />
SUMMARY AND CONCLUSIONS................................................................................................................................................................................................ 8<br />
ACKNOWLEDGMENTS.................................................................................................................................................................................................................. 8<br />
REFERENCES.................................................................................................................................................................................................................................... 8<br />
FIGURES<br />
Figure 1. Monitoring well location map................................................................................................................................................................................ 2<br />
Figure 2. Summary lithologic log for the Courthouse Wash monitoring well...................................................................................................... 3<br />
Figure 3. Courthouse Wash monitoring well completion plan................................................................................................................................... 3<br />
Figure 4. Water levels based on transducer data for the Courthouse Wash monitoring well....................................................................... 4<br />
Figure 5. Piper diagram of Courthouse Wash samples................................................................................................................................................... 6<br />
Figure 6. Stable isotope plot....................................................................................................................................................................................................... 6<br />
TABLES<br />
Table 1. Field parameters and site locations....................................................................................................................................................................... 4<br />
Table 2. General chemistry results.......................................................................................................................................................................................... 5<br />
Table 3. Isotopic results.............................................................................................................................................................................................................. 6<br />
Table 4. Dissolved gas results.................................................................................................................................................................................................... 7
SUMMARY RESULTS FROM THE<br />
COURTHOUSE WASH MONITORING WELL<br />
by Stefan M. Kirby, J. Lucy Jordan, and Gary Hunt<br />
EXECUTIVE SUMMARY<br />
This open-file report presents results from a new groundwater<br />
monitoring well and groundwater sampling campaign<br />
in the Courthouse Wash area near Moab, <strong>Utah</strong>. The<br />
purpose of the monitoring well and new groundwater<br />
samples is to better delineate the relationship between<br />
groundwater that supplies important springs within Arches<br />
National Park, and groundwater beneath the upper<br />
portions of Courthouse Wash that may experience development<br />
in the future. The monitoring well was designed<br />
as a single borehole that penetrates both the Navajo and<br />
Entrada aquifers, directly upgradient of Courthouse Wash<br />
Boundary Spring. The borehole was completed with two<br />
separate piezometers, one near the base of the Entrada<br />
aquifer and the other near the top of the Navajo aquifer.<br />
Water levels range from approximately 35 feet below top<br />
of casing for the Navajo completion to approximately 7 to<br />
11 feet above top of casing for the Entrada completion.<br />
Total offset between the two water levels is approximately<br />
43 feet. Groundwater samples were collected from the Entrada<br />
and Navajo completions and the nearby Courthouse<br />
Wash Boundary Spring. Groundwater chemistry is unique<br />
for each of the three samples and the Entrada completion<br />
has significantly higher concentrations of Na, Cl, HCO3,<br />
and SO4 than either the Navajo completion or Courthouse<br />
Wash Boundary Spring. Stable isotopic ratios and concentrations<br />
of percent modern carbon and tritium are also<br />
unique for each sample. Both the Navajo and Entrada completions<br />
have no evidence of modern recharge and these<br />
samples likely contain water recharged tens of thousands<br />
of years ago. Courthouse Wash Boundary Spring likely<br />
contains a mixture of young water recharged since 1950<br />
and older water recharged more than 4000 years ago. The<br />
dissolved gas concentrations and modeled recharge temperatures<br />
are unique for each of the three samples. The<br />
calculated recharge temperatures are between 10°C for<br />
Courthouse Wash Boundary Spring and 7 and 6°C for the<br />
Entrada and Navajo completions respectively. Taken together<br />
the results presented here suggest little if any connection<br />
between the Entrada and Navajo aquifers at the<br />
monitoring well site. These results may, however, only be<br />
valid for static predevelopment conditions at the monitoring<br />
well location. Future groundwater development<br />
should include tests of the connection between the Entrada<br />
and Navajo aquifer under realistic pumping scenarios<br />
to confirm the hydrologic separation of these two aquifers.<br />
INTRODUCTION<br />
This open-file report presents data and describes results<br />
from a new groundwater monitoring well and groundwater<br />
sampling campaign in the Courthouse Wash area<br />
near Moab, <strong>Utah</strong>. The purpose of the monitoring well and<br />
new groundwater samples is to better delineate the relationship<br />
between groundwater that supplies important<br />
springs within Arches National Park, and groundwater beneath<br />
the upper portions of Courthouse Wash.<br />
Groundwater in the Courthouse Wash area resides in several<br />
aquifers, including the Navajo Sandstone, the Slick<br />
Rock Member of the Entrada Sandstone, the Moab Member<br />
of the Curtis Formation, and other consolidated and<br />
unconsolidated units (Rush and others, 1982; Doelling<br />
and Morgan, 2000; Hurlow and Bishop, 2003). For subsequent<br />
discussions the Slick Rock Member and the Moab<br />
Member are considered part of the larger Entrada aquifer<br />
system. Groundwater from the Entrada aquifer provides<br />
flow at important perennial springs in Arches National<br />
Park, including Courthouse Wash Boundary Spring.<br />
Groundwater from the Entrada and Navajo aquifers also<br />
supports culinary uses and irrigation at several sites near<br />
Courthouse Wash. The Entrada aquifer is separated from<br />
the underlying Navajo aquifer by the potentially impermeable<br />
Dewey Bridge Member of the Carmel Formation. The<br />
degree of connection, if any, between the Navajo and Entrada<br />
aquifers is unknown and critical to current and future<br />
groundwater development in areas outside of Arches<br />
National Park in the Courthouse Wash area. The purpose<br />
of the new monitoring well and groundwater samples is to<br />
test the hydrologic connection between the Entrada and<br />
Navajo aquifers upgradient of important springs in Arches<br />
National Park.<br />
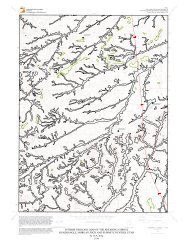
WELL DRILLING SUMMARY<br />
The monitoring well was designed as a single borehole<br />
that penetrates both the Navajo and Entrada aquifers, directly<br />
upgradient of Courthouse Wash Boundary Spring
2<br />
along the Willow Springs Road, on land managed by the<br />
<strong>Utah</strong> State and Institutional Trust Lands Administration<br />
(figure 1). The well was drilled and completed in January<br />
2012 by the U.S. <strong>Geological</strong> <strong>Survey</strong> western region scientific<br />
drill crew. The well was mud logged during drilling and<br />
109°45'0"W<br />
<strong>Utah</strong> <strong>Geological</strong> <strong>Survey</strong><br />
geophysically logged by <strong>Utah</strong> <strong>Geological</strong> <strong>Survey</strong> personnel<br />
after the borehole reached a total depth of 880 feet (figure<br />
2) (complete lithologic and geophysical logs are available<br />
at http://waterrights.utah.<strong>gov</strong>/wellinfo/welldrilling/wlbrowse.aspWIN=435519).<br />
109°37'30"W<br />
38°45'0"N<br />
38°45'0"N<br />
Monitoring well<br />
location<br />
Courthouse Wash<br />
Boundary Spring<br />
109°37'30"W<br />
¯<br />
Explanation<br />
State Trust Lands<br />
0 0.5 1 1.5 2<br />
Miles<br />
Kilometers<br />
0 0.6 1.2 1.8 2.4<br />
Arches National Park Boundary<br />
Figure 1. Monitoring well location map.
Summary of results from the Courthouse Wash monitoring well 3<br />
Unconsolidated deposits of sand and gravel were encountered<br />
from the land surface to a depth of 25 feet. Between<br />
the depths of 25 feet and 195 feet the borehole encountered<br />
members of the Morrison and Summerville Formations.<br />
The Entrada aquifer, including the Moab Member<br />
of the Curtis Formation and the Slick Rock Member of the<br />
Entrada Sandstone, was encountered from depths of 195<br />
to 715 feet. The Dewey Bridge Member of the Carmel Formation<br />
was encountered between 715 and 840 feet and<br />
the Navajo Sandstone was encountered from 840 feet to<br />
the total depth of 880 feet. The results of logging were<br />
used to plan completion of the well with two piezometers,<br />
one screened in uppermost Navajo aquifer and the other<br />
screened in the lower Entrada aquifer (figure 3).<br />
WATER LEVEL DATA<br />
Water levels in the two monitoring well piezometers have<br />
been measured directly several times since completion of<br />
the well. They range from approximately 35 below top of<br />
casing for the Navajo completion to approximately 7 to 11<br />
Land Surface<br />
feet above top of casing for the Entrada completion. The<br />
Entrada completion is flowing and direct measurement<br />
of this completion is difficult due to slow head buildup<br />
and the height above casing to which the water level will<br />
rise. Because of this, head values (approximately 7.5 feet<br />
above top of casing) taken from a transducer in the sealed<br />
Entrada completion likely represent the best estimate of<br />
head for this piezometer (figure 4). Groundwater elevations<br />
adjusted for piezometer stickup and land surface elevation<br />
range from approximately 4315 feet for the Navajo<br />
completion to 4358 feet for the Entrada completion. Total<br />
offset between the two water levels is approximately 43<br />
feet and groundwater elevation for both completions varies<br />
little over the period of record. Additional water level<br />
information is available from the U.S. <strong>Geological</strong> <strong>Survey</strong> at<br />
http://waterdata.usgs.<strong>gov</strong>/nwis/inventoryagency_<br />
code=USGS&site_no=384149109400901 and http://<br />
waterdata.usgs.<strong>gov</strong>/nwis/inventoryagency_<br />
code=USGS&site_no=384149109400902.<br />
Not to Scale<br />
B<br />
A<br />
Steel Surface Stickup<br />
24-36 inches above<br />
ground level<br />
Land Surface<br />
Unconsolidated sand gravel<br />
25 ft<br />
Morrison Formation and<br />
Summerville Formation undivided<br />
Bentonite grout<br />
660 ft<br />
Total depth 880 ft<br />
Not to scale<br />
Not to scale<br />
Moab Member of<br />
the Curtis Formation<br />
Slick Rock Member<br />
of the Entrada Sandstone<br />
Dewey Bridge Member<br />
of the Carmel Formation<br />
Navajo Sandstone<br />
195 ft<br />
315 ft<br />
715 ft<br />
840 ft<br />
Figure 2. Summary lithologic log for the Courthouse Wash<br />
monitoring well.<br />
Sand 40 ft<br />
850'<br />
Sand 30 ft<br />
860'<br />
Screen B<br />
20 ft<br />
880'<br />
660'<br />
700'<br />
Bentonite grout<br />
150 ft<br />
670'<br />
Screen A<br />
20 ft<br />
690'<br />
Figure 3. Courthouse Wash monitoring well completion plan.
4<br />
GROUNDWATER SAMPLING<br />
Groundwater samples were collected using standard U.S.<br />
<strong>Geological</strong> <strong>Survey</strong> field techniques summarized by Wilde<br />
and others (1998). Each piezometer was purged of at least<br />
3 well volumes prior to sampling, either using a downhole<br />
sampling pump in the case of the Navajo completion<br />
or by allowing the well to flow for an extended period in<br />
the case of the Entrada completion. Samples collected<br />
from Courthouse Wash Boundary Spring were collected<br />
via a peristaltic pump from the deepest part of the large<br />
spring pool near the point of seepage. Samples were collected<br />
in triplicate in thoroughly rinsed, brown one-liter<br />
glass bottles with sealed polycone caps. Each bottle was<br />
sealed with electrical tape at the sampling site and kept<br />
<strong>Utah</strong> <strong>Geological</strong> <strong>Survey</strong><br />
iced until delivery to the Brigham Young University Hydrogeology<br />
Laboratory. Field parameters including temperature,<br />
specific conductance, pH, and dissolved oxygen were<br />
measured at the time of sampling using a Hydrolab Quanta<br />
multi-parameter meter that was periodically calibrated<br />
with reference solutions (table 1). Samples for dissolved<br />
gas analysis were collected using standard diffusion samplers<br />
placed in the purged piezometers at a depth of 30<br />
feet below water level or the deepest part of the spring<br />
pool. Diffusion samplers were allowed to equilibrate for<br />
24 hours prior to retrieval.<br />
All laboratory work for groundwater samples, except carbon<br />
isotopes, was performed at the Brigham Young University<br />
Hydrogeology Lab. Concentrations of major dissolved<br />
anions and cations, and dissolved nitrate were de-<br />
4365<br />
4360<br />
4355<br />
Groundwater elevation (ft)<br />
4350<br />
4345<br />
4340<br />
4335<br />
4330<br />
4325<br />
Entrada Completion<br />
Navajo Completion<br />
4320<br />
4315<br />
4310<br />
03/02/12 05/01/12 06/30/12 08/29/12 10/28/12<br />
Date<br />
Figure 4. Water levels based on transducer data for the Courthouse Wash monitoring well.<br />
Table 1. Field parameters and site locations.<br />
Name East (m) 1 North (m) Elevation (ft) 2 Sample date Time Flow rate (gpm) Temp °C DO (mg/L) 3 Cond (µS/cm) 4 pH<br />
Entrada completion 615720 4283983 4330 5/22/12 11:13 0.15 15.4 0.16 3535 7.74<br />
Navajo completion 615720 4283983 4330 5/22/12 15:20 3.5 15.7 2.8 693 7.51<br />
CHW Boundary Spring 617234 4282707 4297 5/23/12 9:10 ~3 16.3 2.4 832 7.14<br />
1<br />
Location coordinates in NAD 83 UTM zone 12 projection<br />
2<br />
Land surface elevation at sampling site<br />
3<br />
Dissolved oxygen<br />
4<br />
Conductivity
Summary of results from the Courthouse Wash monitoring well 5<br />
termined using standard techniques presented in Fishman<br />
and Friedman (1989) and Fishman (1993). Carbon isotope<br />
analyses were performed at the University of Georgia Center<br />
for Applied Isotope Studies via accelerator mass spectrometry<br />
(AMS) techniques. Dissolved gas samples were<br />
analyzed at the University of <strong>Utah</strong> Dissolved Gas Lab.<br />
these TDS concentrations both the Navajo completion and<br />
Courthouse Wash Boundary Spring having drinking water<br />
quality water. The Entrada completion is lower quality and<br />
not drinking water quality. Nitrate concentrations were<br />
below detection for all sites.<br />
SOLUTE CHEMISTRY RESULTS<br />
Groundwater type chemistry ranges from Na-SO4-HCO3<br />
for the Entrada completion to Na-Mg-HCO3-SO4 for the<br />
Navajo completion to Na-Ca-Mg-HCO3-SO4 for Courthouse<br />
Wash Boundary Spring (table 2). A piper plot shows<br />
the relative concentrations of solutes for the three samples<br />
(figure 5). The Entrada completion has significantly higher<br />
concentrations of Na, Cl, HCO3, and SO4 than either the<br />
Navajo completion or Courthouse Wash Boundary Spring.<br />
Water quality of the Entrada completion is consequently<br />
much lower than that of either the Navajo completion or<br />
Courthouse Wash Boundary Spring. Total dissolved solids<br />
range from 502 for the Navajo completion to 648 mg/L for<br />
Courthouse Wash Boundary Spring. The Entrada completion<br />
has significantly higher TDS of 3138 mg/L. Based on<br />
ISOTOPIC RESULTS<br />
Water samples were analyzed for the stable isotope ratios<br />
δ 18 O and δD at the Brigham Young University Hydrogeology<br />
Lab with a Finnigan Delta plus isotope ratio mass spectrometer<br />
using methods similar to that described by Mc-<br />
Crea (1950), Epstein and Mayeda (1953), and Gehre and<br />
others (1996). δ 18 O and δD values were normalized to the<br />
VSMOW/SLAP scale following the procedure of Coplen<br />
(1988), Nelson (2000), and Nelson and Dettman (2001).<br />
Stable isotope data are plotted versus the meteoric water<br />
line of Craig (1961) and a local <strong>Utah</strong> meteoric water line<br />
of Kendall and Coplen (2001) on figure 6. Stable isotope<br />
composition of all samples are distinct from one another,<br />
but lie along a trend below and parallel to the <strong>Utah</strong> meteoric<br />
water line. Samples from the Navajo and Entrada<br />
Table 2. General chemistry results.<br />
Name Entrada completion Navajo completion CHW Boundary Spring<br />
Water type 1 Na-SO4-HCO3 Na-Mg-HCO3-SO4 Na-Ca-Mg-HCO3-SO4<br />
TDS (mg/L) 2 3138 502 648<br />
Ca(mg/L) 44.33 22.06 48.29<br />
Mg(mg/L) 5.97 19.27 28.27<br />
Na(mg/L) 907.60 80.13 85.02<br />
K(mg/L) 8.41 7.85 5.36<br />
Cl(mg/L) 122.31 40.49 11.04<br />
HCO3(mg/L) 794.20 239.20 293.60<br />
SO4(mg/L) 1255.50 92.79 176.45<br />
HPO4(mg/L) 2.36
6<br />
completions are depleted (lower) relative to Courthouse<br />
Wash Boundary Spring (table 3). Depleted or lower values<br />
of δ 18 O and δD may occur due to relatively cool recharge<br />
resulting from cool season precipitation, cool higher elevation<br />
recharge, or recharge under cooler climate conditions.<br />
Tritium was measured by the University of <strong>Utah</strong> Dissolved<br />
Gas Laboratory via a tritium/ 3 He ingrowth method detailed<br />
by Solomon and Cook (2000). This method measures<br />
the concentration of the daughter product of the<br />
radioactive decay of tritium, the 3 He isotope, during a discrete<br />
interval.<br />
Tritium data provide qualitative evidence for the presence<br />
of modern water recharged since 1950. All samples having<br />
tritium concentrations greater than 0.5 TU likely contain<br />
at least a portion of modern water recharged since the<br />
1950's, and samples having tritium values less than 0.5 TU<br />
likely represent water recharged prior to 1950 (Clark and<br />
Fritz, 1997). Tritium concentration at Courthouse Wash<br />
Boundary Spring is 0.7 TU, indicating a component of<br />
modern recharge for Courthouse Wash Boundary Spring.<br />
Both the Entrada and Navajo completions have tritium<br />
concentrations less than 0.5 TU and therefore have no evidence<br />
of water recharged in the last 50 years.<br />
<strong>Utah</strong> <strong>Geological</strong> <strong>Survey</strong><br />
Samples for carbon isotope analysis were processed to<br />
concentrate at the Brigham Young University Hydrogeology<br />
Lab. Concentrate was shipped to the University of<br />
Georgia Center for Applied Isotope Studies and analyzed<br />
by AMS. Samples were analyzed for δ l3 C and 14 C using a<br />
National Electrostatics Corporation Model 1.5SDH-I AMS.<br />
δ 13 C values were calculated using standard methods described<br />
by Coplen (1996). 14 C data is expressed as percent<br />
modern carbon (pmc) by comparing measured 14 C activities<br />
against the activity of a National Bureau of Standards<br />
oxalic acid reference solution.<br />
All samples have pmc values less than 50 and therefore<br />
have a significant component of water recharged more<br />
than a thousand years ago. The Entrada and Navajo completions<br />
have pmc of 1.65 and 6.64 respectively. These<br />
low pmc concentrations indicate water that may have recharged<br />
more than 20,000 years ago. Courthouse Wash<br />
Boundary Spring has a higher pmc concentration of 35<br />
and may consist of water recharged 4000 to 6000 years<br />
ago.<br />
Tritium and pmc concentrations each provide indepen-<br />
80<br />
80<br />
-90<br />
60<br />
80<br />
20<br />
40<br />
Cl + SO4<br />
60<br />
CHW Boundary Spring<br />
60<br />
Ca + Mg<br />
40<br />
20<br />
Navajo completion<br />
Mg<br />
SO4<br />
80<br />
Entrada completion<br />
Entrada completion<br />
60<br />
δ 2 Η (‰)<br />
-95<br />
-100<br />
-105<br />
Global Meteoric Water Line (Craig, 1961)<br />
<strong>Utah</strong> Meteoric Water Line (Kendall and Coplen, 2001)<br />
Entrada completion<br />
CHW Boundary Spring<br />
40<br />
CHW Boundary Spring<br />
CHW Boundary Spring<br />
40<br />
-110<br />
Navajo completion<br />
20<br />
Navajo completion<br />
Navajo completion<br />
20<br />
Ca<br />
80<br />
60<br />
Entrada completion<br />
40<br />
20<br />
Na + K<br />
20<br />
40<br />
HCO3 + CO3<br />
60<br />
80<br />
Cl<br />
-115<br />
-15 -14 -13 -12 -11<br />
δ 18 Ο (‰)<br />
Figure 5. Piper diagram of Courthouse Wash samples.<br />
Figure 6. Stable isotope plot.<br />
Table 3. Isotopic results.<br />
Name 1 δ 2 H δ 18 O Tritium (TU) pmc 2 δ l3 C<br />
Entrada completion -107(0.5) -12.9(0.2) 0.08(0.05) 1.65(0.02) -6.39(0.04)<br />
Navajo completion -109.6(0.5) -13.43(0.2) 0.08(0.07) 6.64(0.04) -9.84(0.04)<br />
CHW Boundary Spring -97.3(0.5) -11.77(0.2) 0.70(0.06) 35.01(0.13) -13.82(0.04)<br />
1<br />
Isotopic results; values in parenthesis are the lab reported error range<br />
2<br />
Percent modern carbon
Summary of results from the Courthouse Wash monitoring well 7<br />
dent measure of the age of recharge of a given sample.<br />
Taken together these data show no evidence of modern recharge<br />
at the Navajo and Entrada completions, and these<br />
samples likely contain water recharged tens of thousands<br />
of years ago. Based on tritium and pmc data Courthouse<br />
Wash Boundary Spring contains a mixture of young water<br />
recharged since 1950 and older water recharged more<br />
than 4000 years ago.<br />
DISSOLVED GAS RESULTS<br />
Dissolved noble gases in groundwater provide information<br />
concerning the temperature and pressure conditions<br />
at which recharge occurred. By assuming elevation<br />
(pressure) at the time of recharge and the effect of excess<br />
air dissolved in recharging groundwater, it is possible to<br />
model the temperature under which recharge occurred<br />
(Aeschbach-Hertig and others, 2000). Water recharging<br />
within a few hundred feet of the land surface generally<br />
equilibrates at a temperature equal to the mean annual<br />
temperature at a given location. In the Courthouse Wash<br />
area the current mean annual temperature is approximately<br />
15°C and recently recharged samples should have<br />
recharge temperatures near this value.<br />
The dissolved gas concentrations were measured at the<br />
University of <strong>Utah</strong> Dissolved Gas Lab. The dissolved gas<br />
recharge temperature was calculated using measured concentrations<br />
of 4 He, 20 Ne, 40 Ar, 84 Kr, and 129 Xe via the closed<br />
equilibrium (CE) dissolved gas model (Aeschbach-Hertig<br />
and others, 2000). Multiple iterations of the CE model<br />
were run via an Excel spreadsheet and macro provided<br />
by the University of <strong>Utah</strong> Dissolved Gas Laboratory. The<br />
model requires the assumption of recharge elevation and<br />
this can reasonably vary between the elevation at the sampling<br />
site and the topographic high within the area possibly<br />
contributing recharge to a given site. Lacking any other<br />
information concerning the elevation of recharge, the preferred<br />
temperature of recharge is calculated based on the<br />
average of possible high and low elevations for a given site.<br />
The dissolved gas concentrations and modeled recharge<br />
temperatures are unique for each of the three samples<br />
(table 4). The calculated recharge temperatures are between<br />
10°C for Courthouse Wash Boundary Spring and 7<br />
and 6°C for the Entrada and Navajo completions, respectively.<br />
Low recharge temperatures, less than 10°C may<br />
result from recharge under cooler climatic conditions and<br />
pmc data for these sites may further support this interpretation.<br />
The 10°C recharge temperature for Courthouse<br />
Wash Boundary Spring is less than expected for modern<br />
recharge in the area and may indicate a component of<br />
old water, with a cool recharge temperature mixed with<br />
younger water, with a warm recharge temperature.<br />
Table 4. Dissolved gas results.<br />
Name Entrada completion Navajo completion CHW Boundary Spring<br />
Sampling Date 5/23/12 5/23/12 5/23/12<br />
TDGP (mmHg) 1 638 687 603<br />
N 2<br />
(ccSTP/g) 1.32E-02 1.41E-02 1.21E-02<br />
CH 4<br />
(ccSTP/g) 3.78E-05 6.01E-05 7.23E-04<br />
4 He(ccSTP/g) 2.72E-06 5.26E-07 3.57E-07<br />
20 Ne(ccSTP/g) 1.58E-07 2.14E-07 1.52E-07<br />
40 Ar(ccSTP/g) 3.50E-04 3.91E-04 3.25E-04<br />
84<br />
Kr(ccSTP/g) 4.49E-08 4.98E-08 4.24E-08<br />
129 Xe(ccSTP/g) 3.13E-09 3.17E-09 2.76E-09<br />
Hrmin (ft) 2 4330 4330 4297<br />
Trmax (°C) 8.1 7.4 11.4<br />
Hrmax (ft) 3 6316 6316 6316<br />
Trmin (°C) 6.0 5.2 8.8<br />
Hravg (ft) 4 5322 5322 5306<br />
Travg (°C) 7.2 6.3 10.0<br />
χ 2 5 1.36 2.49 1.14<br />
1<br />
Total dissolved gas pressure measured at position of diffusion sampler.<br />
2<br />
Minimum recharge elevation, equal to the land surface elevation at the sample site.<br />
Used as input to calculate the maximum possible recharge temperature Trmax.<br />
3<br />
Maximum recharge elevation, equal to the highest elevation at which recharge may occur upgradient of a given sample.<br />
Used as input to calculate the minimum possible recharge temperature Trmin.<br />
4<br />
Average elevation of recharge taken as the average between the minimum and maximum recharge elevation.<br />
Used as input to calculate the average recharge temperature Travg.<br />
5<br />
Chi-squared misfit between measured and modeled recharge parameters for the average recharge temperatures.
8<br />
<strong>Utah</strong> <strong>Geological</strong> <strong>Survey</strong><br />
SUMMARY AND CONCLUSIONS<br />
The Courthouse Wash monitoring well was drilled and<br />
completed in January 2012 with two separate piezometers,<br />
one near the base of the Entrada aquifer and the<br />
other near the top of the Navajo aquifer. Screened intervals<br />
in each case were 20 feet for both the Entrada and Navajo<br />
completions. Water levels range from approximately 35<br />
feet below top of casing for the Navajo completion to approximately<br />
7 to 11 feet above top of casing for the Entrada<br />
completion. Total offset between the two water levels<br />
is approximately 43 feet. Water levels have changed little<br />
over the period of record.<br />
Groundwater chemistry, isotopic, and dissolved gas samples<br />
were collected from the Navajo and Entrada completions<br />
and nearby Courthouse Wash Boundary Spring.<br />
Groundwater chemistry is unique for each of the three<br />
samples and the Entrada completion has significantly<br />
higher concentrations of Na, Cl, HCO3, and SO4 than either<br />
the Navajo completion or Courthouse Wash Boundary<br />
Spring. Water quality is good for both the Navajo completion<br />
and Courthouse Wash Boundary Spring.<br />
Stable isotopic ratios and concentrations of percent modern<br />
carbon and tritium are also unique for each sample<br />
location. Both the Navajo and Entrada completions have<br />
no evidence of modern recharge and these samples likely<br />
contain water recharged tens of thousands of years ago.<br />
Courthouse Wash Boundary Spring likely contains a mixture<br />
of young water recharged since 1950 and older water<br />
recharged more than 4000 years ago. The dissolved gas<br />
concentrations and modeled recharge temperatures are<br />
unique for each of the three samples. The calculated recharge<br />
temperatures are between 10°C for Courthouse<br />
Wash Boundary Spring and 7 and 6°C for the Entrada and<br />
Navajo completions respectively.<br />
Taken together the results presented here suggest little if<br />
any connection between the Entrada and Navajo aquifers<br />
at the monitoring well site. These results may only be valid<br />
for static predevelopment conditions at the monitoring<br />
well location.<br />
In addition to the potential for direct interference between<br />
new wells completed in the Entrada or Navajo aquifers<br />
with existing springs and wells, large scale lowering of<br />
the water table across the Courthouse Wash area could increase<br />
the downward groundwater gradient between the<br />
Entrada aquifer and the underlying Navajo aquifer. Such a<br />
reduction in regional water tables could vastly reduce flow<br />
at springs in Arches National Park as well as lower water<br />
levels at existing wells completed in the Entrada aquifer.<br />
Future groundwater development should include tests of<br />
the connection between the Entrada and Navajo aquifer<br />
under realistic pumping scenarios to confirm the hydrologic<br />
separation of these two aquifers.<br />
ACKNOWLEDGMENTS<br />
Funding for the monitoring well installation, groundwater<br />
sampling, and interpretation was provided by the <strong>Utah</strong><br />
Division of Water Rights, Grand County, and the National<br />
Park Service Water Resources Division. We thank Mike<br />
Lowe, Robert Ressetar, Kimm Harty, and Rick Allis for reviews<br />
that improved the content and clarity of this report.<br />
REFERENCES<br />
Aeschbach-Hertig, W., Peeters, F., Beyerle, U., and Kipfer,<br />
R., 2000, Paleotemperature reconstruction from noble<br />
gases in ground water taking into account equilibration<br />
with entrapped air: Nature, vol. 405, p. 1040–<br />
1043.<br />
Clark, I., and Fritz, P., 1997, Environmental isotopes in<br />
hydrogeology: New York, Lewis Publishers, 328 p.<br />
Coplen, T.B., 1988, Normalization of oxygen and hydrogen<br />
isotope data: Chemical Geology, v. 72, p. 293–297.<br />
Coplen, T.B., 1996, New guidelines for reporting stable<br />
hydrogen, carbon and oxygen isotope-ratio data: Geochemica<br />
et Cosmochimica Acta, v. 37, p.3359–3360.<br />
Craig, H., 1961, Isotopic variations in meteoric waters: Science,<br />
v. 133, p. 1833–1834.<br />
Doelling, H.H., and Morgan, C.D., 2000, Geologic map of the<br />
Merrimac Butte quadrangle, Grand County, <strong>Utah</strong>: <strong>Utah</strong><br />
<strong>Geological</strong> <strong>Survey</strong>, Map 178, 1:24,000 scale.<br />
Epstein, S., and Mayeda, T.K., 1953, Variations in the<br />
18 O/ 16 O ratio in natural waters: Geochimica et Cosmochimica<br />
Acta, v. 4, p. 213–224.<br />
Fishman, M.J., ed., 1993, Methods of analysis by the U.S.<br />
<strong>Geological</strong> <strong>Survey</strong> National Water Quality Laboratory—Determination<br />
of inorganic and organic constituents<br />
in water and fluvial sediments: U.S. <strong>Geological</strong><br />
<strong>Survey</strong> Open-File Report 93-125, 27 p.<br />
Fishman, M.J., and Friedman, L.C., 1989, Methods for<br />
determination of inorganic substances in water and<br />
fluvial sediments: U.S. <strong>Geological</strong> <strong>Survey</strong> Techniques<br />
of Water-Resources Investigations, book 5, chap. 41,<br />
545 p.<br />
Gehre, M., Hoefling, R., and Kowski, P., 1996, Sample preparation<br />
device for quantitative hydrogen isotope analysis<br />
using chromium metal: Analytical Chemistry, v. 68,<br />
p. 4414–4417.<br />
Kendall, C., and Coplen, T.B., 2001, Distribution of oxygen-18<br />
and deuterium in river waters across the United<br />
States: Hydrological Processes, v. 15, p. 1363–1393.
Summary of results from the Courthouse Wash monitoring well 9<br />
Hurlow, H.A., and Bishop, C.E., 2003, Recharge areas and<br />
geologic controls for the Courthouse Sevenmile Canyon<br />
Spring System, western Arches National Park,<br />
Grand County, <strong>Utah</strong>: <strong>Utah</strong> <strong>Geological</strong> <strong>Survey</strong> Special<br />
Study 108, 45 p.<br />
McCrea, J.M., 1950, On the isotopic chemistry of carbonates<br />
and a palaeotemperature scale: Journal of Physical<br />
Chemistry, v. 18, p. 849–857.<br />
Nelson, S.T., 2000, A simple, practical methodology for routine<br />
VSMOW/SLAP normalization of water samples<br />
analyzed by continuous flow methods: Rapid Communications<br />
in Mass Spectrometry, v.14, p. 1044–1046.<br />
Nelson, S.T., and Dettman, D., 2001, Improving hydrogen<br />
isotope ratio measurements for on-line Cr reduction<br />
systems: Rapid Communications in Mass Spectrometry,<br />
v. 15, p. 2301–2306.<br />
Rush, F.E., Whitfield, M.S., and Hart, I.M., 1982, Regional<br />
hydrology of the Green River–Moab area, northwestern<br />
Paradox Basin, <strong>Utah</strong>: U.S. <strong>Geological</strong> <strong>Survey</strong>, Open-<br />
File Report 82-107, 86 p.<br />
Solomon, D.K., and Cook, P.G., 2000, 3 H and 3 He, in Cook,<br />
P.G., and Herczeg, A.L., editors, Environmental tracers<br />
in subsurface hydrology: Boston, Kluwer Academic, p.<br />
397–424.<br />
Wilde, F.D., Radtke, D.B., Gibs, J., and Iwatsubo, R.T., editors,<br />
1998, National field manual for the collection of<br />
water-quality data: U.S. <strong>Geological</strong> <strong>Survey</strong> Techniques<br />
of Water-Resources Investigations book 9, chap. 44,<br />
103 p.