Natural Gas Market in China - CCOP
Natural Gas Market in China - CCOP
Natural Gas Market in China - CCOP

Create successful ePaper yourself
Turn your PDF publications into a flip-book with our unique Google optimized e-Paper software.
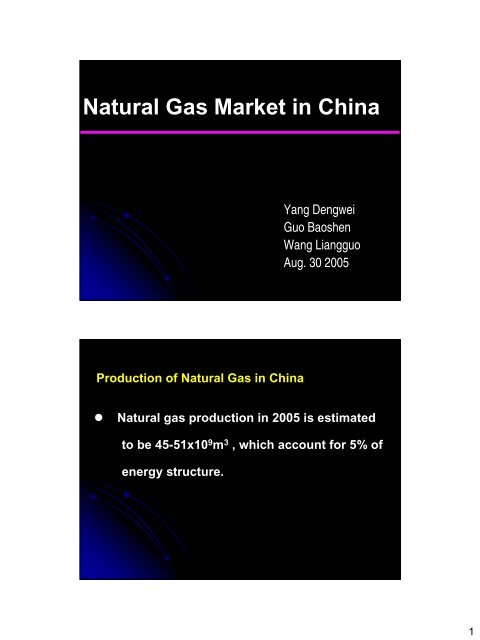
<strong>Natural</strong> <strong>Gas</strong> <strong>Market</strong> <strong>in</strong> Ch<strong>in</strong>a<br />
Yang Dengwei<br />
Guo Baoshen<br />
Wang Liangguo<br />
Aug. 30 2005<br />
Production of <strong>Natural</strong> <strong>Gas</strong> <strong>in</strong> Ch<strong>in</strong>a<br />
• <strong>Natural</strong> gas production <strong>in</strong> 2005 is estimated<br />
to be 45-51x10 9 m 3 , which account for 5% of<br />
energy structure.<br />
1
Petroliferous bas<strong>in</strong>s <strong>in</strong> Ch<strong>in</strong>a<br />
<strong>Natural</strong> <strong>Gas</strong> <strong>Market</strong> <strong>in</strong> Ch<strong>in</strong>a<br />
1.Southwest market centered at Chengdu and Chongq<strong>in</strong>g<br />
2. J<strong>in</strong>g- j<strong>in</strong> market centered at Beij<strong>in</strong>g and Tianj<strong>in</strong><br />
3. East Ch<strong>in</strong>a market centered at Nanj<strong>in</strong>g, Shanghai and<br />
Hangzhou<br />
4. Shandong market centered at Q<strong>in</strong>gdao and J<strong>in</strong>an<br />
5. Northeast Ch<strong>in</strong>a market centered at Changchun<br />
6. South Ch<strong>in</strong>a market centered at Guanzhou and Konggong<br />
7. Central market centered at Wuhan, Xian and Zhengzhou.<br />
2
<strong>Natural</strong> <strong>Gas</strong> Pipel<strong>in</strong>es <strong>in</strong> Ch<strong>in</strong>a<br />
Pipel<strong>in</strong>e network <strong>in</strong> the western Sichuan bas<strong>in</strong><br />
ChengDu<br />
3
Supply and demand of natural gas <strong>in</strong> Ch<strong>in</strong>a<br />
2000 2005 2010 2015 2020<br />
Production (10 8 m 3 ) 260 450-510 700-740 920 1050<br />
Demand (10 8 m 3 ) 280 530 950 1350 1600<br />
<strong>Natural</strong> gas consumption <strong>in</strong> Ch<strong>in</strong>a<br />
percentage <strong>in</strong> gas consumption<br />
Chemical <strong>in</strong>dustry 39<br />
Industrial fuel 32<br />
Residential & Commercial 24<br />
Electric power 5<br />
4
<strong>Natural</strong> gas consumption <strong>in</strong> Sichuan region<br />
consumption (10 8 m 3 )<br />
percentage<br />
Chemical fertilizer 49.5 49<br />
Other <strong>in</strong>dustry 38 37.6<br />
Residential 13 12.5<br />
Commercial 0.5 0.5<br />
Total 101 100<br />
Prediction of natural gas price <strong>in</strong> Western Sichuan<br />
Years 2004 2010 2015 2020<br />
Price (RMB/m 3 ) 0. 703 0.900 0. 981 1.091<br />
5
Prediction of exploration well cost <strong>in</strong> Western Sichuan<br />
Years 2004 2010 2015 2020<br />
Price (RMB/m 3 ) 3488 4882 6150 7418<br />
Government roles <strong>in</strong> the development of natural<br />
gas <strong>in</strong>dustry<br />
1. Encourag<strong>in</strong>g the exploration and development of<br />
natural gas .<br />
2. Policy support <strong>in</strong> tax<br />
VAT (Value-Added Tax) of natural gas is lower than that<br />
of crude oil<br />
3. Encourag<strong>in</strong>g the national oil companies to import LNG<br />
6
<strong>Natural</strong> gas price and pric<strong>in</strong>g mechanism <strong>in</strong> Ch<strong>in</strong>a<br />
1The natural gas price <strong>in</strong> Ch<strong>in</strong>a is obviously lower than that<br />
<strong>in</strong> <strong>in</strong>ternational market.<br />
The natural gas price <strong>in</strong> ch<strong>in</strong>a <strong>in</strong> 2003 is 0.619 RMB/m 3 ,<br />
while the natural gas price <strong>in</strong> <strong>in</strong>ternational marker <strong>in</strong> the<br />
same period is 1.8 RMB/m 3<br />
2There are two pric<strong>in</strong>g mechanism of natural gas <strong>in</strong> Ch<strong>in</strong>a<br />
The pric<strong>in</strong>g mechanism under marker competition<br />
The pric<strong>in</strong>g mechanism under government management<br />
3The natural gas price <strong>in</strong> Ch<strong>in</strong>a is basically<br />
determ<strong>in</strong>ed by government.<br />
4There is no unified price system of natural gas <strong>in</strong><br />
Ch<strong>in</strong>a due to restriction of gas pipel<strong>in</strong>e networks.<br />
In general, the natural gas price <strong>in</strong> economically<br />
developed regions is higher, which close to the<br />
natural gas price <strong>in</strong> <strong>in</strong>ternational market; the<br />
natural gas price <strong>in</strong> economically undeveloped<br />
regions is obviously lower.<br />
7
<strong>Gas</strong> Contract <strong>in</strong> Ch<strong>in</strong>a<br />
Long term TOP contract is essential:<br />
‣Pric<strong>in</strong>g elements:<br />
‣ <strong>Gas</strong> quality<br />
‣ Contract duration<br />
‣ Price competition with other energy<br />
oil<br />
coal<br />
hydroelectric power<br />
nuclear energy<br />
LNG<br />
‣ Transportation distance<br />
‣ Regional economy<br />
‣ Customer type<br />
Fiscal Terms<br />
Royalty – Offshore<br />
Royalty on gas from each field <strong>in</strong> the contract area is paid on<br />
the follow<strong>in</strong>g <strong>in</strong>cremental slid<strong>in</strong>g scale:<br />
Increments of Annual Gross Production<br />
Royalty Rate<br />
Billion cubic metres (m³) /year MMCFD* %<br />
< 2.0 < 200 0<br />
2.0 – 3.5 200 – 350 1<br />
3.5 –5.0 350 – 500 2<br />
> 5.0 > 500 3<br />
* assumes 35.3 cubic feet (CF) = 1 m³ (cubic metre)<br />
8
Royalty - Onshore:<br />
By amendment of the M<strong>in</strong>istry of F<strong>in</strong>ance on 28 July 1995<br />
royalty scales were established with different scales set for<br />
different regions as set out below:<br />
Royalty on <strong>Gas</strong> Fields -<br />
Q<strong>in</strong>hai Prov<strong>in</strong>ce, Tibet Autonomous Region, X<strong>in</strong>jian Vigur<br />
Autonomous Region and Shallow Sea Areas<br />
Increment Gross Production<br />
Royalty Rate<br />
Billion cubic metres (m³)/year MMCFD* %<br />
< 2.0 < 200 0<br />
2.0 – 3.5 200 – 350 1<br />
3.5 –5.0 350 – 500 2<br />
> 5.0 > 500 3<br />
* assumes 35.3 cubic feet (CF) = 1 m³ (cubic metre)<br />
Royalty on <strong>Gas</strong> Fields - Other Onshore Areas<br />
Increments of Annual Gross<br />
Production<br />
Royalty Rate<br />
Billion m³ /year MMCFD* %<br />
< 1.0 < 100 0<br />
1.0 – 2.5 100 – 250 1<br />
2.5 –5.0 250 – 500 2<br />
> 5.0 > 500 3<br />
* assumes 35.3 cubic feet = 1 cubic metre<br />
9
Profit Shar<strong>in</strong>g<br />
Profit Shar<strong>in</strong>g <strong>Gas</strong><br />
Increments of Annual Gross Production<br />
(Million cubic<br />
metres/year)<br />
MMCFD*<br />
Allocable<br />
Rema<strong>in</strong>der<br />
<strong>Gas</strong> (%)<br />
< 0.3 < 48.37 98<br />
0.3 – 0.6 48.37 – 96.75 96<br />
0.6 – 1.2 96.75 – 145.13 94<br />
1.2 – 1.8 145.13 – 193.50 90<br />
1.8 – 2.4 193.50 – 290.26 75<br />
2.4 – 3.5 290.26 – 387.01 60<br />
3.5 – 5.0 387.01 – 483.77 50<br />
> 5.0 > 483.77 40<br />
* 1 cubic metre = 35.315 cubic feet<br />
10